 Mengxin Sun
- 1State Key Laboratory of Desert and Oasis Ecology, Xinjiang Institute of Ecology and Geography, Chinese Academy of Sciences, Urumqi, China
- 2University of Chinese Academy of Sciences, Beijing, China
Introduction: Understanding spatial and temporal variations in ecosystem service values (ESV) and their driving factors is essential for effective management and decision-making. This study focuses on the Tarim River Basin, specifically the Aksu, Yarkant, Hotan, and Kaidu Peacock Rivers, and the mainstream Tarim River, which flow through key administrative regions.
Methods: We analyzed multi-temporal land use and land cover (LULC) data from 2000, 2005, 2010, 2015, and 2020, applying the comparable coefficient method to assess ESV changes and their spatial distribution. Geospatial analysis was used to identify the key drivers of ESV and their interactions.
Results: (1) The land use pattern in the study area has remained stable, with fluctuations driven by government policies and climate change. Farmland expanded by over 10% from 2000 to 2015, but its growth slowed between 2015 and 2020 due to the “Grain for Green” policy. Built-up areas grew significantly between 2005 and 2010 but declined afterward due to stricter urban planning. Glaciers have reduced in area, though their meltwater contributed to the increase in water bodies and wetlands. (2) ESV increased by 99.34 billion, with grasslands and water bodies contributing 60% and 10%, respectively. ESV peaked in 2015 due to wetland and water body expansion, but declined as wetlands shrank and glaciers retreated. (3) Key natural drivers of ESV include vegetation health (NDVI), proximity to water bodies, and precipitation, while socioeconomic factors like GDP have grown in influence. Interactions between climate and socioeconomic development complicate the dynamics of land use and ESV.
Discussion: The results indicate that while government policies and climate change significantly influence land use and ESV in the Tarim River Basin, socioeconomic factors are increasingly impactful. The complex interactions between climate and socioeconomic development have important implications for ecosystem management and decision-making. This highlights the need to consider both natural and socioeconomic drivers in land use planning and ecosystem service management.
1 Introduction
Ecosystem services (ES) refer to the ecological characteristics, functions, or processes that directly or indirectly contribute to human wellbeing (Costanza et al., 1997; Assessment, 2001; Costanza et al., 2017). Ensuring the sustainable provision of ecosystem services is crucial for meeting the requirements of sustainable development. This necessitates assessing the importance of these services and understanding how various natural, socioeconomic, and climatic factors influence them and their values, which has been instrumental in the advancement of this fields (Luederitz et al., 2015; Bryan et al., 2018). A comprehensive understanding of ecosystem services, their significance, and the identification of the factors and interrelationships among them are fundamental prerequisites for the effective management of socio-environmental systems and the development of policies aimed at improving human wellbeing (Falconí-López et al., 2024; Nesbitt et al., 2017; Liu et al., 2024).
Since the introduction of the initial equivalence factor evaluation method by Costanza et al. (1997), it has been widely applied in the valuation of ecosystem services (ESV) as evidenced by studies conducted by Jiang et al. (2020) and Yu et al. (2023). This method facilitates the comparison and integration of diverse ESV within a unified framework, thereby supporting policy formulation, management strategies, and enhancing public engagement and awareness (Daily et al., 2000). However, despite efforts by Xie et al. (2017) to enhance and refine this method by incorporating varied literature and biomass data to develop a more suitable equivalent factor table for China, the values of ecological services provided by ecosystems can exhibit regional and temporal variations, leading to fluctuations in their valuation. Consequently, ecological indicators such as net primary productivity, precipitation, crop yields, and prices have been employed to adjust the equivalence factors, as proposed by Liu et al. (2023).
Variations in the valuation of ecological services are impacted by a range of factors, encompassing both natural and socio-economic elements (Li et al., 2023; Bi et al., 2023). Geoprobes, as opposed to conventional linear regression or geographically weighted regression methods, offer advantages such as the capacity to address endogeneity concerns, handle both quantitative and qualitative data, and identify interrelationships among various factors (Zhang et al., 2024). For instance, Zhu et al. (2020) examined the influence of natural and human-induced factors on NDVI fluctuations in the middle section of the Heihe River Basin utilizing geoprobes, aiding in the forecasting of vegetation alterations in response to forthcoming environmental shifts (Yang et al., 2023). Similarly, Zhang et al. (2023) conducted research on alterations in ESV within the Central Water Supply Zone of the South-to-North Water Diversion initiative from 1991 to 2020 employing Geographical Detector methodologies. Gao et al. (2021) explored the principal factors affecting ecosystem services due to human interventions. Previous studies have rarely delved into how ESV from diverse ecosystem categories are influenced by distinct factors. Hence, there exists an urgent need to investigate the relationship between ESV in varied ecosystem types and the underlying natural and socio-economic determinants.
Ecosystems located in arid regions have garnered significant interest due to their vulnerability and importance. The Tarim River Basin, as a representative arid zone, plays a critical role in maintaining the ecological balance and driving socio-economic progress in the area through the management and utilization of water resources. Currently, the primary surface water sources within the Tarim River Basin consist of the Aksu River, the Yarkant River, the Hotan River, the Kaidu Peacock River, and the Tarim River (Wang et al., 2020). These rivers collectively establish a drainage system characterized by a “four sources and one trunk” pattern. The ecological service value of the “Four Sources and One Stem” region is crucial for local socio-economic development and ecological conservation (Xu et al., 2020). To assess the effectiveness of ecological water transfer projects and promote sustainable water resource management, it is essential to analyze the area’s ecological service value from 2000 onwards. Although ecological indicators such as primary productivity, precipitation, crop yield, and prices are commonly used as adjustment factors, most studies calibrate ESV using data from a single time point. This limits the accurate assessment of ESV and its response times at specific moments. To address this issue, this study introduces precipitation, Net Primary Productivity (NPP), and the Consumer Price Index (CPI) at corresponding time points as adjustment indicators. By utilizing these time- and region-specific metrics, we are able to more precisely assess the ESV in the Tarim River Basin (TRB), thereby enhancing the accuracy of ecosystem service evaluations. Furthermore, while previous studies have examined variations in ESV within the TRB, few have differentiated between the driving factors of productive land use and natural landscapes. This study distinguishes between natural landscapes and productive land use types within the TRB, exploring how natural, socioeconomic, and management factors influence ecosystem services. This approach provides a new perspective on the dynamic relationship between land use patterns and ESV, offering valuable insights for more effective environmental management. The fundamental aims of this investigation are to examine the transformation of land use and land cover (LULC) within the “Four Sources and One Stem” area between 2000 and 2020, investigate the spatial and temporal fluctuations of ESV across various ecosystem types and service categories within the region, and measure the variables that impact the spatial variation of the total ESV and ESV across various ecosystem categories. This study provides a substantial theoretical framework for the ecological restoration and sustainable management of water resources in watersheds within the designated research area, as well as in comparable arid and semi-arid regions globally.
2 Materials and methods
2.1 Study area
Currently, the Aksu River, Yarkant River, Hotan River, Kaidu Peacock River, and Tarim River in the Tarim River Basin exhibit interconnected surface water flows, forming a drainage system known as the “Four Sources and One Stem” configuration (Qian et al., 2024). The main administrative regions through which these rivers flow was selected as the primary focus of this research study (Figure 1). The mechanism responsible for replenishing water in these river systems is linked to glacial melt and precipitation (Bolch et al., 2022). With growing populations and advancing development, water in ecosystems is increasingly being diverted for agricultural and urban uses. Consequently, this results in a significant deficiency of water resources in the region. Additionally, the diminishing availability of water poses a threat to the local ecology, affecting both wildlife and plant species that depend on these water sources. Effective management strategies are urgently needed to balance the demands of human activities with the sustainability of the natural environment.
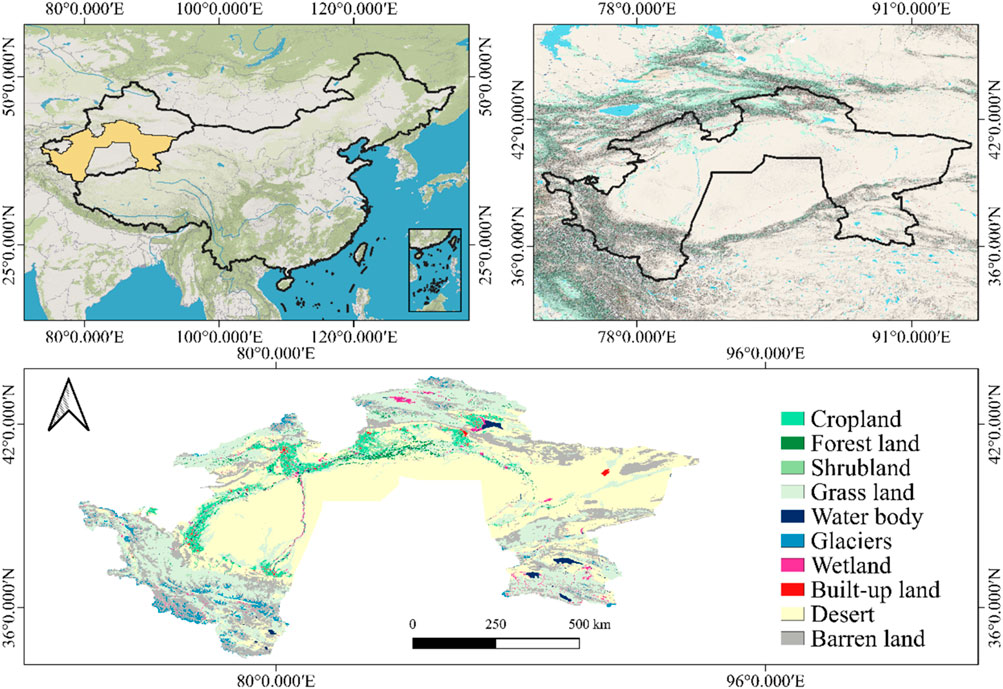
Figure 1. Study area.
2.2 Data sources and processing
2.2.1 ESV assessment data
The ESV assessment data included land use datasets, grain production, prices, regional GDP, and sown area. The ESV coefficients were also corrected using data from adjusted ESVs such as NPP and precipitation. The LULCs dataset was sourced from the Centre for Resource and Environmental Sciences and Data, affiliated with the Chinese Academy of Sciences. Data on grain production, price, regional GDP, and sown area were gathered from the Xinjiang Statistical Yearbook and the Compilation of Cost and Income Data of National Agricultural Products. NPP data were obtained from MOD17A3HGF NPP product and precipitation data were sourced from the Centre for Resource and Environmental Sciences and Data at the Chinese Academy of Sciences.
2.2.2 Driver data
This study aims to explore the driving mechanisms behind changes in ESV within the region currently characterized by four water sources and one arid area. Nine indicators were selected as explanatory factors. Natural factors include temperature, precipitation, evapotranspiration, DEM, distance to water bodies, and NDVI, while socio-economic factors include GDP, LIGHT, and population density. Temperature, precipitation, ET, LIGHT, DEM, and GDP data were obtained from the Centre for Resource and Environmental Sciences and Data, Chinese Academy of Sciences. Population density data are from world pop and NDVI data are from Terra MODIS NDVI data from the MOD13A3 product, using the maximum value synthesis method to obtain annual NDVI, with all data resampled to 2 km resolution. Data sources and processing are shown in Table 1.
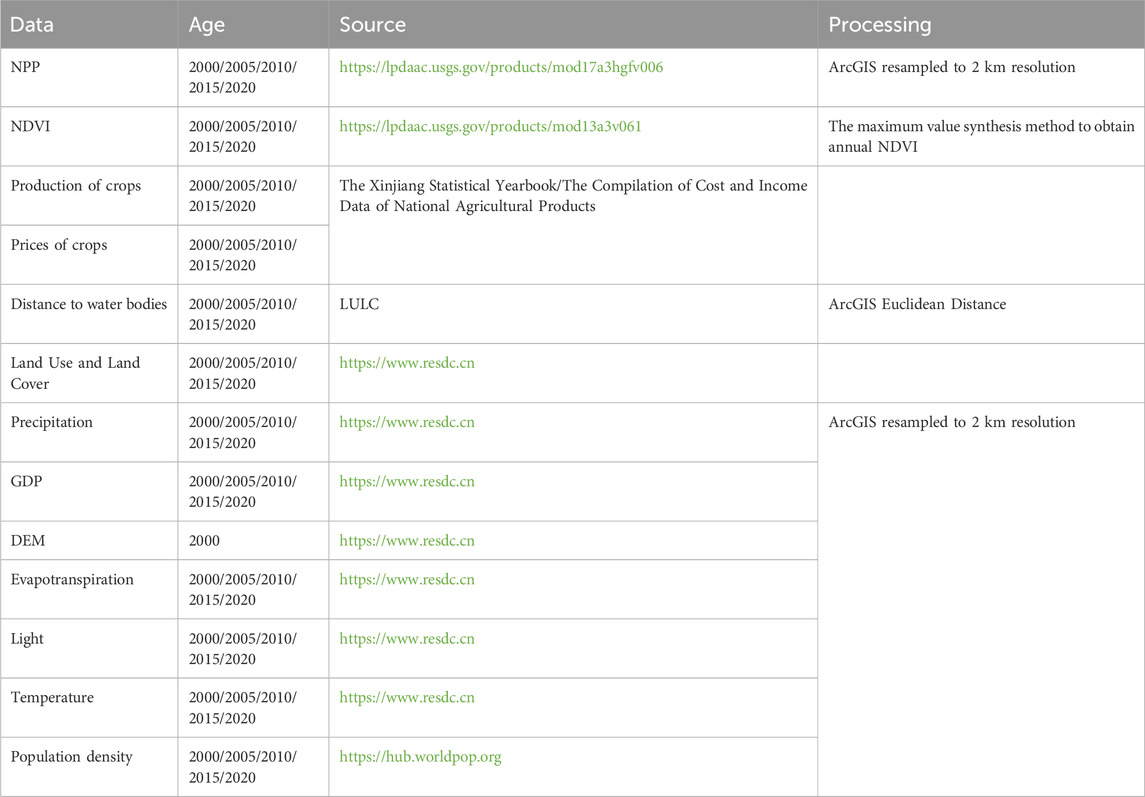
Table 1. Data sources and processing.
2.3 Methods
2.3.1 The LULC evolutionary analysis model
Single dynamic indicator of land use can quantitatively describe the rate of regional land use change (Redo et al., 2012), The formula is as follows:
K refers to a single dynamic degree of LULC, where Ua and Ub represent the areas of a specific LULC type at the start and end dates, respectively, and T indicates the monitoring period.
Aggregate land use dynamics pertain to evaluating the rate and extent of alterations in land use patterns within a defined geographical region over a specified timeframe (Equation 2).
Ks refers to the comprehensive dynamic degree of LULC, where uai and ubi denote the areas of a specific LULC type at the beginning and end of the period, respectively. T indicates the monitoring duration, and n represents the number of LULC types (Pan et al., 2021).
The land cover transfer matrix reflects the dynamic process of conversion between different land use and cover types over a certain period (Muyibul et al., 2018) (Equation 3).
K represents the LULC area, n denotes the number of LULC types, and i and j are the specific LULC types at the beginning and end, respectively.
2.3.2 Estimation of ESV
The economic value of the ESV equivalent factor is 1/7th of the regional average market value of food production per unit area (Lyu et al., 2015) (Equation 4). According to the actual situation of agricultural production in Xinjiang, the economic value of crop output was determined to be 827.57 yuan/hm2, 1,666.73 yuan/hm2, and 2,236.50 yuan/hm2, based on the grain output per unit area and the average grain price in 2000, 2010 and 2020, respectively.
Where VC0 is the standard equivalent factor value (yuan/hm2), i is the crop type, Qi is the average price of the crop (yuan/ton), Pi refers to the crop yield per unit area i (t/hm2), Mi refers to the area i (hm2), and X denotes the total area of food crops (hm2).
To establish region-specific ESV coefficients, average food prices in the study area were adjusted according to the consumer price index (CPI) (Zhao et al., 2022) (Equation 5).
Where VC is the adjusted standardized equivalent factor value (yuan/hm2), CPIn is the year-on-year CPI in 2020; and CPIi is the year-on-year CPI in year i.
2.3.3 Revision of the ecosystem services value equivalence scale
In this study, we determined the ESV equivalent factors for Xinjiang. Specifically, we adopted dryland values for the cropland equivalent factor, the average values of coniferous, mixed coniferous, and broadleaf forests for woodland, and the average values of grassland, scrub, and meadow for grassland. While much existing literature utilizes the equivalence factors proposed by Xie et al. (2017) these factors were derived from average values across China. Direct adoption of these coefficients may lead to inaccurate estimations, as they do not account for ecosystem heterogeneity in the study area (Equations 6, 7). Therefore, we adjusted the service functions related to food production, raw material production, gas regulation, climate regulation, environmental purification, nutrient cycling maintenance, biodiversity conservation, soil conservation, and aesthetic landscape provision using NPP data. Additionally, water supply and hydrological regulation service functions were adjusted using precipitation data (Bao et al., 2023).
Where Ft’ is the corrected value equivalent per unit area factor for land use type i, Fij’ is the corrected value equivalent per unit area factor for ecological services of type j for land use type i, Pij is the spatial-temporal adjustment factor for NPP, Rij is the spatial-temporal adjustment factor for precipitation, and Fij is the value equivalent per unit area factor for ecological services of type j for land use type i initially factor.
The NPP spatiotemporal adjustment factor was calculated as follows (Equation 8):
where Bi is the net primary productivity of vegetation; B is the net primary productivity of vegetation at the national scale (Su et al., 2020).
Spatial and temporal modifiers of precipitation (Equation 9):
where Wi is the average precipitation in the study area; W is the national-scale average precipitation (Zhai et al., 2023).
2.3.4 Constructing an ecosystem service valuation model
In this study, with reference to the existing research results (Fei et al., 2018; Hu et al., 2019), we constructed an ESV assessment model. The Equation 10 is as follows:
The ESV for 2000, 2005, 2010, 2015, and 2020 was calculated by integrating these components (Han et al., 2021). The ESV was computed using factors from 2000, 2005, 2010, 2015, and 2020, along with adjusted standard equivalent factor values.
2.3.5 Drivers of ESV spatial heterogeneity analysis
Geodetector includes factor, interaction, risk, and ecological detection modules. We utilized the factor and interaction detector modules to explore the main drivers of spatial heterogeneity in ecological risk indices across regional landscapes. (Wang et al., 2010; Wang H. et al., 2021) (Equation 11). The expressions for differential and factorial detection are as follows:
q Denotes the extent to which the driver explains the ESV. L is the stratification of the ESV or driver, N is the sample size, and σ2 denotes the variance of the ESV.
The interaction test assesses whether the interaction of factors m1 and m2 increases or decreases the contribution of the dependent variable Y (Wei et al., 2023). In particular, it compares the relative magnitudes of q (m1), q (m2), and q (m1∩m2), and its results can be categorized into five groups, as shown in Table 2.
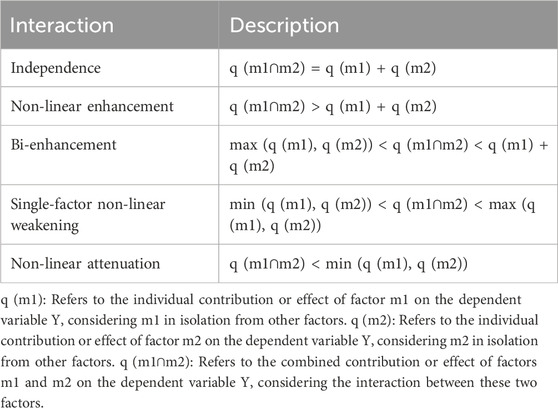
Table 2. Interaction classification.
We proposed three categories of nine drivers from the perspectives of climatic, natural, and socio-economic factors (Zhang et al., 2023): (1) Natural environment drivers: DEM (Digital Elevation Model), distance to the river, NDVI (Normalised Vegetation Index), climatic drivers: temperature (TEM), precipitation (PRE). (2) Socio-economic factors: GDP, LIGHT, population density (PD). The extent to which each driver explains ESV is then calculated.
2.3.6 Spatial autocorrelation on Moran’s index
Moran’s index is a statistical method used to measure the distribution pattern of spatial data, commonly employed to study the clustering or dispersion of spatial phenomena. In this study, Moran’s index is applied to evaluate the spatial heterogeneity of ESV (Moran, 1950). The Equation 12 is as follows:
In the formula for Moran’s index, N represents the number of spatial units. The term Wij refers to the spatial weight between units iii and j, which reflects the degree of spatial relationship or proximity between them. The variables xi and xj represent the values of the variable of interest (in this case, ESV) for units i and j, respectively. ¯x is the mean value of the variable across all spatial units, and W is the sum of all spatial weights, which accounts for the total spatial connectivity in the study area.
To assess the statistical significance of the Moran’s I statistic, the Z-score (Z(I)) is calculated using the following Equation 13:
where E(I) is the expected value of I: E(I) = −1/(n −1), and √Var(I) is the expected variance of I: √Var(I) = E(I2)-E(I)2.
3 Results
3.1 Land-use dynamics
The study results highlighted the dynamics of land use and the stability of its ecological structure within the study area. Overall, the combined land use dynamics from 2000 to 2020 were low, at 0.71%, the largest fluctuation occurred between 2015 and 2020, with a change of 0.32%, followed by the period from 2005 to 2010, which also saw a change of 0.32%. (Figure 2; Table 3), indicating a stable ecological structure. Specifically, significant expansions in built-up land and arable land have occurred since 2020, with a dynamic degree of 5.20% for built-up land and dynamic degree of 2.97% for arable land, reflecting increased human activity and agricultural development. The largest increase in total arable land occurred during the period from 2000 to 2015, with increases of 17.88%, 17.55%, and 13.43% every 5 years, respectively. The expansion of arable land was primarily driven by the conversion of grasslands and deserts, with the proportions of arable land converted from grasslands and deserts being 58.99% and 18.39%, respectively. Simultaneously, a small portion of arable land (9.25%) has undergone restoration to woodland and grassland, indicating some degree of ecological recovery. Built-up land expanded significantly between 2005 and 2010, increasing by 2,056.43 square kilometers, primarily through the conversion of desert (63.88%) and arable land (29.62%). However, the growth of built-up land was relatively slow between 2000 and 2005 and between 2010 and 2025, with increases of 123.20 and 209.23 square kilometers, respectively. Notably, there was even a negative growth in built-up land between 2015 and 2020. Wetlands experienced a slight increase over the 20-year period, with a dynamic degree of 0.95%. These increases primarily occurred between 2005 and 2010 and were largely driven by the conversion of grasslands, which accounted for 49.60% of the newly formed wetlands. Changes in forest land were minimal, with a negligible change of −0.01%, while grassland saw a decrease of 49,707.27 square kilometers due to degradation to bare land and desert. However, the total area of grassland slightly increased, with a dynamic degree of 0.06%, attributed to the conversion of large areas of desert and bare land into grassland. Notably, glaciers experienced a significant reduction, decreasing in area by 54.56%, predominantly converting to bare ground (69.57%) (Tables 4, 5; Figures 3, 4).
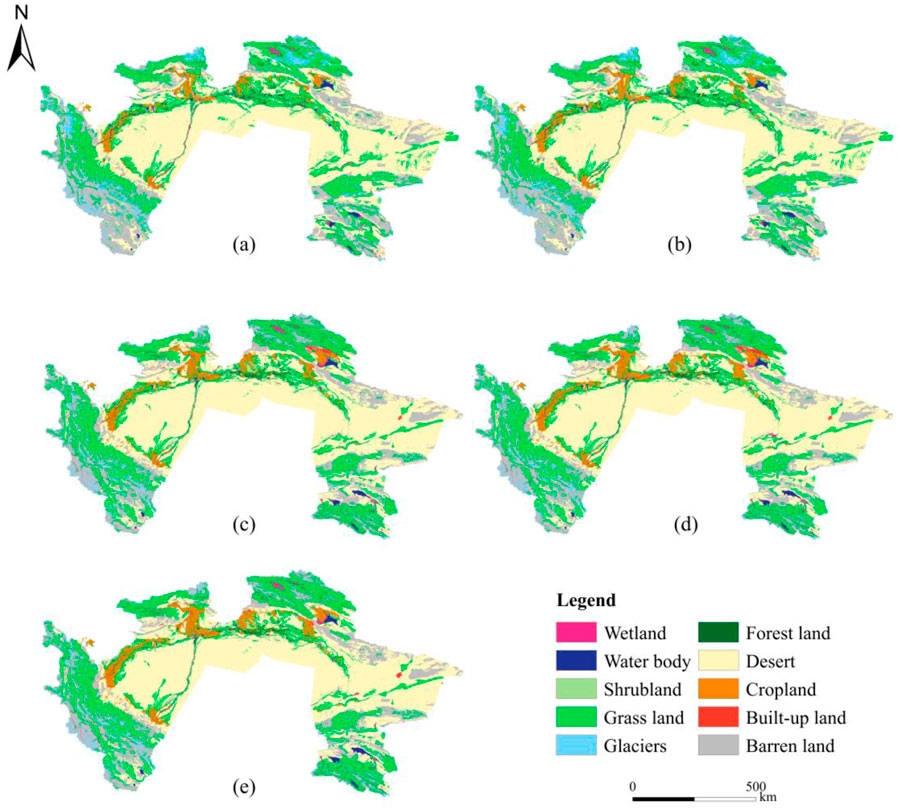
Figure 2. LULC maps of the study area from 2000 to 2020. [(A) LULC in 2000, (B) LULC in 2005, (C) LULC in 2010, (D) LULC in 2015, (E) LULC in 2020].
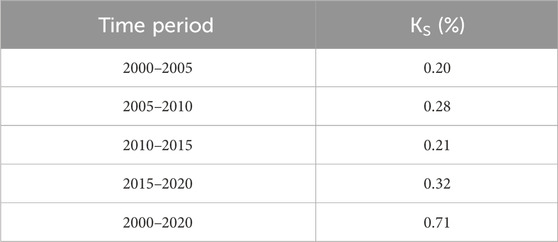
Table 3. LULC comprehensive dynamics in study area from 2000 to 2020(%).
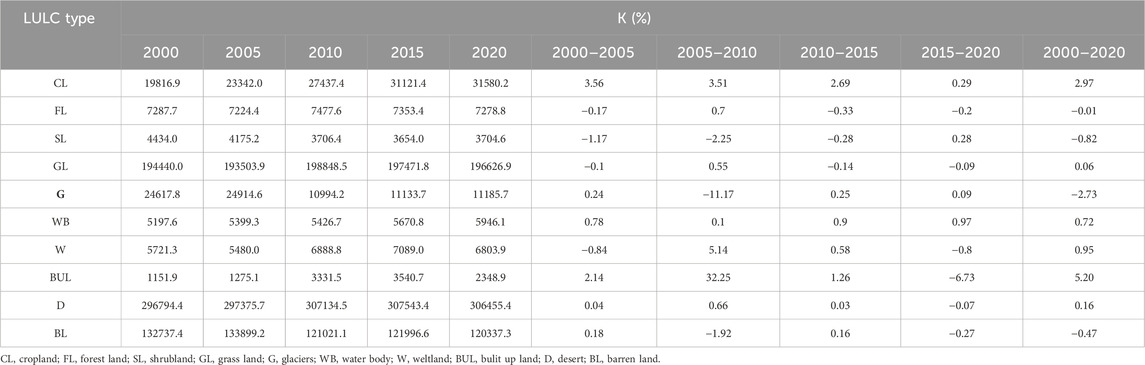
Table 4. Land use and cover change from 2000 to 2020.
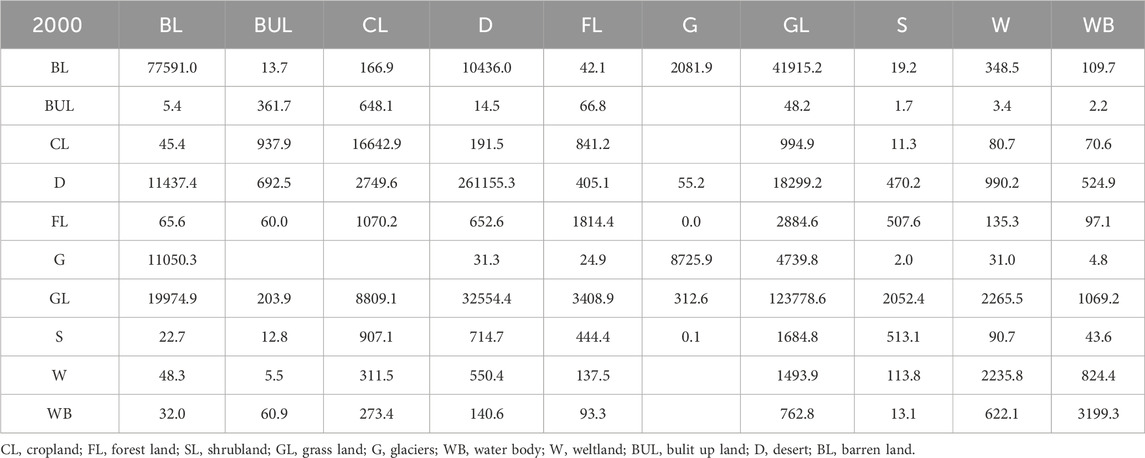
Table 5. LULC transition matrix in study area from 2000 to 2020 (km2).
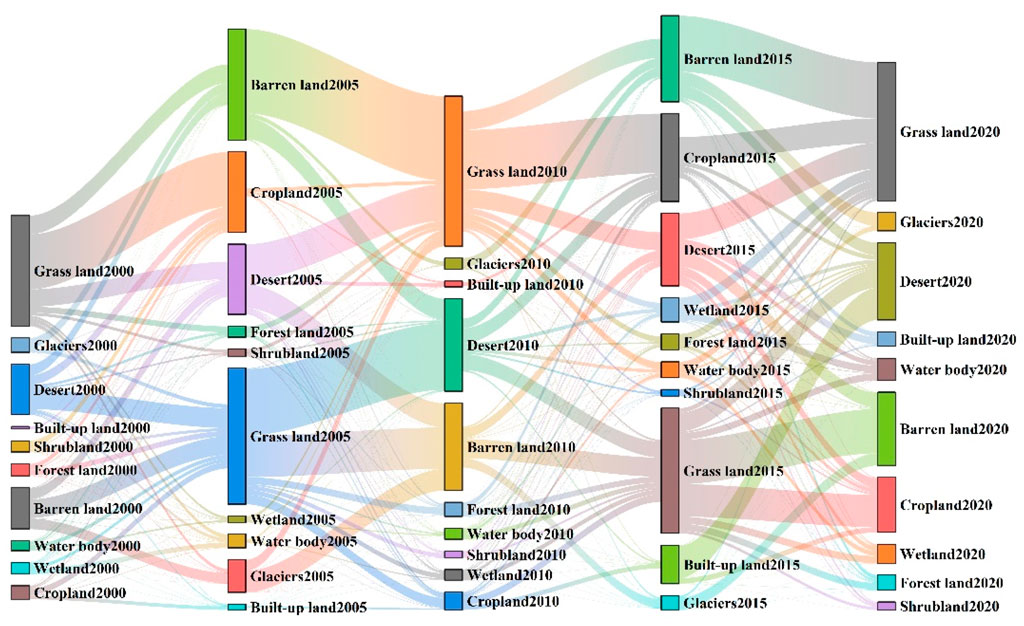
Figure 3. Transition of LULC in the Tarim River Basin from 2000 to 2020.
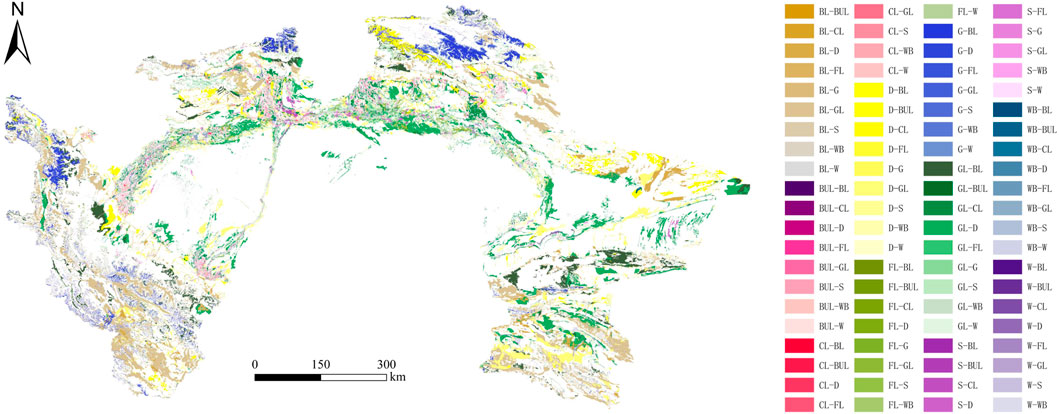
Figure 4. Spatial distribution of LULC in the study area from 2000 to 2020. Note: CL: Cropland, FL: Forest land, SL: Shrubland, GL: Grass land, G: Glaciers, WB: Water body, W: Weltland, BUL: Bulit up land, D: Desert, BL: Barren land.
These results illustrate the intricate transformation of land use patterns in the study area over the observed period. Notably, there has been a substantial increase in arable land and built-up areas, driven by intensive human intervention and rapid agricultural expansion. Concurrently, the evolution of natural ecosystems has facilitated the expansion of water bodies and wetlands, likely influenced by increased meltwater from snow and glaciers. These changes underscore the profound impacts of transitions in land use patterns on ecosystem stability, while highlighting the distinct ecological dynamics and characteristics inherent to each region.
3.2 Economic value of ecosystem services per unit area
Following adjustments to equivalence coefficients, this study calculated the ESV per unit area for different land cover types in the study area in 2000,2005, 2010, 2015 and 2020 (Table 6; Figure 5). Results indicated that the ESV per unit area peaked in 2015, followed closely by 2010, with relatively minor differences between the two periods. In contrast, the lowest ESV per unit area was observed in 2000, showing growth rates exceeding 60% for all land cover types.
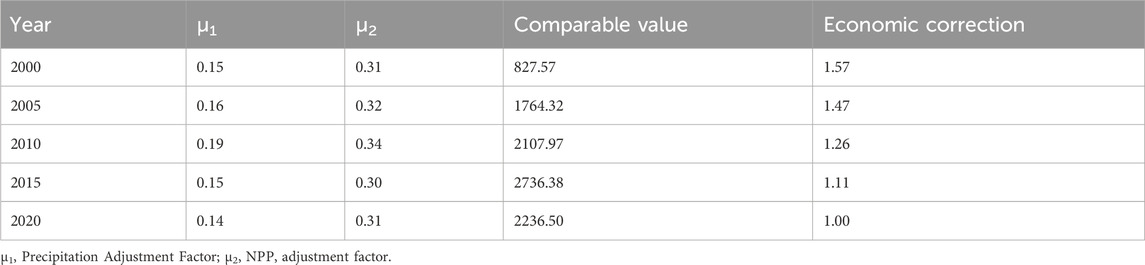
Table 6. Correction factor from 2000 to 2020.

Figure 5. Equivalent factors per unit area for different LULCs from 2000 to 2020. Note: CL, Cropland; FL, Forest land; SL, Shrubland; GL, Grass land; G, Glaciers; WB, Water body; W, Weltland; BUL, Bulit up land; D, Desert; BL, Barren land.
Furthermore, the data highlighted that wetlands and water bodies exhibited significantly higher ESV per unit area compared to other land cover types. This underscores the crucial role of aquatic ecosystems in sustaining ESV in arid and semi-arid regions, emphasizing the need for future policies to prioritize the protection and restoration of these ecologically sensitive areas.
3.3 Estimation of ESV
There is a general upward trend in ESV from 2000 to 2020, with a cumulative increment of 993.40 × 10⁸ yuan. Grassland occupies about 28% of the study area and contributes the most to ESV (60.13%–61.91%), followed by water bodies (10.31%–11.90%), and although desert is the largest in the study area with more than 40% of the area, its contribution to ESV is only the third highest (8.58%–8.71%). The ESV of cropland, woodland, glaciers, shrubs, and bare land accounted for a small percentage (less than 5%) of the total value. In terms of the growth trend of ESV, the fastest growth in ESV was observed in cropland with a growth rate of 169.21%, followed by wetlands (99.28%) and water bodies (89.37%), and only glaciers showed a negative growth (−24.87%). However, between 2015 and 2020, all categories of ESV experienced varying degrees of decline. Glaciers and wetlands exhibited the most significant reductions, decreasing by 21.94% and 21.91%, respectively, followed by water bodies, which diminished by 18.21% (Figure 6).
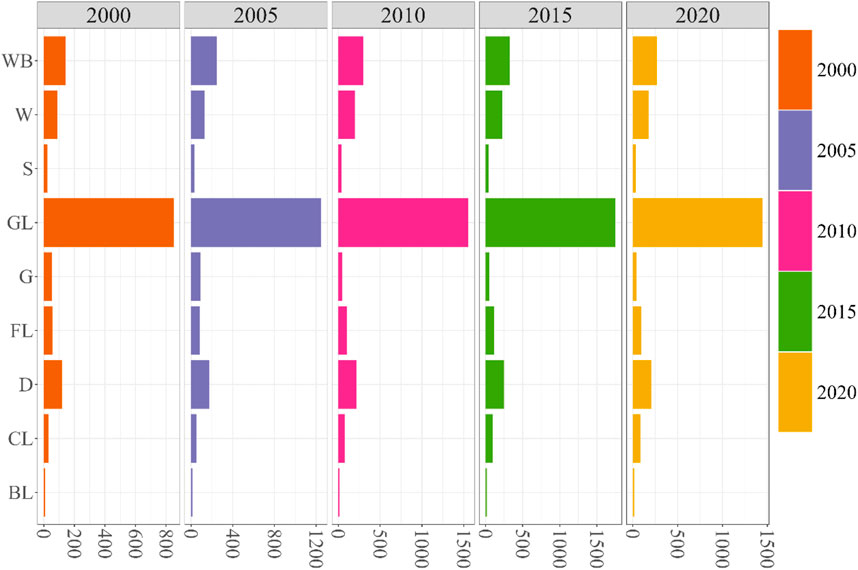
Figure 6. ESV for different LULC in the study area from 2000 to 2020. (108yuan). Note: CL, Cropland; FL, Forest land; SL, Shrubland; GL, Grass land; G, Glaciers; WB, Water body; W, Weltland; BUL, Bulit up land; D, Desert; BL, Barren land.
The ranking of ecological services by value during the study period remained consistent: Climate regulation > Hydrological regulation > Soil conservation > Biodiversity > Environmental purification > Gas regulation > Aesthetic landscape > Raw material production > Food production > Water supply > Hydrological regulation. Aesthetic landscape > Raw material production > Food production > Water supply > Hydrological regulation also maintained their respective positions. However, between 2015 and 2020, the values of all categories of ecological services experienced significant declines. The values of water supply and hydrological adjustment exhibited the largest reductions, decreasing by 22.82% and 22.59%, respectively (Figure 7).
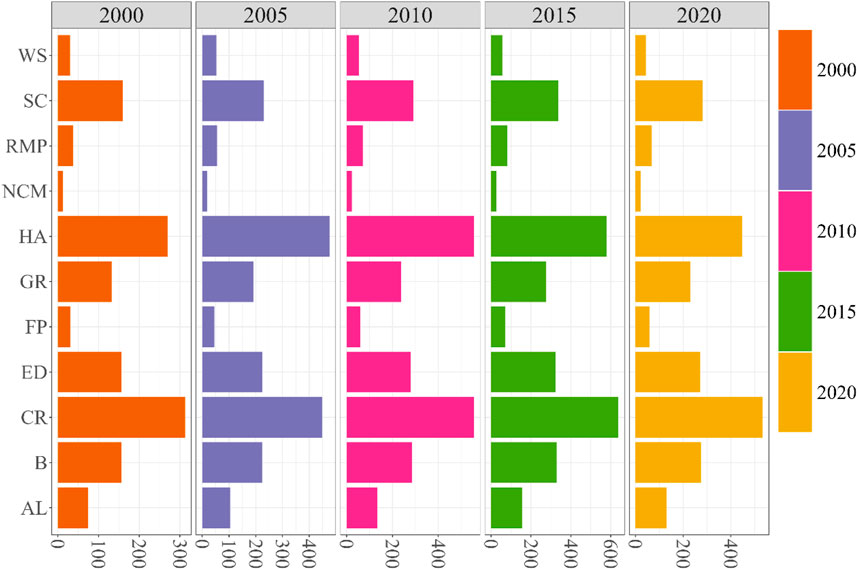
Figure 7. ESV for different LULCs in the study area from 2000 to 2020 (108CNY). Note: WS, Water supply; SC, Soil conservation; RMP, Raw material production; NCM, Nutrients cycle maintenance; HA, Hydrological adjusting; GR, Gas regulation; FP, Food production; ED, Environment depuration; CR, Climate regulation; B, Biodiversity; AL, Aesthetic landscape.
The value of all ecosystem services was classified into four categories: regulatory services, support services, provisioning services, and cultural services. Regulatory services accounted for the highest share of total ecosystem services in the study area (75%), followed by support services (12%). There was a general upward trend in the values of the ecosystem functions in the study area, but there were significant differences between the functions. Of all services, climate regulation (21.65%–22.79%) and hydrological regulation (18.94%–22.99%) account for the largest portion of total ESV (Figure 8).
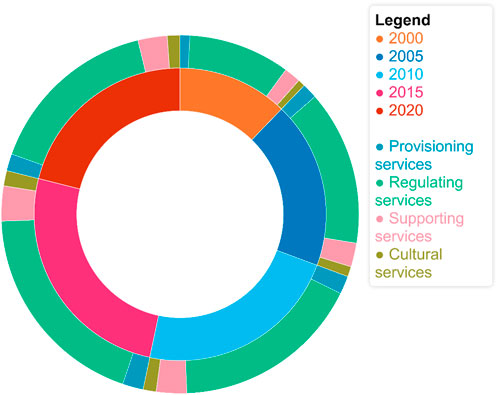
Figure 8. Four different types of ecosystem services from 2000 to 2020.
3.4 Sensitivity analysis
In this study, the accuracy of the ESV coefficients was verified by adjusting the ESVs of the land use types in the study area by about 50% to generate the sensitivity indices for Xinjiang in 2000, 2005, 2010, 2015and 2020 (Table 7). The sensitivity index values for LULCs were below 0.62, with grassland exhibiting the highest sensitivity index, suggesting that ESV in the study area is relatively inelastic. These findings indicate a high level of reliability in this study.
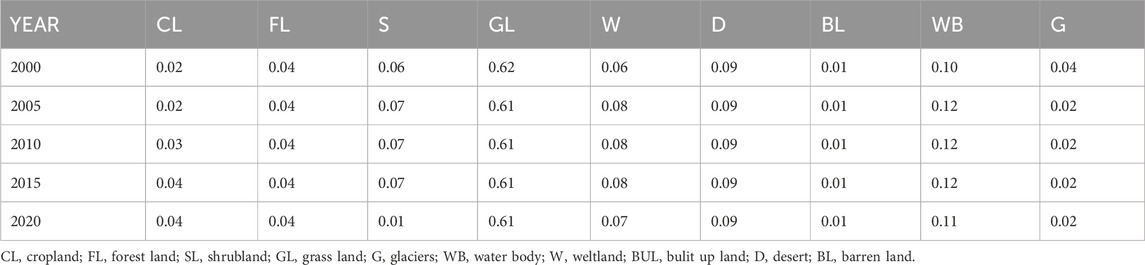
Table 7. The results of a sensitivity test (CS) for ESV.
3.5 Spatial heterogeneity of ESVs at different scales
The selection of appropriate scales for assessment units reveals the spatial differentiation of ESV within the study area. Analyzing ESV spatial distribution across various scales demonstrates that smaller units provide finer spatial resolution. Notably, the ESV distribution at township and county scales differs significantly from that at the grid scale. Global spatial autocorrelation analysis indicates Moran’s I values of 0.853 for 2 km × 2 km units, 0.695 for 10 km × 10 km units, 0.040 for township scales, and 0.076 for county scales. Larger units tend to filter out original differentiation information, resulting in less precise assessments. Consequently, a 2 km × 2 km unit scale was selected for analyzing ESV spatial distribution in the study area, as it passed the significance test. The ESV results in the study area were categorized into five classes using the Natural Breaks method (Figure 9). Over the 20-year period, the spatial distribution of ESV showed minimal changes. Areas with very high and high ESV were primarily located along main stems and around other water sources. Medium ESV areas were dominated by agricultural land and showed expansion. Areas with very low and low ESV corresponded to desert and bare land areas.
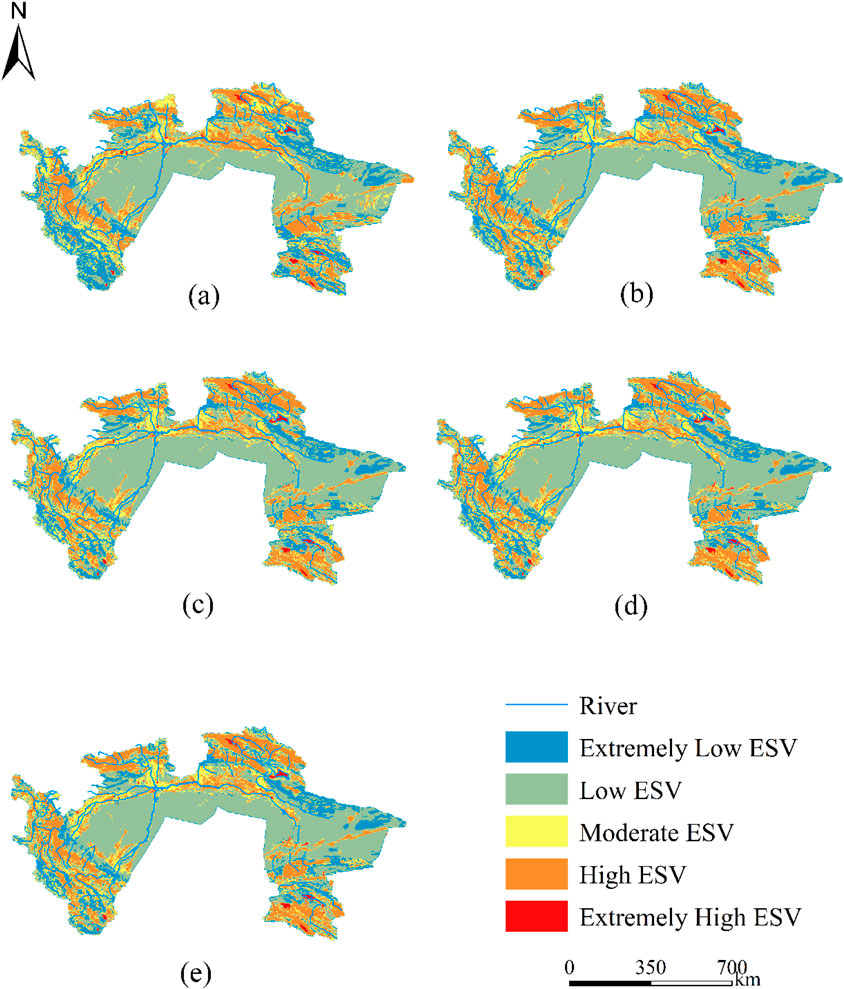
Figure 9. Spatial distribution of ESVs in the study area from 2000 to 2020. [(A) 2000, (B) 2005, (C) 2010, (D) 2015, (E) 2020].
3.6 Driver analysis
We selected the years 2000, 2010, and 2020 for geographic detection analysis to identify the factors influencing the changes in ESV. From Table 8, it can be seen that the three most critical factors affecting ESV in the study area in 2010 and 2020 were NDVI, distance from water bodies, and precipitation, and the most significant drivers in 2001 were NDVI, evapotranspiration and precipitation. In contrast, socioeconomic factors were less significant drivers, all less than 0.1, thus natural factors have been the main factors influencing ESV in the study area. However, due to active development and rapid expansion of human activities, the influence of GDP as a driving force has significantly increased.
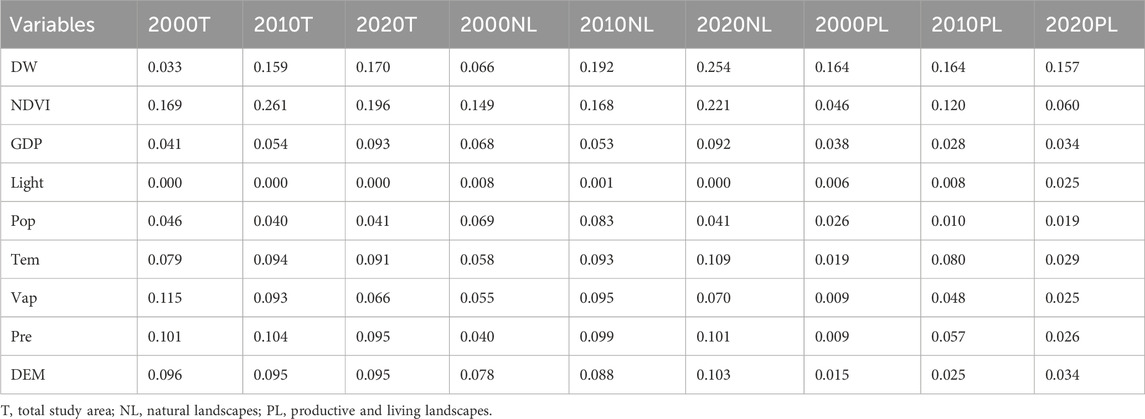
Table 8. The contributions (q statistics) of different factors to ESV variation.
From Figure 10, it can be seen that the interactions of the drivers in each year were nonlinearly enhanced, and the bidirectional interactions between the drivers were all stronger than the single-factor drivers, which verified the reasonableness of the selection of the drivers. In 2000, the most significant interaction was temperature ∩ distance from the water body and (q-value of 0.277), and the most significant one in 2010 was temperature ∩ NDVI (q-value of 0.368)). The most significant driving interaction in 2020 was NDVI ∩ distance from water body (q-value 0.331). The results showed that the three indicators of temperature, NDVI and distance from water body interacted with each other with the most driving force; combined with the results of dispersion factor detection, it can be found that the four driving factors of temperature, precipitation, NDVI and distance from water body interacted with each other with the most influence on ESV in the study area. Probing the study area for interaction factors by dividing it into productive and living landscapes and natural landscapes revealed that the most significant interaction in natural landscapes in 2000 was population density ∩ GDP (q-value of 0.270), but this interaction declined over time (q-value of 0.240 in 2010 and 0.121 in 2020), and that the most significant interaction in both 2000 and 2010 was distance from water bodies ∩ NDVI (q-values of 0.433 and 0.454, respectively), and the most significant interaction in productive and living land was distance from water bodies ∩ NDVI in all the years 2000–2020 (q-values of 0.250, 0.268, and 0.225, respectively) (Figure 11).
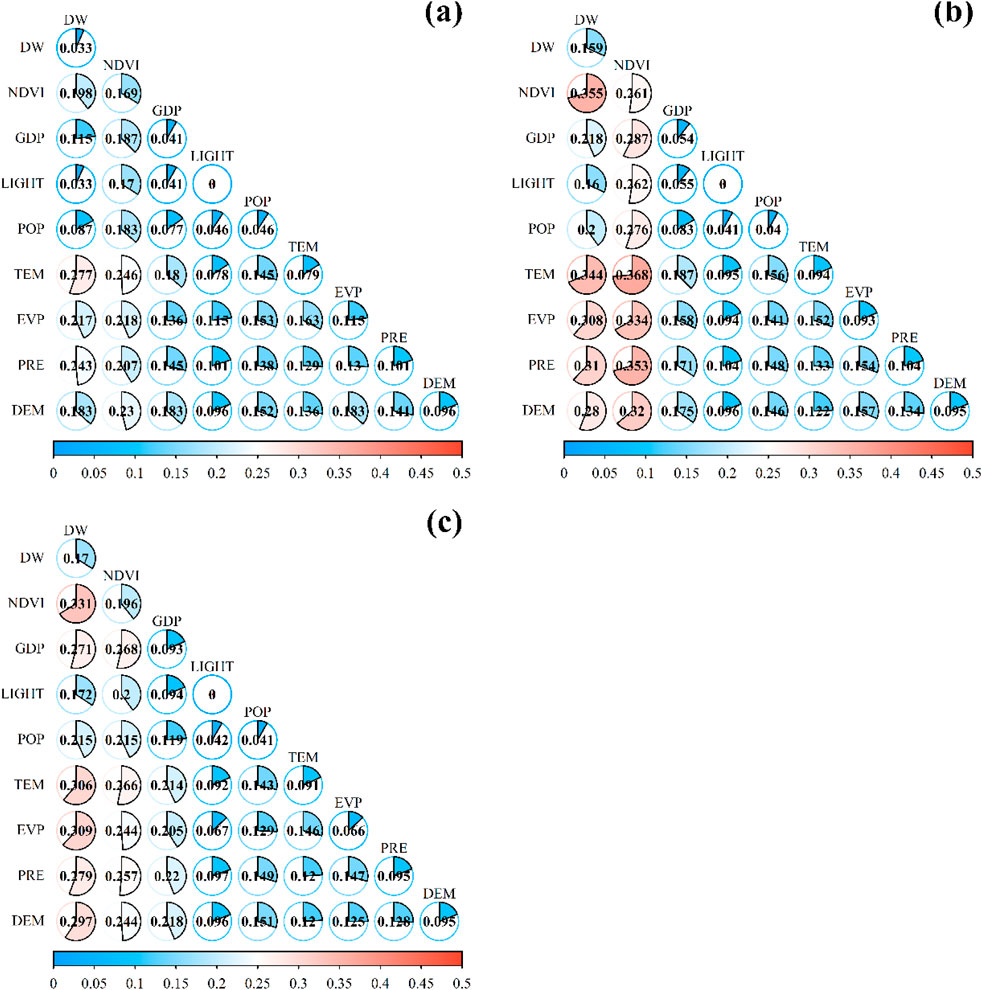
Figure 10. Interactive effects between the factors [(A) 2000, (B) 2005, (C) 2010].
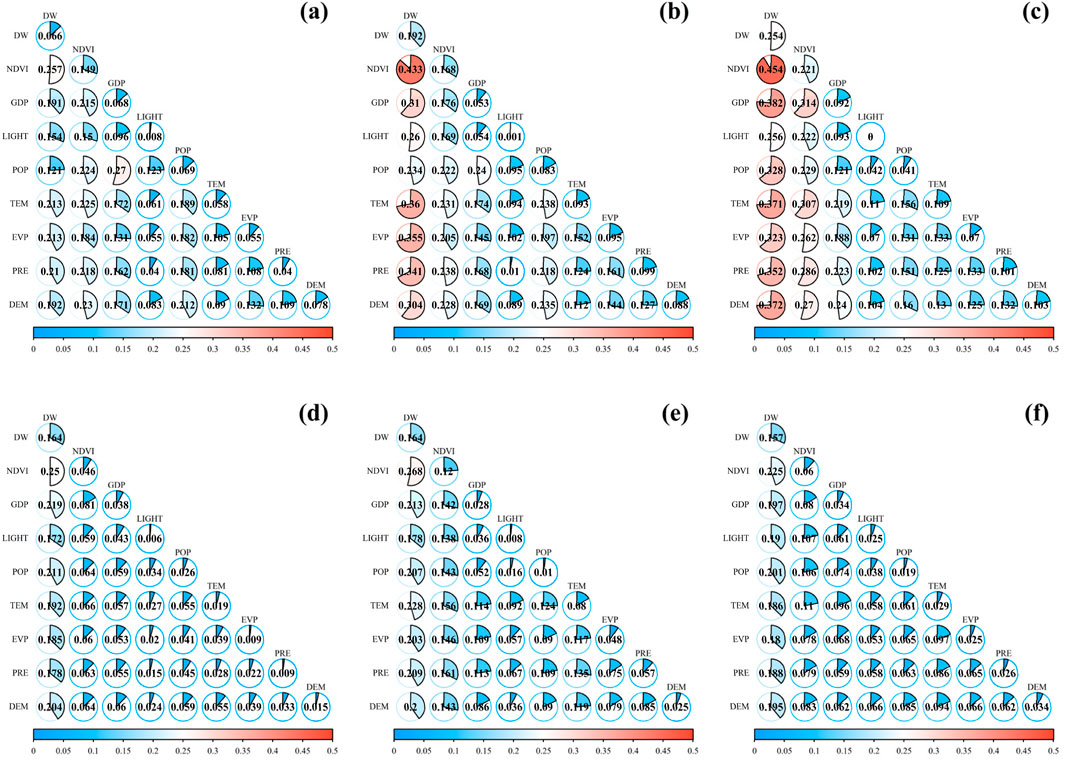
Figure 11. Interactive effects between the factors for different land use types. [(A) 2000 natural landform, (B) 2010 natural landform, (C) 2020 natural landform, (D) 2000 Productive and living land, (E) 2010 Productive and living land, (F) 2020 Productive and living land].
4 Discussion
4.1 Land-use change and evolution mechanisms
From 2000 to 2020, land use dynamics exhibited relatively modest changes, with a variation rate of 0.71% (Table 3), indicating a stable ecological structure consistent with findings in other arid regions (Gong and Liu, 2021). Between 2000 and 2015, the area of arable land experienced rapid growth, increasing by 17.88%, 17.55%, and 13.43% across three consecutive 5-year periods, respectively. This expansion was primarily driven by the conversion of desert and grassland (Table 5) and was largely facilitated through land reclamation and the development of previously unused areas. However, from 2015 to 2020, the growth rate of arable land slowed significantly, registering an increase of only 1.47%. This deceleration aligns with predictions regarding changes in China’s arable land over the past 2 decades, primarily attributed to the implementation of the government-led ‘Grain for Green’ program (Zhou et al., 2021; Wang L. et al., 2021).
The expansion of built-up land occurred in two distinct phases: a period of rapid growth from 2005 to 2010, during which built-up areas increased by 161.27%, followed by relatively slower growth periods (2000–2005: 10.70%; 2005–2010: 6.28%) and a reduction of built-up land area by 33.66% between 2015 and 2020 (Table 5). Between 2005 and 2010, the rapid expansion of built-up land was primarily driven by the conversion of arable land (Figure 5). This significant growth during 2005–2010 was greatly influenced by the Chinese government’s Western Development policy, whereas the subsequent decline was mainly due to urban development policies and stricter urban planning regulations aimed at curbing uncontrolled urban sprawl (Liu et al., 2014). Thus, the expansion and contraction of land for human production and habitation are closely linked to government policies. Specifically, policies related to land protection and resource management play a crucial role in shaping land-use patterns. Policymakers must focus on balancing ecological protection with economic development, prioritizing the preservation of arable land while ensuring the stability of ESV Furthermore, ecological considerations should be integrated into policy formulation.
Among natural land-use types, glaciers underwent significant changes, with their area decreasing by 54.56%, primarily transforming into exposed land (69.57%), consistent with the findings of Liu et al. (2020). The primary driver of glacier melt is climate change (Farinotti et al., 2015; Rounce et al., 2020). Additionally, glacier meltwater serves as a major source of runoff for the Tarim River (Brun et al., 2017). Over the past 20 years, the contribution of glacier meltwater to runoff has led to a moderate increase in water bodies (14.40%) and wetland areas (18.92%) (Table 4). However, the increase in water bodies and wetlands should be approached with caution. While these changes may alleviate water scarcity, the long-term stability of glacier meltwater and its impact on regional water resources require further evaluation. Moreover, as climate change persists, alterations in glacier melt and runoff may have profound effects on ecosystem services, particularly water supply and biodiversity (Cook et al., 2021). Therefore, in managing water resources and ecological protection, policymakers should fully account for the impacts of climate change and adopt adaptive measures to ensure the long-term sustainability of ecosystems.
4.2 ESV assessment
An analysis of ESV in the study area from 2000 to 2020 reveals a consistent upward trend, with a cumulative increase of 993.40 × 10⁸ yuan. This positive trajectory indicates overall growth in ecosystem service contributions, despite fluctuations and areas of concern. Farmland and built-up areas collectively contribute less than 5% to the total ESV. The most rapid growth in ESV occurred in agricultural lands, driven by extensive expansion and advancements in sustainable land use policies and practices. In the natural landscape, grasslands cover approximately 28% of the study area and contribute the most to the ESV, accounting for between 60.13% and 61.91%. Over the past 2 decades, the ESV of grasslands has experienced rapid growth, particularly between 2000 and 2005, with an increase of 46.63%. This growth is closely associated with China’s ecological restoration program initiated in 2000 as part of the “Grain for Green” project, which aims to convert cropland into forests and grasslands (Li et al., 2020). Water bodies are the second-largest contributors, accounting for 10.31%–11.90%, playing a crucial role in maintaining ecological balance in arid regions (Yin et al., 2020). In contrast, deserts, which cover over 40% of the area, contribute relatively little to the ESV, ranging from 8.43% to 8.71%. This highlights the dominance of water bodies and grasslands in the ESV within the Tarim River Basin (Talukdar et al., 2020). Therefore, it is imperative to persist with the “Grain for Green” policy to reinforce the growth of grassland ESV and to enhance the protection of water resources. From 2015 to 2020, all ESV categories experienced a decline. The most significant reductions were observed in glaciers (−21.94%), followed by wetlands (−21.91%) and water bodies (−18.21%). These declines are primarily attributed to the expansion of water bodies and wetlands in 2015, which created favorable conditions for plant growth in surrounding areas, leading to a peak in ESV in 2010 (Yao et al., 2022; Li C et al., 2021). This underscores the critical role of water resources in determining ESV in arid regions. Policymakers should consider strategies to address ecological challenges arising from water scarcity, such as the ecological water replenishment measures implemented in 2001, which have been instrumental in sustaining vegetation growth along riverbanks. Such approaches hold global significance, especially for other arid regions, which should adopt similar measures to mitigate potential drought impacts. Furthermore, over the past 20 years, only the ESV of glaciers has shown a consistent negative trend (−24.87%), likely due to the impacts of climate change, which have diminished glaciers’ capacity to regulate water resources and provide other essential ecosystem services. The rapid melting of glaciers could affect local water supplies and freshwater ecosystems, while wetland degradation reduces their ability to filter pollutants and store carbon, exacerbating issues related to climate change and water quality (Moomaw et al., 2018; Geist, 2011).
Categorizing ecosystem services into regulating services (75%), supporting services (12%), provisioning services, and cultural services highlights the predominance of regulating services such as climate and hydrological regulation. These services, accounting for 21.65%–22.79% and 18.94%–22.99%, respectively, play crucial roles in ecosystem stability and resilience, aligning with findings from related studies (Song and Deng, 2017). Climate regulation, hydrological adjustment, and soil conservation consistently rank highest, being essential for mitigating the impacts of climate change, managing water resources, and preventing soil erosion (Qiao et al., 2024). This highlights to the world that the increase in water resources resulting from the widespread melting of glaciers is unsustainable.
In the Tarim River Basin, the ESV exhibits significant heterogeneity, particularly in the densely populated production and residential areas (Figures 2, 10). Notably, while the ESV derived from methods such as Costanza et al., 1997 benefit transfer approach provides useful insights, these methods often fail to adequately account for the spatial specificity of ecosystem services and their cumulative effects on specific populations. As pointed out by Kozak et al. (2011), the value of ecosystem services is heavily influenced by local population density and spatial discounting, which can directly affect the perceived value of services in different regions. In arid regions, especially in areas like the Tarim River Basin, varying population densities lead to significant differences in the demand for and value of ecosystem services. The higher dependency on ecosystem services in densely populated production and residential areas may result in an underestimation of their ESV. Therefore, it is crucial to prioritize the protection of ecological environments surrounding these high-density areas, particularly those providing critical ecosystem services for human life and production.
The study emphasizes a significant increase in ESV from 2000 to 2020, reflecting growing recognition and enhancement of these services. Between 2015 and 2020, there was a slight decline in ESV, primarily due to factors such as the reduction in water bodies and wetlands leading to decreased vegetation cover. Therefore, the rational utilization of water resources in arid regions is critical for maintaining ecosystem services (Wang et al., 2022). Overall, for policymakers in arid regions, regulating ESV is essential for understanding changes in ecosystem services across different regions and time periods. Identifying trends in ESV aids in the timely implementation of measures to maintain ecosystem stability.
4.3 Spatial heterogeneity of ESV and its driving mechanisms
Analyses of ESV in the study area from 2000 to 2020 reveal a dynamic interplay between natural and socio-economic drivers. Over these decades, factors such as the Normalized Difference Vegetation Index (NDVI), distance to water bodies, and precipitation consistently emerged as influential, highlighting their critical role in supporting ecosystem services. Notably, in 2010, evapotranspiration replaced distance to water bodies as a top driver, likely due to significant precipitation increases that year. This shift underscores complex interactions between climatic variables and vegetation, necessitating adaptive management strategies responsive to environmental changes. The persistent significance of NDVI, an indicator of vegetation health, underscores its crucial role in sustaining ecosystem services (Riis et al., 2020). Similarly, the recurring impact of precipitation illustrates ESV’s dependence on water availability, crucial for vegetation growth and health (Sun et al., 2017). The prominence of evapotranspiration in 2010 further indicates that precipitation changes significantly influence the water balance, enhancing evapotranspiration’s role in driving ecosystem services. Socio-economic factors, such as GDP, initially less significant in 2000, grew in influence by 2020, reflecting increased human activities’ impact on ecosystems. This shift is attributed to aggressive development and rapid urban expansion. While natural drivers predominated ESV in 2000, by 2020, GDP’s rising influence signifies urbanization’s expanding footprint, industrial growth, and infrastructure development impacting ecosystems (Li X et al., 2021). Urban expansion often leads to habitat loss, fragmentation, and increased pollution, degrading ecosystem services (Rosa et al., 2020). Growing demands for resources like water and energy intensify with city growth, further pressuring natural ecosystems and their services (Olabi and Abdelkareem, 2022; Jianying et al., 2020).
When examining determinants of productive land use over 2 decades, proximity to water bodies, NDVI, and GDP were pivotal factors. However, by 2010, temperature replaced GDP, indicating variable influences and dynamic interactions between economic growth and climate conditions (Smith et al., 2014). For natural landscapes, key factors evolved over time, reflecting broader environmental and socio-economic changes. Significant interactions between temperature, NDVI, and distance to water bodies consistently influenced ESV (Xu et al., 2019; Wang et al., 2023). Further analyses reveal important interaction factors among productive, living, and natural landscapes. In 2000, the most significant interaction within the natural landscape was between population density and GDP, though this interaction diminished over time (He et al., 2022). This decline may stem from economic activities diversifying with development, moving beyond urbanization and industrialization to include renewable energy, green technologies, and sustainable agriculture. These shifts help mitigate direct impacts on natural landscapes, reducing negative interactions between population density and GDP. Consistent interactions between temperature, NDVI, and distance to water bodies underscore ESV’s complexity and sensitivity to natural and human-induced drivers, essential for adaptive land use and conservation strategies.
In summary, integrating natural and socio-economic factors is crucial for developing sustainable land use strategies that mitigate environmental impacts and enhance resilience. Policymakers must balance development goals with sustainable practices, reasonably regulate water resources based on climate detection, maintain the health and stability of green ecological land, and conservation to harmonize development with ecological health.
5 Conclusion
In this study, we analyzed land-use changes over the past 2 decades, quantitatively assessing the ESV of the four major headwater streams and the main stream in the Tarim River Basin using the value equivalent method. Additionally, we employed geo-detector analysis to identify key factors influencing ESV across different land types. The results indicate that, under the influence of relevant policies, land designated for human production and habitation underwent rapid expansion between 2000 and 2015. Subsequently, over the following 5 years, the expansion of arable land slowed, and built-up areas decreased. This trend led to a sustained increase in the ESV of arable land from 2000 to 2020. Future policymaking in arid regions should consider ecological factors more carefully while maintaining basic arable land and economic development, planning land-use layouts prudently to stabilize ESV. Regarding natural land use, the significant melting of glaciers has contributed to the expansion of water bodies and wetlands, primarily driven by climate warming. Although this has resulted in some growth in the ESV of water bodies and wetlands, the ESV of glaciers has continued to decline. Over the study period, the total ESV showed an upward trend, peaking in 2015, followed by a slight decline due to abundant water resources in 2015. Moving forward, greater emphasis should be placed on monitoring climate change and allocating water resources appropriately based on climatic conditions. This involves balancing water use for production and living needs with the maintenance of ecological vegetation growth. For instance, ecological water replenishment measures Basin should be carefully adjusted in terms of timing, method, and volume, considering annual precipitation, temperature, and other climatic factors. The analysis of ESV in the study area from 2000 to 2020 highlights the complex interactions between natural and socio-economic drivers, offering significant insights for land-use and ecosystem management. Key natural factors such as NDVI, precipitation, and evapotranspiration have played critical roles in shaping ESV dynamics, particularly in terms of vegetation health and water availability. Over time, socio-economic drivers, including GDP and urbanization, have had an increasing impact on ecosystem services, emphasizing the growing influence of human activities on natural landscapes. The shifting importance of temperature and economic growth reflects the evolving nature of these interactions, necessitating adaptive management strategies that account for both climate change and human development. Therefore, the findings of this study are not only of great importance for land-use and ecosystem management in the Tarim River Basin but also provide valuable references for the conservation and management of other arid regions and similar ecological environments.
Data availability statement
The original contributions presented in the study are included in the article/supplementary material, further inquiries can be directed to the corresponding author.
Author contributions
MS: Methodology, Software, Writing–original draft, Writing–review and editing. XS: Data curation, Software, Validation, Writing–review and editing. HX: Conceptualization, Writing–review and editing. AS: Conceptualization, Writing–review and editing.
Funding
The author(s) declare that financial support was received for the research, authorship, and/or publication of this article. This research was funded by the Preliminary analysis and study on the sealing effectiveness and ecological water quantity of the lower reaches of the Cheerchen River (E3410113).
Conflict of interest
The authors declare that the research was conducted in the absence of any commercial or financial relationships that could be construed as a potential conflict of interest.
Publisher’s note
All claims expressed in this article are solely those of the authors and do not necessarily represent those of their affiliated organizations, or those of the publisher, the editors and the reviewers. Any product that may be evaluated in this article, or claim that may be made by its manufacturer, is not guaranteed or endorsed by the publisher.
References
Bao, J., Wang, W., and Zhao, T. (2023). Spatiotemporal changes of ecosystem service values in response to land cover dynamics in China from 1992 to 2020. Sustainability 15, 7210. doi:10.3390/su15097210
Bi, Y., Zheng, L., Wang, Y., Li, J., Yang, H., and Zhang, B. (2023). Coupling relationship between urbanization and water-related ecosystem services in China’s Yangtze River Economic Belt and its socio-ecological driving forces: a county-level perspective. Ecol. Indic. 146, 109871. doi:10.1016/j.ecolind.2023.109871
Bolch, T., Duethmann, D., Wortmann, M., Liu, S., and Disse, M. (2022). Declining glaciers endanger sustainable development of the oases along the Aksu-Tarim River (Central Asia). Int. J. Sustain. Dev. World Ecol. 29, 209–218. doi:10.1080/13504509.2021.1943723
Brun, F., Berthier, E., Wagnon, P., Kääb, A., and Treichler, D. (2017). A spatially resolved estimate of High Mountain Asia glacier mass balances from 2000 to 2016. Nat. Geosci. 10, 668–673. doi:10.1038/ngeo2999
Bryan, B. A., Ye, Y., and Connor, J. D. (2018). Land-use change impacts on ecosystem services value: incorporating the scarcity effects of supply and demand dynamics. Ecosyst. Serv. 32, 144–157. doi:10.1016/j.ecoser.2018.07.002
Cook, D., Malinauskaite, L., Davíðsdóttir, B., and Ögmundardóttir, H. (2021). Co-production processes underpinning the ecosystem services of glaciers and adaptive management in the era of climate change. Ecosyst. Serv. 50, 101342. doi:10.1016/j.ecoser.2021.101342
Costanza, R., d'Arge, R., de Groot, R., Farber, S., Grasso, M., Hannon, B., et al. (1997). The value of the world's ecosystem services and natural capital. Nature 387 (6630), 253–260. doi:10.1038/387253a0
Costanza, R., De Groot, R., Braat, L., Kubiszewski, I., Fioramonti, L., Sutton, P., et al. (2017). Twenty years of ecosystem services: how far have we come and how far do we still need to go? Ecosyst. Serv 28, 1–16. doi:10.1016/j.ecoser.2017.09.008
Daily, G. C., Söderqvist, T., Aniyar, S., Arrow, K., Dasgupta, P., Ehrlich, P. R., et al. (2000). The value of nature and the nature of value. Science 289, 395–396. doi:10.1126/science.289.5478.395
Falconí-López, A., Mitesser, O., Schaefer, H. M., Blüthgen, N., Busse, A., Feldhaar, H., et al. (2024). Habitat niches of bird species along a recovery gradient in the Chocó tropical forest. Ecol. Indic. 166, 112260. doi:10.1016/j.ecolind.2024.112260
Farinotti, D., Longuevergne, L., Moholdt, G., Duethmann, D., Mölg, T., Bolch, T., et al. (2015). Substantial glacier mass loss in the Tien Shan over the past 50 years. Nat. Geosci. 8, 716–722. doi:10.1038/ngeo2513
Fei, L., Shuwen, Z., Jiuchun, Y., Liping, C., Haijuan, Y., and Kun, B. (2018). Effects of land use change on ecosystem services value in West Jilin since the reform and opening of China. Ecosyst. Serv. 31, 12–20. doi:10.1016/j.ecoser.2018.03.009
Gao, X., Shen, J., He, W., Zhao, X., Li, Z., Hu, W., et al. (2021). Spatial-temporal analysis of ecosystem services value and research on ecological compensation in Taihu Lake Basin of Jiangsu Province in China from 2005 to 2018. J. Clean. Prod. 317, 128241. doi:10.1016/j.jclepro.2021.128241
Geist, J. (2011). Integrative freshwater ecology and biodiversity conservation. Ecol. Indic. 11, 1507–1516. doi:10.1016/j.ecolind.2011.04.002
Gong, B., and Liu, Z. (2021). Assessing impacts of land use policies on environmental sustainability of oasis landscapes with scenario analysis: the case of northern China. Landsc. Ecol. 36, 1913–1932. doi:10.1007/s10980-020-01065-x
Han, X., Yu, J., Zhao, X., and Wang, J. (2021). Spatiotemporal evolution of ecosystem service values in an area dominated by vegetation restoration: quantification and mechanisms. Ecol. Indic. 131, 108191. doi:10.1016/j.ecolind.2021.108191
He, L., Guo, J., Jiang, Q., Zhang, Z., and Yu, S. (2022). How did the Chinese Loess Plateau turn green from 2001 to 2020? An explanation using satellite data. Catena 214, 106246. doi:10.1016/j.catena.2022.106246
Hu, M., Li, Z., Wang, Y., Jiao, M., Li, M., and Xia, B. (2019). Spatio-temporal changes in ecosystem service value in response to land-use/cover changes in the Pearl River Delta. Resour. Conserv. Recycl. 149, 106–114. doi:10.1016/j.resconrec.2019.05.032
Jiang, W., Lü, Y., Liu, Y., and Gao, W. (2020). Ecosystem service value of the Qinghai–Tibet Plateau significantly increased during 25 years. Ecosyst. Serv. 44, 101146. doi:10.1016/j.ecoser.2020.101146
Jianying, X., Jixing, C., and Yanxu, L. (2020). Partitioned responses of ecosystem services and their tradeoffs to human activities in the Belt and Road region. J. Clean. Prod. 276, 123205. doi:10.1016/j.jclepro.2020.123205
Kozak, J., Lant, C., Shaikh, S., and Wang, G. (2011). The geography of ecosystem service value: the case of the Des Plaines and Cache River wetlands, Illinois. Appl. Geogr. 31, 303–311. doi:10.1016/j.apgeog.2010.07.001
Li, Y., Liu, W., Feng, Q., Zhu, M., Yang, L., Zhang, J., et al. (2023). The role of land use change in affecting ecosystem services and the ecological security pattern of the Hexi Regions, Northwest China. Sci. Total Environ. 855, 158940. doi:10.1016/j.scitotenv.2022.158940
Li, Z., Sun, X., Huang, Z., Zhang, X., Wang, Z., Li, S., et al. (2020). Changes in nutrient balance, environmental effects, and green development after returning farmland to forests: a case study in Ningxia, China. China. Sci. Total Environ. 735, 139370. doi:10.1016/j.scitotenv.2020.139370
Li C, C., Fu, B., Wang, S., Stringer, L. C., Wang, Y., Li, Z., et al. (2021). Drivers and impacts of changes in China’s drylands. Nat. Rev. Earth Environ. 2, 858–873. doi:10.1038/s43017-021-00226-z
Liu, H., Zhou, G., Wennersten, R., and Frostell, B. (2014). Analysis of sustainable urban development approaches in China. Habitat Int. 41, 24–32. doi:10.1016/j.habitatint.2013.06.005
Liu, J., Pei, X., Zhu, W., and Jiao, J. (2023). Understanding the intricate tradeoffs among ecosystem services in the Beijing–Tianjin–Hebei urban agglomeration across spatiotemporal features. Sci. Total Environ. 898, 165453. doi:10.1016/j.scitotenv.2023.165453
Liu, M., Nie, Z., Liu, X., Wang, L., and Cao, L. (2024). Change in groundwater table depth caused by natural change and human activities during the past 40 years in the Shiyang River Basin, northwest China. Sci. Total Environ. 906, 167722. doi:10.1016/j.scitotenv.2023.167722
Liu, Y., Hou, X., Li, X., Song, B., and Wang, C. (2020). Assessing and predicting changes in ecosystem service values based on land use/cover change in the Bohai Rim coastal zone. Ecol. Indic. 111, 106004. doi:10.1016/j.ecolind.2019.106004
Li X, X., Zhou, Y., Hejazi, M., Wise, M., Vernon, C., Iyer, G., et al. (2021). Global urban growth between 1870 and 2100 from integrated high resolution mapped data and urban dynamic modeling. Commun. Earth and Environ. 2 (1), 201. doi:10.1038/s43247-021-00273-w
Luederitz, C., Brink, E., Gralla, F., Hermelingmeier, V., Meyer, M., Niven, L., et al. (2015). A review of urban ecosystem services: six key challenges for future research. Ecosyst. Serv. 14, 98–112. doi:10.1016/j.ecoser.2015.05.001
Lyu, J., Shen, B., and Li, H. (2015). Dynamics of major hydro–climatic variables in the headwater catchment of the Tarim River Basin, Xinjiang, China. Quat. Int. 380–381, 143–148. doi:10.1016/j.quaint.2014.12.017
Moomaw, W. R., Chmura, G., Davies, G. T., Finlayson, C., Middleton, B. A., Natali, S. M., et al. (2018). Wetlands in a changing climate: science, policy and management. Wetlands 38, 183–205. doi:10.1007/s13157-018-1023-8
Moran, P. A. (1950). Notes on continuous stochastic phenomena. Biometrika 37, 17–23. doi:10.2307/2332142
Muyibul, Z., Jianxin, X., Muhtar, P., Qingdong, S., and Run, Z. (2018). Spatiotemporal changes of land use/cover from 1995 to 2015 in an oasis in the middle reaches of the Keriya River, southern Tarim Basin, Northwest China. Catena 171, 416–425. doi:10.1016/j.catena.2018.07.038
Nesbitt, L., Hotte, N., Barron, S., Cowan, J., and Sheppard, S. R. J. (2017). The social and economic value of cultural ecosystem services provided by urban forests in North America: a review and suggestions for future research. Urban For. Urban Green. 25, 103–111. doi:10.1016/j.ufug.2017.05.005
Olabi, A., and Abdelkareem, M. A. (2022). Renewable energy and climate change. Renew. Sustain. Energy Rev. 158, 112111. doi:10.1016/j.rser.2022.112111
Pan, N., Guan, Q., Wang, Q., Sun, Y., Li, H., and Ma, Y. (2021). Spatial differentiation and driving mechanisms in ecosystem service value of arid region: a case study in the middle and lower reaches of Shule River Basin, NW China. J. Clean. Prod. 319, 128718. doi:10.1016/j.jclepro.2021.128718
Qian, K., Ma, X., Yan, W., Li, J., Xu, S., Liu, Y., et al. (2024). Trade-offs and synergies among ecosystem services in Inland River Basins under the influence of ecological water transfer project: a case study on the Tarim River basin. Sci. Total Environ. 908, 168248. doi:10.1016/j.scitotenv.2023.168248
Qiao, X., Li, Z., Lin, J., Wang, H., Zheng, S., and Yang, S. (2024). Assessing current and future soil erosion under changing land use based on InVEST and FLUS models in the Yihe River Basin, North China. Int. Soil Water Conservation Res. 12, 298–312. doi:10.1016/j.iswcr.2023.07.001
Redo, D. J., Aide, T. M., Clark, M. L., and Andrade-Núñez, M. J. (2012). Impacts of internal and external policies on land change in Uruguay, 2001–2009. Environ. Conserv. 39, 122–131. doi:10.1017/S0376892911000658
Riis, T., Kelly-Quinn, M., Aguiar, F. C., Manolaki, P., Bruno, D., Bejarano, M. D., et al. (2020). Global overview of ecosystem services provided by riparian vegetation. Bioscience 70, 501–514. doi:10.1093/biosci/biaa041
Rosa, I. M., Purvis, A., Alkemade, R., Chaplin-Kramer, R., Ferrier, S., Guerra, C. A., et al. (2020). Challenges in producing policy-relevant global scenarios of biodiversity and ecosystem services. Glob. Ecol. Conservation 22, e00886. doi:10.1016/j.gecco.2019.e00886
Rounce, D. R., Hock, R., and Shean, D. E. (2020). Glacier mass change in High Mountain Asia through 2100 using the open-source Python glacier evolution model (PyGEM). Front. Earth Sci. 7, 331. doi:10.3389/feart.2019.00331
Smith, P., Bustamante, M., Ahammad, H., Clark, H., Dong, H., Elsiddig, E. A., et al. (2014). “Agriculture, forestry and other land use (AFOLU),” in Climate change 2014: mitigation of climate change. Contribution of working group III to the fifth assessment report of the intergovernmental panel on climate change (Cambridge University Press), 811–922.
Song, W., and Deng, X. (2017). Land–use/land–cover change and ecosystem service provision in China. Sci. Total Environ. 576, 705–719. doi:10.1016/j.scitotenv.2016.07.078
Su, K., Wei, D.-z., and Lin, W.-x. (2020). Evaluation of ecosystem services value and its implications for policy making in China–A case study of Fujian province. Ecol. Indic. 108, 105752. doi:10.1016/j.ecolind.2019.105752
Sun, G., Hallema, D., and Asbjornsen, H. (2017). Ecohydrological processes and ecosystem services in the Anthropocene: a review. Ecol. Process. 6, 35. doi:10.1186/s13717-017-0104-6
Talukdar, S., Singha, P., Mahato, S., Praveen, B., and Rahman, A. (2020). Dynamics of ecosystem services (ESs) in response to land use land cover (LU/LC) changes in the lower Gangetic plain of India. Ecol. Indic. 112, 106121. doi:10.1016/j.ecolind.2020.106121
Wang, H., Qin, F., Xu, C., Li, B., Guo, L., and Wang, Z. (2021a). Evaluating the suitability of urban development land with a Geodetector. Ecol. Indic. 123, 107339. doi:10.1016/j.ecolind.2021.107339
Wang, J. F., Li, X. H., Christakos, G., Liao, Y. L., Zhang, T., Gu, X., et al. (2010). Geographical detectors-based health risk assessment and its application in the neural tube defects study of the heshun region, China. Int. J. Geogr. Inf. Sci. 24, 107–127. doi:10.1080/13658810802443457
Wang, L., Zheng, W., Tang, L., Zhang, S., Liu, Y., and Ke, X. (2021b). Spatial optimization of urban land and cropland based on land production capacity to balance cropland protection and ecological conservation. J. Environ. Manag. 285, 112054. doi:10.1016/j.jenvman.2021.112054
Wang, R., Ding, J., Ge, X., Wang, J., Qin, S., Tan, J., et al. (2023). Impacts of climate change on the wetlands in the arid region of Northwestern China over the past 2 decades. Ecol. Indic. 149, 110168. doi:10.1016/j.ecolind.2023.110168
Wang, Y., Zhang, S., Zhen, H., Chang, X., Shataer, R., and Li, Z. (2020). Spatiotemporal evolution characteristics in ecosystem service values based on land use/cover change in the Tarim River Basin, China. Sustainability 12, 7759. doi:10.3390/su12187759
Wang, Z., Guo, J., Ling, H., Han, F., Kong, Z., and Wang, W. (2022). Function zoning based on spatial and temporal changes in quantity and quality of ecosystem services under enhanced management of water resources in arid basins. Ecol. Indic. 137, 108725. doi:10.1016/j.ecolind.2022.108725
Wei, W., Zou, S., Duan, W., Chen, Y., Li, S., and Zhou, Y. (2023). Spatiotemporal variability in extreme precipitation and associated large-scale climate mechanisms in Central Asia from 1950 to 2019. J. Hydrol. 620, 129417. doi:10.1016/j.jhydrol.2023.129417
Xie, G., Zhang, C., Zhen, L., and Zhang, L. (2017). Dynamic changes in the value of China’s ecosystem services. Ecosyst. Serv. 26, 146–154. doi:10.1016/j.ecoser.2017.06.010
Xu, T., Weng, B., Yan, D., Wang, K., Li, X., Bi, W., et al. (2019). Wetlands of international importance: status, threats, and future protection. Int. J. Environ. Res. Public Health 16, 1818. doi:10.3390/ijerph16101818
Xu, Z., Wei, H., Dong, X., Liu, Y., and Xue, H. (2020). Evaluating the ecological benefits of plantations in arid areas from the perspective of ecosystem service supply and demand-based on emergy analysis. Sci. Total Environ. 705, 135853. doi:10.1016/j.scitotenv.2019.135853
Yang, J., Xie, B., Zhang, D., Mak-Mensah, E., and Pei, T. (2023). Habitat quality assessment and multi-scenario prediction of the Gansu-Qinghai section of the Yellow River Basin based on the FLUS-InVEST model. Front. Ecol. Evol. 11, 1228558. doi:10.3389/fevo.2023.1228558
Yao, J., Chen, Y., Guan, X., Zhao, Y., Chen, J., and Mao, W. (2022). Recent climate and hydrological changes in a mountain–basin system in Xinjiang, China. Earth-Science Rev. 226, 103957. doi:10.1016/j.earscirev.2022.103957
Yin, W., Chai, Q., Zhao, C., Yu, A., Fan, Z., Hu, F., et al. (2020). Water utilization in intercropping: a review. Agric. Water Manag. 241, 106335. doi:10.1016/j.agwat.2020.106335
Yu, H., Chen, C., and Shao, C. (2023). Spatial and temporal changes in ecosystem service driven by ecological compensation in the Xin'an River Basin, China. Ecol. Indic. 146, 109798. doi:10.1016/j.ecolind.2022.109798
Zhai, Y., Li, W., Shi, S., Gao, Y., Chen, Y., and Ding, Y. (2023). Spatio-temporal dynamics of ecosystem service values in China’s Northeast Tiger-Leopard National Park from 2005 to 2020: evidence from environmental factors and land use/land cover changes. Ecol. Indic. 155, 110734. doi:10.1016/j.ecolind.2023.110734
Zhang, H., Hu, Z., Zhang, Z., Li, Y., Song, S., and Chen, X. (2024). How does vegetation change under the warm-wet tendency across Xinjiang, China? Int. J. Appl. Earth Obs. Geoinf. 127, 103664. doi:10.1016/j.jag.2024.103664
Zhang, X., Zheng, Z., Sun, S., Wen, Y., and Chen, H. (2023). Study on the driving factors of ecosystem service value under the dual influence of natural environment and human activities. J. Clean. Prod. 420, 138408. doi:10.1016/j.jclepro.2023.138408
Zhao, X., Yi, P., Xia, J., He, W., and Gao, X. (2022). Temporal and spatial analysis of the ecosystem service values in the Three Gorges Reservoir area of China based on land use change. Environ. Sci. Pollut. Res. 65, 26549–26563. doi:10.1007/s11356-021-17827-2
Zhou, Y., Li, X., and Liu, Y. (2021). Cultivated land protection and rational use in China. Land Use Policy 106, 105454. doi:10.1016/j.landusepol.2021.105454
Keywords: ecosystem service value, land use and land cover change, driving factors, spatiotemporal features, Tarim River of Xinjiang
Citation: Sun M, Shen X, Xu H and Shajiang·Aili A (2025) Dynamics of ecosystem service values in the Tarim River Basin. Front. Environ. Sci. 12:1484950. doi: 10.3389/fenvs.2024.1484950
Received: 06 September 2024; Accepted: 30 December 2024;
Published: 03 February 2025.
Edited by:
Christopher Lant, Utah State University, United StatesCopyright © 2025 Sun, Shen, Xu and Shajiang·Aili. This is an open-access article distributed under the terms of the Creative Commons Attribution License (CC BY). The use, distribution or reproduction in other forums is permitted, provided the original author(s) and the copyright owner(s) are credited and that the original publication in this journal is cited, in accordance with accepted academic practice. No use, distribution or reproduction is permitted which does not comply with these terms.
*Correspondence: Hailiang Xu, xuhl@ms.xjb.ac.cn