 Yanli Chen
 Lu Huang
- Guangxi Institute of Meteorological Sciences, Nanning, China
Multi-view real-life images taken by eco-meteorological observation stations can provide high-throughput visible light (RGB) image data for vegetation monitoring, but at present, there are few research reports on the vegetation monitoring effect of multi-view images and its difference from satellite remote sensing monitoring. In this study, with the underlying surface mixed with karst bare rock and vegetation as the research object, the far-view images and near-view images of 4 eco-meteorological stations were used to compare the segmentation effect of machine learning segmentation algorithm on images from far and near views, analyze the vegetation growth characteristics of visible images from far and near views, and investigate the differences between multi-view images and satellite remote sensing monitoring. The results showed that: (1) machine learning algorithm was suitable for green vegetation segmentation of multi-view images. The segmentation accuracy of machine learning algorithm for a near view image was higher than that for a far view image, with an accuracy rate of over 85%. Images captured under weak light conditions could obtain higher vegetation segmentation accuracy, and the proportion of bare rocks had no obvious influence on image segmentation accuracy. (2) The interannual variation trends of vegetation presented by different RGB vegetation indexes varied greatly, and the interannual variation difference of vegetation from a far view was greater than that from a near view. NDYI and RGBVI showed good consistency in vegetation changes from far and near views, and could also better show the interannual differences of vegetation. From the perspective of intra-year variation, various RGB vegetation indexes showed seasonal changes in different degrees. The vegetation in karst areas grew well from April to October, and the RGB vegetation indexes reached the peaks from May to June at most stations. The seasonal distribution of vegetation indexes were more obvious from a far view. (3) There was significant difference in the correlation between ground-based multi-view RGB vegetation indexes and NDVI of different satellites. The correlation with FY3D NDVI was weaker than that with MODIS NDVI. Most RGB vegetation indexes from a far view had a good correlation with MODIS NDVI, and the indexes with significant differences (P < 0.05) accounted for 70.5%. The correlation of most RGB vegetation indexes with FY3D NDVI and MODIS NDVI from a far view was better than that from a near view, and there was a significant difference in the RGB indexes with the highest correlation with NDVI of the 2 satellites from both far and near views in different stations. The machine learning algorithm combined with NLM filtering optimization had great advantages in multi-view image segmentation. Different RGB vegetation indices had different responses to vegetation growth changes, which may be related to the band composition of vegetation index and vegetation morphology and location. The image shooting mode of satellite was closer to the far-view Angle, so the correlation and fitting degree between satellite NDVI and far-view NDVI were higher. The research results provided theoretical basis and technical support for improving the ability of multi-view remote sensing monitoring of vegetation growth in karst ecological station.
Highlights
• Machine learning algorithms are suitable for green vegetation segmentation of ground-based multi-view visible light images obtained at ecological meteorological stations.
• The vegetation indexes of ground-based visible light images from the far view show more significant seasonal variation and interannual difference.
• The ground-based vegetation growth monitoring results from the far view are better consistent with those from the satellite scale.
1 Introduction
In recent years, ecological meteorological observation stations have been widely built, and many of these stations are equipped with multi-view cameras to perform real-life shooting, which makes ground-based multi-view RGB images normalized data. The monitoring objects cover a wide range, including rice, corn, sugarcane and other crops, as well as natural vegetation carriers such as forests and grasslands. As a representative of the application of ground-based remote sensing, multi-view images obtained by ecological meteorological observation stations can overcome the influence of complex weather such as clouds and rain on the image quality to a great extent, and meanwhile, ground-based remote sensing can effectively capture detailed images of ground objects and realize high-throughput time sequence observation of plant growth. As an important part of the space-sky-ground integrated monitoring network, it effectively makes up for the shortcomings of satellite remote sensing and unmanned aerial vehicle remote sensing.
The image data obtained by carrying a visible light (RGB) camera system under facility conditions can effectively monitor vegetation growth information (Zhao et al., 2021), including growth period (Liu et al., 2020; Lu et al., 2011; Wu, 2014; Wu et al., 2018), coverage (Campillo et al., 2008; Purcell, 2000; Yang et al., 2018), growth (Han et al., 2019; Zhou et al., 2015) and nitrogen (Chen et al., 2017; Shi et al., 2020), and the research objects are mainly crops and pasture. The basis and premise of quantitative monitoring and evaluation of vegetation based on multi-view RGB images segmentation refers to the division of images containing complex spatial distribution information into different regions with specific semantic labels (Min et al., 2020), such as vegetation and soil. At present, many image segmentation methods have been developed, such as region (Liu et al., 2021), feature space clustering (Li et al., 2020), edge detection (Ren et al., 2004), histogram thresholding (Chen et al., 2011) and fuzzy technique (Ma et al., 2008). With the rapid development of computer technology, deep learning (Li et al., 2021) and artificial neural network (Ma et al., 2020) have also been applied to color image segmentation. Based on different color channels of image RGB after segmentation, various indexes have been derived for dynamic monitoring of vegetation growth (Sulik and Long, 2016; Guijarro et al., 2011; Pérez et al., 2000).
Karst is one of the four fragile ecological systems alongside loess, plateau and cold desert. It is widely distributed in southwestern China, where rocky desertification is prominent. Rocky desertification refers to a form of land degradation characterized by the destruction of surface vegetation, severe soil erosion and extensive exposure of bedrock due to human activities in a specific natural environment background (Yuan, 2008). The special rocky desertification landscape makes karst areas barren with shallow soil layers, and the vegetation is mainly shrubs, herbaceous plants and grasslands, which are sensitive to climate change and meteorological disasters and weak in disaster bearing capacity (Chen et al., 2022). Due to the severe constraints of rocky desertification on social and economic development and the improvement of people’s living conditions, karst areas are a key focus for government departments to carry out rocky desertification control, vegetation protection and restoration. Vegetation growth is an important indicator determining the severity of rocky desertification (Zhou and Zhang, 1996; Qiu et al., 2021), and it is of great significance to carry out vegetation monitoring and evaluation for complex habitats in karst areas (Li H. et al., 2024; Li K. et al., 2024). At present, the application of ground-based visible images is mostly limited to images with vertical or approximately-vertical views (The line of sight of the camera is perpendicular or nearly perpendicular to the ground). For example, aiming at the karst bare rock and vegetation mixed underlying surface, scholars have studied applicable segmentation algorithms and growth monitoring models for RGB images of vegetation canopy obtained from vertical view, and the machine learning algorithm has been proved to be applicable (Chen et al., 2023), but this study only used images from near views from ecological meteorological stations. Usually, ecological meteorological stations will be equipped with cameras with multiple views, both in far and near views, but there are few reports about the comparison of images from different views. Moreover, the results of remote sensing monitoring need to be verified on the ground, and photos taken in the field investigation are also one of the important evidences. Multi-view images obtained by the ecological meteorological stations are equivalent to photos taken in the field investigation by manpower, but there is no relevant report on the similarities and differences between these images and satellite remote sensing monitoring. On the other hand, clarifying the differences between them can provide important reference for the construction of ecological meteorological observation stations.
In this study, with typical vegetation dominated by shrubs and herbaceous plants under mixed bedrock conditions in Guangxi karst areas as the research object, multi-view canopy RGB images obtained by ecological meteorological observation stations were used to compare the effectiveness of machine learning segmentation algorithm for multi-view image segmentation in karst areas, and investigate the vegetation growth trends characterized by images from far and near views, based on which the difference between multi-view images and satellite remote sensing monitoring was analyzed, aiming to provide decision-making reference for quantitative application of multi-view images obtained by ecological meteorological stations in karst areas and site selection and construction of ecological meteorological stations.
2 Data and methods
2.1 Data
2.1.1 General situation of study area
Located in Guangxi Zhuang Autonomous Region in the south of China (Figure 1), the study area belongs to the south subtropical humid climate zone, where Karst landforms are widely distributed, covering an area of 8,331,000 hm2, in which rocky desertification accounts for 18.4%. The poor soil and serious natural disasters in these areas have a great impact on vegetation ecological protection and economic development, making the areas poor and lagged behind in China.
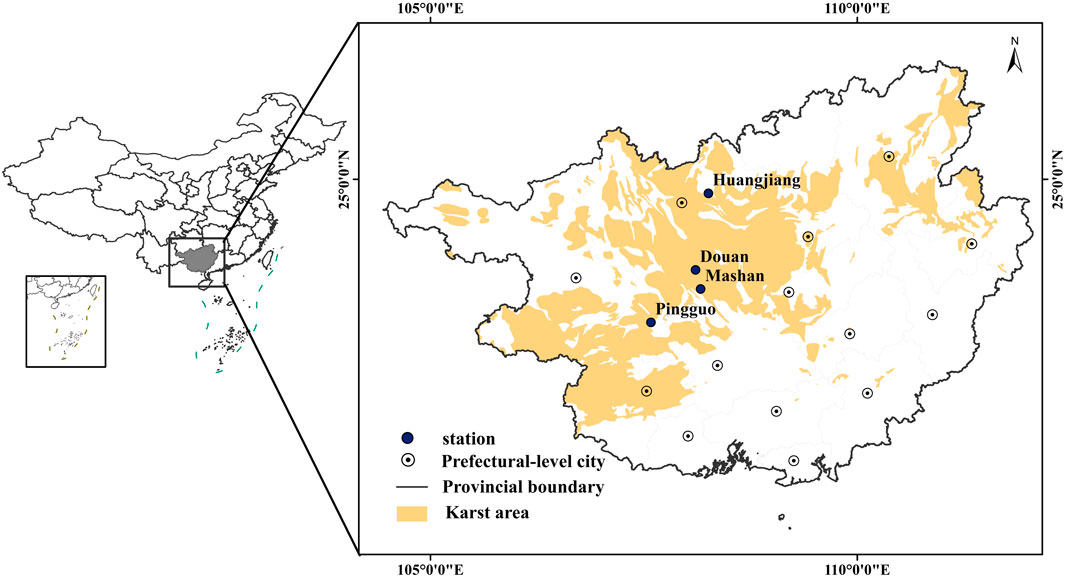
Figure 1. Distribution of karst eco-meteorological stations in the study area.
2.1.2 Multi-view RGB images
The multi-view image data used in the study was collected from the 4 ecological meteorological observation and test stations built in karst areas (Figure 1), namely, Mashan Station (23°39′28.0″ N, 108°19′17.0″ E), Huanjiang Station (24°44′26.0″ N, 108°19′22.0″ E), Pingguo Station (23°23′27.9″ N, 107°23′21.0″ E) and Du’an Station (24°0′16.9″ N, 107°59′3.00″ E), respectively, all of which carried out full-scale and multi-gradient stereoscopic observation of vegetation and meteorological elements in karst areas in the mode of one main station with one or two substations. The main station adopted the far view and the sub-stations adopted the near view. The camera model was ZQZ-TIM, and it used a 1/1.8 inch CMOS sensor with the total pixels of about 6.44 million, aperture value of F1.5-4.3, 30 times optical zoom, 16 times digital zoom, wide dynamic effect, plus image noise reduction function, all of which enable it to better display day/night images. In this study, image sequences from both the far view and near view were selected for each test station. Due to differences in the construction time of different test stations, the image sequence time was Mashan (January 2018–December 2021), Huanjiang (January 2020–December 2021), Du’an (January 2021–December 2021) and Pingguo (January 2021–December 2021).
2.1.3 Satellite remote sensing images
FY3D NDVI: From Fengyun-3 satellite series products, with a spatial resolution of 250 m, in a time range from January 2021 to October 2023.
MODIS NDVI: From the MODIS vegetation indexes products, developed by the NASA MODIS land product group based on statistical algorithms, with spatial resolutions of 250, 500, and 1,000 m, respectively, in a time range from January 2021 to October 2023.
2.2 Methods
2.2.1 Multi-view RGB image segmentation
For the extraction of vegetation information on the underlying surface mixed with bare rocks and vegetation in karst areas, the superiority of machine learning method has been confirmed in our previous study (Chen et al., 2023). In this method, K-means unsupervised clustering is used to generate training samples, and then the filtered clustering samples are used as the training samples of Support Vector Machine (SVM) vegetation-background classifier, and finally, the background-plant segmented images are filtered by Non-Local Mean (NLM) to remove misdivided edge pixels. The specific process is shown in Figure 2.
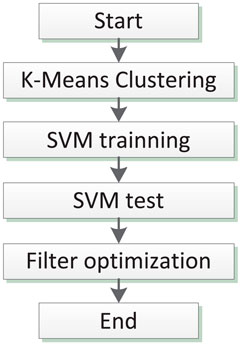
Figure 2. Flow chart of vegetation segmentation based on machine learning.
2.2.1.1 K-means clustering based on image features
K-means algorithm uses distance as a similarity evaluation index, and the closer the distance between two objects, the greater their similarity. As far as the algorithm is concerned, a category is composed of objects with close distance, and compact and independent categories are taken as the final iterative convergence objects. Considering that the color information contained in the scene can be roughly divided into 3 categories (plant category, background highlight category and background shadow category), the minimization of the sum of squares of the distances from the RGB values of pixel points to the RGB values of pixel points in the center of a category is taken as the optimized objective function.
2.2.1.2 Segmentation of image sequences based on SVM
SVM is a pattern recognition method based on statistical learning theory. The main idea is to map a low-dimensional unclassifiable vector to a high-dimensional space, and establish a maximum-interval hyperplane in the high-dimensional space, so as to maximize the distance between the two parallel hyperplanes closest to the plane on both sides of the plane. SVM has certain advantages in small sample, nonlinear and high-dimensional pattern recognition. Taking 35% pixels closest to a category center in the K-means clustering results as the SVM training sample data, 24 features were extracted from the training samples to form classification feature vectors (Table 1).
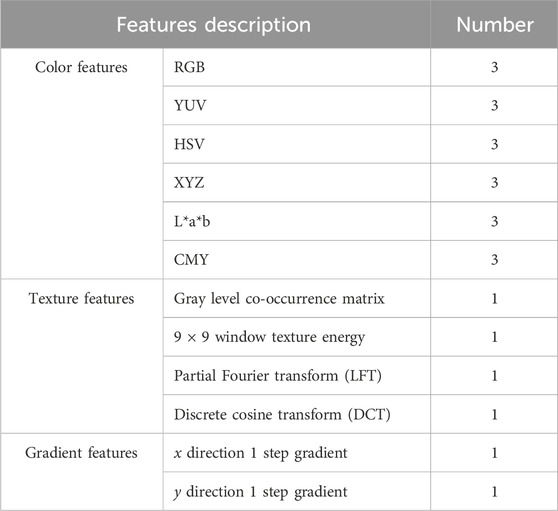
Table 1. Feature description of plant pixel classification.
2.2.1.3 NLM filtering optimization
After processing in (1) and (2), the automatic time sequence image segmentation was completed. Illumination and imaging quality make it easy to have false segmentation at the edge of vegetation, which affects further morphological analysis and feature extraction. In order to eliminate the false segmentation of leaf edge, NLM filtering algorithm was introduced to further refine the plant segmentation results. The NLM operator can protect long and narrow structures similar to vegetation leaves, and it can eliminate pixel segmentation ambiguity at the edge of vegetation leaves by enhancing non-adjacent pixels mutually on the same structure within a certain neighborhood range. Specifically, an anisotropic structural-aware filter was adopted to realize NLM function, as shown in Formula 1.
where, C is the classification function; A(p) is the 9 × 9 neighborhood window q∈A(p) near point p; and Kpq is the weight coefficient. The specific forms are shown in Formulas 2, 3.
where, ∇I(p) = {∇xI(p), ∇yI(p)}T is the gradient vectors in x and y directions of point p. The anisotropic structural-aware filter defines the possibility that point p and q are in similar structures in an image. If p and q are in the same structure (such as leaves in the image), the calculated value of Kpq will be large, and even if p and q are not first-order adjacent pixels, they will also reinforce each other.
2.2.1.4 Evaluation of image segmentation accuracy
In the images, 3 kinds of ground objects, such as grass, soil and bare rock, were identified manually, which was used as reference for segmentation results, and then the accuracy of classified images obtained before and after filtering by the above three segmentation algorithms was evaluated. The calculation formulas of accuracy evaluation indexes Qseg and Sr are shown in Formulas 4, 5.
where, A is the foreground (green vegetation) pixel set (p = 255) or background (information other than green vegetation) pixel set (p = 0) of a segmented image; B is the foreground pixel set (p = 255) or background pixel set (p = 0) obtained by manual field labeling; m and n are the number of rows and columns of the image, respectively; and i and j are corresponding coordinates, respectively. The larger the values of Qseg and Sr, the higher the segmentation accuracy. Qseg represents the overall consistency of the background and foreground of the segmentation results, while Sr only represents the consistency of the foreground segmentation results.
2.2.2 Calculation of RGB image vegetation indexes
After segmenting the green vegetation in a RGB image, the R, G and B color channel values of each pixel in the green vegetation region were extracted, and then, all pixels in this region were averaged. Next, the visible light indexes of green vegetation were calculated according to the formula in Table 2.
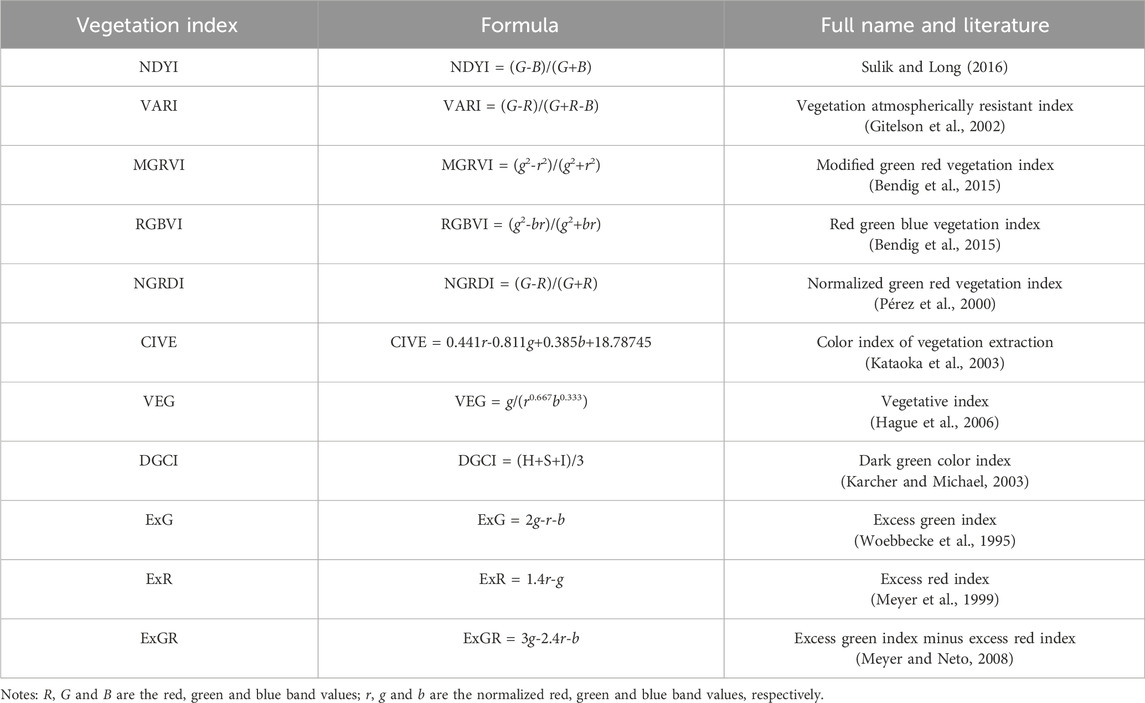
Table 2. RGB image vegetation index.
2.2.3 Preprocessing of satellite remote sensing data
FY3D NDVI: Based on the FY3D NDVI product with a resolution of 250 m downloaded from Fengyun Satellite Remote Sensing Data Service Network (http://satellite.nsmc.org.cn/portalsite/default.aspx), monthly NDVI data sequences were generated by the maximum value composites method (MVC). The FY3D NDVI data sequences of corresponding positions of the 4 ecological stations were extracted, and the sequence time periods were consistent with the image sequences of the ecological stations.
MODIS NDVI: Based on the MOD13Q1 16d NDVI products with a resolution of 250 m downloaded by NASA official website (https://ladsweb.modaps.eosdis.nasa.gov/search/), the monthly NDVI data sequences were generated by the MVC method. The MODIS NDVI data sequences of corresponding positions of the four ecological stations were extracted, and the sequence time periods were consistent with the image sequences of the ecological stations.
2.2.4 Comparison of differences among remote sensing vegetation monitoring at multiple scales
The Pearson correlation coefficients between FY3D NDVI, MODIS NDVI and vegetation indexes of multi-view RGB images were calculated by statistical methods, and then the significance tests were performed, so as to analyze the differences between satellite remote sensing monitoring and ground-based multi-view image monitoring.
3 Results and analysis
3.1 Effect of machine learning vegetation segmentation
The visual results of segmentation of images obtained by the 4 ecological meteorological stations from different views are shown in Tables 3, 4, and the accuracy analysis results are shown in Table 5. The segmentation accuracy of images obtained by all stations from a near view was higher than that from a far view, and the accuracy of images from the near view was higher than 85% except that of Du’an Station. Compared with the effect under strong light, the segmentation effect of images was better from both far and near views, the accuracy of which was over 79% from the far view and 86% from the near view. Among the 4 stations, the image segmentation effect at Huanjiang Station was the most stable, with an accuracy of over 80%, and the accuracy obtained with the near view was over 87%. The results showed that there was significant differences in the images taken under strong and weak light at Mashan Station from the far view, as the mountain shadow area of this station was large under strong light. There was a similar situation for Du’an Station from the near view. Therefore, the difference (variance) of image segmentation accuracy for the 2 stations under strong and weak light was obviously greater than that for other 3 stations. Moreover, the proportion of bare rocks had no obvious influence on the image segmentation accuracy. The reason was that the proportion of bare rocks in the view areas of Mashan Station and Pingguo Station was relatively high, but the segmentation accuracy was not low under stable light (weak light), and the Sr value reached 93.37% for the near view of Mashan Station, which was higher than those of other stations.
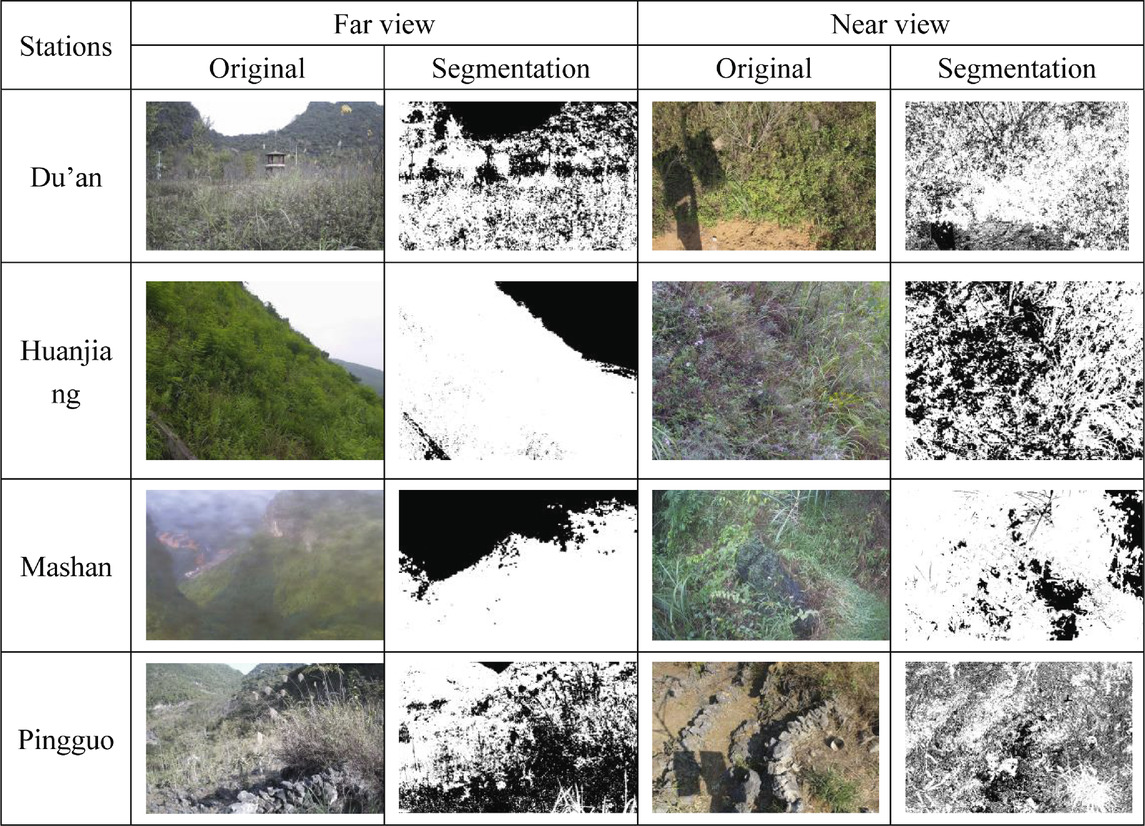
Table 3. Image and segmentation results obtained under strong light.
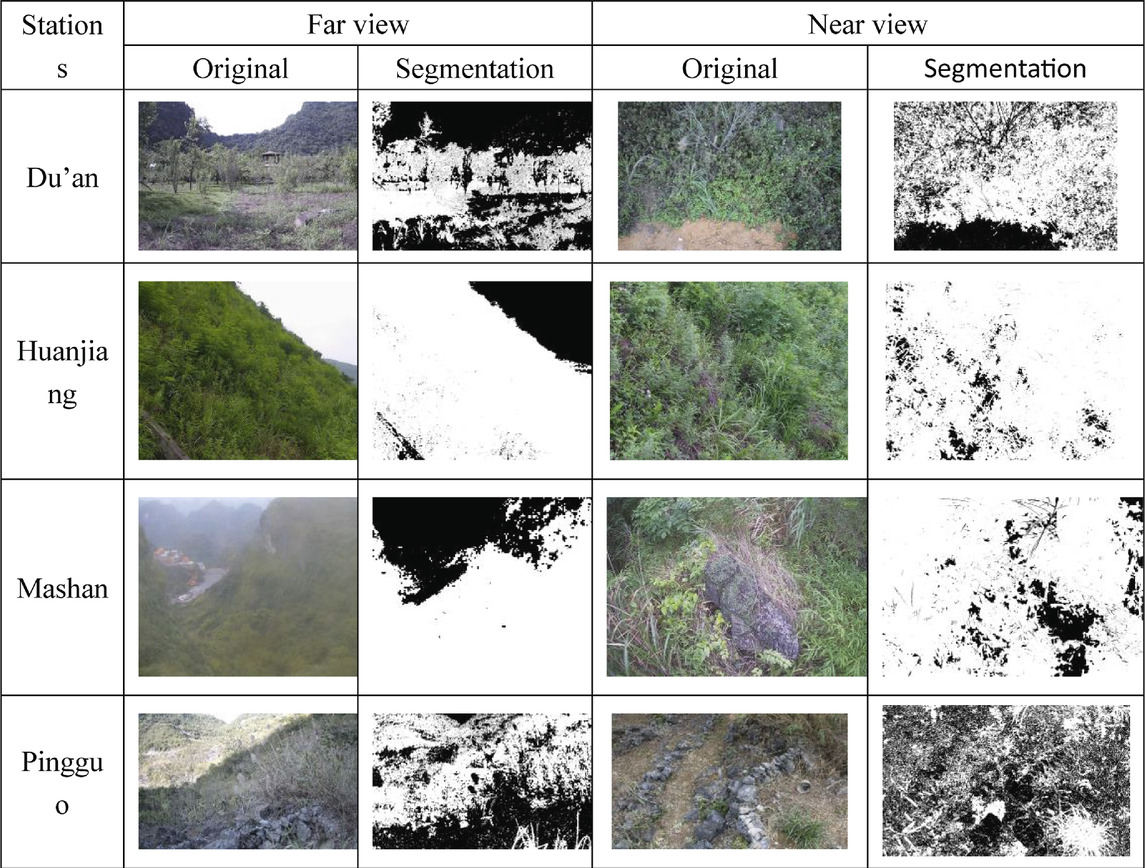
Table 4. Image and segmentation results obtained under weak light.
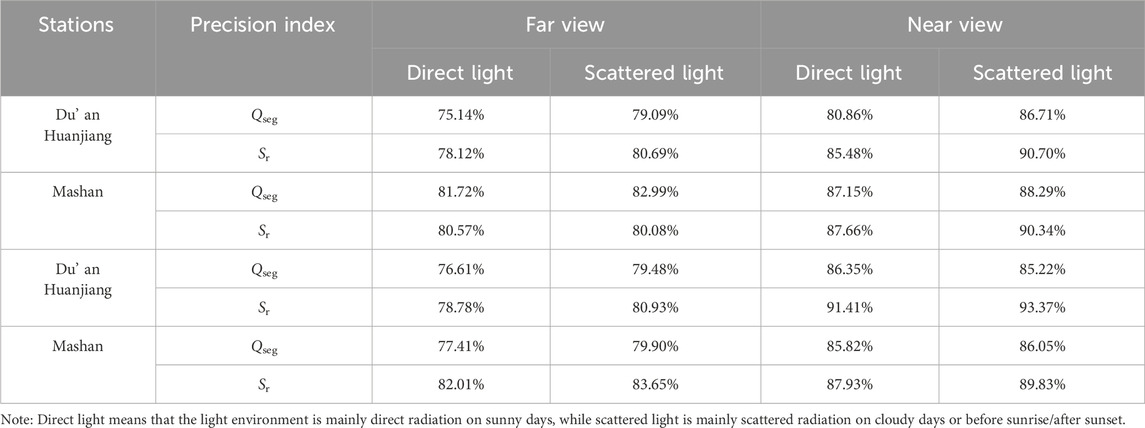
Table 5. RGB image segmentation accuracy statistics.
3.2 Monitoring of vegetation growth change from different views
Since there were only 1-year time sequences for Du’an Station and Pingguo Station, interannual comparison was only made for Mashan Station and Huanjiang Station. There were differences in the interannual variation trends of vegetation indexes in RGB images from the far and near views. For Mashan Station, NDYI, RGBVI and ExG from the far and near views all decreased continuously; VARI, ExGR, MGRVI, NGRDI and VEG from the far also showed a downward trend, but their change trends from the near view were inconsistent; CIVE showed no obvious interannual change, ExR and DGCI from the far view were on the increase, while there was no obvious change from the near view (Figure 3). For Huanjiang Station, there was no significant difference in the annual means of CIVE, VEG and DGCI from far and near views in 2020 and 2021, while ExR in 2020 was significantly lower than that in 2021, but NDYI, VARI, MGRVI, RGBVI, and NGRDI in 2020 were all significantly higher than those 2021 (Figure 4). The results showed that NDYI and RGBVI showed good consistency in vegetation changes from far and near views at the two stations, and these 2 indexes could better reflect the interannual differences in vegetation changes at ecological stations.
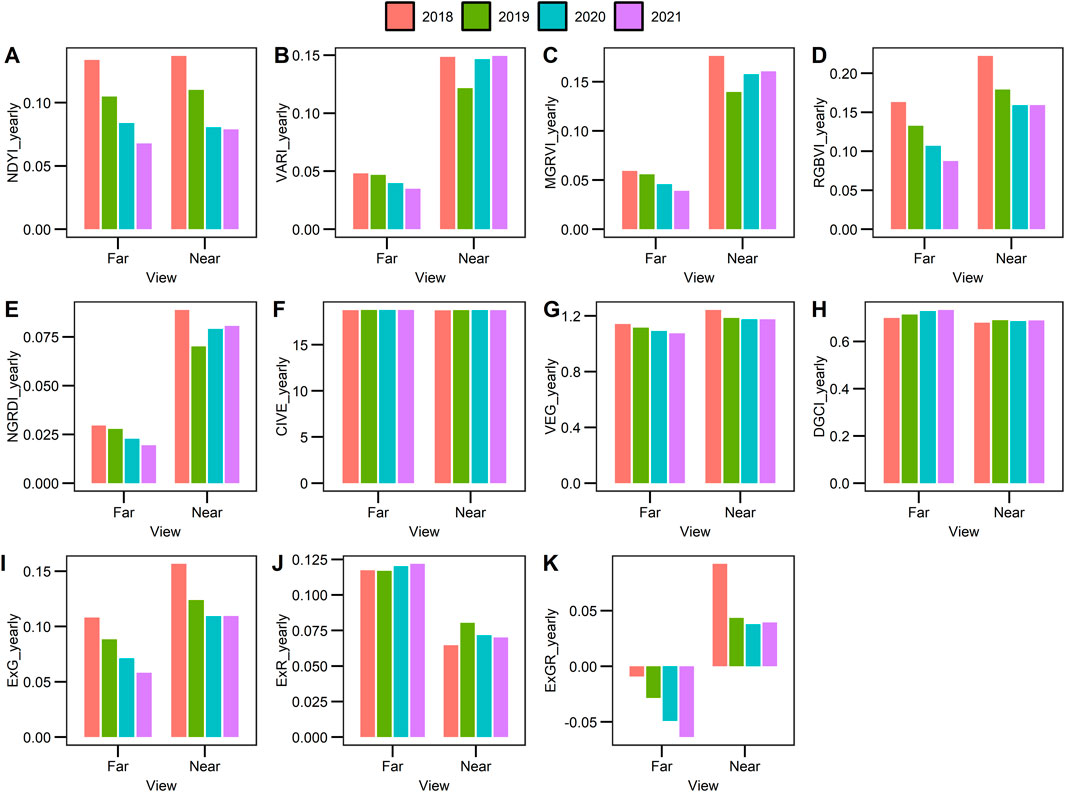
Figure 3. Annual change of RGB vegetation index of Mashan station from 2018 to 2021 [(A) NDYI, (B) VARI, (C) MGRVI, (D) RGBVI, (E) NGRDI, (F) CIVE, (G) VEG, (H) DGCI, (I) ExG, (J) ExR, (K) ExGR].
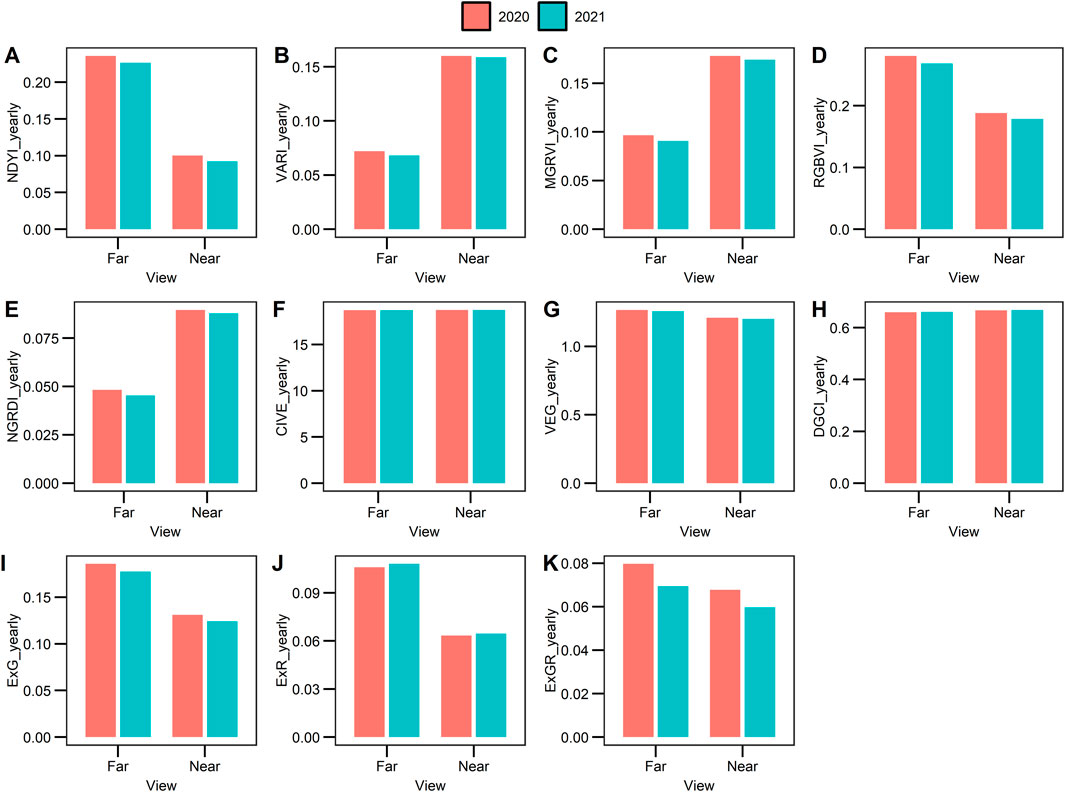
Figure 4. Annual change of RGB vegetation index of Mashan station from 2020 to 2021 [(A) NDYI, (B) VARI, (C) MGRVI, (D) RGBVI, (E) NGRDI, (F) CIVE, (G) VEG, (H) DGCI, (I) ExG, (J) ExR, (K) ExGR].
There were significant differences in the monthly mean values of vegetation indexes in RGB images obtained by the 4 ecological stations, but the change trends were basically the same over time, showing seasonal changes in different degrees. Among the vegetation indexes, NDYI, VARI, MGRVI, RGBVI, NGRDI, VEG, ExG and ExGR showed obvious seasonal changes, that is, they first decreased and then increased, while CIVE, DGCI and ExR showed obvious anti-seasonal changes. In generally, vegetation grew well from April to October, but relatively poorly in other months.
In this paper, the extreme value was defined as the maximum or minimum value of increasing change or decreasing change. From the far view, the vegetation indexes ranges of various RGB images at Huanjiang Station were the largest throughout the year, and the seasonal distribution characteristics were the most obvious, followed by Mashan Station and Pingguo Station. The extreme values mostly occurred in May-June at Mashan Station, Huanjiang Station, Du’an Station and Pingguo Station (Figure 5). From the near view, NDYI, RGBVI, VEG, ExG and ExGR showed significant seasonal distribution characteristics, and the ranges of vegetation indexes in Du’an Station were the largest, followed by Pingguo Station and Mashan Station. The extreme values in Mashan and Huanjiang occurred from August to September and May to June, respectively. The monthly values at Du’an Station fluctuated greatly without a significant trend, while at Pingguo Station, they showed double-peak or double-valley changes, and the extreme values appeared in May and August (Figure 6). Overall, there was significant seasonal distribution of vegetation indexes in RGB images obtained at various ecological stations, but there was no significant or regular seasonal distribution of vegetation indexes from the near view, although there were certain seasonal distribution characteristics.
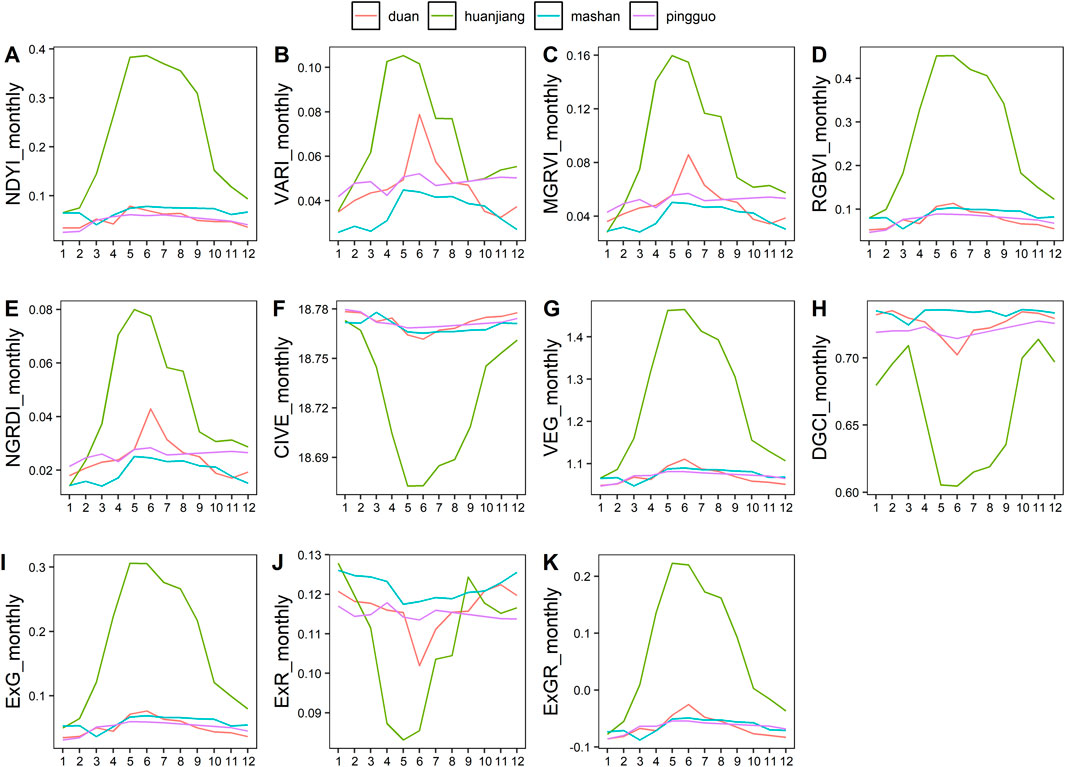
Figure 5. Monthly variation of RGB vegetation index of far view in 2021 [(A) NDYI, (B) VARI, (C) MGRVI, (D) RGBVI, (E) NGRDI, (F) CIVE, (G) VEG, (H) DGCI, (I) ExG, (J) ExR, (K) ExGR].
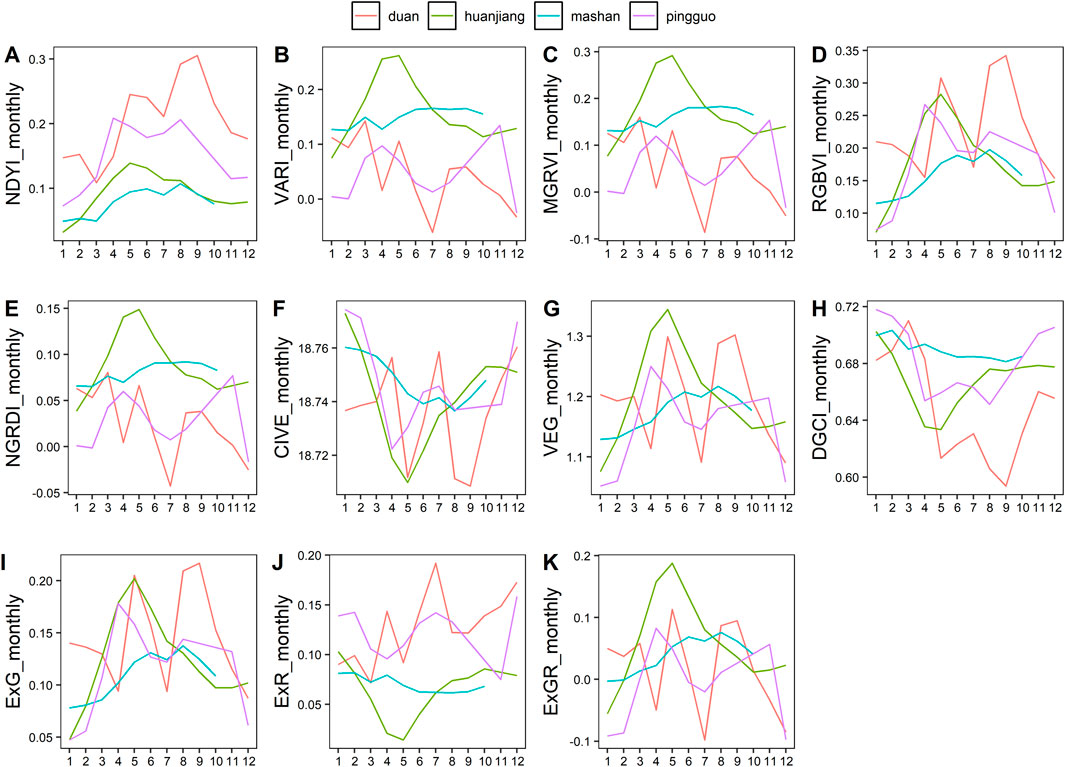
Figure 6. Monthly variation of RGB vegetation index of near view in 2021 [(A) NDYI, (B) VARI, (C) MGRVI, (D) RGBVI, (E) NGRDI, (F) CIVE, (G) VEG, (H) DGCI, (I) ExG, (J) ExR, (K) ExGR].
3.3 Comparison of monitoring results from different views and satellite scales
There were significant differences in the correlation between satellite NDVI and RGB vegetation indexes of ecological stations from different satellites, ecological stations, and views (Figure 7). By comparing FY3D NDVI and MODIS NDVI, it found that the correlation between FY3D NDVI and RGB image vegetation indexes was weaker than MODIS NDVI. There were significant correlations between 27.3% and 20.5% of RGB vegetation indexes and FY3D NDVI from far and near views, respectively (P < 0.05). For MODIS NDVI, the correlation with RGB vegetation indexes had a greater difference between far and new views. From a far view, 70.5% of RGB vegetation indexes were significantly correlated with MODIS NDVI (P < 0.05), but only 15.9% from the near view.
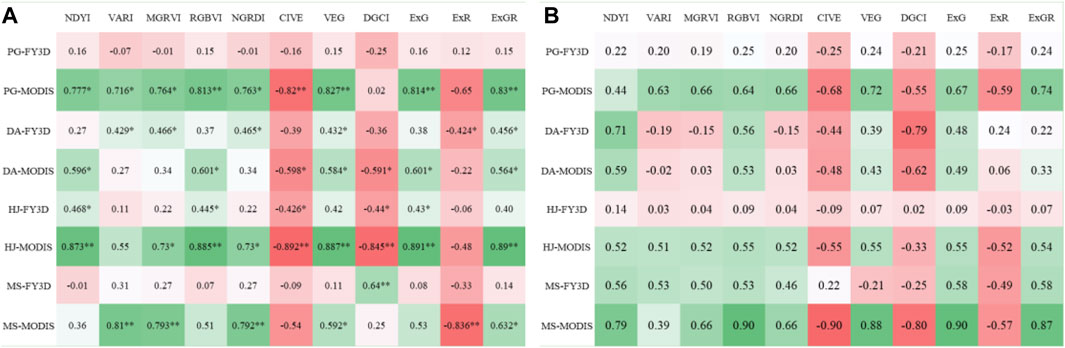
Figure 7. Correlation Matrix of RGB vegetation index and NDVI from satellite remote sensing [(A) far view, (B) near view].
Among the 4 ecological stations, Pingguo Station and Huanjiang Station showed a good correlation between RGB vegetation indexes and MODIS NDVI from the far view. For both stations, 81.8% of RGB vegetation indexes passed the significance test (P < 0.05), followed by Du’an Station (63.6%), and Mashan Station (54.5%) was relatively poor. Meanwhile, the correlation between RGB vegetation indexes and FY3D NDVI at the four stations from the far view was slightly poorer than that of MODIS NDVI. The proportions of RGB vegetation indexes passing the significance test were in the following order: Du’an Station (54.5%), Huanjiang Station (45.5%) and Mashan Station (9.1%), while all the indexes at Pingguo Station failed the significance test. From a near view, only 63.6% of RGB vegetation indexes at Mashan Station were significantly correlated with MODIS NDVI (P < 0.05). Meanwhile, only 63.6% of the RGB vegetation indexes at Mashan Station and 18.2% at Du’an Station were significantly correlated with FY3D NDVI (P < 0.05), while other stations failed the significance test.
The comparison results showed that the correlation between most RGB vegetation indexes and the 2 kinds of satellite NDVI was better from the far view than from the near view, but such situation was not absolute. For example, at Mashan Station, the correlation between RGB vegetation indexes from the close view and satellite NDVI was better than that from the far view. In addition, there were significant differences in the RGB indexes that had the highest correlation with the 2 kinds of satellite NDVI from both the far and near views. From the far view, the highest correlation between vegetation indexes of RGB images and FY3D NDVI at the 4 ecological stations was ranked as follows: Mashan (DGCI, R = 0.640) > Huanjiang (NDYI, R = 0.468) > Du’an (GMRVI, R = 0.465) > Pingguo (DGCI, R = 0.251), and the corresponding MODIS NDVI was in the order of Huanjiang Station (CIVE, R = 0.892) > Mashan Station (ExR, R = 0.836) > Pingguo Station (ExGR, R = 0.830) > Du’an Station (ExG, R = 0.598). From the near view, the corresponding ranking of FY3D NDVI was in the order of Du’an Station (DGCI, R = 0.786) > Mashan Station (ExGR, R = 0.576) > Pingguo Station (RGBVI, R = 0.250) > Huanjiang Station (NDYI, R = 0.135), while the corresponding order of MODIS NDVI was Mashan Station (RGBVI, R = 0.904) > Pingguo Station (ExGR, R = 0.740) > Du’an Station (DGCI, R = 0.622) > Huanjiang Station (CIVE, R = 0.551). Such situation showed that there were great differences in the coincidence degree and verification ability of the RGB image vegetation data from different views of ecological stations to the vegetation monitoring results of satellite remote sensing scale.
The linear fitting between satellite NDVI and RGB vegetation indexes of ecological stations showed significant differences under different satellites, ecological stations, and views (Figures 8–11). The results showed that compared with FY3D NDVI and MODIS NDVI, MODIS NDVI and RGB vegetation indexes of ecological station had better fitting performance, and the determination coefficient R2 of MODIS NDVI and RGB vegetation index was better than that of FY3D NDVI for more than 80%. Moreover, the indexes of near view and far view had better coefficient of determination with 40.91% and 43.18%, respectively. FY3D NDVI generally showed a poor fit of RGB vegetation indexes, and most of the R2 values were lower than 0.1.
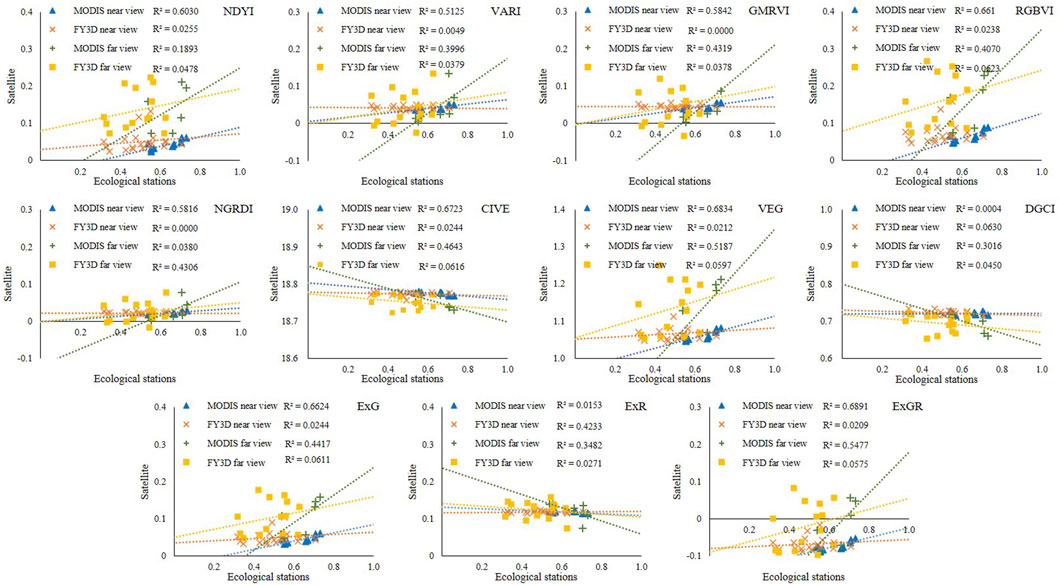
Figure 8. Linear fitting of RGB image of Pingguo Ecological Station and satellite remote sensing NDVI.
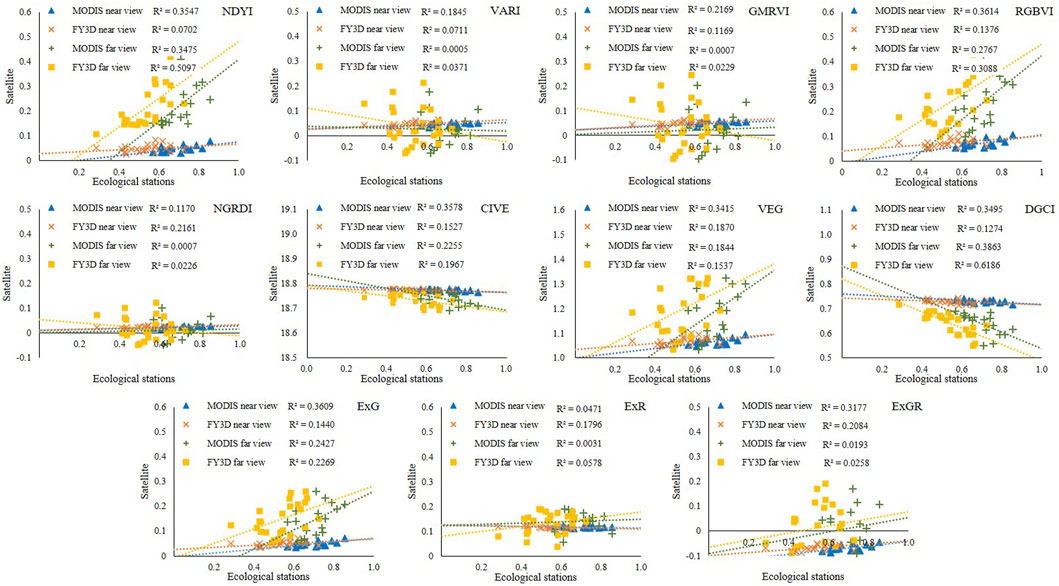
Figure 9. Linear fitting of RGB image of Du’an Ecological Station and satellite remote sensing NDVI.
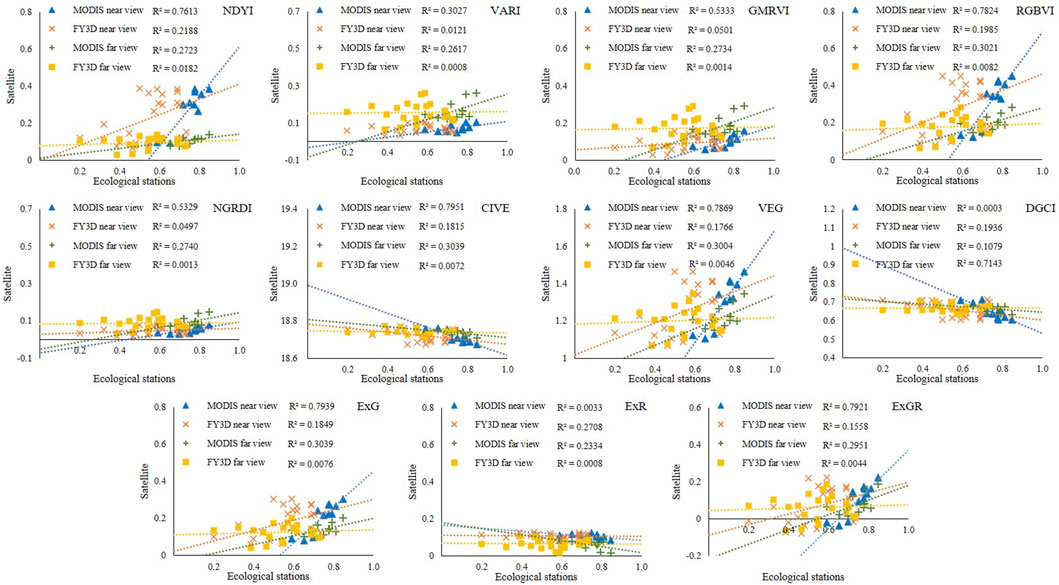
Figure 10. Linear fitting of RGB image of Huanjiang Ecological Station and satellite remote sensing NDVI.
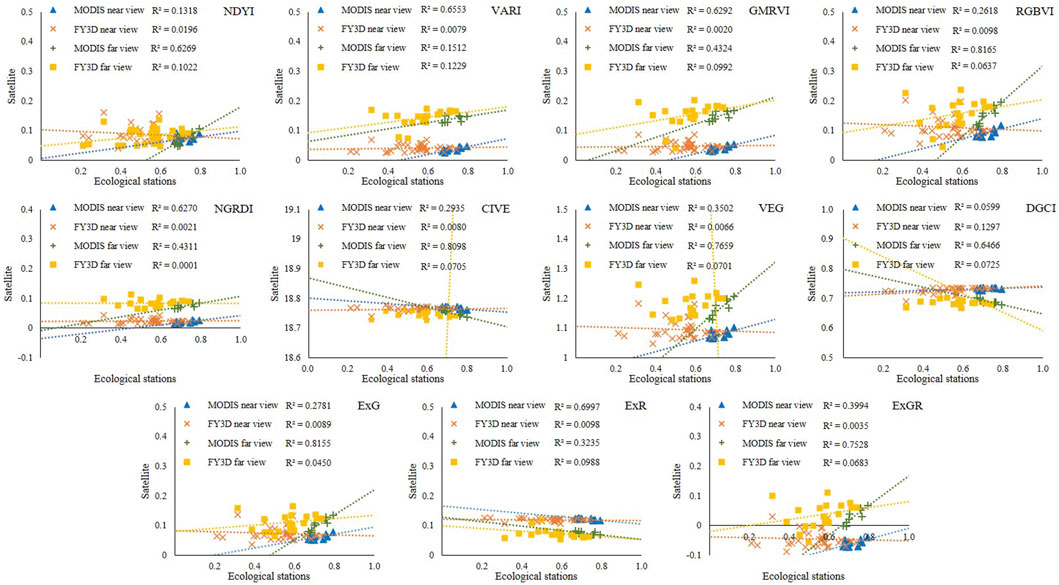
Figure 11. Linear fitting of RGB image of Mashan Ecological Station and satellite remote sensing NDVI.
Among the 4 ecological stations, the R-squared between the RGB vegetation indexes and MODIS NDVI was higher in the far and near views of Masan Station, and the far views of Huanjiang Station and Pingguo Station. The R2 of the RGB vegetation indexes of the 3 stations were 50.0%, 31.8% and 27.3%, respectively, and the R2 of Du’an Station was higher than 0.5. From the far view perspective, the goodness of fit between the RGB vegetation indexes and FY3D NDVI of the 4 stations was significantly poorer than that of the MODIS NDVI. The fitting R2 of the near-view RGB vegetation indexes of all stations was lower than 0.3, while the fitting R2 of the partial RGB vegetation indexes and FY3D NDVI of Du’an Station was higher than 0.6 (9.1%). None of the other stations exceeded 0.2.
The comparison of near and far view showed that in most cases, the goodness of fit between the RGB vegetation indexes of the far view and the 2 types of satellite NDVI was better than that of the near view, except for Masan Station, whose R2 of the near view was generally better than that of the far view. In addition, there was a significant difference between the RGB indexes with the highest fit between the far and near views and the 2 kinds of satellite NDVI. From the far view perspective, the goodness of fit between the RGB image vegetation indexes of the 4 ecological stations and FY3D NDVI from high to low was in the order as follows: Huanjiang (NDYI, R2 = 0.219) > Du’an (GMRVI, R2 = 0.217) > Mashan (DGCI, R2 = 0.130) > Pingguo (DGCI, R2 = 0.063). The MODIS NDVI was ranked as follows: Huanjiang (CIVE, R2 = 0.795) > Masan (ExR, R2 = 0.700) > Pingguo (ExGR, R2 = 0.690) > Du’ an (GMRVI, R2 = 0.361). From the near view perspective, the corresponding order of FY3D NDVI was Du’an Station (DGCI, R = 0.619) > Mashan Station (VARI, R = 0.123) > Pingguo Station (RGBVI, R = 0.062) > Huanjiang Station (NDVI, R = 0.018), and the corresponding order of MODIS NDVI was as follows: Masan Station (RGBVI, R = 0.817) > Pingguo Station (ExGR, R = 0.547) > Du’an Station (DGCI, R = 0.386) > Huanjiang Station (CIVE and ExG, R = 0.304). The variation pattern of this result was similar to the correlation between ecological station and satellite NDVI.
4 Discussion
4.1 RGB image segmentation
Under natural conditions, vegetation images are not only affected by illumination changes, but also by mutual occlusion between vegetation groups, which affects image segmentation and recognition. In general, the plants are segmented from the background by finding the optimal color space, and there are usually significant differences between the vegetation and background of channels S and a in HSV and Lab color spaces, which are often used as the input values of Otsu algorithm (Purcell, 2000). The principle is to realize automatic segmentation by using the double-peak characteristic of the histogram distribution of vegetation and background. Moreover, nonlinear combinations through color channels such as ExG and ExG-ExR are widely used because of simple calculation and high efficiency. In order to further prove the superiority of machine learning algorithm in multi-view image extraction, the effects of vegetation segmentation of several algorithms were compared based on color channels (Figure 12). The results showed that part of the surface soil background was mistakenly divided into vegetation in the images subjected to threshold segmentation using channel S, and channel a and ExG methods had better foreground vegetation segmentation effects than channel S, but some green mountain peaks in the distance were wrongly segmented into soil and stone background.
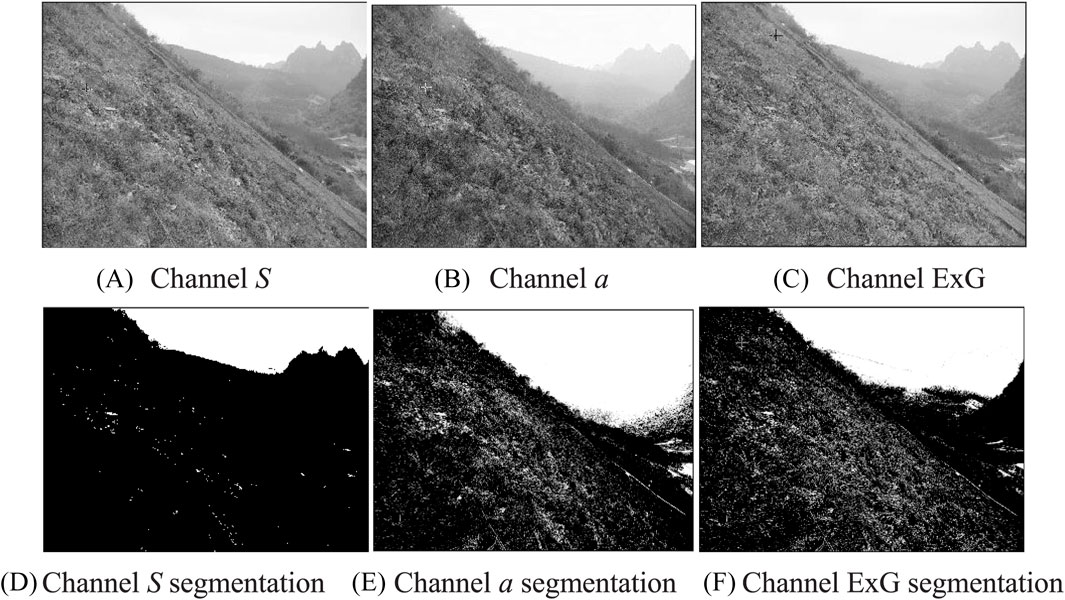
Figure 12. Threshold segmentation effect of different color channels [(A) Channel S, (B) Chanel a, (C) Channel ExG, (D) Channel S segmentation, (E) Channel a segmentation, (G) Channel ExG segmentation].
When the lighting mainly came from scattered light (early morning and dusk), the threshold processing methods of various color channels (a, ExG, ExG-ExR) all could achieve good calculation results. However, the external illumination changed constantly throughout the day. When the direct light was strong, the large number of highlights and shadows in the images posed great challenges to vegetation image segmentation, especially in the karst landform environment, where there were a lot of rocks, soil, man-made debris and soil residues in the vegetation, which further increased the difficulty of automatic segmentation. Through comparison, it was found that the method based on machine learning had the best effect, and the accuracy was over 80% in both sunny and cloudy days. The threshold segmentation method based on channel a (Lab) performed well in weak light, but the effect decreased in strong light. The effect of the ExG channel-based segmentation method was generally stable, while the effect of channel S method was not good, but its evaluation parameter values were still over 70% (Figure 13). The accuracy of these 4 methods improved after filtering, because the contours of foreground images segmented by image processing methods were generally smaller than those obtained by manual methods, and filtering removed noise from the images while preserving the leaf edge areas in the contours of foreground images, ultimately improving accuracy. Thus, machine learning algorithm was used as a tool for batch segmentation of multi-view images and calculation of vegetation indexes.
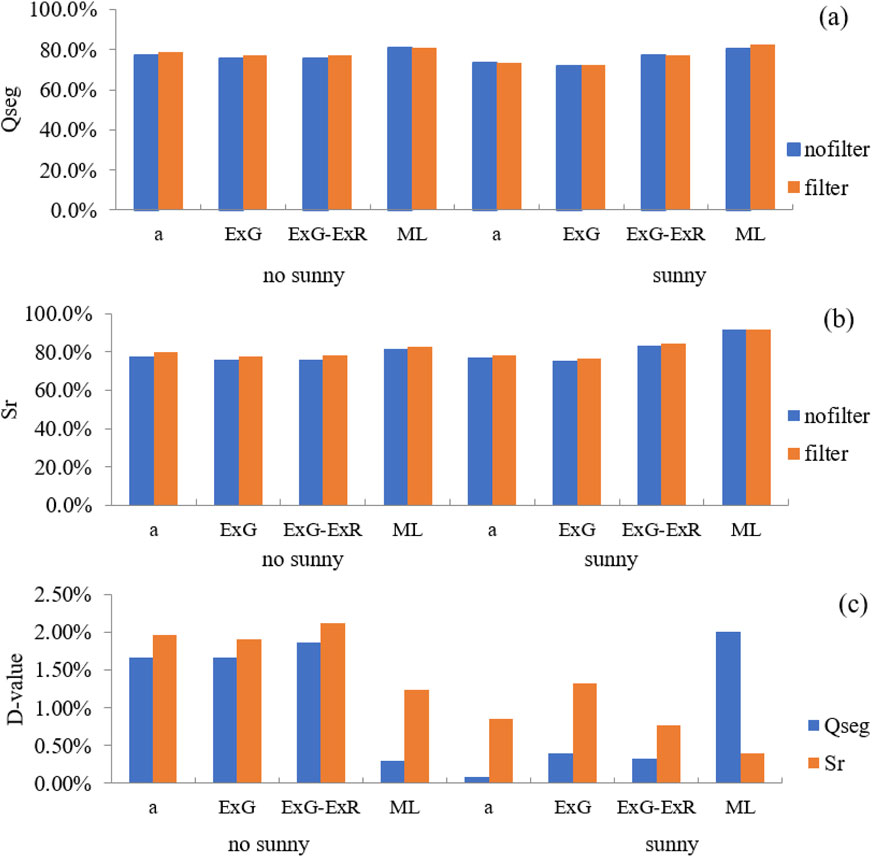
Figure 13. Precision statistics. Note: (A) Qseg value; (B) Sr value; (C) D-value before and after filtering.
Segmentation based on color space is simple and efficient, but it also has some limitations. According to the image segmentation results, most green vegetation (grass and shrubs) was accurately identified and segmented, while a small number of vegetation, such as brightly colored flowers, was wrongly classified as background information instead of vegetation. The reason may be that the segmentation algorithm was more inclined to identify green ground objects as vegetation in image segmentation, while other ground objects with other colors were more easily identified as background. Thus, image texture parameters are introduced to further optimize the segmentation algorithm in the following research.
4.2 Differences of multi-view vegetation growth monitoring
Various vegetation indexes of RGB images were quite different in reflecting the interannual and intra-annual differences of vegetation. NDYI and RGBVI not only showed good consistency in vegetation changes from different views, but also better represented the interannual differences in vegetation changes. The comparison on the threshold ranges of different indexes showed that the threshold ranges of these 2 indexes were obviously larger than other indexes, which was related to their index algorithms. On the other hand, the possible reason was that the weights of green light in the 2 indexes were relatively larger.
The study results showed that the seasonal characteristics of vegetation were more obvious from the far view, while from the near view, only certain seasonal characteristics were presented, and the regularity of the change curves was poor, which was related to the great variation of vegetation indexes extracted from RGB images. On the one hand, most karst ecological stations are located in mountainous areas, and vegetation forms and positions captured by cameras are greatly affected by the differences in wind speed and direction. On the other hand, the difference of light conditions can make the automatic exposure time different, which can also lead to the difference in vegetation image quality (Wang et al., 2016). These factors have a more serious impact on images from a near view. In further research, the variation of RGB image indexes will be reduced by ground investigation, setting camera parameters and improving image correction methods.
The multi-view monitoring of ecological stations showed that vegetation growth in karst areas reached the peaks mostly in May-June, and only Pingguo Station showed a bimodal distribution with peaks appearing in May and August, which was quite different from the results of satellite remote sensing monitoring. The monitoring results of MODIS 250 m NDVI showed that the best period of vegetation growth in karst areas was from mid-September to mid-October, but the periods of poor growth monitored by the 2 remote sensing scales were similar, mostly from January to February (Chen et al., 2015). The growth time monitored by satellite remote sensing was obviously later than that by multi-view images of ecological stations. On the one hand, it was due to the influence of mixed pixels. Satellite data, which was restricted by spatial resolution, reflected common information of vegetation and various backgrounds. On the other hand, ecological stations had a short time limit for capturing vegetation information, and the monthly synthetic data was based on continuous daily data. However, there were frequent cloudy and rainy weather in the south of China, and satellite images were affected by weather, resulting in certain lag in monitored vegetation information.
4.3 Possible reasons for the difference from satellite monitoring
MODIS NDVI and FY3D NDVI showed quite different correlation and linear fitting with RGB of ecological stations, which was related to the response functions of the two spectra, atmospheric water vapor, radiation calibration, observation angle, etc. (Ge et al., 2017). Although they had the same histogram trend, there were still differences in different ground features, and with the decrease of vegetation coverage, the linear consistency between the 2 became poorer (Feng et al., 2010), and there were multiple level differences in mean and minimum values between them (Wang et al., 2022).
From the far view, 50% of RGB vegetation indexes were significantly correlated with MODIS NDVI at all 4 stations, including Pingguo Station and Huanjiang Station, for which the proportions were over 80%. Although the correlation with FY3D NDVI was weak, the proportions of RGB vegetation indexes were larger than 45% at Du’an Station and Huanjiang Stations. The R-squared between RGB vegetation indexes and MODIS NDVI was generally good. Most stations had 1/3 of the RGB vegetation indexes with R2 > 0.6, including Mashan Station, for which the proportions were over 50%, while the R2 between the ecological station and FY3D NDVI was lower than 0.3. However, from the near view, only Mashan Station showed significant correlation with proportion of RGB vegetation indexes exceeding 60%, and at Du’an Station, the result was less than 20% of RGB vegetation indexes, about 60% of the RGB vegetation indexes of Mashan Station had a fitting R2 of more than 0.6, and only about 10% of the RGB vegetation indexes of Du’an Station. The results showed that most of the RGB vegetation indexes in the far view had good correlation and R-squared with the 2 kinds of satellite NDVI, which may be because the color distribution of vegetation in the far view was relatively uniform, and the shadows caused by the overlapping of vegetation leaves were not obvious. Furthermore, those interference information could not be recognized by images with distant and wide viewing angles, which was closer to the shooting mode of satellite obtaining vegetation information from high altitude. However, the ground objects captured by the near-view camera images contained more detailed interference information, which could not be completely eliminated by segmentation technology, so the correlation and goodness of fit with satellite NDVI were lower. Through comparison, it was found that the correlation with NDVI of the 2 satellites was good at Huanjiang Station from a far view, which might be caused by the single vegetation in the viewing range of the station.
Ground-based multi-view remote sensing monitoring is an effective supplement to satellite remote sensing monitoring, which can provide high-throughput high-definition live monitoring data, which can be used for evaluating the impact of meteorological disasters and pests on vegetation in near real time and verifying the evaluation results of satellite remote sensing, which is also one of the main purposes of setting up multi-view cameras in ecological stations. However, at present, there was no standard to follow in site selection and camera view angle for karst eco-meteorological stations. The results of this study showed that there were significant differences in the explanatory power of vegetation indexes of RGB images from different views on satellite remote sensing monitoring results at different ecological stations, so the monitoring angle and viewing width of camera view should be fully considered when building ecological stations. Meanwhile, it is also a problem worthy of in-depth exploration to improve the verification ability of acquired images to satellite monitoring results by determining the site selection of ground-based ecological stations through satellite remote sensing images of different scales.
5 Conclusion
The multi-view RGB images obtained by real-scene shooting at ecological meteorological observation stations are an effective supplement to satellite remote sensing. In this study, comparison has been made to the vegetation monitoring effect of multi-view images and its difference from satellite remote sensing monitoring, proving that machine learning algorithm is suitable for green vegetation segmentation of ground-based multi-view RGB images obtained at ecological meteorological stations, and it has been found that the quality of images obtained under weak light conditions is higher. Different RGB vegetation indexes show great differences in vegetation change trends. For karst areas, NDYI and RGBVI show good consistency in vegetation changes from far and near views, and can also better show the annual differences of vegetation. The vegetation indexes of RGB images from a far view show more obvious seasonal changes and interannual differences than from a near view, and the vegetation growth monitoring results are better consistent with the satellite-scale monitoring results.
Data availability statement
The original contributions presented in the study are included in the article/supplementary material, further inquiries can be directed to the corresponding author.
Author contributions
YC: Conceptualization, Funding acquisition, Methodology, Project administration, Supervision, Writing–review and editing. LH: Data curation, Writing–original draft. CC: Data curation, Writing–original draft. YX: Data curation, Writing–original draft.
Funding
The author(s) declare that financial support was received for the research, authorship, and/or publication of this article. The research was supported by the Key Research and Development Program of Guangxi, China (Guike AB20159022, Guike AB23026052, Guike AB21238010).
Conflict of interest
The authors declare that the research was conducted in the absence of any commercial or financial relationships that could be construed as a potential conflict of interest.
Publisher’s note
All claims expressed in this article are solely those of the authors and do not necessarily represent those of their affiliated organizations, or those of the publisher, the editors and the reviewers. Any product that may be evaluated in this article, or claim that may be made by its manufacturer, is not guaranteed or endorsed by the publisher.
References
Bendig, J., Yu, K., Aasen, H., Bolten, A., Bennertz, S., Broscheit, J., et al. (2015). Combining UAV-based plant height from crop surface models, visible, and near infrared vegetation indices for biomass monitoring in barley. Int. J. Appl. Earth Obs. Geoinf. 39, 79–87.
Campillo, C., Prieto, M. H., Daza, C., Moñino, M., and García, M. (2008). Using digital images to characterize canopy coverage and light interception in a processing tomato crop. HortScience 43 (6), 1780–1786. doi:10.21273/HORTSCI.43.6.1780
Chen, L., Ding, G. H., and Guo, L. (2011). Image thresholding based on mutual recognition of histogram. J. Infrared Millim. Waves 30 (1), 80–84. doi:10.3724/sp.j.1010.2011.00080
Chen, M., Zheng, S. F., Liu, X. L., Xu, D. Q., Wang, W., and Kan, H. C. (2017). Cotton nitrogen nutrition diagnosis based on digital image. J. Agric. 7 (7), 77–83.
Chen, Y. L., Fang, S. B., Mo, J. F., and Liu, Z. (2023). Characteristic of typical vegetation growth in Karst area based on ground-based visible images. Remote Sens. Technol. Appl. 38 (02), 518–526. doi:10.11873/j.issn.1004-0323.2023.2.0518
Chen, Y. L., Huang, M. T., Mo, W. H., Lu, H., and Wang, J. H. (2015). Vegetation variation in typical ecological sections of Southwest Guangxi based on MODIS NDVI data. J. Meteorological Sci. 35 (01), 93–99. doi:10.3969/2014jms.0017
Chen, Y. L., Tang, M. R., Zhang, H., Mo, J. F., and Qian, S. (2022). Response difference of fractional vegetation cover and net primary productivity to SPEI drought index in karst areas of Guangxi. J. Arid Meteorology 40 (06), 1042–1050. doi:10.11755/j.issn.1006-7639(2022)-06-1042
Feng, R., Ji, R. P., Wu, J. W., Zhang, Y. S., Wang, H. B., Chen, P. S., et al. (2010). Analysis on difference between FY3/Mersi-NDVI and EOS/MODIS-NDVI. Chin. Agric. Sci. Bull. 26 (19), 359–362.
Ge, M. X., Zhao, J., Zhong, B., and Yang, A. X. (2017). Comparison of the vegetation index between FY-3/VIRR,RY-3/MERSI and EOS/MODIS data. Remote Sens. Technol. Appl. 32 (02), 262–273. doi:10.11873/j.issn.1004-0323.2017.2.0262
Gitelson, A. A., Kaufman, Y. J., Stark, R., and Rundquist, D. (2002). Novel algorithms for remote estimation of vegetation fraction. Remote Sens. Environ. 80(1): 76–87. doi:10.1016/S0034-4257(01)00289-9
Guijarro, M., Pajares, G., Riomoros, I., Herrera, P., Burgos-Artizzu, X., and Ribeiro, A. (2011). Automatic segmentation of relevant textures in agricultural images. Comput. Electron. Agric. 75 (1), 75–83. doi:10.1016/j.compag.2010.09.013
Hague, T., Tillett, N. D., and Wheeler, H. (2006). Automated crop and weed monitoring in widely spaced cereals. Precision Agric. 7 (1), 21–32. doi:10.1007/s11119-005-6787-1
Han, D., Wu, H. J., Ma, Z. Y., Han, G. D., Wu, P., and Zhang, Q. (2019). The study on identification and feature extraction for the typical grassland pasture. Chin. J. Grassl. 41 (4), 128–135. doi:10.16742/j.zgcdxb.20190043
Karcher, D. F., and Michael, D. R. (2003). Quantifying turfgrass color using digital image analysis. Crop Sci. 43, 943–951. doi:10.2135/cropsci2003.9430
Kataoka, T., Kaneko, T., Okamoto, H., and Hata, S. (2003). “Crop growth estimation system using machine vision,” in IEEE/ASME International Conference on Advanced Intelligent Mechatronics (Kobe, Japan: IEEE), b1079–b1083.
Li, J., Jiang, N., Baoyin, B. T., Zhang, F., Zhang, W., and Wang, W. (2020). Spatial color clustering algorithm and its application in image feature extraction. J. Jilin Univ. Sci. Ed. 58 (3), 627–633. doi:10.13413/j.cnki.jdxblxb.2019282
Li, K., Zhang, M. Y., Li, Y. L., Xing, X., Fan, S., and Dong, L. (2024). Dynamics of fractional vegetation coverage and vegetation spatial pattern in natural restoration process of rocky desertification in Yunnan Shilin Geopark. Chin. J. Ecol. 1-14. Available at: http://kns.cnki.net/kcms/detail/21.1148.q.20240618.1818.008.html.
Li, Y. X., Ma, J. C., Liu, H. J., and Zhang, L. (2021). Field growth parameter estimation system of winter wheat using RGB digital images and deep learning. Trans. Chin. Soc. Agric. Eng. 37 (24), 189–198. doi:10.11975/j.issn.1002-6819.2021.24.021
Li H., H., Wei, X. P., Cai, Y. L., Chen, S., and Li, L. (2024). Spatial and temporal variation characteristics of vegetation greenness in rocky desertification and non-rocky desertification areas of Chongqing. Rocky Desertification Non-rocky Desertification Areas Chongqing 38 (03), 288–297. doi:10.13870/j.cnki.stbcxb.2024.03.037
Liu, S. Y., Li, L., Te, R. G., Li, Z. Q., Ma, J. Y., and Zhu, R. F. (2021). Threshold segmentation algorithm based on histogram region growing for remote sensing images. Bull. Surv. Mapp. (2), 25–29. doi:10.13474/j.cnki.11-2246.2021.0037
Liu, Z. P., Kuang, Z. M., Ma, R. S., Wu, X. K., Wang, D., Li, L., et al. (2020). Study on automatic recognition technology of sugarcane emergence based on image features. Sugarcane Canesugar 49 (5), 41–46. doi:10.3969/j.issn.1005-9695.2020.05.008
Lu, M., Shen, S. H., Wang, C. Y., and Li, M. (2011). Initial exploration of maize phenological stage based on image recognition. Chin. J. Agrom. 32 (3), 423–429. doi:10.3969/j.issn.1000-6362.2011.03.017
Ma, B. Y., Liu, C. N., Gao, M. F., Ban, X. J., Huang, H. Y., Wang, H., et al. (2020). Region aware image segmentation for polycrystalline micrographic image using deep learning. Chin. J. Stereology Image Analysis 25 (2), 120–127. doi:10.13505/j.1007-1482.2020.25.02.004
Ma, X., Qi, L., and Zhang, X. C. (2008). Segmentation technology of exserochilum turcicum image based on fuzzy clustering analysis. J. Agric. Mech. Res. (12), 24–26. doi:10.3969/j.issn.1003-188X.2008.12.007
Meyer, G. E., Hindman, T. W., and Laksmi, K. (1999). Machine vision detection parameters for plant species identification. Precision Agric. Biol. Qual. 327–335. doi:10.1117/12.336896
Meyer, G. E., and Neto, J. C. (2008). Verification of colour vegetation indices for automated crop imaging applications. Comput. Electron. Agric. 63 282–293.
Min, L., Gao, K., Li, W., Wang, H. L., Li, T., Wu, Q., et al. (2020). A Review of the optical remote sensing image segmentation technology. Spacecr. Recovery Remote Sens. 41 (6), 1–13. doi:10.3969/j.issn.1009-8518.2020.06.001
Pérez, A. J., López, F., Benlloch, J. V., and Christensen, S. (2000). Colour and shape analysis techniques for weed detection in cereal fields. Comput. Electron. Agric. 25 (3), 197–212. doi:10.1016/S0168-1699(99)00068-X
Purcell, L. C. (2000). Soybean canopy coverage and light interception measurements using digital imagery. Crop Sci. 40 (3), 834–837. doi:10.2135/cropsci2000.403834x
Qiu, B. W., Yan, X. F., Chen, C. C., Tang, Z., Wu, W., Xu, W., et al. (2021). The impact of indicator selection on assessment of global greening. GIScience Remote Sens. 58 (3), 372–385. doi:10.1080/15481603.2021.1879494
Ren, J., Li, Z. N., and Fu, Y. P. (2004). Edge detection of color images based on wavelet and reduced dimensionality model of RGB. J. Zhejiang Univ. Eng. Sci. 38 (7), 856–859. doi:10.3785/j.issn.1008-973X.2004.07.014
Shi, P. H., Wang, Y., Yuan, Z. Q., Sun, Q. Y., Cai, S. Y., and Lu, X. Z. (2020). Estimation of wheat nitrogen nutrition indices in winter wheat based on canopy RGB images. J. Nanjing Agric. Univ. 43 (5), 829–837. doi:10.7685/jnau.202001020
Sulik, J. J., and Long, D. S. (2016). Spectral considerations for modeling yield of canola. Remote Sens. Environ. 184, 161–174. doi:10.1016/j.rse.2016.06.016
Wang, Z. S., Yang, F. Z., Wang, J. G., Li, L., and Liu, Y. (2022). Consistency of FY-3C VIRR-NDVI and Terra MODIS-NDVI products in Hunan and Jiangxi Provinces of China. Sci. Technol. Eng. 22 (11), 4289–4298. doi:10.3969/j.issn.1671-1815.2022.11.004
Wang, C. Y., Guo, X. Y., Wen, W. L., Du, J. J., and Xiao, B. X. (2016). Application of hemispherical photography on analysis of maize canopy structural parameters under natural light. Trans. Chin. Soc. Agric. Eng. 32 (4), 157–162. doi:10.11975/j.issn.1002-6819.2016.04.02
Woebbecke, D. M., Meyer, G. E., Von Bargen, K., and Mortensen, D. A. (1995). Colour indices for weed identification under various soil, residue, and lighting conditions. Trans. ASAE 38, 259–269.
Wu, L. F., Wang, M. G., Fu, H., and Jian, M. (2018). Automatic recognition of cotton growth by combining deep learning based object recognition and image classification. Chin. Sci. Technol. Paper. 13 (20), 2309–2316. doi:10.3969/j.issn.2095-2783.2018.20.005
Wu, Q. (2014). Research on automatic detection of cotton growth stages by image processing technology. Hubei: Huazhong University of Science and Technology. doi:10.7666/d.D411383
Yang, H., Zhao, J., Lan, Y., Lu, L., and Li, Z. (2018). Fraction vegetation cover extraction of winter wheat based on RGB image obtained by UAV. Int. J. Precis. Agric. Aviat. 1 (1), 54–61. doi:10.33440/j.ijpaa.20190202.44
Yuan, D. X. (2008). Global view on Karst rock desertification and integrating control measures and experiences of China. Acta Prataculturae Sin. 25 (9), 19–25. doi:10.3969/j.issn.1001-0629.2008.09.009
Zhao, X. X., Chen, H. X., Han, Y. C., Li, Y. B., and Feng, L. (2021). Crop growth monitoring with digital images: a review. Chin. Agric. Sci. Bull. 37 (4), 146–153. doi:10.11924/j.issn.1000-6850.casb20200300278
Zhou, G. S., and Zhang, X. S. (1996). Feedback of vegetation on climate. J. Integr. Plant Biol. 38 (1), 1–7.
Keywords: ground-based remote sensing, visible light image, image segmentation, vegetation growth, multiple views
Citation: Chen Y, Huang L, Chen C and Xie Y (2025) Vegetation growth monitoring based on ground-based visible light images from different views. Front. Environ. Sci. 12:1439045. doi: 10.3389/fenvs.2024.1439045
Received: 04 June 2024; Accepted: 03 December 2024;
Published: 14 February 2025.
Edited by:
Shuisen Chen, Guangzhou Institute of Geography, ChinaReviewed by:
Kieran T. Wood, The University of Manchester, United KingdomBeata Calka, Military University of Technology in Warsaw, Poland
Copyright © 2025 Chen, Huang, Chen and Xie. This is an open-access article distributed under the terms of the Creative Commons Attribution License (CC BY). The use, distribution or reproduction in other forums is permitted, provided the original author(s) and the copyright owner(s) are credited and that the original publication in this journal is cited, in accordance with accepted academic practice. No use, distribution or reproduction is permitted which does not comply with these terms.
*Correspondence: Yanli Chen, Y3lsMDUwNUBzaW5hLmNvbQ==