 Chi-Jin Choi
94% of researchers rate our articles as excellent or good
Learn more about the work of our research integrity team to safeguard the quality of each article we publish.
Find out more
ORIGINAL RESEARCH article
Front. Energy Res., 16 March 2022
Sec. Nuclear Energy
Volume 10 - 2022 | https://doi.org/10.3389/fenrg.2022.847458
This article is part of the Research TopicCFD Applications in Nuclear EngineeringView all 16 articles
Advances in computational power have enabled the application of computational fluid dynamics (CFD) to nuclear reactor safety analyses, which require accurate predictability for two-phase flow in complex geometries. This study is aimed at validating CFD simulation of liquid film off-take in a 1/10-scale downcomer of a reactor pressure vessel under emergency core coolant (ECC) bypass conditions. Even though different flow regimes can exist simultaneously in real flow, the traditional two-phase flow models used in CFD have a disadvantage with respect to regime dependency. In this study, VOF–slip, which is a hybrid model that combines volume-of-fluid (VOF) and mixture models and is offered in STAR-CCM+ 15.04, was used to simulate the film off-take phenomenon. The key parameters in the simulation were found to be the droplet diameter and interface turbulence damping coefficient. A parametric study was performed to determine the value of the parameters that yield a reasonable liquid film thickness and ECC bypass fraction which were measured at the Seoul National University (SNU) experiment facility. For the conditions of the SNU experiment, the droplet diameter was found to be 150 μm, and the interface turbulence damping coefficient was found to be in the range of 0–30. The validation results confirmed that the VOF–slip model can describe the behavior of the liquid film and the unresolved droplet appropriately. This resulted in an improvement in predicting the ECC bypass fraction in comparison to the results using the conventional VOF model.
Two-phase liquid film flow occurs in various industrial fields, such as chemical and mechanical engineering. In a nuclear power plant, liquid film can appear in several areas, including the reactor core, reactor downcomer, and heat exchanger surface. Liquid films influence heat and mass transfer in two-phase flows. Therefore, investigating the thermal–hydraulic phenomena related to liquid film is an important aspect of nuclear reactor safety analysis.
The field of computational fluid dynamics (CFD) has come to occupy an important position in nuclear reactor safety analyses, which require accurate prediction of the three-dimensional geometric effects of two-phase flow. Many researchers have been conducting the CFD simulation for the fluid flow and heat transfer in fuel assembly, lower plenum, heat exchanger, pressurizer surge line, etc. (Conner et al., 2010; Feng et al., 2019; Khan et al., 2020, 2021; Wang et al., 2021). Small-scale flow processes that are not seen by the reactor system codes can be accessed using CFD, which results in better estimation of safety margins. CFD is therefore an appropriate approach to investigating the liquid film behavior at a reactor vessel (RV) upper downcomer (Figure 1) If a loss-of-coolant accident occurs with a break in a primary coolant system of the pressurized water reactor, the emergency core coolant (ECC) is injected into the RV downcomer through the direct vessel injection (DVI) nozzle. The ECC water impinges on the core barrel wall and flows downward in the form of a liquid film. At the same time, the steam generated in the reactor core by the decay heat flows out through the broken cold leg, and some of the ECC water bypasses out because of the steam flow. In the process of the film off-take, three different forms of the liquid phase can be observed: a liquid film, wisps, and droplets. The more the ECC water bypasses out, the less it contributes to the emergency core cooling. If the liquid flow is insufficient to remove the decay heat, the nuclear fuel rods might be overheated. Therefore, several experimental and analytical studies have been carried out to better understand the ECC bypass mechanism and predict it more accurately (Murao et al., 1982; Bae et al., 2000; Kwon et al., 2003a; Cho et al., 2005; Yang et al., 2017).
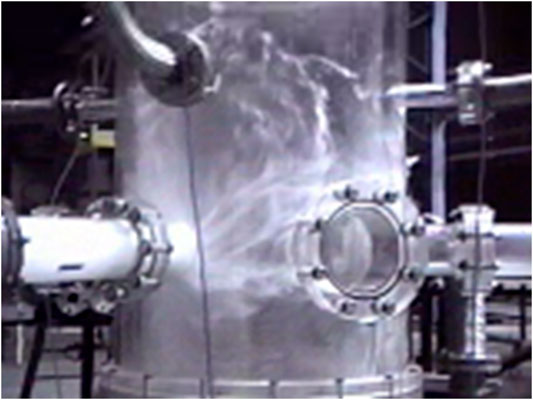
FIGURE 1. ECC bypass phenomenon in RV downcomer (Cho et al., 2005).
Prediction of the ECC bypass phenomenon using a CFD code was first attempted by (Kwon et al., 2003b). The objective of their study was to verify the similarity of the velocity profile in the RV downcomer, which was scaled down based on the modified linear scaling method (Yun et al., 2004). A commercial CFD code, FLUENT ver. 5.5, was used to analyze gas flow characteristics in a full-scale RV downcomer for the APR1400 and at 1/5 scale for the MIDAS test facility. In addition, the spreading phenomenon of the ECC film on the inner wall of the downcomer was simulated using the volume-of-fluid (VOF) model, and it was validated based on experimental results. As a follow-up study, Kwon et al. (2007) showed that CFD analysis could be extended to the two-phase film off-take phenomenon. Using the two-fluid model in the CFX code, the direct vessel injection visualization analysis (DIVA) test (Yun et al., 2000) was simulated and the effect of the azimuthal angle of the DVI nozzle on the ECC bypass was quantified. The predicted ECC bypass fraction was in good agreement with the experimental data for the current DVI azimuthal angle (15°) of APR1400, but it was overestimated for a shifted angle (52°). Yoon et al. (2015) numerically investigated the effects of air-water cross-flow on the advanced DVI (DVI+) system for the new advanced power reactor plus (APR+) design. The performance of the emergency core barrel duct (ECBD) was assessed by predicting the bypass fraction. A homogenous model considering the surface tension and volume fraction at each phase was used to examine the air–water two-phase flow. The CFD analysis results were used to determine the fraction of the ECC water outside the ECBD and form loss factor at the opening of the ECBD for one-dimensional two-phase system code.
As described above, several attempts have been made to investigate the ECC bypass phenomenon using CFD. However, this type of investigation remains challenging for the following reasons. First, in most previous CFD studies, the overall capability of CFD codes to predict the ECC bypass phenomenon was assessed only by comparing the calculation results for global parameters, such as the bypass fraction, with experimental data. This was because of the lack of local measurements of two-phase flow parameters, which prevented the CFD code from being validated sufficiently and limited model improvement. In a previous experimental study of the ECC bypass phenomenon, a DIVA test was carried out by the Korea Atomic Energy Research Institute (KAERI). The test sections at the DIVA facility were 1/7- and 1/5-scale APR1400 RV downcomers, and the two-phase air–water flow near the broken cold leg was investigated. A MIDAS (multi-dimensional investigation in the downcomer annulus simulation) test (Yun et al., 2002) was also conducted by KAERI. This test was similar to the DIVA test, except steam was used as the working fluid rather than air. In both experiments, the film off-take behavior was investigated by the visual observation and by measuring the ECC bypass rate, but the local flow parameters were not obtained. Another test performed at KAERI and Seoul National University (SNU) was a two-dimensional (2-D) air–water film flow experiment (Yang et al., 2015). The experiment was conducted in a 1/10-scale plane channel-type downcomer and focused on the 2-D behavior of the liquid film without considering the film off-take to the broken cold leg. Pitot tubes, a depth-averaged particle image velocimetry method, and an ultrasonic gauge were used to obtain the local air velocity, film velocity, and film thickness, respectively. Although the local parameters were known for the 2-D air–water film flow experiment, they could not be used for the CFD validation because the film off-take by the gas flow was not described in the experiment. The limitations of these previous studies have motivated our previous studies, conducted in the SNU experimental facility (Choi and Cho, 2019), in which the film off-take behavior was investigated using local measurements obtained using the 1/10-scale RV downcomer. An electrical conductance sensor was developed to measure the thickness of the liquid film, and it was fabricated on a flexible printed circuit board, which enabled the sensor to be installed at the curved test section. The developed sensor is an array-type, and is used to measure the field data and adopted the three-electrode method to widen the measurable film thickness range. During the experiment, the local liquid film thickness and ECC bypass fraction were measured, and the values obtained can be utilized for validation of the CFD model.
In addition to the lack of validation data, there has been an issue with two-phase CFD models. Traditional two-phase flow models, such as VOF and the two-fluid model are known for providing relatively reliable outcomes for only either the segregated (VOF) or dispersed (two-fluid model) flow, which is not sufficient for simulating the ECC bypass phenomenon. The STAR-CCM + v13.02 commercial CFD code (Siemens, 2018) introduced VOF–slip as a hybrid model that combines VOF and mixture models and can be applied to large- and small-scale interfaces simultaneously. Because the VOF–slip model has only relatively recently become available in a commercial CFD code, few studies using this model have been reported in literature.
Another challenge in CFD simulation is modeling the turbulence at a large-scale interface. Insufficiently sophisticated modeling of interface turbulence results in unrealistic descriptions of the physical behavior of turbulence near such an interface. For example, according to experimental studies (Fabre et al., 1987; Rashidi and Banerjee, 1990) and direct numerical simulations (Fulgosi et al., 2003), the gas–liquid interface in stratified and annular flows behaves similarly to a solid wall in single-phase flows. To reproduce this wall-like behavior, researchers have made various attempts to dampen the turbulence near the interface so that the turbulence is modeled more realistically at the interface.
The objective of this study was to validate the CFD simulation of the air–water film off-take in the 1/10-scale RV downcomer at the SNU experimental facility. A CFD model implemented in STAR-CCM + v15.04 was used for this purpose. A parametric study was conducted to identify the key parameters for the simulation. As the key parameters, the interface turbulence damping coefficient and droplet diameter were chosen because both are found to be the factors that greatly affect the simulation results, even though they were uncertain values. The effects of the interface turbulence damping coefficient and droplet diameter were investigated in detail. The simulation results were validated using SNU experimental data, including the local liquid film thickness and the ECC bypass fraction. The validation was also conducted to demonstrate best practices for accurate simulation of the liquid film off-take phenomenon.
The VOF model proposed by Hirt and Nichols (1981) is one of the most widely used two-phase CFD models for capturing the interface. In the VOF model, two-phase flows are recognized as homogeneous mixtures consisting of immiscible fluids. The continuous and dispersed phases can be lumped into a single continuum in which they share the same pressure and velocity fields. Therefore, the VOF model is not capable of describing dispersed phase flow in which the interface length is smaller than the mesh size.
The mixture model is applicable to interpenetrated phases which are treated as a mixture in a cell. The mixture model is similar to the VOF model in that it solves a single set of transport equations. However, the model cannot be expected to resolve a sharp interface even on a fine grid, as the VOF does. In addition, the phase slip velocity is considered in the mixture model; hence, the behavior of the dispersed phase, which cannot be captured with a coarse grid, can be properly simulated.
A commercial CFD code, STAR-CCM + v13.02, introduced the VOF–slip model as a hybrid model combining the VOF and the mixture models. This hybrid model can treat a large-scale interface and small-scale interface simultaneously. In the VOF–slip model, the volume fraction transport equation and momentum equation can be expressed as follows:
where
The diffusion velocity and slip velocity,
where p and s denote the primary and secondary phase, respectively. Here, the slip velocity that determines the diffusion velocity can be modeled with a drag coefficient
In STAR-CCM+, the Schiller–Naumann drag model (Schiller and Naumann, 1935) can be used to obtain
where
The wettability of the wall is reflected as a contact angle that is required in VOF-slip model. Because the liquid film is formed at the acrylic test section and the film sensor which surface is made of the polyimide film and gold layer, it was difficult to determine the value of the contact angle. Besides, there are anisotropic surface irregularities due to the electrode arrangement in the sensor, which makes the distortion of the wall friction inevitable. For this reason, in the case of no air injection, the contact angle that can yield a reasonable film spreading width was found to be 0°. However, when the air velocity became large enough to cause an entrainment, it was confirmed that the effect of the contact angle became minor and the gravitational force and the interfacial friction force had a dominant influence on the simulation results.
The diffusion velocity terms in the transport equations of the VOF–slip model (Eqs 1, 2) should not be activated in the gas–liquid interface region, and they should only work effectively in the unresolved dispersed phase. Therefore, a different value of the droplet diameter was used, based on the
where
The variable
Another required condition is that the droplet diameter should be used only when the liquid volume fraction is reasonably large. This condition can be expressed as follows:
where
The
The simulation of the liquid film off-take near the broken cold leg should consider the interface turbulence damping so that the estimated interfacial friction between the gas and liquid phases leads to reasonable predictions of the liquid film behavior and bypass phenomenon. One of the most widely used ways of damping the interface turbulence is to apply the Egorov model (Egorov et al., 2004). The Egorov model is only available with the
where
Thus, determining an appropriate value for
Because the effect of interface turbulence damping is also dependent on the cell height, as shown in Eq. 15, Frederix et al. (2018) introduced a mesh-independent length scale
then the
Using this approach, Frederix simulated a co-current stratified flow in a parametric study of δ, and found that the maximum value of δ was 10–4 m. In the present study, the effect of interface turbulence damping was first investigated in terms of B. Then, an appropriate value of B that yielded reasonable results was converted to δ following the approach used by Frederix.
The test section in the SNU experiment (Choi and Cho, 2019) was modeled as shown in Figure 2A. In the experiment, the test section describes 1/10th scale of APR1400 reactor vessel downcomer. There were two intact cold legs for air intake and a broken cold leg for air–water outtake. The DVI nozzle was placed above the broken cold leg, and water was injected through this nozzle. The liquid film sensor installed at the inner wall of annular test section measured the film thickness in the region between the DVI nozzle and the cold legs. To reduce the computational cost, the lengths of the cold legs and the DVI nozzle were reduced, and the velocity profiles obtained from the fully developed flow were used as inlet boundary conditions. The bottom of the domain was set as a water outlet that controlled the water out flow rate to keep the water level constant.
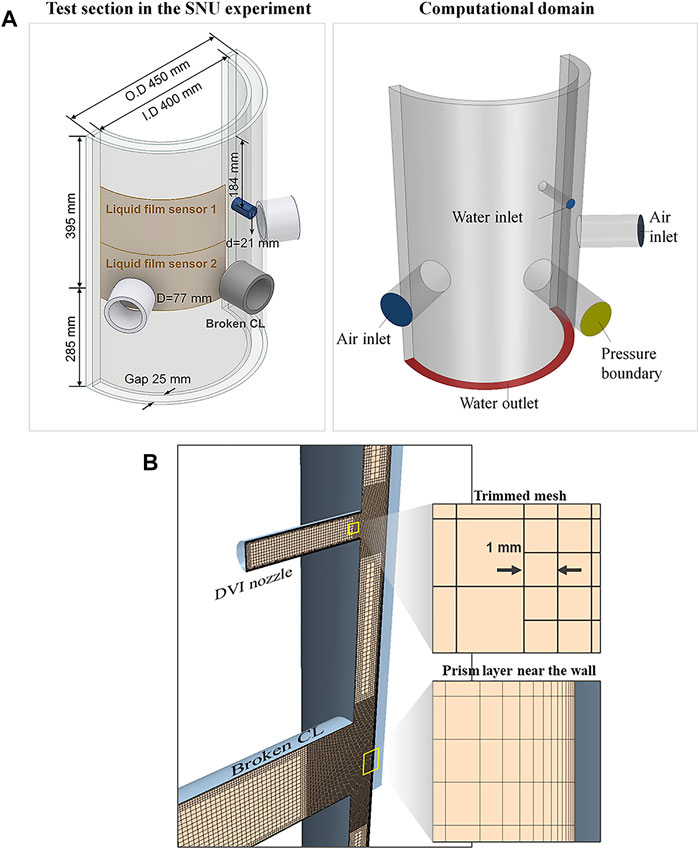
FIGURE 2. (A) Computational domain for CFD simulation. (B) Meshing configuration.
Figure 2B shows the meshing configuration. Trimmed meshes were used, and 13 prism layers were generated near the wall. Considering the requirements of the turbulence model used, the
The flow conditions for the simulations are summarized in Table 1.
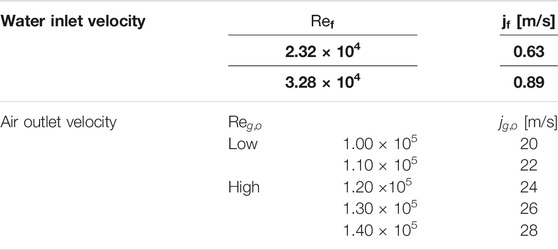
TABLE 1. Simulation conditions.
For the case of no airflow, a transient simulation with a time step of 0.2 ms was conducted, as shown in Figure 3 (W089A00). The time step was determined based on the local Courant number, which should be less than 1.0 for applying the High-Resolution Interface Capturing (HRIC) scheme suited for tracking sharp interfaces. The film interface was expressed by the iso-surface of the void fraction at 0.5. In the simulation, the injected water from the DVI nozzle impinged on the wall and spread in the form of a liquid film. Because the size of a computational cell in CFD is about 70 times smaller than that of a measurement area on the liquid film sensor, it was necessary to spatially average the simulation results for quantitative comparison with the experimental results. Therefore, the calculated film thickness in the areas corresponding to the measurement point on the sensor was extracted and spatially averaged. Then, the averaged thickness was compared with the experimental result and used to validate the CFD simulation.
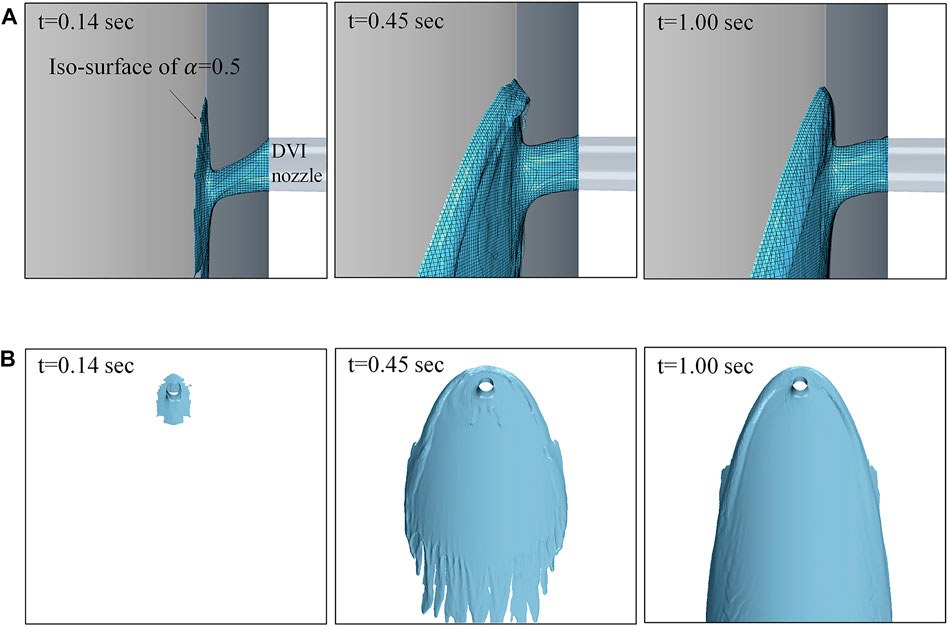
FIGURE 3. Transient simulation under no-airflow condition (W089A00). (A) Water impingement (side view). (B) Liquid film flow (front view).
The front view of the averaged film thickness is compared with the experiment results in Figure 4. It was found that the CFD predicted the position of the thick film boundary and the film distribution reasonably. A quantitative comparison of the liquid film thicknesses is shown in Figure 5A. The film thicknesses were comparable overall, but there were some points at which the liquid film thickness was greatly underestimated (see the area marked in gray). The points at which significant errors occurred are shown in Figure 5B. In the figure, x = 0 corresponds to the center of the broken cold leg, and the peak of the graph appears on the film boundary region. Large discrepancies in film thickness could be seen at positions where the change in the film thickness was large in the film boundary region. Nevertheless, the CFD model predicted the peak value of the film thickness and the position at which the value appears well, which is important for the prediction of the ECC bypass induced by entrainment.
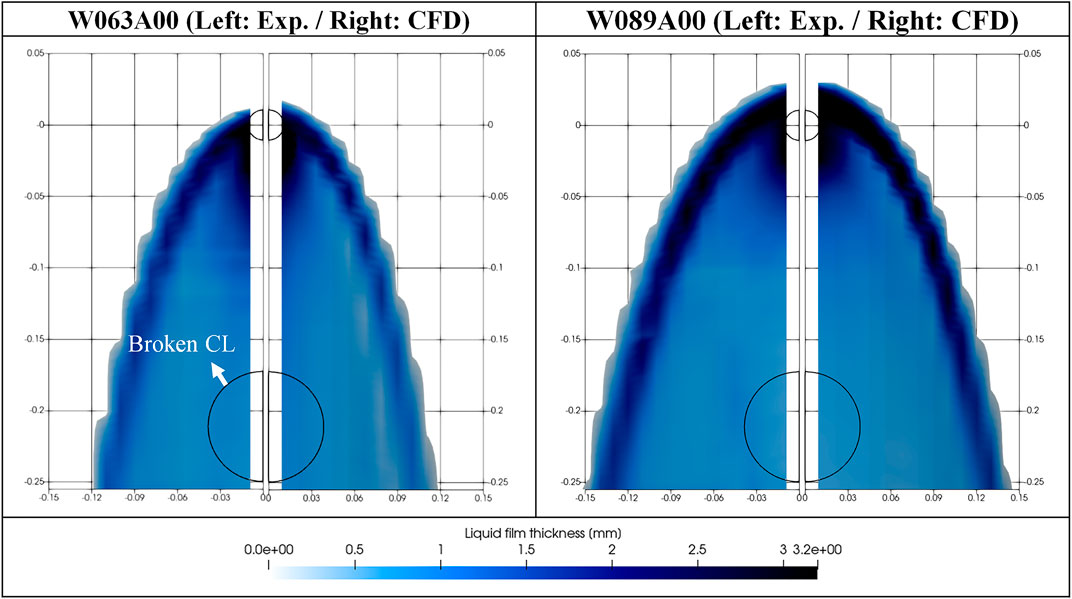
FIGURE 4. Comparison of liquid film distributions.
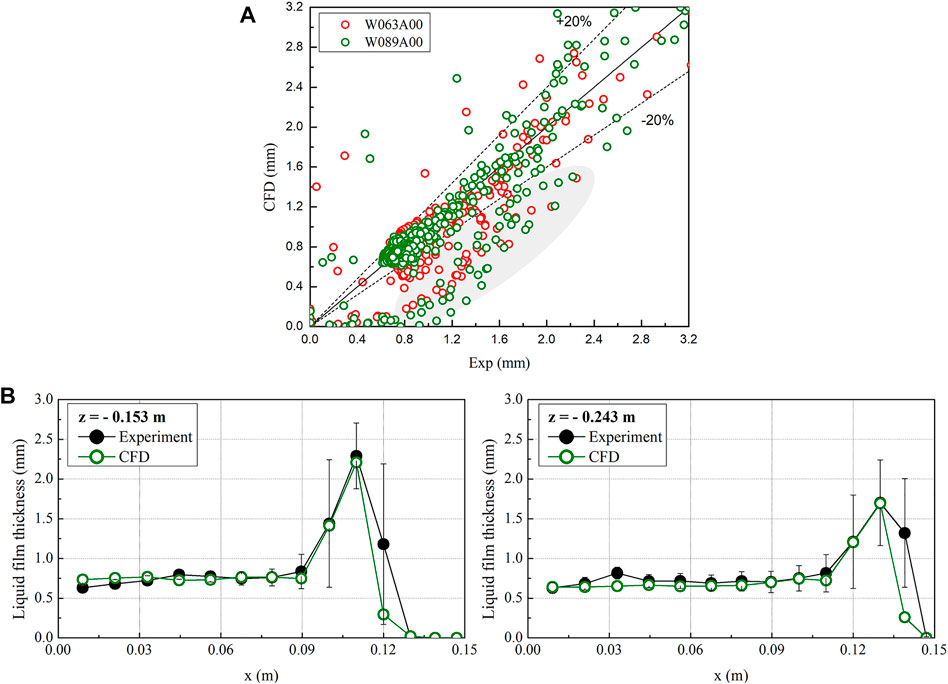
FIGURE 5. (A) Quantitative comparison of liquid film thickness. (B). Large discrepancies in film thicknesses near the film boundary (W089A00).
To confirm the validity of using the current mesh configuration near the wall where the liquid film is formed, the effect of the mesh size on the film thickness prediction was investigated as shown in Figure 6. In the case of a coarse mesh (n = 3), the film thickness was predicted to be thinner than in other cases. When the number of near-wall meshes was greater than 10, the film thickness converged to a specific value. Consequently, taking into consideration the computational cost, the current mesh configuration (n = 13) was judged to be adequate for describing the film behavior.
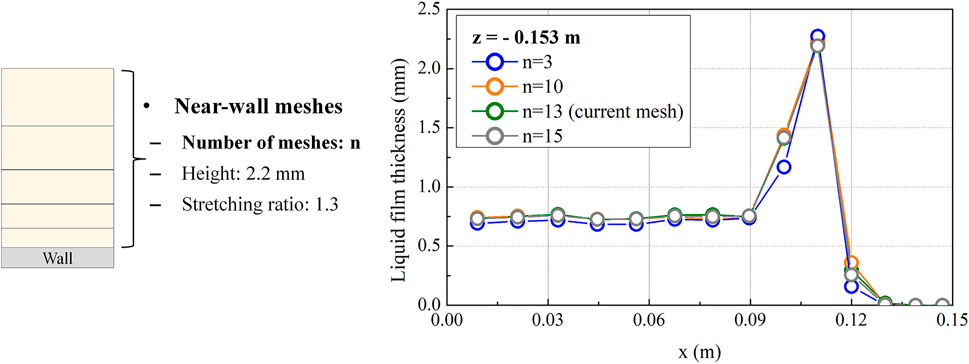
FIGURE 6. Sensitivity test for near-wall meshes.
To simulate the film off-take phenomenon with airflow, the boundary conditions for the two intact cold legs were set as the velocity inlets. Figure 7 shows the streamline of the airflow in the computational domain. The injected air first impinges against the inner wall of the downcomer, and radial airflow is formed near each intact cold leg. Then, the air flows to the broken cold leg, which narrows the spreading width of the liquid film and leads to film off-take.
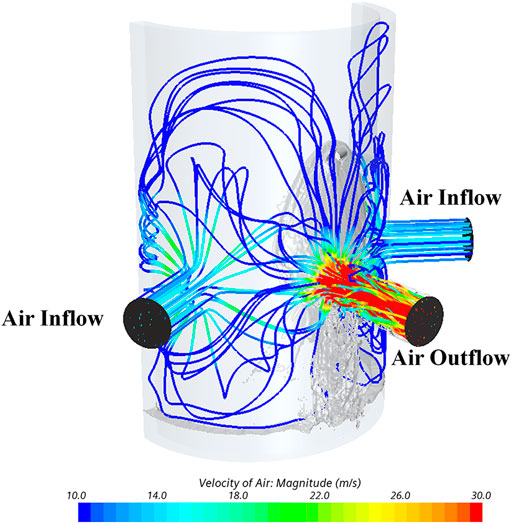
FIGURE 7. Streamline of airflow (W063A26).
The results obtained for the shape of the liquid film were compared with visual observations from the SNU experiment as shown in Figure 8. The visual observations (Figure 8A) show that the flow rate of the liquid film affects how much the film boundary is dragged for a given air flow rate. When the film flow rate is higher, the film boundary is dragged less by the airflow because of the greater momentum of the film flow. As shown in Figure 8B, the CFD simulation also successfully reproduced this film behavior.
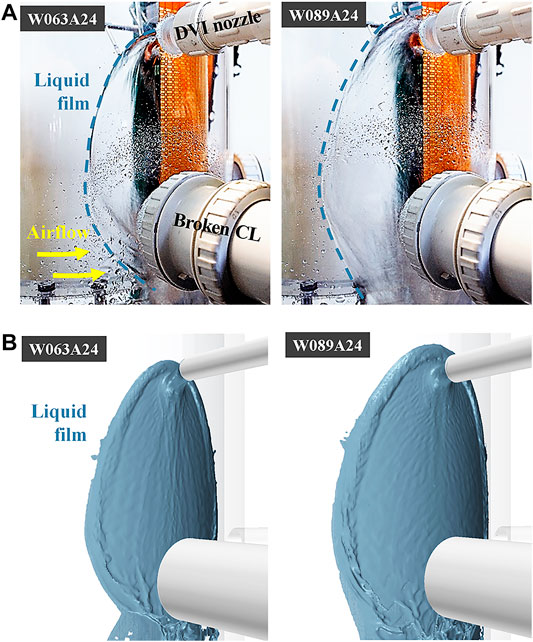
FIGURE 8. Qualitative comparison of liquid film behavior according to CFD and experiment. (A) Experiment. (B) CFD
Based on the simulation results, two mechanisms were found to contribute to ECC bypass, as shown in Figure 9. The first mechanism is the entrainment phenomenon that occurred at the thick film boundary. This mechanism involved the roll wave formed at the thick film being sheared off by the airflow and droplets then being generated from the roll wave. These generated droplets flowed into the broken cold leg with the airflow. If the liquid film boundary spreads farther from the broken cold leg, the bypass rate could be inferred to decrease because the position of the film boundary is related to the distance the droplets must travel toward the break. The second mechanism is the film off-take phenomenon that occurred near the broken cold leg. Under conditions of high airflow, the thick film region appeared near the broken cold leg as the gravitational and interfacial friction forces were balanced, creating a hanging liquid film. This thick film could easily be stretched by the airflow, and wisps in the form of large liquid lumps were generated. Then, the wisps that flowed to the broken cold leg retained their shape or broke up into droplets. These principal mechanisms of ECC bypass detected in the CFD simulation results were also confirmed in a previous experimental study (Choi and Cho, 2002). Thus, it was qualitatively demonstrated that the proposed CFD model can accurately predict the film off-take phenomenon, including the entrainment at the thick film boundary.
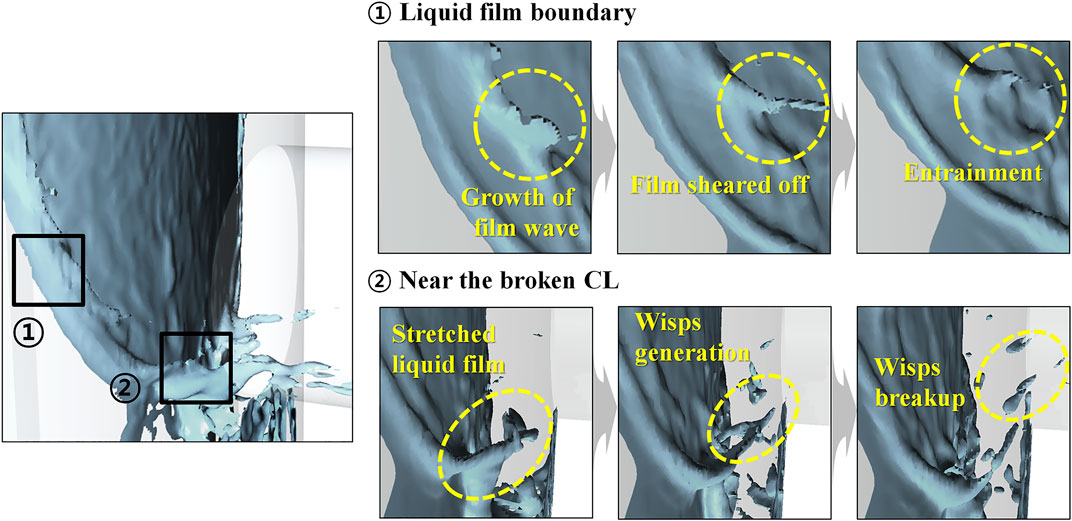
FIGURE 9. Principal mechanisms of ECC bypass phenomenon (W063A24).
As described above, the prediction accuracy of the ECC bypass rate is determined by the behavior of the liquid film and the detached liquid (wisps and droplets). Therefore, further investigations of the parameters that affect the liquid phase behavior by means of quantitative assessment of simulation results are needed.
When airflow toward the broken cold leg occurred, the spreading width of the liquid film became narrower, and entrainment occurred from the liquid film boundary. Under the flow conditions for the simulation, the entrainment started to occur when
Figure 10 shows the variation in the ECC bypass fraction with the droplet diameter. The bypass fraction was obtained from the water injection rate and the water flow rate to the broken cold leg, as follows.
As the droplet diameter increased, the drag coefficient and the phase slip velocity increased according to Eqs 6–10. The increase in the slip velocity indicates the decrease in the velocity of the unresolved droplets. Accordingly, the ECC bypass fraction decreased as the droplet diameter increased. It was confirmed that the bypass fraction was nearly saturated with at droplet diameter of 50 μm. When the VOF model was applied, the bypass fraction was overestimated by more than two times because phase slip was not considered for the dispersed phase flow. Based on fact that a 150 μm droplet diameter in the VOF–slip model yielded reasonable bypass fraction prediction results for this condition, a droplet diameter of 150 μm was used for all simulation cases.
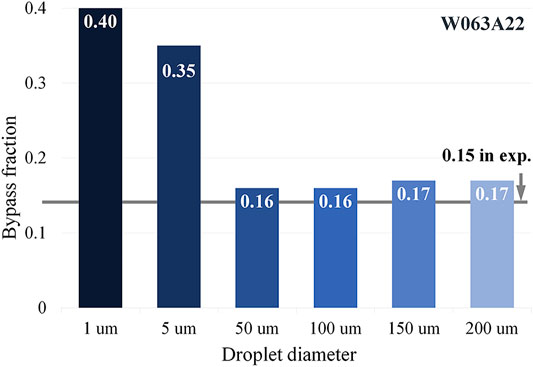
FIGURE 10. Bypass fraction versus droplet diameter (W063A22).
Under high-airflow conditions (
Figure 11A shows snapshots of the film spreading width for different values of B (W063A24). As B increases, the spreading width of the liquid film near the broken cold leg increases because of reduced interfacial friction. As shown in Figure 11B, the CFD model was able to predict the film boundary most comparable to the experiment results for B = 10. In the figure, the dotted white lines indicate the peak position of the film boundary confirmed in the SNU experiment.
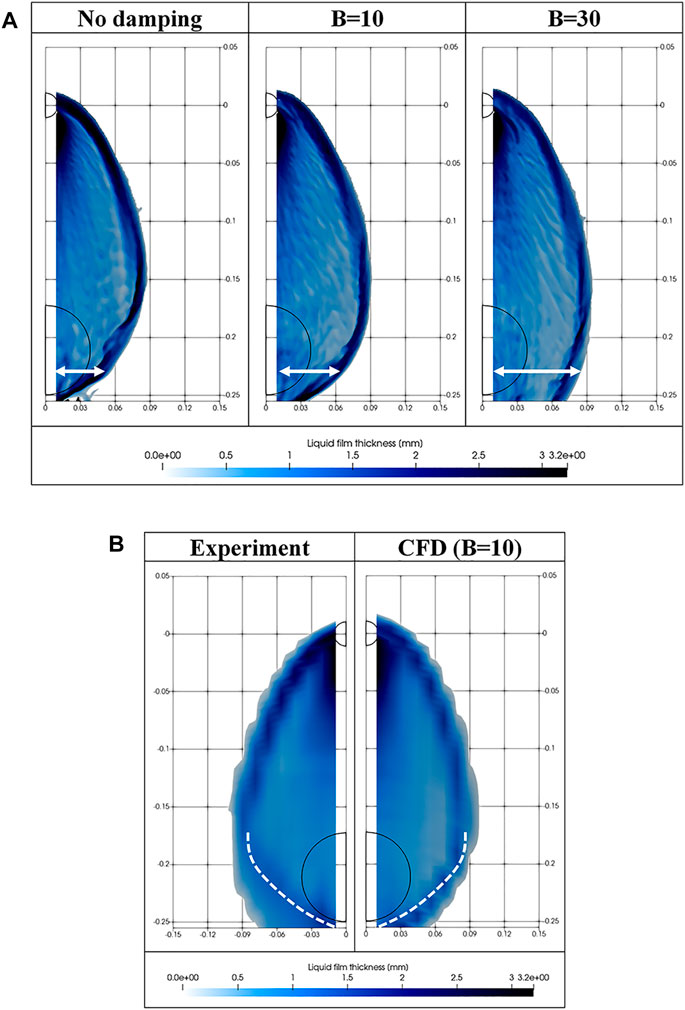
FIGURE 11. (A) Effect of B on spreading width of liquid film (W063A24). (B). Comparison of film boundary position for B = 10 (W063A24).
The effect of B on the bypass fraction is shown in Figure 12A. When the turbulence was not damped at the film interface, the overestimated interfacial friction made the spreading width of liquid film excessively narrow, which caused a large error in predicting the bypass fraction. It should be noted that the calculated bypass fraction for B = 10 was the most comparable to the experiment results. This means that accurate simulation of the free-surface behavior achieved by adopting a suitable B value led to reliable prediction of the bypass fraction as well. The prediction of the film spreading width is directly related to the position at which droplets are generated, as well as the formation of wisp flow around the broken cold leg, as shown in Figure 12B. If an excessive damping effect occurs at B = 30, wisp flow is not generated around the broken cold leg because of the excessively wide liquid film width, and as a result, the bypass rate is reduced.
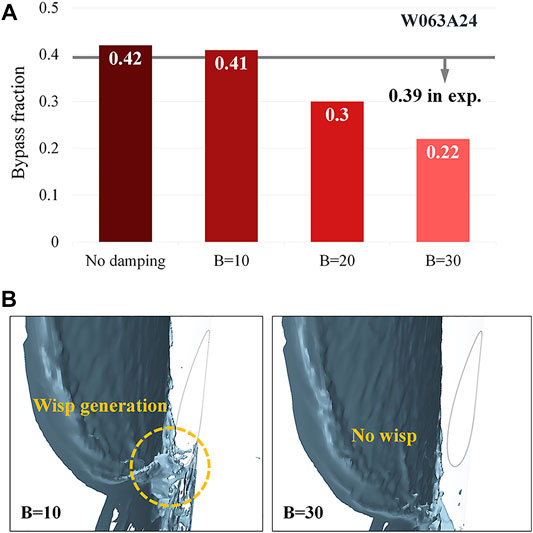
FIGURE 12. (A) Effect of B on bypass fraction (W063A24). (B) Different film off-take phenomena depending on B value (W063A24).
Figure 13 illustrates the calculated bypass fraction for B values of 0, 10, and 30 for each simulation case. The figure shows that the appropriate value of B depends on the flow conditions, which is consistent with the results of previous studies described in Interface Turbulence Damping Section . Under low-airflow conditions, for which the
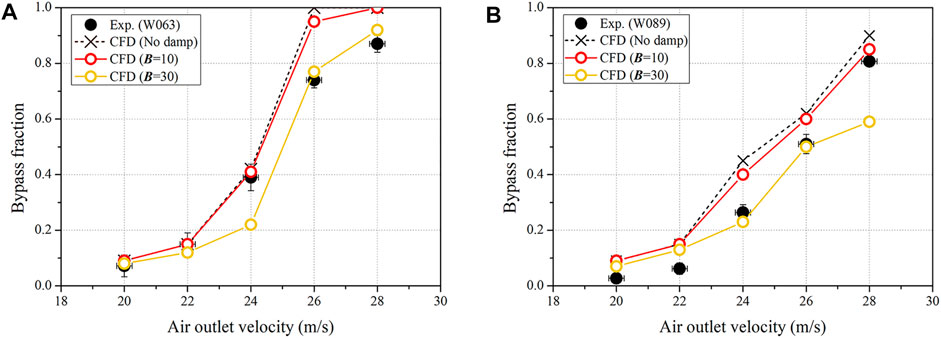
FIGURE 13. (A) vf = 0.63 m/s, (B) vf = 0.89 m/s. Change in bypass fraction with B.
The predicted liquid film width and thickness obtained using a suitable value of B was compared with the experiment results, as shown in Figure 14. Although the spreading width of the liquid film was under-predicted in the CFD simulation, the peak position of the film boundary was comparable. Because entrainment mostly occurs at the thick film, it can be deduced that the accurate prediction of these peak positions results in reliable prediction of the ECC bypass phenomenon by the CFD simulation.
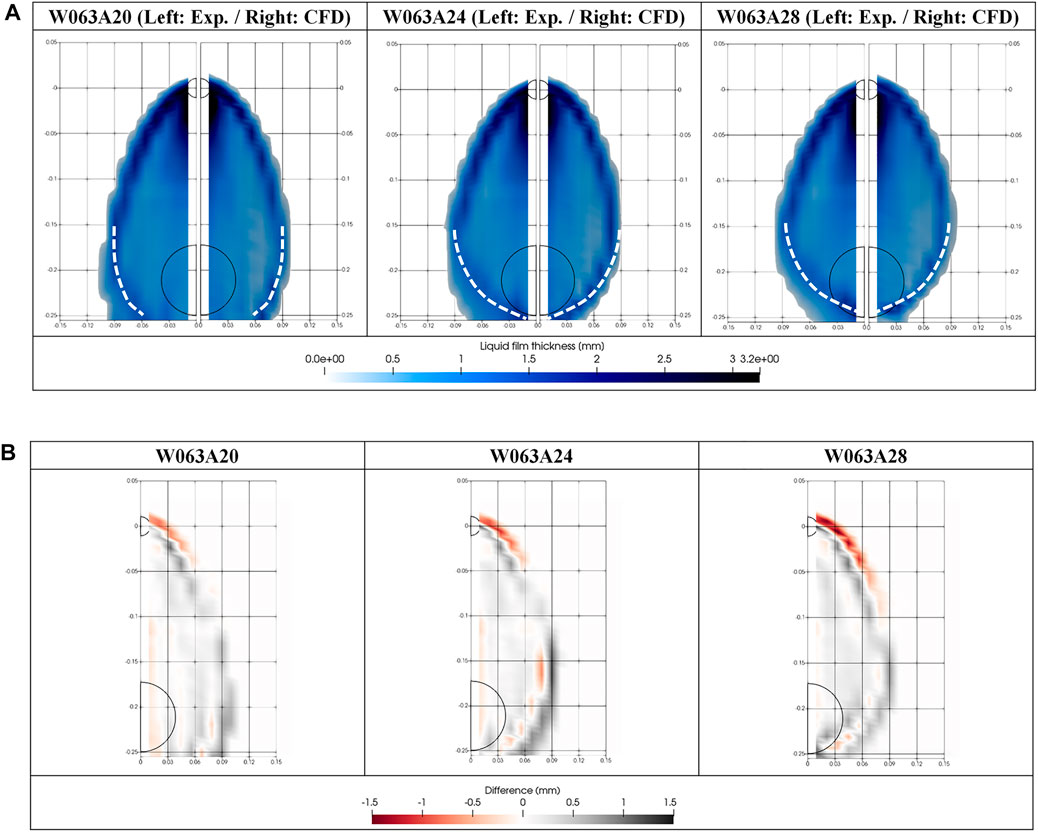
FIGURE 14. (A) Comparison of liquid film thicknesses. (B) Liquid film thickness differences between the experiment and CFD.
The air–water film flow at an RV upper downcomer (SNU experiment) was simulated using the STAR-CCM + code. Using the VOF–slip model, both the free surface flow and dispersed flow could be properly modeled. The key parameters in the simulation were found to be the droplet diameter and the interface turbulence damping coefficient. A parametric study was performed to determine the value of the parameters that would yield a reasonable liquid film thickness and ECC bypass fraction, consistent with that measured in the SNU experiment. The suitable droplet diameter was determined to be 150 μm, and the suitable range for the interface turbulence damping coefficient was found to be from 0 to 30, for the conditions of the SNU experiment. However, because determining B by means of several time-consuming simulations is not ideal, physical modelling of B for various flow conditions is required in future research. The validation results confirm that the VOF–slip model can describe the behavior of the liquid film and unresolved droplets appropriately. This results in an improvement in the accuracy of the prediction of the ECC bypass fraction in comparison to the results obtained using the conventional VOF model. The validation procedures and simulation results in this study demonstrate the applicability of the VOF–slip CFD model to two-phase nuclear reactor safety problems. The local parameters obtained from the CFD simulation can be used to develop physical models for macroscopic tools.
The original contributions presented in the study are included in the article/Supplementary Material, further inquiries can be directed to the corresponding author.
C-JC and HC contributed to conception and design of the study. C-JC carried out the CFD simulation. C-JC and HC contributed to the interpretation of the simulation results. C-JC wrote the first draft of the manuscript. C-JC and HC contributed to manuscript revision, read, and approved the submitted version.
This work was supported by the Nuclear Safety Research Program through the Korea Foundation of Nuclear Safety (KoFONS) with the financial resources granted by the Nuclear Safety and Security Commission (NSSC) of the Republic of Korea (No. 2003005).
The authors declare that the research was conducted in the absence of any commercial or financial relationships that could be construed as a potential conflict of interest.
All claims expressed in this article are solely those of the authors and do not necessarily represent those of their affiliated organizations, or those of the publisher, the editors and the reviewers. Any product that may be evaluated in this article, or claim that may be made by its manufacturer, is not guaranteed or endorsed by the publisher.
Bae, K. H., Kwon, T. S., Chung, Y. J., Lee, W. J., Kim, H. C., and Bae, Y. Y. (2000). “Pre-test Analysis for the KNGR LBLOCA DVI Performance Test Using a Best Estimate Code MARS,” in NTHAS2: Second Japan-Korea Symposium on Nuclear Thermal Hydraulics and Safety, Fukuoka, Japan. Oct. 15-18.
Cho, H. K., Yun, B. J., Song, C.-H., and Park, G. C. (2005). Experimental Study for Multidimensional ECC Behaviors in Downcomer Ann with Direct Vessel Injection Mode during the LBLOCA Reflood Phase. J. Nucl. Sci. Technol. 42 (6), 549–558. doi:10.1080/18811248.2004.9726421
Choi, C.-J., and Cho, H. K. (2019). Investigation on Emergency Core Coolant Bypass with Local Measurement of Liquid Film Thickness Using Electrical Conductance Sensor Fabricated on Flexible Printed Circuit Board Fiexible Printed Circuit Board. Int. J. Heat Mass Transfer 139, 130–143. doi:10.1016/j.ijheatmasstransfer.2019.05.019
Choi, C. J., and Cho, H. K. (2020). Efiect of Asymmetric Airfiow on Liquid Film Behavior and Emergency Core Coolant Bypass in the Downcomer Geometry of a Nuclear Reactor Pressure Vessel. Int. Commun. Heat Mass Transfer 117, 104765. doi:10.1016/j.icheatmasstransfer.2020.104765
Conner, M., Baglietto, E., and Elmahdi, A. (2010). CFD Methodology and Validation for Single-phase Flow in PWR Fuel Assemblies. Nucl. Eng. Des. 240, 31. doi:10.1016/j.nucengdes.2009.11.031
Egorov, Y., Boucker, M., Martin, A., Pigny, S., Scheuerer, M., and Willemsen, S. (2004). Validation of CFD Codes with PTS-Relevant Test Cases. 5th Euratom Framework Programme ECORA Project, 91–116.
Fabre, J., Suzanne, C., and Masbernat, L. (1987). Experimental Data Set No. 7: Stratified Flow, Part I: Local Structure. MultScienTechn 3 285–301. doi:10.1615/multscientechn.v3.i1-4.120
Fan, W., Li, H., and Anglart, H. (2019). Numerical Investigation of Spatial and Temporal Structure of Annular Flow with Disturbance Waves. Int. J. Multiphase Flow 110, 256–272. doi:10.1016/j.ijmultiphaseflow.2018.10.003
Feng, T., Wang, M., Song, P., Liu, L., Tian, W., Su, G. H., et al. (2019). Numerical Research on thermal Mixing Characteristics in a 45-degree T-junction for Two-phase Stratified Flow during the Emergency Core Cooling Safety Injection. Prog. Nucl. Energ. 114, 91–104. doi:10.1016/j.pnucene.2019.03.009
Frederix, E. M. A., Mathur, A., Dovizio, D., Geurts, B., and Komen, E. M. J. (2018). Reynolds-averaged Modeling of Turbulence Damping Near a Large-Scale Interface in Two-phase Flow. Nucl. Eng. Des. 333, 122130. doi:10.1016/j.nucengdes.2018.04.010
Fulgosi, M., Lakehal, D., Banerjee, S., and De Angelis, V. (2003). Direct Numerical Simulation of Turbulence in a Sheared Airwater Flow with a Deformable Interface. J. Fluid Mech. 482, 319–345. doi:10.1017/s0022112003004154
Gada, V. H., Tandon, M. P., Elias, J., Vikulov, R., and Lo, S. (2017). A Large Scale Interface Multi-Fluid Model for Simulating Multiphase Flows. Appl. Math. Model. 44, 189–204. doi:10.1016/j.apm.2017.02.030
Hirt, C. W., and Nichols, B. D. (1981). Volume of Fluid (VOF) Method for the Dynamics of Free Boundaries. J. Comput. Phys. 39 (1), 201–225. doi:10.1016/0021-9991(81)90145-5
Hohne, T., Porombka, P., and Moya Saez, S. (2002). Validation of AIAD Sub-models for Advanced Numerical Modelling of Horizontal Two-phase Flows. Fluids 5, 102. doi:10.3390/fluids5030102
Hurlburt, E., and Hanratty, T. (2002). Measurement of Drop Size in Horizontal Annular Flow with the Immersion Method. Exp. Fluids 32, 692–699. doi:10.1007/s00348-002-0425-8
Kataoka, I., Ishii, M., and Mishima, K. (1983). Generation and Size Distribution of Droplet in Annular Two-phase Flow. J. Fluids Eng. 105 (2), 230–238. doi:10.1115/1.3240969
Khan, I., Wang, M., Abdul Basit, M., Tian, W., Su, G., and Qiu, S. (2021). CFD Modeling of Liquid Entrainment through Vertical T-junction of Fourth Stage Automatic Depressurization System (ADS-4). Ann. Nucl. Energ. 159, 108317. doi:10.1016/j.anucene.2021.108317
Khan, I., Wang, M., Zhang, Y., Tian, W., Su, G., and Qiu, S. (2020). Two-phase Bubbly Flow Simulation Using CFD Method: A Review of Models for Interfacial Forces. Prog. Nucl. Energ. 125, 103360. doi:10.1016/j.pnucene.2020.103360
Kwon, T.-S., Choi, C.-R., and Song, C.-H. (2003a). Three-dimensional Analysis of Flow Characteristics on the Reactor Vessel Downcomer during the Late Reflood Phase of a Postulated LBLOCA. Nucl. Eng. Des. 226, 255–265. doi:10.1016/s0029-5493(03)00181-x
Kwon, T.-S., Yun, B.-J., Euh, D.-J., Chu, I.-C., and Song, C.-H. (2003b). Multidimensional Mixing Behavior of Steam-Water Flow in a Downcomer Annulus during LBLOCA Reflood Phase with a Direct Vessel Injection Mode. Nucl. Technol. 143 (1), 57–64. doi:10.13182/nt03-a3397
Kwon, T. S., Choi, N. H., and Song, C. H. (2007). A Feasibility of a CFD Simulation for an ECC Bypass. PyeongChang, Korea: Transactions of the Korean Nuclear Society Autumn Meeting.
Lo, S., and Tomasello, A. (20102010). Recent Progress in CFD Modelling of Multiphase Flow in Horizontal and Near-Horizontal Pipes. Banff: Canada. Paper presented at the 7th North American Conference on Multiphase Technology.
Menter, F. R. (1994). Two-equation Eddy-Viscosity Turbulence Models for Engineering Applications. AIAA J. 32 (8), 1598–1605. doi:10.2514/3.12149
Murao, Y., Akimoto, H., Sudoh, T., and Okubo, T. (1982). Experimental Study of System Behavior during Reflood Phase of PWR-LOCA Using CCTF. J. Nucl. Sci. Technol. 19 (9), 705–719. doi:10.1080/18811248.1982.9734205
Rashidi, M., and Banerjee, S. (1990). The Effect of Boundary Conditions and Shear Rate on Streak Formation and Breakdown in Turbulent Channel Flows. Phys. Fluids A: Fluid Dyn. 2, 1827–1838. doi:10.1063/1.857656
Schiller, L., and Naumann, Z. (1935). A Drag Coefficient Correlation. Zeit Ver. Deutsch. Ing. 77, 318–320.
Tatterson, D. F., Dallman, J. C., and Hanratty, T. J. (1977). Drop Sizes in Annular Gas-Liquid Flows. Aiche J. 23, 68–76. doi:10.1002/aic.690230112
Wang, M., Wang, Y., Tian, W., Qiu, S., and Su, G. H. (2021). Recent Progress of CFD Applications in PWR thermal Hydraulics Study and Future Directions. Ann. Nucl. Energ. 150, 107836. doi:10.1016/j.anucene.2020.107836
Westende, J. M. C. (2008). Droplets in Annular-Dispersed Gas-Liquid Pipe-Flows, PhD Thesis. The Netherlands: Delft University of Technology TUDelft.
Yang, J.-H., Cho, H.-K., Kim, S., Euh, D.-J., and Park, G.-C. (2015). Experimental Study on Two-Dimensional Film Flow with Local Measurement Methods. Nucl. Eng. Des. 294, 137–151. doi:10.1016/j.nucengdes.2015.07.073
Yang, J.-H., Choi, C.-J., Cho, H.-K., Euh, D.-J., and Park, G.-C. (2017). Assessment of wall Friction Model in Multi-Dimensional Component of MARS with Air-Water Cross Flow experiment. Nucl. Eng. Des. 312, 106–120. doi:10.1016/j.nucengdes.2016.06.018
Yoon, D.-H., Bang, Y. S., and Cheong, A.-J. (2015). CFD Analysis of Effects of Cross Flow on Water Injection of DVI+. Ann. Nucl. Energ. 80, 172–177. doi:10.1016/j.anucene.2015.02.009
Yun, B. J., Cho, H. K., Euh, D. J., Song, C.-H., and Park, G. C. (2004). Scaling for the ECC Bypass Phenomena during the LBLOCA Reflood Phase. Nucl. Eng. Des. 231, 315–325. doi:10.1016/j.nucengdes.2004.04.005
Yun, B. J., Kwon, T. S., Euh, D. J., Chu, I. C., Park, W. M., Song, C. H., et al. (2002). Direct ECC Bypass Phenomena in the MIDAS Test Facility during LBLOCA Reflood Phase. J. Korean Nucl. Soc. 34, 421–432. doi:10.1115/icone10-22224
Yun, B. J., Kwon, T. S., Song, C. H., Euh, D. J., Park, J. K., Cho, H. K., et al. (2000). Air/Water Test on Direct ECC Bypass during LBLOCA Reflood Phase of KNGR, 2000 KNS Autumn Meeting. Daejeon, Korea: Korea Nuclear Society.
Zaidi, S. H., Altunbas, A., and Azzopardi, B. J. (1998). A Comparative Study of Phase Doppler and Laser Diffraction Techniques to Investigate Drop Sizes in Annular Two-phase Flow. Chem. Eng. J. 71, 135–143. doi:10.1016/s1385-8947(98)00125-9
Subscript
Keywords: volume-of-fluid-slip model, multi-regime, droplet diameter, interface turbulence damping, emergency core coolant bypass
Citation: Choi C-J and Cho HK (2022) Numerical Investigations of Liquid Film Offtake by Transverse Gas Flow in a Downcomer Annulus Geometry. Front. Energy Res. 10:847458. doi: 10.3389/fenrg.2022.847458
Received: 02 January 2022; Accepted: 28 February 2022;
Published: 16 March 2022.
Edited by:
Victor Petrov, University of Michigan, United StatesReviewed by:
Mingjun Wang, Xi’an Jiaotong University, ChinaCopyright © 2022 Choi and Cho. This is an open-access article distributed under the terms of the Creative Commons Attribution License (CC BY). The use, distribution or reproduction in other forums is permitted, provided the original author(s) and the copyright owner(s) are credited and that the original publication in this journal is cited, in accordance with accepted academic practice. No use, distribution or reproduction is permitted which does not comply with these terms.
*Correspondence: Hyoung Kyu Cho, chohk@snu.ac.kr
Disclaimer: All claims expressed in this article are solely those of the authors and do not necessarily represent those of their affiliated organizations, or those of the publisher, the editors and the reviewers. Any product that may be evaluated in this article or claim that may be made by its manufacturer is not guaranteed or endorsed by the publisher.
Research integrity at Frontiers
Learn more about the work of our research integrity team to safeguard the quality of each article we publish.