 Li Yabing
- 1China Nuclear Power Research Institute, Shenzhen Science and Technology Building, Shenzhen, China
- 2College of Physics and Optoelectronic Engineering, Shenzhen University, Shenzen, China
The CYCAS code is a 3D CFD code developed independently by the China Nuclear Power Research Institute, aiming at hydrogen safety analysis in containments. In order to equip the CYCAS code with the capability of combustion analysis, a combustion model is screened and developed, and validated with two cases from International Standard Problems. Then a combustion analysis is conducted with a containment to demonstrate the capability of CYCAS to evaluate the pressure and thermal load of combustion. Firstly, the mature and widely-used combustion model, i.e., the Burning Velocity Model (BVM) with Zimont correlation is developed for the CYCAS code in this study. Thereafter, the lamiar flame speed correlation for CYCAS is screened based on the containment atmospheric condition during the accidents. Then, two cases from the THAI facility are calculated to validate the model. The results show that the combustion model in CYCAS manages to have reasonable prediction on the slow deflagration for the gas mixture both with and without steam. Finally, a containment combustion analysis is conducted with the initial hydrogen distribution calculated from a postulated accident. The analysis shows that the CYCAS manages to calculate the pressure and thermal load of the combustion to evaluate the influence of the combustion on the containment integrity and equipment survivability.
1 Introduction
Hydrogen is generated by coolant-cladding interaction during severe accident of nuclear reactors, then it is released to the containment through breaks or valves leading to the flammable gas mixture in containments that may challenge the containment integrity (NEA, 2014). Hence, the combustion analysis should be conducted to demonstrate that the containment integrity is maintained during sever accidents for the containment safety analysis (Dimmelmeier et al., 2012). In the early safety analysis, the combustion analysis of the containment was conducted by one-dimensional lumped parameter codes, whose limitations were gradually recognized with the deepening of the research. Combustion analysis in the containment with the CFD method was gradually applied to the safety analysis for different nuclear power plants (Dimmelmeier et al., 2012; Xiao et al., 2017; Kang et al., 2020; Zhao et al., 2022).
The CYCAS code is a three-dimensional (3D) CFD code developed independently by the China Nuclear Power Research Institute (Chen et al., 2016). The main objective of this code is to conduct analysis related to the hydrogen safety issues of the containment, namely, release, dispersion, and mitigation. While the combustion model is not included in the previous version of the CYCAS model, in order to equip the CYCAS code with the ability of combustion analysis, the combustion model is screened and developed for the CYCAS code in this study. The combustion model is screened based on the typical combustion regime and the typical atmospheric conditions in the containment during an accident. Goulier et al. (2016) has identified the combustion regime for the typical pressurized water reactor (PWR) as shown in Figure 1. The typical atmospheric condition in the containment during an accident includes the following characteristics:
(1) There is a large amount of steam due to the loss of coolant at high pressure and temperature;
(2) the gas mixture is heated and pressurized by several bars due to the previous reason; and
(3) lean hydrogen: the global hydrogen concentration in the containment should not exceed 10 vol% for large dry containment for PWRs according to the safety regulations.
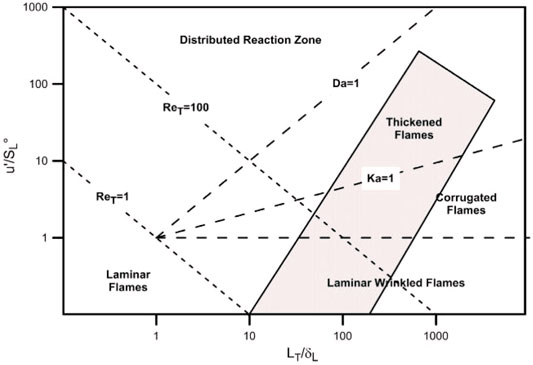
FIGURE 1. Combustion regime for typical PWRs (light gray).
Hydrogen combustion in the containment has drawn the attention of researchers and scholars in the world for decades, especially after the hydrogen explosion in the Fukushima accident in 2011. Experimental and numerical research has been conducted extensively focusing on different combustion regimes, namely, deflagration (NEA, 2011; Yuen et al., 2022), flame acceleration (Studer et al., 2013), and detonation (Kuznetsov et al., 2015), for the last decades. The research of International Standard Problem 49 (ISP-49) on the hydrogen combustion project has conducted validations for many codes and models for hydrogen combustion both openly and blindly and shows that the combustion models with the burning velocity model (BVM) demonstrate reasonable performance (NEA, 2011). Sathiah et al. (2012) developed a BVM with Zimont correlation and validated it using several experiments with the frame of commercial code Ansys Fluent and achieved reasonable predictions. Furthermore, the validation diagram for the BVM with Zimont correlation (Zimont, 2000a) can envelop the typical combustion regime shown in Figure 1. Therefore, the BVM with Zimont correlation, which is a mature and widely used combustion model, is adopted in CYCAS code for the safety analysis of containment.
Laminar flame speed is required in the basic formation of the Zimont correlation, which is calculated with the empirical correlations associated with atmospheric parameters, such as the stoichiometric ratio, steam concentration, temperature, and pressure. Many codes (NEA, 2011) for nuclear safety analysis use the Koroll correlation (Liu and Macfarlane, 1983) and Liu correlation (Koroll et al., 1993). However, the lower validation limits of the hydrogen concentration for these two correlation equations are 9 vol% (Liu and Macfarlane, 1983) and 18 vol% (Koroll et al., 1993), respectively. This means that these two correlation equations will have large uncertainties for the lean hydrogen combustion calculations in the range of hydrogen concentrations concerned with the containment safety analysis. In a more recent research, Szabó et al. (2012) presented a group of data from the INSFLA code which are validated for a stoichiometric ratio lower than 0.1252, equivalent to 4.96 vol% H2 for dry air. In another study, Hu et al. (2009) conducted an empirical correlation for laminar flame speed at different formations through experimental studies. The lamiar speed correlation for CYCAS is screened based on the range of the containment atmosphere during accidents.
In this study, the BVM with Zimont correlation is developed for the CYCAS code and is validated with two experimental tests from the ISP report. Then a containment combustion analysis is conducted with the initial hydrogen distribution calculated from a postulated accident. Both pressure and thermal load of the combustion is calculated to evaluate the influence on the containment integrity and equipment survivability. This study is conducted as follows: Section 2 introduces the CYCAS code briefly; Section 3 gives the combustion model and its validation; in Section 4, the combustion analysis for a containment is presented such as the modeling and combustion calculation; and the main conclusions are drawn in Section 5.
2 CYCAS
2.1 Transport Equations
The CYCAS code solves transient 3D Navier–Stokes (N-S) equations. The conservation equations are listed below:
where
The secondary order accuracy discrete scheme, i.e., van Leer MUSCL algorithm is adopted. The all-speed implicit method, i.e., Implicit Continuous Eulerian–Arbitrary Lagrangian Eulerian (Hirt et al., 1997), is adopted to solve the transport equations. The detailed information on the transport equations of CYCAS can be found in Chen et al. (2016).
2.2 Physical Models
2.2.1 Convective Heat Transfer Model
The convective heat transfer model in CYCAS is the Reynold analogy extended by Colburn for a wider application range of the Pr number, and the heat transfer coefficient of convection is given in Eq. 5:
where
2.2.2 Passive Automatic Recombination Model
The Passive Automatic Recombination (PAR) is equated in the containment to mitigate the hydrogen risk during a severe accident. The calculation of the recombination rate and chemical heat is modeled in CYCAS with the empirical correlation of the Siemens model (Kotouc, 2011) (Eq. 6). Please note that the PAR is neglected during combustion because the hydrogen-consuming rate for the combustion is far greater than for the PAR.
where
2.3 Code Validation
The models for the phenomenon that are relevant to hydrogen safety in the containment are validated with both domestic and international projects, namely the turbulence, convection, and condensation model, as listed in Table 1. Two validation cases, the HyJet test on the BMC facility and the ISP-23 test on the HDR facility are presented in Chen et al. (2016). The other tests are included in the internal reports. Figure 2 gives the geometry models and comparison between the experimental data of the three cases, i.e., OECD SETH Test 9, PANDA HYMERES, and H2PAR, the experimental details of which can be found in Auban et al. (2007), Mimouni et al. (2011), and Paladino et al. (2014), respectively.
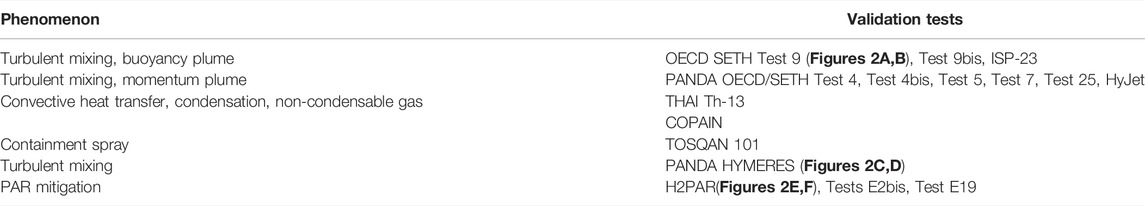
TABLE 1. Validation table for CYCAS.

FIGURE 2. Validation cases of CYCAS. (A) PANDA OECD/SETH Test 14 (Auban et al., 2007) modeling. (B) PANDA OECD/SETH Test result. (C) PANDA HYMERES (Paladino et al., 2014) modeling. (D) PANDA HYMERES Test result. (E) HYPAR (Mimouni et al., 2011) -modeling. (F) HYPAR Test result.
3 Combustion Model and Validation
3.1 Burning Velocity Model
The BVM describes the development of the flame with the combustion process variable
where
where
The terms of
Stoichiometric ratio
Temperature [300 K, 523 K];
Steam concentration [0, steam inerting); and
Pressure (0.1∼8 MPa).
The spark ignition is modeled as an external source term to the transport equation of
where
3.2 ISP-49 THAI HD-12 and HD-22
The geometry model of the THAI facility is built in cylindrical coordination, with the computational region radius of 1.6 m and height of 9.2 m, as shown in Figure 3. The structure is modeled with four layers with different materials for each layer according to NEA (2011). The models of convective, condensation, and radiation heat transfers are calculated for the heat loss on the structure surface. Two cases from the THAI facility (NEA, 2011) are calculated, one is the HD-12 test without steam, and the other is the HD-22 test with steam.
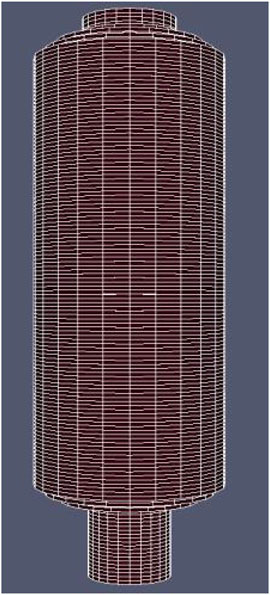
FIGURE 3. THAI facility and modeling.
The initial conditions are listed as follows (NEA, 2011):
HD-12: atmospheric pressure at 1.485 bar, gas temperature at 291 K, hydrogen at 7.98 vol%.
HD-22: atmospheric pressure at 1.487 bar, gas temperature at 365 K, hydrogen at 9.90 vol%, steam at 25.3 vol%.
The ignition is located at 0.7 m from the bottom of the facility. The initial turbulence condition is set as
Firstly, a mesh sensitivity analysis is conducted with three cases with meshes of 35 × 24 × 292, 35 × 24 × 146, and 16 × 24 × 73 grids. The result shows that the first two cases are in accord with each other, while the third case underestimates the peak pressure when compared with the first two cases as shown in Figure 5. Therefore, the second mesh, which is 35 × 24 × 146 grids in radial, peripheral, and axial directions, respectively, with a total mesh number of 122,640 is used for the next HD-22 analysis.
The r-z view of the temperature at 2 s after the ignition is shown in Figure 4 The pressure and flame position are compared with the experimental data as shown in Figures 5, 6. Figure 5 shows that the peak pressure is overestimated in the CYCAS calculation. The pressure decreases at a smaller slope after the peak, indicating that the heat loss of the structure is underestimated. This could be the reason of the overestimation of the peak pressure. The combustion model in CYCAS overestimates the flame speed in both cases: it takes about 5.8 s to reach the ceiling in the experiment, while the time duration is 4.73 s in the CYCAS calculation for the HD-12 calculation. It takes about 3.9 s to reach the ceiling in the experiment, while the time duration is 4.56 s in the CYCAS calculation for the HD-22 calculation. The same overestimates also occur in the FLUENT calculation for HD-12 in the study by Sathiah et al. (2016), as well as the calculation for HD-22 in NEA (2011). This is mainly due to the model limitation on the flame development from the laminar flame to turbulent flame (NEA, 2011). Despite this limitation, the combustion model in CYCAS manages to have reasonable prediction on the slow deflagration for gas mixture, both with and without steam.
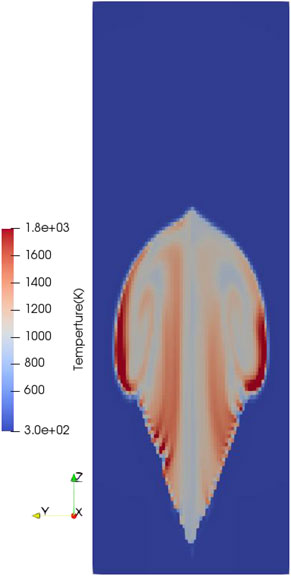
FIGURE 4. Development of the flame (800 K iso-surface) THAI HD-12 CYCAS calculation.
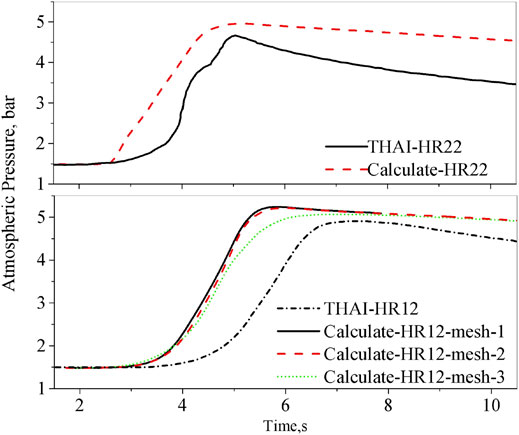
FIGURE 5. Atmospheric pressure calculation vs. experiment.

FIGURE 6. Flame position calculation vs. experiment.
4 Slow Deflagration Analysis for Containment
The model is adopted for a slow deflagration analysis in a containment as engineering application. The main objective of the combustion analysis for the containment includes two parts: the pressure load evaluation from combustion for the containment integrity and the thermal load evaluation for the surrounding structures for equipment survivability. The analysis in this section focuses on these two objectives.
4.1 Modeling
4.1.1 Geometry Modeling
The containment of the reference reactor has an inner radius of 22.5 m and height of 66.4 m. The geometry model is built under cylindrical coordination, namely the major equipment and floors, ceilings, and walls for the compartments, while small objects below the grid resolution are neglected. The geometry model is divided into 26 × 72 × 70 in the radial, peripheral, and axial directions, respectively, with a total mesh number of 524,160. The diagram of the geometry model is shown in Figures 7A,B. The mesh sensitivity analysis has been done to demonstrate the grid independence of this containment model.
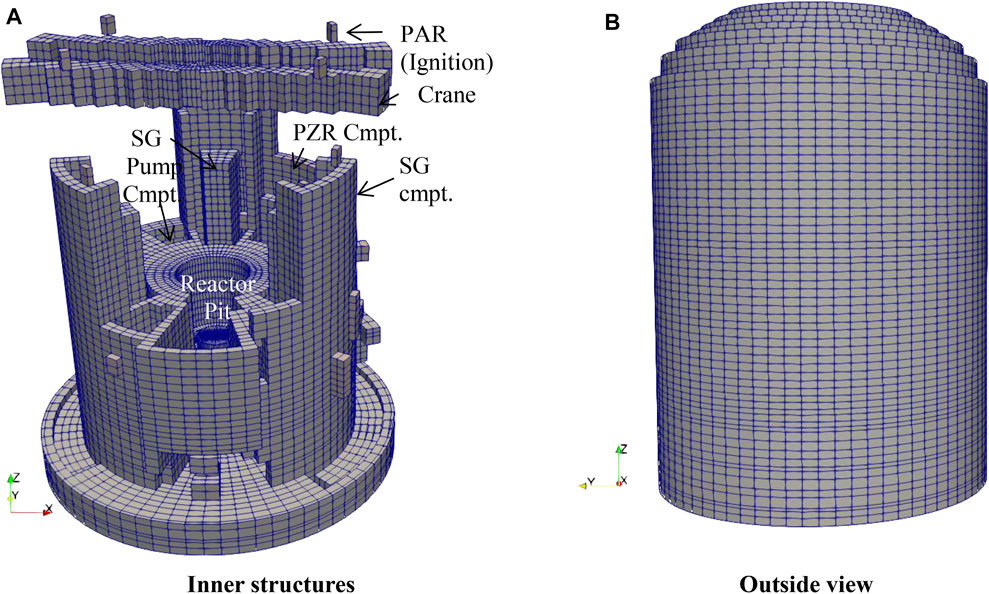
FIGURE 7. Containment geometry modeling. (A) Inner structures. (B) Outside view.
4.1.2 Initial and Boundary Condition
The initial condition of the gas mixture is calculated by CYCAS with the mass and energy release obtained from the lumped parameter code (given in Figure 8). The standard k-ε model is adopted in this analysis. For the geometry structures, the convective, condensation, and radiant heat transfers are included. PARs are included to recombine hydrogen during the hydrogen distribution calculation.
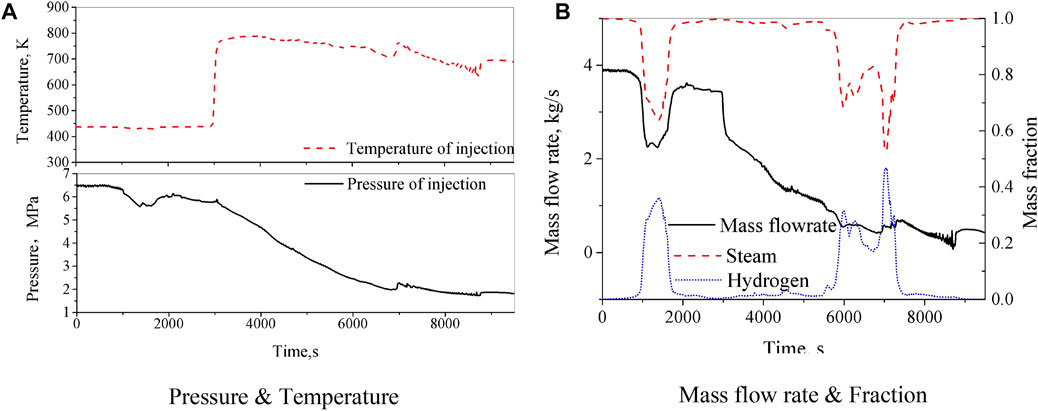
FIGURE 8. Mass and energy release of the injection. (A) Pressure and temperature. (B) Mass flow rate and fraction.
Figures 9, 10 gives the initial hydrogen and steam distribution at the time of ignition. The injection in the calculated postulated accident located at the top of the pressurizer, approximately 22 m in the containment, leading to a hydrogen stratification near the elevation of the injection, is shown in Figure 9.
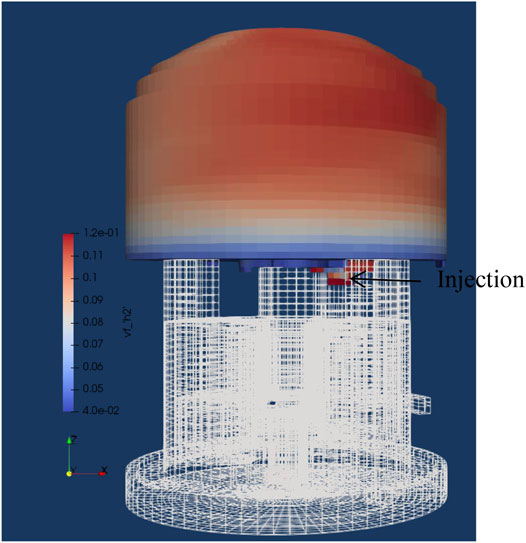
FIGURE 9. Hydrogen distribution before ignition.

FIGURE 10. Steam distribution before ignition.
The selection of the timing and location of the ignition aims at the most punishing combustion consequence. The time point at the maximum hydrogen inventory is chosen for the combustion analysis. The combustion is assumed to be ignited by the hot exhaust gas from the PAR located at the crane (shown in Figure 7A) for two reasons. First, it is the high hydrogen concentration at the dome of the containment, and the gas mixture is more likely to be ignited by the hot exhaust gas from the PAR. The second is that the combustion near the containment structure can result in high thermal load. The initial condition of the gas mixture is summarized as follows:
Atmosphere: pressure at 1.83 bar; temperature at 366.5 K, and average H2O concentration at 38 vol%.
Hydrogen: H2 mass at 503 kg and average H2 concentration at 10.5 vol%.
4.2 Combustion Analysis
4.2.1 Global Thermal Hydraulics of the Containment
The temperature distribution at different time points is given to illustrate the flame propagation, as shown in Figure 11. The global atmospheric pressure and temperature are given in Figure 12. The global pressure and temperature rise fast in the first 2 s, then the growth rate decreases. This is because the flame propagates upward at the first 2 s after being ignited, and then propagates downward with lower speed after being blocked by the containment ceiling. The combustion lasts about 24 s with 439 kg of H2 consumed. The peak values of pressure and temperature are achieved at 21 s after ignition, with values of 3.17 bar and 659 K, respectively. As a comparison, the pressure and temperature of Adiabatic Isochoric Complete Combustion are 4.97 bar and 1035 K, respectively. The peak pressure is within the range that the containment can withstand, such that the integrity of the containment will not be challenged, while the peak gas temperature is higher than the design temperature of the containment. This does not indicate the thermal load that challenges the containment integrity because the combustion duration is short and the thermal response needs time to build up. The thermal load of containment structures is presented in the following section.
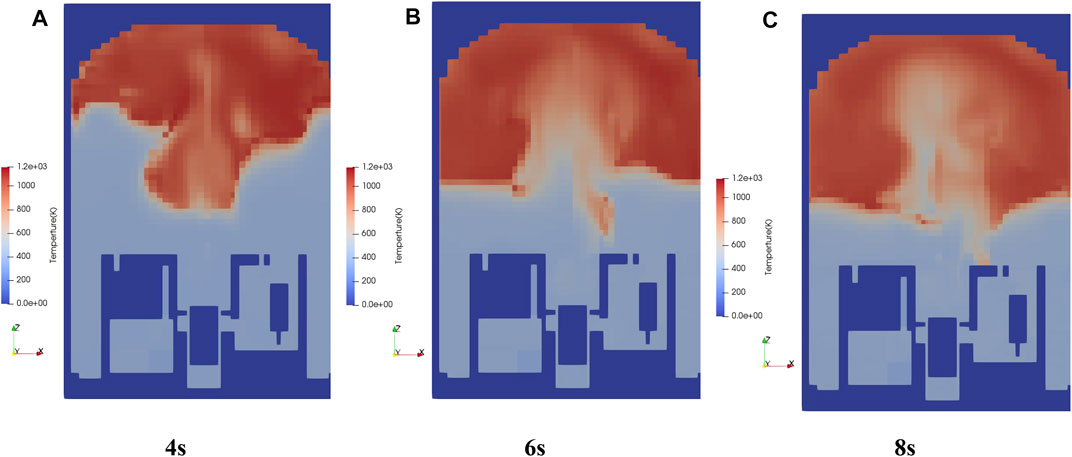
FIGURE 11. Temperature distribution after ignition. (A) 4 s, (B) 6 s, and (C) 8 s.
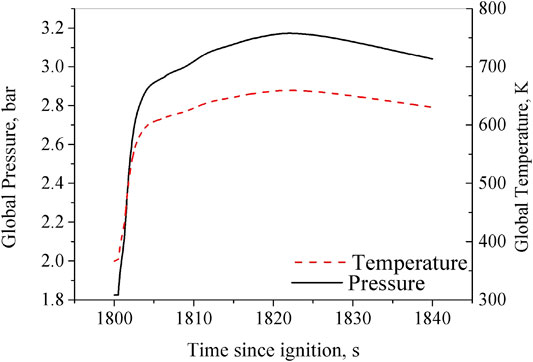
FIGURE 12. Global pressure and temperature after the ignition.
In this calculation, the turbulence is at a low level because hydrogen is released from breaks to the local compartment first, then disperses into the large space of the containment through junctions on the structures. There are also few complex geometries but large free volumes in the flammable gas mixtures. The combustion can be more intense if occurring at local compartments with complex geometries or with higher turbulence intensity, for instance, turbulence induced by a spray. Moreover, the spray can also condense the steam thereby increasing the hydrogen concentration, which can also lead to more intense combustion. Currently, the CYCAS code is not capable of modeling the interaction between the flame and spray droplets. Further research is needed in order to address this issue.
4.2.2 Thermal Load of the Containment Structure
The containment structures are modeled with two methods: the structures with thickness higher than 80 cm are modeled as structures filling in the grids, while others are modeled as walls on the grid surface. The material and its heat transfer material data for each structure are modeled based on the actual engineering data. One thing should be pointed out: only one-dimensional heat conduction in the normal direction of the surface facing the flow field is calculated in CYCAS. This assumption is conservative for local thermal load.
Figure 13 gives the temperature of the structure surface in the containment, both thin walls and thick structures, to evaluate the thermal load of the combustion to structures. The structure temperature rises at the upper part of the containment where the combustion presents, while the temperature at the lower part remains low. The peak temperature of 535 K is reached at the top of the containment dome (given in Figure 13A), 40 s after the ignition, which is lower than the atmospheric temperature and also lower than the containment design temperature, indicating that the containment integrity is not challenged despite the high atmospheric temperature of combustion. Figure 13B shows a high temperature on the walls of the PARs with a peak temperature of 739 K. Because these walls are initially heated by the chemical heat of the hydrogen recombination with temperatures around 450–500 K, these are then further heated by the burnt gas mixture. The equipment survivability should be evaluated with the thermal load and survivable temperature for each equipment.
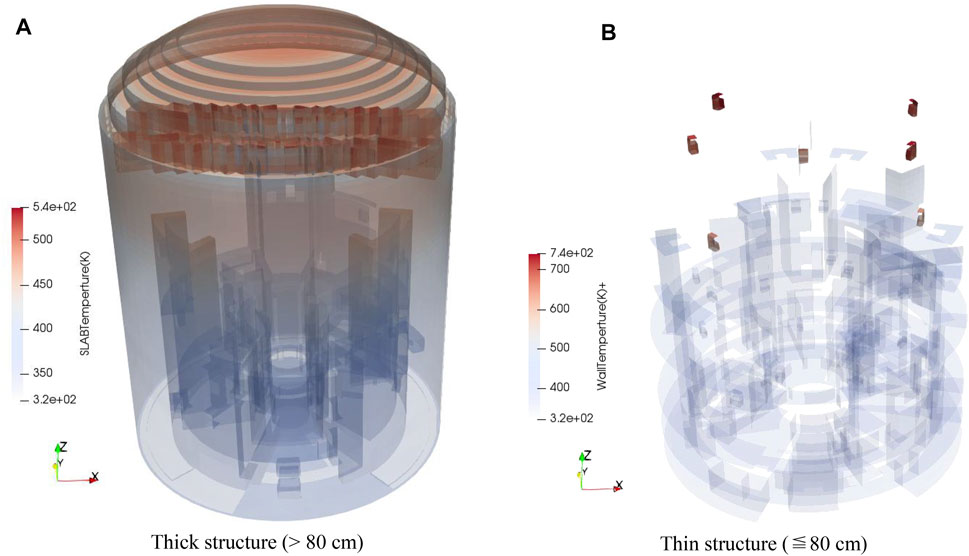
FIGURE 13. Thermal load to structures. (A) Thick structure (>80 cm). (B) Thin structure (≦80 cm).
5 Conclusion
In this study, a turbulent combustion model is developed for the in-house CFD code CYCAS for the capability of hydrogen combustion analysis for the containment. The model is validated with two tests from the THAI facility, and then a containment analysis is presented to demonstrate the code capability. The following conclusions can be drawn:
(1) The validation with the THAI facility indicates that the combustion model in CYCAS manages to have reasonable prediction on the slow deflagration for gas mixture both with and without steam.
(2) The combustion analysis shows that the combustion model in CYCAS manages to calculate the pressure and thermal load of the combustion to evaluate the influence of the combustion on the containment integrity and equipment survivability.
Data Availability Statement
The original contributions presented in the study are included in the article/Supplementary Material, and further inquiries can be directed to the corresponding author.
Author Contributions
LY: Investigation, formal analysis, and writing–original and draft, review and editing. CP: Methodology, investigation and writing—review and editing. LC: Contribution to code validation. CM: Conceptualization, methodology and supervision.
Conflict of Interest
Author LY, CP, CM is employed by China Nuclear Power Technology Research Institute Co. ltd. Author LC is a student of Shenzhen University.
The remaining authors declare that the research was conducted in the absence of any commercial or financial relationships that could be construed as a potential conflict of interest.
Publisher’s Note
All claims expressed in this article are solely those of the authors and do not necessarily represent those of their affiliated organizations, or those of the publisher, the editors, and the reviewers. Any product that may be evaluated in this article, or claim that may be made by its manufacturer, is not guaranteed or endorsed by the publisher.
References
Auban, O., Zboray, R., and Paladino, D. (2007). Investigation of Large-Scale Gas Mixing and Stratification Phenomena Related to LWR Containment Studies in the PANDA Facility. Nucl. Eng. Des. 237 (4), 409–419. doi:10.1016/j.nucengdes.2006.07.011
Chen, M., Lin, J., and Bai, W. (2016). Development and Preliminary Validation of Hydrogen Safety Analysis Code CYCAS. At. Energ. Sci. Techno. 50 (2), 295–300.
Dimmelmeier, H., Eyink, J., and Movahed, M.-A. (2012). Computational Validation of the EPR Combustible Gas Control System. Nucl. Eng. Des. 249, 118–124. doi:10.1016/j.nucengdes.2011.08.053
Ghiaasiaan, S. M. (2011). Convective Heat and Mass Transfer. New York, USA: Cambridge University Press.
Goulier, J., Chaumeixa, N., Haltera, F., Meynet, N., and Bentaï, A. (2016). Experimental Study of Laminar and Turbulent Flame Speed of a Spherical Flame in a Fan-Stirred Closed Vessel for Hydrogen Safety Application. Nucl. Eng. Des. 312, 214–227. doi:10.1016/j.nucengdes.2016.07.007
Hirt, C. W., Amsden, A. A., and Cook, J. L. (1997). An Arbitrary Lagrangian-Eulerian Computing Method for All Flow Speeds. J. Comput. Phys. 135 (2), 203–216. doi:10.1006/jcph.1997.5702
Hu, E., Huang, Z., He, J., and Miao, H. (2009). Experimental and Numerical Study on Laminar Burning Velocities and Flame Instabilities of Hydrogen-Air Mixtures at Elevated Pressures and Temperatures. Int. J. Hydrogen Energ. 34, 8741–8755. doi:10.1016/j.ijhydene.2009.08.044
Kang, H. S., Kim, J., Hong, S. W., and Kim, S. B. (2020). Numerical Analysis for Hydrogen Flame Acceleration during a Severe Accident in the APR1400 Containment Using a Multi-Dimensional Hydrogen Analysis System. Energies 13, 6151. doi:10.3390/en13226151
Koroll, G., Kumar, R., and Bowles, E. (1993). Burning Velocities of Hydrogen-Air Mixtures. Combustion and Flame 94, 330–340. doi:10.1016/0010-2180(93)90078-h
Kotouc, M. (2011). “Numerical Analysis of the Influence of PAR Unit Elevation with a Vessel on its Performance,” in Proceedings of the 19th ICONE, Chiba, Japan, May 16-19, 2011.
Kuznetsov, M., Yanez, J., Grune, J., Friedrich, A., and Jordan, T. (2015). Hydrogen Combustion in a Flat Semi-confined Layer with Respect to the Fukushima Daiichi Accident. Nucl. Eng. Des. 286, 36–48. doi:10.1016/j.nucengdes.2015.01.016
Liu, D. D. S., and Macfarlane, R. (1983). Laminar Burning Velocities of Hydrogen-Air and Hydrogen-Airsteam Flames. Combustion and Flame 49, 59–71. doi:10.1016/0010-2180(83)90151-7
Mimouni, S., Mechitoua, N., and Ouraou, M. (2011). CFD Recombiner Modelling and Validation on the H2-Par and Kali-H2Experiments. Sci. Technology Nucl. Installations 2011, 1–13. doi:10.1155/2011/574514
NEA, (2011). ISP-49 on Hydrogen Combustion”. Washington, D.C., United States: NEA. NEA/CSNI/R(2011)9.
NEA, (2014). Washington, D.C., United States: NEA. NEA/CSNI/R(2014)8.Status Report on Hydrogen Management and Related Computer Codes
Paladino, D., Mignot, G., Kapulla, R., Paranjape, S., Andreani, M., Studer, E., et al. (2014). “OECD/NEA HYMERES Project: For the Analysis and Mitigation of a Severe Accident Leading to Hydrogen Release into a Nuclear Plant Containment,” in Proceedings of the ICAPP 2014, Charlotte, USA, April 6-9, 2014. Paper 14322.
Sathiah, P., Komen, E. M. J., Roekearts, D. J. E. M., Holler, T., and Kljenak, I. (2016). The Role of CFD Combustion Modeling in Hydrogen Safety Management–V: Validation for Slow Deflagrations in Homogeneous Hydrogen-Air Experiments. Nucl. Eng. Des. 310 (DEC), 289–302. doi:10.1016/j.nucengdes.2016.06.030
Sathiah, P., Komen, E., and Roekaerts, D. (2012). The Role of CFD Combustion Modeling in Hydrogen Safety Management-Part I: Validation Based on Small Scale Experiments. Nucl. Eng. Des. 248, 93–107. doi:10.1016/j.nucengdes.2012.03.047
Studer, E., Beccantini, A., Kudriakov, S., and Velikorodny, A. (2013). “Hydrogen Combustion Modelling in Large Scale Geometries,” in Proceedings of the 21st ICONE, Chengdu, China, July 29-August 2, 2013.
Szabó, T., Yáñez, J., Kotchourko, A., Kuznetsov, M., and Jordan, T. (2012). Parameterization of Laminar Burning Velocity Dependence on Pressure and Temperature in Hydrogen/Air/Steam Mixtures. Combust. Sci. Technol. 184 (10-11), 1427–1444. doi:10.1080/00102202.2012.690253
Xiao, J., Breitung, W., Kuznetsov, M., Zhang, H., Travis, J. R., Redlinger, R., et al. (2017). GASFLOW-MPI: A New 3-D Parallel All-Speed CFD Code for Turbulent Dispersion and Combustion Simulations Part II: First Analysis of the Hydrogen Explosion in Fukushima Daiichi Unit 1. Int. J. Hydrogen Energ. 42, 8369–8381. doi:10.1016/j.ijhydene.2017.01.219
Yuen, A. C. Y., De Cachinho Cordeiro, I. M., Chen, T. B. Y., Chen, Q., Liu, H., and Yeoh, G. H. (2022). Multiphase CFD Modelling for Enclosure Fires-A Review on Past Studies and Future Perspectives. Exp. Comput. Multiph. Flow 4, 1–25. doi:10.1007/s42757-021-0116-4
Zhao, H., Luo, X., Zhang, R., Lyu, X., Yin, H., and Kang, Z. (2022). Analysis on Hydrogen Risk under LOCA in marine Nuclear Reactor. Exp. Comput. Multiph. Flow 4, 39–44. doi:10.1007/s42757-020-0077-2
Zimont, V. L. (2000). Gas Premixed Combustion at High Turbulence. Turbulent Flame Closure Combustion Model. Exp. Therm. Fluid Sci. 21, 179±186. doi:10.1016/s0894-1777(99)00069-2
Zimont, V. L., and Lipatnikov, A. N. (1995). A Numerical Model of Premixed Turbulent Combustion of Gases. Chem. Phys. Rep. 14 (7), 993–1025.
Keywords: turbulent combustion, hydrogen risk, containment safety, slow deflagration, CFD
Citation: Yabing L, Peng C, Chubin L and Meilan C (2022) Development, Validation, and Application of the Turbulent Combustion Model for 3D CFD Code CYCAS. Front. Energy Res. 10:872452. doi: 10.3389/fenrg.2022.872452
Received: 09 February 2022; Accepted: 22 March 2022;
Published: 25 April 2022.
Edited by:
Yapei Zhang, Xi’an Jiaotong University, ChinaCopyright © 2022 Yabing, Peng, Chubin and Meilan. This is an open-access article distributed under the terms of the Creative Commons Attribution License (CC BY). The use, distribution or reproduction in other forums is permitted, provided the original author(s) and the copyright owner(s) are credited and that the original publication in this journal is cited, in accordance with accepted academic practice. No use, distribution or reproduction is permitted which does not comply with these terms.
*Correspondence: Chen Peng, chpeng@cgnpc.com.cn