 Shaohua Yu
 Zhaobin Du1,2*
94% of researchers rate our articles as excellent or good
Learn more about the work of our research integrity team to safeguard the quality of each article we publish.
Find out more
ORIGINAL RESEARCH article
Front. Energy Res., 14 April 2022
Sec. Smart Grids
Volume 10 - 2022 | https://doi.org/10.3389/fenrg.2022.873262
This article is part of the Research TopicAdvanced Digital Technologies in Digitalized Smart GridView all 13 articles
With the continuous and rapid growth of electric vehicle (EV) ownership, a large number of disorderly charging loads accessed to the regional grid may lead to problems such as widening of the peak-to-valley load difference and deterioration of power quality. This study proposes an optimal EV charging and discharging regulation strategy based on dynamic regional dispatching price to give full play to the EV vehicle-to-grid (V2G) regulation potential and reasonably regulate EV charging and discharging behavior to ensure safe, high-quality, and economic operation of the grid. First, the EV travel chain model is constructed according to the travel behavior pattern of EV users to obtain the spatial and temporal distribution characteristics of EV charging and discharging loads. Second, considering the difference in regional grid operation states, a dynamic update strategy of regional dispatching price integrating power grid spatial and temporal information is proposed. Furthermore, considering the characteristics of EV mobile energy storage and user demand, an EV V2G optimal regulation model that takes into account the interests of distribution system operators, EV aggregators, and EV users is established to effectively guide the regulation of EV charging and discharging behavior. Finally, the simulation results show that the proposed strategy can effectively reduce the load deviation of each regional grid, operation cost of EV aggregators, and charging cost of EV users and significantly improve the safety and economy of the power system.
With the continuous progress of human society and the rapid development of the world economy, the problems of energy depletion and environmental pollution caused by the continuous increase in energy demand are gradually receiving attention and importance (Schirone and Pellitteri, 2017; Fang et al., 2019). Electric vehicles (EVs) have been rapidly developed and popularized due to their significant advantages of energy efficiency, low carbon and environmental protection, and the number of ownerships continues to rise. The social, economic, and environmental benefits of transportation electrification are becoming increasingly significant (Cui et al., 2021). However, the disorderly charging behavior of a large number of EVs may bring problems to the grid such as line and transformer overload, widening of load peak–valley difference, and deterioration of power quality, which bring great challenges to the safe, high-quality, and economic operation of the power system (Shao et al., 2017; Chen et al., 2018). In addition, in the context of the rapid development and application of vehicle-to-grid (V2G) technology, an EV has the dual attributes of source and load and has great potential to smooth out grid load fluctuations, improve grid power quality, participate in grid auxiliary services, and improve the economic efficiency of users as a highly flexible mobile energy storage unit (Chen et al., 2019; Wu et al., 2019; Lo et al., 2021). Therefore, reasonable charging and discharging regulation can effectively alleviate the negative impact of EV charging load on the grid and improve the safety and economy of power system operation (Zhang et al., 2017).
At present, in a relevant research study on the optimal regulation strategy of electric vehicle V2G, Zhou et al. (2017) classified EV V2G scheduling application scenarios into renewable energy integration, provision of auxiliary services, and demand-side active participation in the electricity market and proposed a robust energy scheduling method for electric vehicle V2G to effectively shift peak loads and reduce total system operating costs. Tabatabaee et al. (2017) aimed to minimize the grid operation cost, established a collaborative dispatch model of EV and new energy generation, and improved the grid operation economy through V2G technology. Wang et al. (2020) established an optimal market bidding model for virtual power plants considering large-scale EVs based on the EV V2G feasible domain, which significantly improved the operation economy of virtual power plants. Chandra Mouli et al. (2019) combined the characteristics of building photovoltaic (PV) power generation and EV charging/discharging behavior and proposed an EV charging and discharging energy management strategy based on the grid dynamic electricity price, which reduced the cost of EV charging and improved the system economy. Chen et al. (2020) took into account the mobility characteristics of different EV clusters and established an EV V2G scheduling strategy with the objective function of smoothing grid load fluctuations, which promoted renewable energy consumption and improved safe and economic system operation. With the goal of smoothing load fluctuations and improving EV users’ revenue, Li et al. (2021) proposed an EV scheduling strategy based on user behavior to improve system operational safety and economy. However, the aforementioned research only considered the interests of one or two stakeholders among the distribution system operator (DSO), EV aggregator (EVA), and EV users. In fact, ensuring multi-stakeholder profits and win–win situation for DSO, EVA, and EV users is the premise to encourage EVs to actively participate in the optimal regulation of charge and discharge.
At the same time, in a relevant research study on EV orderly charging and discharging strategies based on the electricity price signal, Duan et al. (2020) dynamically updated the electricity price signal according to the number of EVs in the charging station and proposed an EV charging scheduling method based on a smart contract to ensure stable operation of the grid. Aiming at maximizing the revenue of charging stations, Cheng et al. (2018) proposed an orderly charging method for EVs based on a time-of-use (TOU) price signal, which significantly improved charging station revenue but had a limited effect on smoothing load fluctuations. Zhou et al. (2020) considered time sensitivity of EV users and proposed an EV charging and discharging scheduling model based on the dynamic electricity price mechanism to save users’ charging costs. Based on the time-sharing tariff mechanism, Pan et al. (2019) proposed a real-time optimal scheduling strategy for EV charging that took into account the interests of the DSO, EVA, and EV users, effectively smoothed load fluctuations, reduced operating costs, and improved users’ satisfaction. Based on the evaluation results of EV charging load shifting potential, Gan et al. (2020) quantified the impact of the TOU price mechanism on EV charging load transfer and realized the reasonable transfer of EV charging load based on the TOU price mechanism. However, the aforementioned research on electricity price signals mainly focuses on the time dimension, through changing the temporal distribution of EV charging power to achieve the corresponding goals. There are few EV orderly charge and discharge guidance strategies based on the electricity price signal in spatial and time dimensions. In fact, there are some differences in the grid infrastructure and operation states of each spatial region of the power system. On the one hand, the regional grid unified electricity price signal mechanism is difficult to give full play to the EV V2G regulation potential, and on the other hand it may lead to the unreasonable spatial distribution of EV charging and discharging loads and overloading of lines and transformers in local areas.
In addition, in the relevant research study based on the temporal and spatial pricing mechanism, the locational marginal pricing (LMP) can alleviate the distribution network congestion caused by EV load (Ma et al., 2016; Liu et al., 2018). Li et al. (2014) proposed an EV optimal charging strategy based on distribution LMP (DLMP), which can effectively alleviate the power grid congestion. Hu et al. (2019) proposed an optimal scheduling strategy for load aggregators based on DLMP with an iterative approach to effectively solve the bidirectional blocking problem in distribution networks. Although LMP is the most accurate pricing method, it is quite sensitive to distribution network structure, network constraints, and load level. The actual implementation is very complicated, and it is difficult to obtain the data of each node and complete the node marginal price calculation and online decision-making in the distribution system with a large number of nodes in real time, which has certain limitations (Singh and Srivastava, 2005). Therefore, the resource dispatching regional pricing mechanism as a simplified way of LMP is more in line with the needs of the engineering practice, with higher operational flexibility and easier to achieve distribution network load management.
Thus, this study proposes an optimal regulation strategy for EV V2G based on dynamic regional dispatching price. First, an EV travel behavior simulation and prediction model is constructed based on the travel chain theory to obtain the spatial and temporal distribution characteristics of EV charging and discharging loads. Second, considering the differences in regional grid operation states, a dynamic regional dispatching price update strategy integrating the spatial and temporal information of the grid is proposed. Furthermore, an EV V2G optimal regulation model is established based on dynamic regional dispatching price taking into account the EV mobile energy storage characteristics and user demand as well as the interests of DSO, EVA, and EV users. Finally, the IEEE-33 node system is used as an example for simulation analysis to verify the effectiveness of the proposed strategy in this study. The results show that the proposed regulation strategy can effectively reduce the regional grid load deviation, the operating cost of EVA, the charging cost of EV users, and effectively improve the safety and economy of the system.
The main contributions and salient features of this study are as follows:
1) Considering the battery energy risk awareness and the uncertainty of leaving of EV users in advance, an EV-guaranteed energy adaptive adjustment method based on the regulation time is proposed to ensure the electricity demand of users and illustrate the impact of different guaranteed electricity energy on the regulation effect of EVs.
2) A dynamic update strategy of regional dispatching price based on the regional grid operation states and EV on-grid rate is proposed. Then, considering the users’ features in 1), an EV V2G optimal regulation model based on regional flexible pricing is established, and the cost–benefit analysis model is used to optimize the profit of each stakeholder. The superiority of the proposed strategy is verified by comparing with the classical tariff signals in current works. Therefore, the proposed flexible dispatching price strategy has great application potential in guiding EV orderly charging and discharging behavior.
With the development and wide application of technologies such as the Internet of Things, big data, and cloud services, the comprehensiveness and timeliness of information interaction have been greatly satisfied. In this context, the massive data between DSO, regional EVA, and EV users will interact in real time, and then the multidimensional data information of the system can be integrated to formulate the EV V2G charging and discharging regulation strategy. The electric vehicle V2G real-time optimal regulation architecture proposed in this study is shown in Figure 1, including the V2G real-time optimal regulation framework and energy and information flow among various stakeholders. In Figure 1, EV regulation cloud service (CS) is a non-profit organization to achieve the goal of optimal operation of the whole system. It is mainly responsible for the centralized interaction of various stakeholders’ information, regional dispatching price update, and EV regulation strategy formulation. DSO is one of the stakeholders, aiming at minimizing the active load deviation of the grid and smoothing the active load fluctuation. It is mainly responsible for the regional base active load and EV users’ supply and sales services. The regional EVA is the main executor of the V2G regulation scheme, aiming to minimize the operating cost and mainly responsible for regulating the charging and discharging behavior of regional EVs. EV users are the basis of the V2G regulation framework. It aims at minimizing the charging cost, meeting the power demand of vehicles, and realizing low charging costs.
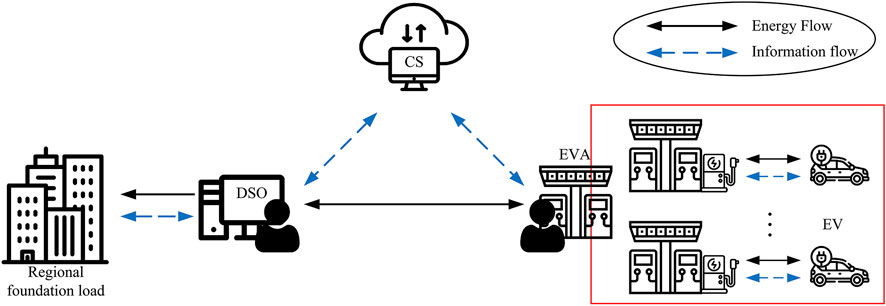
FIGURE 1. V2G real-time optimal regulation framework.
This study adopts an incentive contract approach to regulate EVs in the system. The incentive contract approach means that the EVA and the EV user sign an incentive contract agreement in which the EV user grants the regulation right to the EVA and the EVA can freely regulate the charging and discharging behavior of authorized EVs to achieve its goal within certain restrictions, while the EVA will provide the EV user with a certain charging discount. Under the proposed regulation framework, CS communicates directly with the DSO and the regional EVA in a bidirectional manner, and based on the collected state information of DSO, EVA, and EV users, CS dynamically updates DSO’s discharge incentive price and EVA’s charging service fee. An EV charging and discharging regulation strategy is formulated to maximize the safety and economic benefits of the whole system considering the interests of DSO, regional EVA, and EV users. Then CS communicates the regulation scheme to DSO and regional EVA, and the regional EVA directly regulates the charging and discharging behavior of regional grid–connected EVs according to the regulation scheme. In this process, the system meets the total requirement of large-scale EV response power and realizes fast charging and discharging behavior regulation of a large number of EVs.
The travel chain model is an effective method to describe the travel behavior patterns of EV users (Chen et al., 2015), involving a large number of spatiotemporal characteristic variables such as travel time, travel purpose, and travel sequence. The EV travel chain model is divided into two parts: the time chain and the space chain. The time chain describes the time distribution of user travel, including time variable information such as the first travel time, travel time, arrival time, and departure time, and the space chain describes the spatial transfer of user travel, including travel purpose, travel distance, travel order, and other space information.
According to the difference in the functional properties of the block within the system area, the system area can be divided into office region (O), business region (B), and home region (H). The starting and ending locations of each EV travel chain are supposed to be home regions. Each EV can travel among different functional regions, and the travel chain structure is determined based on the respective travel demand, the number of travel activities, and their travel order. The UK National Travel Survey (NTS) is a household survey of personal travel by residents of England traveling within Great Britain, from data collected via interviews and a 7-day travel diary, which enables analysis of patterns and trends (UK Department for Transport, 2019). Thus, based on the 2019 UK NTS database statistics and the Monte Carlo Markov chain (MCMC) method, this study generates the travel chain model for EVs, including simple and complex travel chains such as H→O→H, H→B→H, and H→O→B→H. Among them, the H→O/B→H travel chains structure represents the travel process of EV users starting from the home region to the office/business region and finally returning to the home region. The analysis of the H→O→B→H travel chain structure is the same.
According to the 2019 UK NTS database (UK Department for Transport, 2019), the probability density functions of EV arrival time, departure time, and initial state of charge (SOC) can be fitted by a normal distribution, as follows:
where
In the process of EV charging and discharging regulation, users’ behavior features will directly affect EV charging demand to an extent. That is, users have a certain risk awareness of EV battery’s electricity energy and hope that EV’s battery energy will be available when leaving in advance. Therefore, considering that the probability of EV leaving early gradually increases with the regulation time, the lower limit of EV SOC is adaptively adjusted according to the regulation time, as shown in Figure 2. Thus, the charging demand of a single EV is presented by Eq. 2, and the battery SOC boundaries and the regulatory region are shown in Figure 3.
where
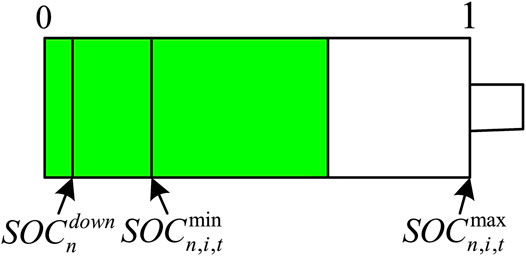
FIGURE 2. Schematic diagram of upper and lower limits of battery SOC of EV.
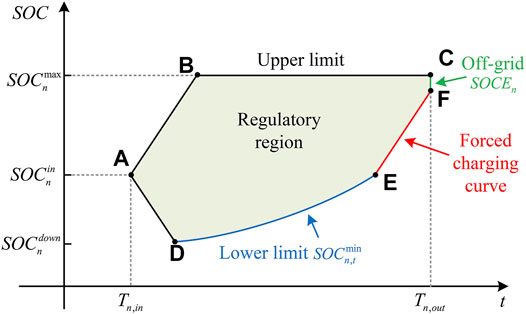
FIGURE 3. SOC boundaries of a single EV.
In Figure 3, the area enclosed by ABCFED represents the power and energy regulatable range of a single EV, the path ABC represents the disorderly charging curve, the slope of the straight line AB corresponds to the maximum charging rate
Based on the regional flexible dispatching electricity price signal, the EV charging and discharging regulation model takes DSO, EVA, and EV users’ interests as the comprehensive optimization objective function and selects the charging and discharging power
The DSO stakeholder is optimized to minimize load deviations, as follows:
where T is the regulation period; I is the number of functional regions, meaning the number of EVAs is also I;
where
The EVA stakeholder is optimized to minimize operating costs, as follows:
where
where
The EV user stakeholder is optimized to minimize charging and discharging costs, including charging costs and battery degradation costs, as follows:
where
1) EV users charging cost
2) EV battery degradation cost
The frequent cyclic charging and discharging behavior of EV battery will bring about the problem of battery degradation, and the cost of battery degradation will directly affect the EV charging and discharging decision. Thus, it is necessary to consider the battery degradation cost in the EV charging and discharging regulation process, and the battery life is often related to factors such as the number of charge–discharge cycles and depth of discharge. Neubauer and Wood (2014) gave the relationship between the life of lithium battery and the number of cycles, and the relevant data are provided by the battery manufacturer. The corresponding battery degradation cost based on the approximate rainflow counting method (Kazemi and Zareipour, 2018) is presented by Eq. 10.
where
where
In summary, the proposed model in this study is a multi-objective optimization problem. To fully reflect the importance of each objective and facilitate the solution of the model, the objectives of each stakeholder are normalized and then linearly weighted by the weighting coefficient method, and the comprehensive optimization objective function of this model is obtained, as shown in Eq. 12.
where ω1, ω2, and ω3 are the weight coefficients of DSO, EVA, and EV users’ optimization objectives, respectively, which are flexibly determined by CS according to the importance and priority of optimization objectives. In this study, taking into account the interests of all stakeholders and based on the normalization process, ω1, ω2, and ω3 are taken as 7 × 10⁻⁸, 4.5 × 10⁻⁴, and 5 × 10⁻⁴, respectively.
The constraints of the objective function are listed as follows.
1) EV charging and discharging constraints
where
2) EV up and down reserve capacity constraints
3) Distribution transformer capacity constraints
where
As a special commodity with dual attributes of time and space, the value of electric energy changes with different distribution of time and space, so the electricity price should also have the difference of time and space (Schweppe et al., 1988). A reasonable electricity price signal can effectively guide the regulation of EV resources charging and discharging behavior, and the dynamic update strategy of regional dispatching electricity price is the basis and key to fully play the role of electricity price signal and develop the solution of EV charging and discharging problem. Thus, in order to achieve global optimization of the system and improve participation enthusiasm of EVA and EV users, this study formulates the dynamic update strategy of regional dispatching price on the basis of peak-to-valley TOU tariff. The dynamic update strategy includes discharge incentive dispatching price and charging service fee, as follows:
1) Dynamic update strategy of EV discharge incentive dispatching price
The V2G discharge incentive dispatching price comprehensively considers the operation characteristics of the regional power grid. It is updated and formulated by the CS according to the regional DSO peak-shaving and valley-filling demand and the EV on-grid rate and communicated to the regional EVAs through the communication network. The regional EVAs respond to regulation scheme according to the discharge incentive dispatching price level; the update strategy is as follows:
where
where
2) Dynamic update strategy of EV charging service fee
The EV charging service fee is formulated and updated by CS and then transmitted to regional EVAs and EV users based on regional grid operation states and the EV on-grid rate. The regional EVAs and EVs respond to the regulation scheme, and the specific strategy is as follows.
where
where
3) Electricity price constraints
where
The cost–benefit analysis of stakeholders is as follows.
1) DSO economic benefit analysis
As the implementation institution of EV discharge incentive dispatching price, DSO is the main beneficiary of EV charging and discharging regulation. In the process of EV charging and discharging regulation, DSO costs mainly include the expenses of purchasing EV V2G electricity and reserve capacity, that is, the discharging cost and reserve cost paid to EVAs or EV users, and DSO benefits are mainly avoidable capacity and avoidable power benefits. The avoidable capacity benefit is the reduced investment costs for new or expanded grid construction such as transformers, transmission lines, and their supporting equipment through V2G technology, and the avoidable power benefit is the reduced cost of power purchased from generators during peak periods. The details are as follows:
where
where
2) EVA economic benefit analysis
EVA is the main implementation object of dispatching price. It should ensure that EVAs’ average selling price after participating in EV regulation is not less than before, as follows:
where
3) Economic benefit analysis for EV users
EV users are the main implementation objects of charging service fees, and its charging cost after participating in regulation shall not be greater than that before regulation, as follows:
where
4) CS benefit analysis
CS leads the formulation of regional flexible dispatching price to promote optimal allocation of system EV resources. Therefore, the objective function value of model comprehensive optimization is taken as the benefit, as shown in Eq. 12.
The formulation workflow of the proposed strategy is shown in Figure 4.
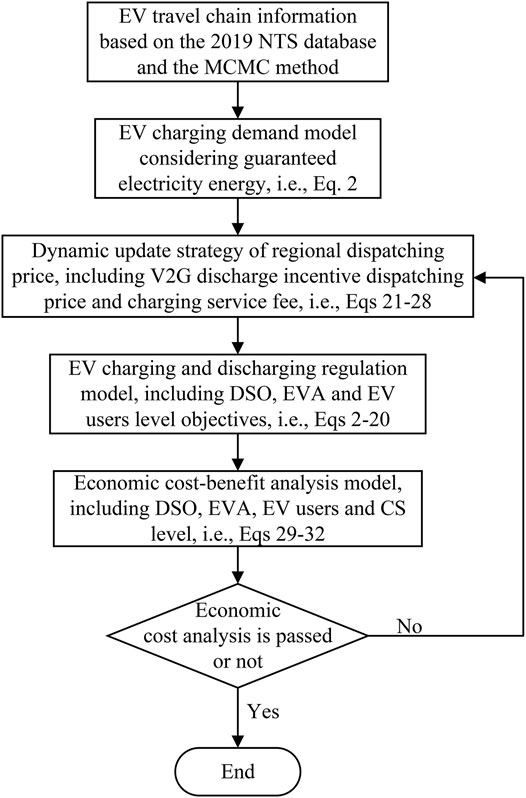
FIGURE 4. Strategy development flowchart.
As can be seen from Figure 4, the regulation strategy development workflow includes the following steps. First, the EV travel chain information is obtained based on the 2019 NTS data set and the MCMC method, which reflects the travel demand of users and is the basis of EV regulation. Second, the EV charging demand model is established based on EV travel information to guarantee users’ electricity energy demand. Third, the regional flexible dispatching electricity price is dynamically updated considering the regional grid operation states and EV on-grid rate. Then the EV charging and discharging regulation model based on the dynamic regional dispatching electricity price is established to achieve a win-win situation for DSO, EVA, and EV users. Finally, the economic cost–benefit model is used to analyze the profitability of different stakeholders in the proposed scheme and determine whether the profitability of multiple parties is achieved.
In this study, we adopted the adapted IEEE-33 node system and divided it into four functional regions according to the difference of regional functional properties: office region, business region, home region 1, and home region 2, corresponding to four EVAs, as shown in Figure 5. The total basic active load of the system and the basic active load of each region are shown in Supplementary Figure S1. Considering that the EV charging infrastructure has been greatly developed and configured in the context of smart cities, it is assumed that each functional region has a sufficient number of charging piles, which have been properly planned and arranged. Based on the adapted IEEE-33 node system capacity size and EV penetration, it is assumed that there are 100 EVs in the system, and the parameters are shown in Table 1. To reflect a certain extent of uncertainty in users’ charging demand, it is assumed that EV users have different expected electricity consumption in different functional regions, which follows a normal distribution of N (0.85, 0.02) in office and home regions and N (0.75, 0.02) in the business region. Based on the NTS database data and MCMC method, the number and proportion of different EV travel chains are shown in Supplementary Table S1, and the travel timing information of EV users is shown in Supplementary Figure S2. To fully utilize the EV regulation potential and users’ charging demand, it is assumed that EVs are connected to the grid for regulating immediately after arriving at their destinations. EV provides reserve service at an electricity price of 0.022 Yuan/kWh (South China Energy Regulatory Administration, 2020);
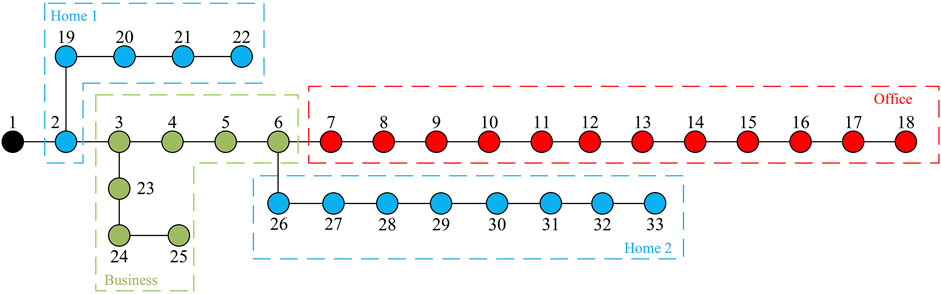
FIGURE 5. Adapted IEEE-33 node system region division diagram.
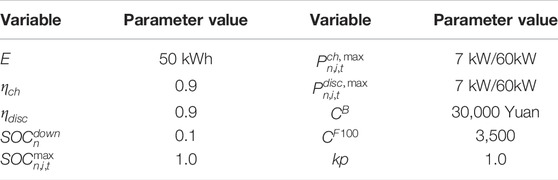
TABLE 1. Simulation parameters of single EV.
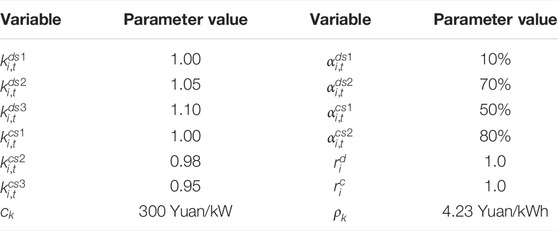
TABLE 2. Relevant electricity price simulation parameters.
The simulation period T is set from 5:00 of the previous day to 5:00 of the present day. In order to fully reflect the randomness of EV accessing and leaving the grid as well as the real-time optimal regulation effect, the simulation time interval is taken as
The case study in this study is based on a computer with a CPU of Intel® Core™ i7-9700 @ 3.00 GHz and 16 GB of memory, modeled with MATLAB software and the YALMIP toolbox, and the CPLEX optimization solver is called to solve the optimization model. Meanwhile, the average computational cost of solving the optimization model is 8.5 min, and this computation time is considered to be very acceptable considering that the studied scenario is a 24-h (including 96 regulation periods) EV optimal regulation problem.
The proposed dynamic update strategy of regional dispatching price in this study is calculated and updated by CS based on the interaction information of DSO, EVA, and EV users, and the results are shown in Figure 6. Combined with Figure 6 and the Supplementary Figures S1 and S2, it can be seen that due to the differences in the load characteristics of the regional power grids and EV travel characteristics, the EV discharge incentive dispatching prices (Figure 6A) and charging service fees (Figure 6B) in the regional grids are also quite different. The EV discharge incentive dispatching price increases with the rise of the regional grid’s peak-shaving demand and EVA’s charging pile utilization rate, and decreases vice versa. Also, it becomes zero when the grid’s active load is lower than the average load level, which fully reflects the active load characteristics of the regional grid and the travel characteristics of EVs. Similarly, the EV charging service fee increases with the increase of the regional grid’s active load and the decrease of EVA’s charging pile utilization rate. When the regional power grid’s active load is at its peak, the regional charging service fee increases significantly, and decreases significantly vice versa.
FIGURE 6. (A) EV discharge incentive dispatching price. (B) EV charging service fee.
The results of the EV V2G optimal regulation model are shown in Figure 7, which shows the base active load of each regional grid (i.e., PB, blue area in Figure 7), the equivalent active load variation curve of the regional grid (i.e., PEL, orange area in Figure 7), and the real-time regulation results of the regional EV V2G for 96 day (i.e., PEVA, green area in Figure 7).
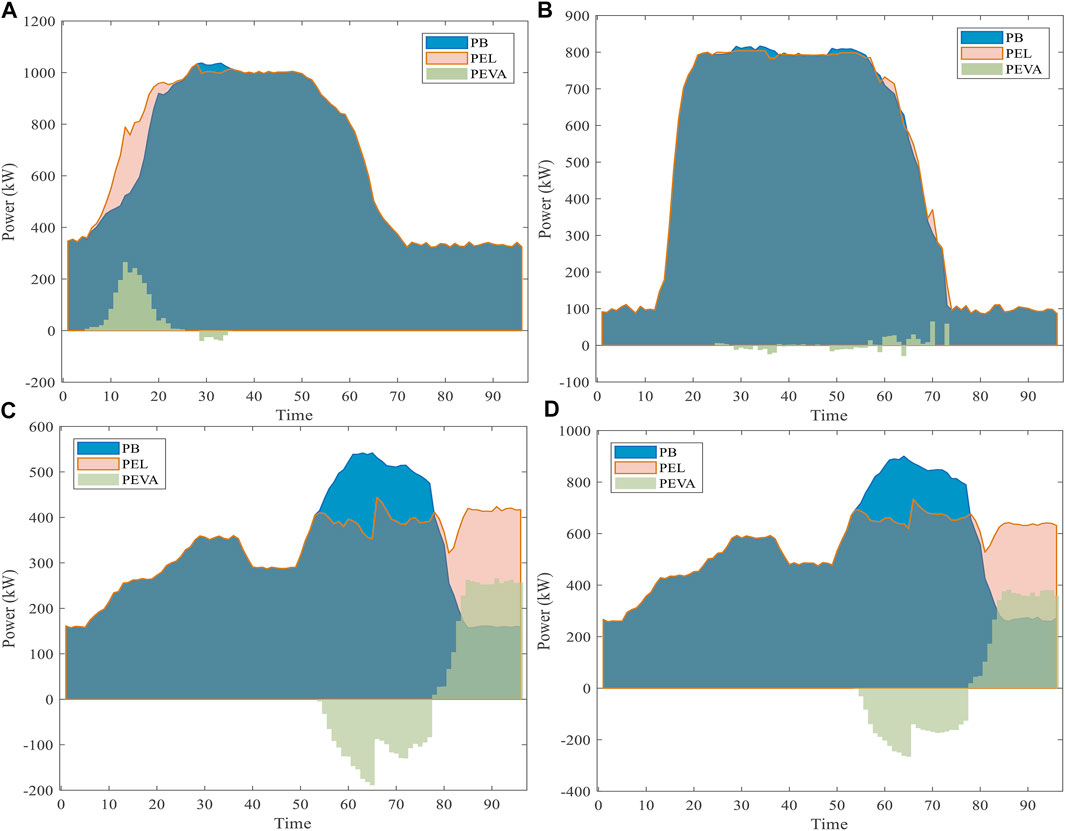
FIGURE 7. (A) Office region calculation results. (B) Business region calculation results. (C) Home region 1 calculation results. (D) Home region 2 calculation results.
As can be seen from Figure 7, the regional EVA guides regional on-grid EVs to reduce charging power or increase discharging power when the regional grid load peak-shaving demand is high, and when the regional grid valley-filling demand is high, regional on-grid EVs are guided to increase charging power or reduce discharging power. The effect of peak-shaving, valley-filling, and smooth load fluctuation of the power grid is significant in which the load rates of the office region, business region, home region 1, and home region 2 are increased from 63.48, 57.52, 59.56, and 59.27% of the base active load to 65.55, 58.56, 75.27, and 74.94% respectively, which is an increase of 2.07, 1.04, 15.71, and 15.67%, respectively. Due to the base active load in office and business regions being relatively stable, the effect of regional load rate improvement is limited (shown in Figures 7A,B). On the contrary, the base active load in home region 1 and home region 2 changes more obviously and the effect of regional load rate improvement is significant (shown in Figures 7C,D).
The economic benefits for DSO, EVA, and EV users are evaluated and analyzed according to Eqs. 29–32. From the calculation results, it can be seen that DSO regulation benefit Bg = 4.7978×10⁷ Yuan, regulation cost Cg = 1.2336×10⁷ Yuan, and net profit Rg = 3.5642×10⁷ Yuan when the assessment period is 20 years. So, the benefit of DSO participation in EV charging and discharging regulation is far greater than the cost, that is, DSO achieves profit. In addition, EVAs’ selling price (in Yuan/kWh) for office, business, home 1, and home 2 after the regulation are 1.1240, 1.0472, 1.0361, and 1.0355, respectively, compared to 0.95 before the regulation, which increased by 18.32, 10.23, 9.06, and 9.00%, respectively, that is, the average profit on regional EVA has been improved. Furthermore, combined with Table 4, it can be seen that the average charging cost for EV users has been reduced from 37.2429 Yuan before regulation to 18.4832 Yuan, with a decrease of up to 50.37%. Therefore, the proposed strategy promotes the profitability of DSO, EVA, and EV users, achieving a win-win situation for all three stakeholders.
The electricity price level will significantly affect the decision-making behavior of DSO, EVA, and EV users, and the guidance effect of different electricity price signals has some differences. To demonstrate the effectiveness and superiority of the regional dispatching price signals proposed in this study, the calculated results of the proposed dispatching price strategy are compared with three other classical electricity price scenarios in recent research.
Comparison scheme 1 (CS1): Dynamic regional dispatching price signal in this study.
Comparison scheme 2 (CS2): Disorderly charging signal, as the benchmark.
Comparison scheme 3 (CS3): Peak-to-valley TOU signal (Li et al., 2021).
Comparison scheme 4 (CS4): System dynamic electricity price signal (Zhou et al., 2020).
Combined with the EV charging and discharging regulation model established in this study, four comparison schemes of electricity price signal are used to guide the regional EV charging and discharging behavior, respectively, and the results are shown in Figure 8 and Table 3.
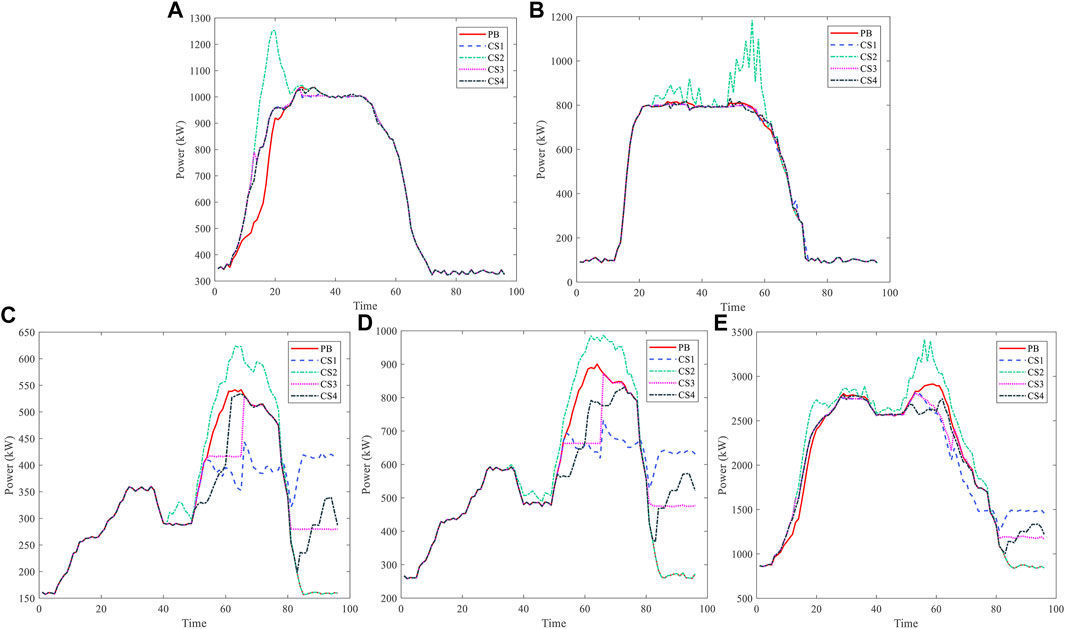
FIGURE 8. (A) Office region calculation results. (B) Business region calculation results. (C) Home region 1 calculation results. (D) Home region 2 calculation results. (E) System load calculation results.
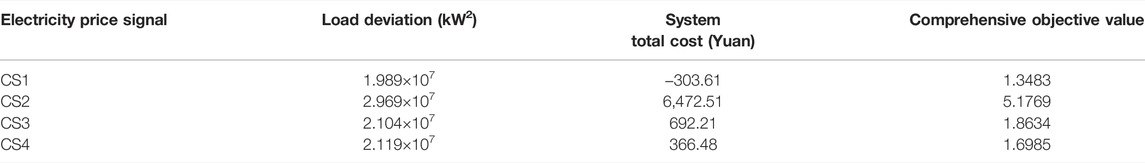
TABLE 3. Results of different electricity price signals.
As can be seen from Figure 8, under the CS2 strategy, EVs carry out disorderly charging behavior without incentive guidance. When it is given access of the power grid, it immediately charges at the maximum power, enlarging peaks or forming new load peaks on the basis of grid’s base active load in each region, which further expands the load peak-valley difference. Among them, the most serious impact was on the business region grid; the load peak-valley difference increased from the original 730.44–1,099.32 kW, the growth rate was as high as 50.50%, and the active load curve of the business region grid showed obvious fluctuations, which seriously aggravated the regional grid peak regulation pressure.
Under the strategies of CS3 and CS4, EV reduces the charging power when the charging price is high and increases the charging power when the charging price is low based on meeting the charging demand. A similar analysis was carried out for discharging power. The electricity price signal plays a guiding role in EV charging and discharging behavior. Among them, under the CS3 strategy, the load rates of office region, business region, home region 1, and home region 2 increased by 9.32, 16.20, 7.63, and 5.67% compared with CS2, respectively. The EV charging and discharging regulation strategies based on the peak-valley TOU price and system dynamic price signal improved the operational security of the regional power grid to an extent. However, due to the unified electricity price signal used in the whole region of the system, the effect of EV charging and discharging regulation is limited, and the guiding role of the electricity price signal is not fully played, especially in home regions 1 and 2. The active load of home regions 1 and 2 is still at a high level, at times 66–77 of CS3 and 61–77 of CS4 (shown in Figures 8C,D).
Compared with the above schemes, the proposed flexible dispatching price strategy (CS1) considers the operational states of different regional grids, and the regional grid load rate increases significantly. Among them, the load rates of office region, business region, home region 1, and home region 2 increased by 9.32, 16.22, 20.66, and 18.13% compared with CS2, respectively, and compared with peak-to-valley TOU price and system dynamic price, it can further guide and regulate the orderly charge and discharge behavior of EVs and achieve more significant results in improving the load characteristics of the regional grid. In addition, as can be seen in Table 3, concerning the economics of the regulation strategy, system’s total cost (the sum of EVA operating cost and users charging cost, that is, f2+f3) of CS2, CS3, and CS4 is 2,231.82, 327.99, and 220.71% higher than that of CS1, respectively. Thus, the proposed strategy greatly reduces the operating cost and significantly improves the operation economy of the system.
EV charging and discharging regulation are jointly participated by multiple stakeholders, and the interest demands of different stakeholders will affect the formulation of optimization decision-making scheme. In order to reflect the necessity of considering the interests of multiple stakeholders, the model proposed in this study is compared with the results of the other four typical optimization objectives in the current research.
Optimization objective 1: Model of this study.
Optimization objective 2: Disorderly charging, as the benchmark.
Optimization objective 3: DSO load deviation.
Optimization objective 4: EVA operation cost.
Optimization objective 5: EV users charging cost.
The results of the models based on the above optimization objectives were calculated separately and are shown in Table 4. Among them, the negative value of EVA operating cost means a positive benefit.
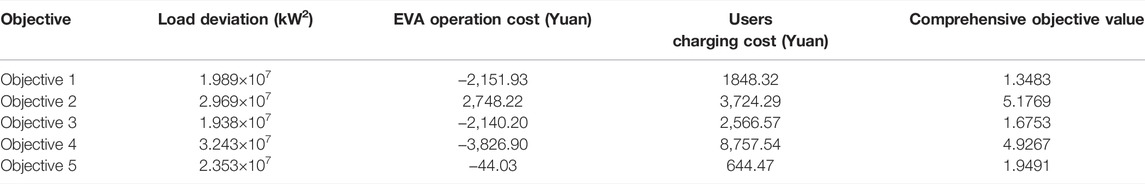
TABLE 4. Results of different optimization objectives.
As can be seen from Table 4, objective 2 performs poorly in terms of load deviation, EVA operation cost, and user charging cost. It means that it takes other interests as the cost and reduces the enthusiasm of other stakeholders to meet users’ rapid charging demand, which is not conducive to the long-term operation of the whole system. Objectives 3, 4, and 5 only consider the interests of individual stakeholders of DSO, EVA, and EV users, respectively, and maximize the interests of their respective subjects. Among them, although objective 3 achieves the minimum load deviation of the DSO power grid and achieves significant peak-shaving and valley-filling effect, it comes by increasing EV users charging cost, which damages the interests of EVA and users. Objective 4 greatly reduces EVA operating cost and improves EVA revenue, but it is accompanied by a larger grid load deviation and higher charging costs of users, without considering the needs of DSO and users. Similarly, objective 5 only considers the demand of users and ignores the benefits of DSO and EVA. Although the demand of users is greatly met, the peak-shaving and valley-filling effect of the grid in general and the revenue of EVA is significantly reduced. It can be seen that the above objectives cannot promote multi-stakeholder profits and win-win results and fail to take into account the overall interests. Thus, it is difficult for the system to achieve sustainable, long-term, and mutually beneficial safe economic operation.
Compared with the aforementioned optimization objectives, the proposed model fully considers the interests of multiple stakeholders and realizes the reduction of DSO load deviation and EVA operation cost on the basis of meeting the demand of EV users. Among them, the load deviation is only 2.63% more for objective 3, but the total cost of the system is reduced by 171.21%. EVA’s operating cost is 43.78% more for objective 4, but DSO load deviation and user charging cost are reduced by 38.67 and 78.89%, respectively. EV users’ charging cost is 186.80% more for objective 5, but the operating cost of EVA is reduced by 4,787.42%. It can be seen that the proposed strategy maintains the global benefit of the system at a high level, which is conducive to the mutual benefit and long-term operation of all parties in the system.
EV users set different guaranteed electricity energy demands in the regulation process, which will affect the flexibility of EV regulation. Therefore, in order to consider the impact of different guaranteed electricity energy on EV regulation effects, this study sets up five comparison schemes under different EV-guaranteed electricity energy requirements.
The calculation results under different guaranteed electricity energy demands are shown in Table 5 and Figure 9. As can be seen from Table 5 and Figure 9, when λn is relatively small, the load deviation and EVA operating costs achieve good results, but the users charging cost increases, and when λn is large, the load deviation and EVA operating costs increase accordingly and the users charging cost decreases. In addition, with the increase of λn, the adjustable range of single EV battery SOC gradually decreases and the EV adjustable flexibility decreases. It makes the model comprehensive objective value to increase, but the users’ battery energy demand is guaranteed when leaving early. Thus, it can be seen that different guaranteed electricity energy requirements have an impact on EV charging and discharging strategies, and it is necessary to consider them in detail in the EV charging and discharging regulation process.
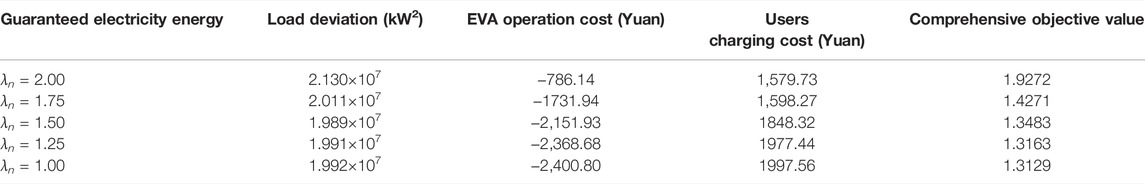
TABLE 5. Results under different guaranteed electricity energy.
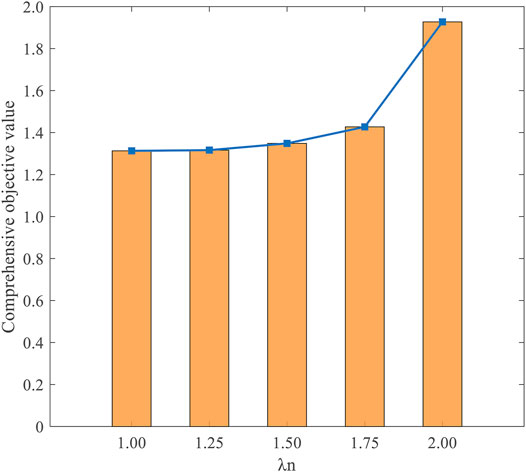
FIGURE 9. Comprehensive objective value under different EV-guaranteed electricity energy.
In this study, an optimal regulation strategy of EV V2G based on a dynamic regional dispatching price signal is proposed, taking into account the interests of DSO, EVA, and EV users. The simulation example of a regional distribution network is analyzed, and the results show the following:
The EV orderly charging and discharging regulation strategy proposed in this study fully considers the travel demand and charging demand of EV users and effectively guide the EV charging and discharging behavior in the region. It realizes the reduction of the regional grid load deviation, EVA operation cost, and EV users’ charging cost.
Under the guidance of different electricity price signals, the proposed dynamic regional dispatching price can further play the guiding role of electricity price signals by combining the regional grid operation states and EV on-grid rate, in order to increase the regional grid load rate and significantly improve the operation economy of the system.
Under solo optimization objective, it is difficult to achieve a win–win situation for multiple stakeholders by considering only DSO load deviation, EVA operation cost, or EV users’ charging cost, which is not conducive to motivate DSO, EVA, and EV users to participate in the regulation process. The model proposed in this study achieves a win–win situation for all three stakeholders, which is conducive to maximize the safety and economic benefits of the system and promote the mutually beneficial and long-term operation of the system.
Under different guaranteed electricity energy, the adjustable flexibility of single EV battery SOC decreases as λn increases, and the model comprehensive objective value increases and overall system benefits decrease, but the users’ battery energy demand is guaranteed when leaving early.
This study only regulates the V2G behavior of EVs from the perspective of the grid. In fact, EVs play an important role in coupling of the road network and power grid. The interaction between road network information and power grid information will further affect the EV charging and discharging regulation strategy. Therefore, the optimal regulation of electric vehicle V2G integrating road network information will be the next research focus.
The original contributions presented in the study are included in the article/Supplementary Material, further inquiries can be directed to the corresponding author.
All authors listed have made a substantial, direct, and intellectual contribution to the work and approved it for publication.
The research work was supported by the National Natural Science Foundation of China (Grant No. 51761145106).
The authors declare that the research was conducted in the absence of any commercial or financial relationships that could be construed as a potential conflict of interest.
All claims expressed in this article are solely those of the authors and do not necessarily represent those of their affiliated organizations, or those of the publisher, the editors, and the reviewers. Any product that may be evaluated in this article, or claim that may be made by its manufacturer, is not guaranteed or endorsed by the publisher.
The Supplementary Material for this article can be found online at: https://www.frontiersin.org/articles/10.3389/fenrg.2022.873262/full#supplementary-material
Chandra Mouli, G. R., Kefayati, M., Baldick, R., and Bauer, P. (2019). Integrated PV Charging of EV Fleet Based on Energy Prices, V2G, and Offer of Reserves. IEEE Trans. Smart Grid 10, 1313–1325. doi:10.1109/TSG.2017.2763683
Chen, L., Nie, Y., and Zhong, Q. (2015). A Model for Electric Vehicle Charging Load Forecasting Based on Trip Chains. Trans. China Electrotechnical Soc. 30, 216–225. doi:10.19595/j.cnki.1000-6753.tces.2015.04.027
Chen, L., Zhang, Y., and Figueiredo, A. (2019). Overview of Charging and Discharging Load Forcasting for Electric Vehicles. Automation Electric Power Syst. 43, 177–191. doi:10.7500/AEPS20180814001
Chen, T., Zhang, B., Pourbabak, H., Kavousi-Fard, A., and Su, W. (2018). Optimal Routing and Charging of an Electric Vehicle Fleet for High-Efficiency Dynamic Transit Systems. IEEE Trans. Smart Grid 9, 3563–3572. doi:10.1109/TSG.2016.2635025
Chen, Z., Liu, Y., Chen, X., Zhou, T., and Xing, Q. (2020). Charging and Discharging Dispatching Strategy for Electric Vehicles Considering Characteristics of Mobile Energy Storage. Automation Electric Power Syst. 44, 77–85. doi:10.7500/AEPS20190114010
Cheng, S., Wang, X., and Feng, Y. (2018). Decentralized Optimization of Ordered Charging Scheduling in Electric Vehicle Charging Station. Automation Electric Power Syst. 42, 39–46. doi:10.7500/AEPS20170630001
Cui, Y., Hu, Z., and Duan, X. (2021). Review on the Electric Vehicles Operation Optimization Considering the Spatial Flexibility of Electric Vehicles Charging Demands. Power Syst. Technology 46, 1–16. doi:10.13335/j.1000-3673.pst.2021.0514
Duan, B., Xin, K., and Zhong, Y. (2020). Optimal Dispatching of Electric Vehicles Based on Smart Contract and Internet of Things. IEEE ACCESS 8, 9630–9639. doi:10.1109/ACCESS.2019.2961394
Fang, X., He, C., and Zhang, B. (2019). Energy Evolutional Path of the World and the Energy Structure Transformation of China. China Rev. Polit. Economy 10, 178–201.
Gan, L., Chen, X., Yu, K., Zheng, J., and Du, W. (2020). A Probabilistic Evaluation Method of Household EVs Dispatching Potential Considering Users' Multiple Travel Needs. IEEE Trans. Ind. Applicat. 56, 5858–5867. doi:10.1109/TIA.2020.2989690
Hu, J., Li, Y., Wu, J., and Ai, X. (2019). A Day-Ahead Optimization Scheduling Method for Prosumer Based on Iterative Distribution Locational Marginal Price. Power Syst. Technology 43, 2770–2780. doi:10.13335/j.1000-3673.pst.2019.0619
Kazemi, M., and Zareipour, H. (2018). Long-Term Scheduling of Battery Storage Systems in Energy and Regulation Markets Considering Battery's Lifespan. IEEE Trans. Smart Grid 9, 6840–6849. doi:10.1109/TSG.2017.2724919
Li, R., Wu, Q., and Oren, S. S. (2014). Distribution Locational Marginal Pricing for Optimal Electric Vehicle Charging Management. IEEE Trans. Power Syst. 29, 203–211. doi:10.1109/TPWRS.2013.2278952
Li, T., Tao, S., He, K., Lu, M., Xie, B., Yang, B., et al. (2021). V2G Multi-Objective Dispatching Optimization Strategy Based on User Behavior Model. Front. Energ. Res. 9. doi:10.3389/fenrg.2021.739527
Liu, Z., Wu, Q., Oren, S. S., Huang, S., Li, R., and Cheng, L. (2018). Distribution Locational Marginal Pricing for Optimal Electric Vehicle Charging through Chance Constrained Mixed-Integer Programming. IEEE Trans. Smart Grid 9, 644–654. doi:10.1109/TSG.2016.2559579
Lo, F., Mandrioli, R., Ricco, M., Monteiro, V., Monteiro, L. F. C., Afonso, J. L., et al. (2021). Electric Vehicles Charging Management System for Optimal Exploitation of Photovoltaic Energy Sources Considering Vehicle-To-Vehicle Mode. Front. Energ. Res. 9. doi:10.3389/fenrg.2021.716389
Ma, X., Wang, C., Hong, X., Li, Y., and Wang, H. (2016). A Two Layer Model for Electric Vehicle Charging Optimization Based on Location Marginal Congestion price. Power Syst. Technology 40, 3706–3714. doi:10.13335/j.1000-3673.pst.2016.12.011
Neubauer, J., and Wood, E. (2014). The Impact of Range Anxiety and home, Workplace, and Public Charging Infrastructure on Simulated Battery Electric Vehicle Lifetime Utility. J. Power Sourc. 257, 12–20. doi:10.1016/j.jpowsour.2014.01.075
Pan, Z., Yu, T., and Wang, K. (2019). Decentralized Coordinated Dispatch for Real-Time Optimization of Massive Electric Vehicles Considering Various Interests. Proc. Chin. Soc. Electr. Eng. 39, 3528–3540. doi:10.13334/j.0258-8013.pcsee.172688
Schirone, L., and Pellitteri, F. (2017). Energy Policies and Sustainable Management of Energy Sources. Sustainability 9, 2321. doi:10.3390/su9122321
Schweppe, F. C., Caramanis, M. C., Tabors, R. D., and Bohn, R. E. (1988). Spot Pricing of Electricity. Boston: Springer.
Shao, Y., Mu, Y., Yu, X., Dong, X., Jia, H., Wu, J., et al. (2017). A Spatial-Temporal Charging Load Forecast and Impact Analysis Method for Distribution Network Using EVs-Traffic-Distribution Model. Proc. Chin. Soc. Electr. Eng. 37, 5207–5219. doi:10.13334/j.0258-8013.pcsee.161470
Singh, H. K., and Srivastava, S. C. (2005). “A Reduced Network Representation Suitable for Fast Nodal price Calculations in Electricity Markets,” in 2005 IEEE Power Engineering Society General Meeting.
South China Energy Regulatory Administration (2020). Implementation Rules for Auxiliary Service Management of Grid-Connected Power Plants in Southern China. Available at: http://nfj.nea.gov.cn/frontIndex/index.do (Accessed January 8, 2022).
Tabatabaee, S., Mortazavi, S. S., and Niknam, T. (2017). Stochastic Scheduling of Local Distribution Systems Considering High Penetration of Plug-In Electric Vehicles and Renewable Energy Sources. Energy 121, 480–490. doi:10.1016/j.energy.2016.12.115
UK Department for Transport (2019). National Travel Survey: 2019. Available at: https://www.gov.uk/government/statistics/national-travel-survey-2019 (Accessed January 7, 2022).
Wang, Z., Gao, J., Zhao, R., Wang, J., and Li, G. (2020). Optimal Bidding Strategy for Virtual Power Plants Considering the Feasible Region of Vehicle-To-Grid. Energ. Convers. Econ. 1, 238–250. doi:10.1049/enc2.12018
Wu, J., Xue, Y., and Xie, D. (2019). Optimization of Reserve Service Capability Made by Electric Vehicle Aggregator. Automation Electric Power Syst. 43, 75–81. doi:10.7500/AEPS20181204003
Zhang, H., Hu, Z., Xu, Z., and Song, Y. (2017). Evaluation of Achievable Vehicle-To-Grid Capacity Using Aggregate PEV Model. IEEE Trans. Power Syst. 32, 784–794. doi:10.1109/TPWRS.2016.2561296
Zhou, K., Cheng, L., Lu, X., and Wen, L. (2020). Scheduling Model of Electric Vehicles Charging Considering Inconvenience and Dynamic Electricity Prices. Appl. Energ. 276, 115455. doi:10.1016/j.apenergy.2020.115455
Keywords: electric vehicle, vehicle-to-grid (V2G), optimal regulation, dynamic dispatching price, user demand, multi-stakeholder
Citation: Yu S, Du Z and Chen L (2022) Optimal Regulation Strategy of Electric Vehicle Charging and Discharging Based on Dynamic Regional Dispatching Price. Front. Energy Res. 10:873262. doi: 10.3389/fenrg.2022.873262
Received: 10 February 2022; Accepted: 11 March 2022;
Published: 14 April 2022.
Edited by:
Dongqi Liu, Changsha University of Science and Technology, ChinaCopyright © 2022 Yu, Du and Chen. This is an open-access article distributed under the terms of the Creative Commons Attribution License (CC BY). The use, distribution or reproduction in other forums is permitted, provided the original author(s) and the copyright owner(s) are credited and that the original publication in this journal is cited, in accordance with accepted academic practice. No use, distribution or reproduction is permitted which does not comply with these terms.
*Correspondence: Zhaobin Du, ZXBkdXpiQHNjdXQuZWR1LmNu
Disclaimer: All claims expressed in this article are solely those of the authors and do not necessarily represent those of their affiliated organizations, or those of the publisher, the editors and the reviewers. Any product that may be evaluated in this article or claim that may be made by its manufacturer is not guaranteed or endorsed by the publisher.
Research integrity at Frontiers
Learn more about the work of our research integrity team to safeguard the quality of each article we publish.