 Rory A. Barton-Grimley
95% of researchers rate our articles as excellent or good
Learn more about the work of our research integrity team to safeguard the quality of each article we publish.
Find out more
ORIGINAL RESEARCH article
Front. Remote Sens. , 08 July 2024
Sec. Lidar Sensing
Volume 5 - 2024 | https://doi.org/10.3389/frsen.2024.1404877
Measurements of water vapor are important for understanding the hydrological cycle, the thermodynamic structure of the lower troposphere, and broader atmospheric circulation. Subsequently, many scientific communities have emphasized a need for high-accuracy and spatial resolution profiles of water vapor within and above the planetary boundary layer (PBL). Advancements in lidar technologies at the NASA Langley Research Center are ongoing to enable the first space-based water vapor differential absorption lidar (DIAL) that can provide high-accuracy and vertical resolution retrievals of moisture in the PBL and through the mid-troposphere. The performance of this space-based DIAL is assessed here for sensitivity throughout the troposphere and globally with representative canonical cases of water vapor and aerosol loading. The specific humidity retrieval sensitivity to systematic and random errors is assessed, and measurement resolutions and capabilities are provided. We show that tunable operation along the side of the 823-nm absorption line allows for the optimization of the lower-tropospheric water vapor retrievals across different meteorological regimes and latitudes and provides the operational flexibility needed to dynamically optimize random errors for different scientific applications. The analysis presented here suggests that baseline and threshold systematic error requirements of <1.5% and <2.5%, respectively, are achievable. Random error is shown to dominate the retrieval, with errors on the order of 5% within the PBL being achievable with 300-m vertical 50-km horizontal resolutions over open ocean and on the order of 10%–15% over high-albedo surfaces. The flexibility of the DIAL method to trade retrieval precision for spatial resolution is shown, highlighting its strengths over passive techniques to tailor retrievals to different scientific applications. Combined, the total error budget demonstrated here indicates a high impact for space-based DIAL, with technologies being advanced for space missions within the next 5–10 years.
Water vapor is the most dominant of the short-lived greenhouse gases and plays a key role in many atmospheric processes critical to driving Earth’s weather and climate systems (Sherwood et al., 2019). Global and time-resolved measurements of water vapor are important for understanding the hydrological cycle, the thermodynamic structure of the lower troposphere, and broader atmospheric circulation. The 2017 Decadal Survey (DS) for Earth Science and Applications from Space (ESAS) showed a cross-disciplinary need for accurate and high-resolution measurements of water vapor profiles throughout the free troposphere (FT) and the planetary boundary layer (PBL) (National Academies of Sciences, Engineering, and Medicine, 2018). This need was further emphasized by the recent report from the PBL DS Incubation (DSI) study team (Teixeira et al., 2021), which identified key gaps in the Program of Record’s (POR) ability to measure water vapor in the PBL while also summarizing the measurement requirements for an improved understanding of the processes within the PBL across scales. Accurate and high-vertical resolution water vapor profiles and accurate and high-spatial resolution observations of the planetary boundary layer height (PBLH) were some of the top recommendations from both the ESAS DS and DSI study team reports.
Routine measurements of tropospheric water vapor have been made for several decades, and the POR has provided robust observations on a global scale (Teixeira et al., 2021). The PBL DSI report provides an aggregated assessment of the POR capabilities (Table 7-1; Teixeira et al., 2021). The Atmospheric Infrared Sounder (AIRS) (Chahine et al., 2006), Cross-track Infrared Sounder (CrIS) (Bloom, 2001), and Infrared Atmospheric Sounding Interferometer (IASI) (Clerbaux et al., 2009) have provided specific and relative humidity retrievals on the order of 2–3 km vertical and 12–25 km horizontal resolution at 10% accuracy within the PBL (3–7 km in the mid-to-upper troposphere), but they require clear sky and a priori information about temperature and humidity vertical distributions (Maddy and Barnet, 2008; Kahn et al., 2023). The Advanced Microwave Sounding Unit (AMSU) (Aumann et al., 2003) and the Advanced Technology Microwave Sounder (ATMS) (Kim et al., 2014), the IR sounding counterparts, have provided global coverage of specific humidity under clear and cloudy conditions; however, lower degrees of freedom led to even lower vertical and horizontal resolution than those of the infrared sounders. GNSS-RO, an active signal of opportunity counterpart to passive sounders, offers high-resolution profiles of water vapor and temperature (Ao et al., 2012); however, an under-constrained retrieval with coupled moisture and temperature refraction can result in large errors (Nehrir et al., 2017), although emerging microwave sounder/GNSS-RO retrievals show potential to overcome these challenges (Wang et al., 2024). To advance our understanding of the lower-tropospheric process across scales for weather and climate applications, specific humidity profiles with 0.2–1 km vertical and 1–50 km horizontal along track resolutions will be required (Nehrir et al., 2017; Teixeira et al., 2021). Future observing systems that build upon the POR to combine heritage techniques and new active techniques have been identified as potential avenues to meet these requirements (Nehrir et al., 2017; National Academies of Sciences, Engineering, and Medicine, 2018; Teixeira et al., 2021).
Several mature active profiling techniques have been employed for water vapor profiling. Raman lidar exploits the inelastic scattering from water vapor and nitrogen molecules to provide measurements of water vapor and temperature (in addition to aerosol extinction) simultaneously and has ground and airborne heritage (Whiteman et al., 1992; Whiteman et al., 2010; Liu et al., 2014); however, these systems require high-power ultraviolet lasers to overcome the low Raman scattering cross-section and calibration via auxiliary measurements, such as radiosondes. Feasibility studies of Raman lidar for space have been conducted (Di Girolamo et al., 2006; Di Girolamo et al., 2018; Whiteman et al., 2022); however, low subsystem technical readiness and large-power aperture products pose a significant challenge for implementation.
The differential absorption lidar (DIAL) technique, in contrast, directly measures vertical profiles of water vapor with high accuracy without the need for prior information (Schotland R.M., 1965). The DIAL technique relies on elastic scattering to measure the differential attenuation of backscattered signals between absorbing and non-absorbing transmitted wavelengths of laser light. The close spectral and temporal sampling between the online and offline wavelengths yields a direct measure of the vertical profile of water vapor number density with little sensitivity to sources of atmospheric systematic error (e.g., uncertainty in the atmospheric state). Decades of aircraft and surface-based operation (Browell et al., 1979; Ehret et al., 1993; Browell et al., 1998; Wulfmeyer and Bösenberg, 1998; Nehrir et al., 2009; Wirth et al., 2009; Nehrir et al., 2011; Späth et al., 2014; Spuler et al., 2015; Späth et al., 2016; Fix et al., 2019; Bedka et al., 2021; Spuler et al., 2021; Carroll et al., 2022; Millán et al., 2024) have demonstrated a high degree of measurement readiness; however, technological advances are still required to realize DIAL measurement in space (Nehrir et al., 2017; Teixeira et al., 2021).
The feasibility of a space-based DIAL has been assessed from a theoretical perspective (Browell et al., 1985; Ismail and Browell, 1989; Nagasawa et al., 1995; European Space Agency, 2001; Di Girolamo et al., 2004; European Space Agency, 2004; Di Girolamo et al., 2008). Ismail and Browell (1989) studied the systematic and random error and retrieval performance for a 720-nm DIAL system with heritage from the airborne Lidar Atmospheric Sensing Experiment (LASE) (Browell et al., 1998). The DLR WAter vapor Lidar Experiment in Space (WALES) concept (Gerard et al., 2004) explored advanced DIAL capabilities at 935 nm with multiple transmit wavelengths to provide sensitivity from the upper troposphere and lower stratosphere (UT-LS) to the PBL. Studies of random and systematic error (Di Girolamo et al., 2004), retrieval capabilities (Di Girolamo et al., 2008), and comparisons to passive retrievals (Wulfmeyer et al., 2005) supported the WALES concept and provided a foundation for future space-based DIAL that will require multi-wavelength retrievals for global coverage across certain moisture regimes. It should be noted that none of these previous concepts or studies considered a tunable transmitter for variable PBL wavelength pairs, and, as such, PBL measurements from these concepts and studies were only optimized over certain latitudes instead of globally.
The NASA Langley Research Center (LaRC) has been advancing water vapor DIAL technologies to enable the first space-based DIAL measurements of water vapor profiles and total precipitable water vapor with cross-cutting capabilities to measure attenuated backscatter profiles, distributions of the PBLH, surface-weighted water vapor columns (XH2O), and methane columns (XCH4) (Nehrir et al., 2021). The novel laser technology being developed for water vapor sensing at 823 nm (Burns et al., 2021) allows for simultaneous measurements of XCH4 with high accuracy and spatial resolution. Prior studies have shown the feasibility of the 820-nm spectral region for ground-based DIAL (Machol et al., 2004); however, this spectral region is relatively unexplored and lacks assessment for space-based implementation. The development of a space-based water vapor DIAL concept with multiple transmitted wavelengths and the ability to tune spectrally across the absorption line wing is being explored by the NASA LaRC to meet the needs of a future PBL observing system (Nehrir et al., 2021; Teixeira et al., 2021). Multi-wavelength operation and spectral tunability are both required for measurement sensitivity from the UT-LS to the PBL and across latitudinal moisture gradients; however, this functionality also imposes technical challenges (European Space Agency, 2001; European Space Agency, 2004; Wirth et al., 2009; Wulfmeyer et al., 2015; Carroll et al., 2022). Here, we study the feasibility of using the 823-nm water vapor line for space-based DIAL while adhering to the confines of emerging laser technology and spacecraft size, weight, power, and mission cost constraints.
In this paper, we present a study of the systematic and random errors associated with 823-nm water vapor DIAL and assess the feasibility of retrieving range-resolved profiles of water vapor throughout the FT and PBL. For an accurate and complete description of this measurement capability, we use the Atmospheric Boundary Layer Lidar Pathfinder (ABLE) of the NASA LaRC (Nehrir et al., 2021) as a source of instrument parameters, method of operation, and wavelength selection. A detailed instrument description is beyond the scope of this paper and the focus of a future publication. The following sections provide a description of the DIAL methodology, characterization of the sensitivity to the sources of systematic error in the transmitter subsystem, and the sensitivity of humidity retrievals to varying levels of random errors resulting from different averaging schemes.
For a given DIAL wavelength, the number of received signal and noise photons can be described through the elastic lidar equation as follows:
where the number of transmitted photons per laser pulse is given by
The water vapor number density in each DIAL averaging range bin,
where
For this study, the pressure, temperature, and water vapor profiles used for the atmospheric state are derived from the Air Force Research Lab standard models (Anderson et al., 1986). To calculate the water vapor differential absorption cross-sections (DCSs), the HITRAN2016 spectroscopic database is used (Gordon et al., 2017), and a Voigt line shape is assumed. Future analysis will utilize the HITRAN2020 database; however, initial investigations have found little change at this spectral region.
Operation at the 823-nm water vapor absorption line is driven by the advance of an Er:YAG laser that provides access to the near-infrared (NIR) region via non-linear optical conversion with relatively high electrical-to-optical efficiency. This laser oscillator is more electrically efficient and employs a simpler architecture than parametric optical conversion, which has commonly been used for airborne DIAL (Wirth et al., 2009; Carroll et al., 2022). The Er:YAG laser is injection-seeded using a low-power semiconductor laser stabilized to a methane absorption line and emits pulsed light at 1,645 nm via optical pumping at 1,532 nm and active q-switching. Frequency doubling in lithium triborate (LBO) provides access to water vapor lines at 823 nm for moisture profiling, while the residual fundamental light coincides with 1,645-nm methane absorption lines for column measurements. Figure 1 shows the methane (blue) and water vapor (black) absorption cross-sections at the fundamental and doubled spectra, respectively, for several altitudes. To provide uniform sensitivity from the mid-troposphere (10 km) to the PBL, three DIAL wavelengths (two wavelength pairs) are required. The successive transmission of three wavelengths allows for a single water vapor DIAL retrieval and single methane columnar measurement employing the integrated path DIAL (IPDA) technique.

Figure 1. Methane (blue) and water vapor (black) spectra for the Er:YAG fundamental and frequency-doubled, wavelength regions calculated using HITRAN2016 line parameters and a Voigt line shape. The methane IPDA wavelengths set the water vapor DIAL wavelengths (CH4 online, 1645.5518 nm, and offline, 1645.8420 nm; H2O online, 822.921 nm, and offline, 822.7759 nm). The sideline wavelength tuning range is shaded in gray.
The fundamental and frequency-doubled wavelengths of 1,645.5518 and 822.7759 nm set the methane IPDA online and water vapor DIAL offline wavelengths, respectively, while 1,645.8420 and 822.9210 nm set the methane IPDA offline and water vapor DIAL online wavelengths, respectively. A tunable third wavelength near 1,645.75–1,645.825 nm (822.875–822.9125 nm) is utilized only for the water vapor DIAL retrieval to provide latitudinal sensitivity to different PBL regimes. A 2-kHz laser pulse repetition frequency (PRF) transmits 666 shots per wavelength per second with wavelength switching on a shot-to-shot basis with high spectral purity. The remainder of this paper focuses on water vapor DIAL at 823 nm; however, an in-depth analysis of methane IPDA at 1,645 nm can be found in some studies (Ehret et al., 2008; Kiemle et al., 2014; Bousquet et al., 2018; Barton-Grimley et al., 2022), and a detailed analysis of the projected performance of the methane retrieval employing this Er:YAG laser will be the focus of a future publication.
To understand the sensitivity of the DIAL retrieval to different parts of the troposphere, the DCS can be examined. Figure 2 shows the DCS for each line pair over the sideline tuning range, emphasized in Figure 1, calculated with the US standard atmosphere (a–b) and example profiles of the DCS with the bounding moist tropical and dry arctic atmospheres (c–d); Figure 3 provides atmospheric state definitions. The online–sideline DCS (Figure 2A) peaks in the upper FT and, therefore, exhibits higher sensitivity to measurements in this region, with a broadly uniform response to sideline wavelength tuning. Figure 2B shows that the sideline–offline pairs peak in sensitivity in the lower FT, extending into the PBL, and the overall sensitivity is decreased as sideline tuning progresses to shorter wavelengths. Combining the FT and PBL line pairs provides vertical coverage from ∼10 km down to the surface. The methods of line-pair splicing have been explored for space (Di Girolamo et al., 2008) and are routinely implemented from aircrafts (Di Girolamo et al., 2008; Wirth et al., 2009; Carroll et al., 2022). A combination of optical depth and retrieval uncertainty is used to optimally combine wavelength pairs into a single retrieval, where the intermediate regions are filled in using a weighted mean. These methods are operational in the HALO technology testbed instrument, documented by Carroll et al. (2022), and have been evaluated as a robust method for space-based operations.
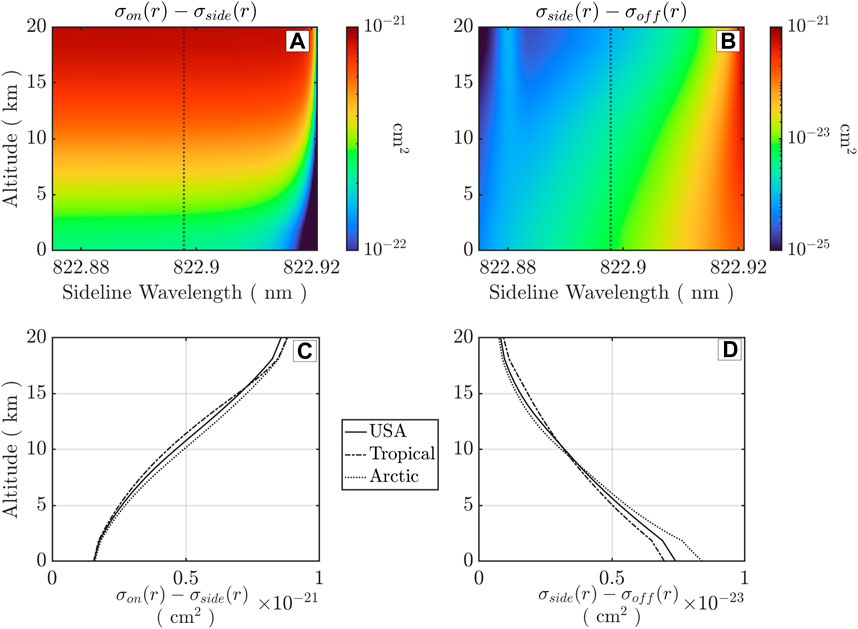
Figure 2. Variable altitude sensitivity as indicated by sideline-dependent differential absorption cross-sections. (A) Online–sideline. (B) Sideline–offline (a-b in United States standard atmosphere). (C,D) DCS profiles with Arctic and tropical atmospheres corresponding to the vertical lines in (A,B).
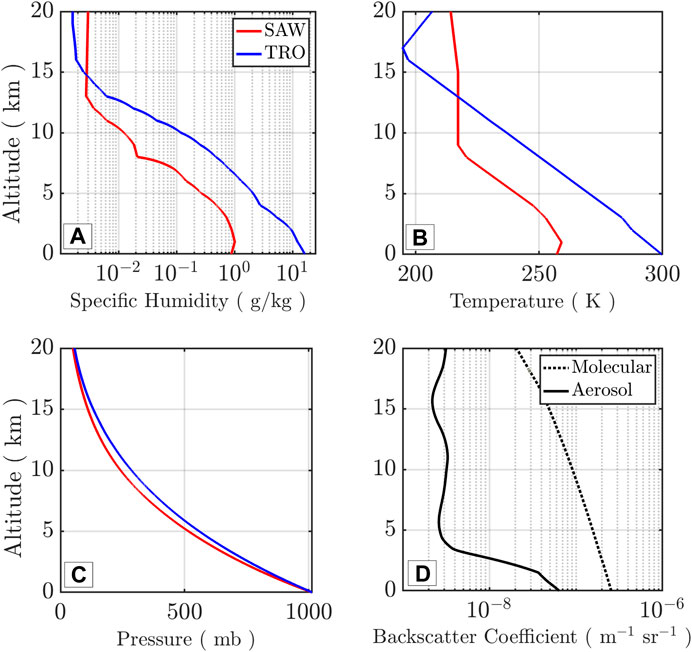
Figure 3. Atmospheric state profiles for sub-Arctic winter (SAW) and tropical (TRO) scenes. (A) Specific humidity, (B) temperature, (C) pressure, and (D) backscatter coefficients used in Section 3.2.
Sources of error within the DIAL measurement can be systematic, from instrumental and atmospheric states, random, or from background photons and shot noise. The primary sources of systematic errors result from uncertainty in the laser line locking, broadening of the laser line, and spectral impurity (Ismail and Browell, 1989), all relating to uncertainty in the knowledge of the absorption cross-section. Uncertainty in the knowledge of the atmospheric state, i.e., temperature and pressure, can also result in systematic errors, where the magnitude of the error is line dependent. Random errors can originate from shot noise on the backscattered and solar background signals and detector dark counts (Wulfmeyer and Craig, 2001), both serving to decrease retrieval precision. An error in the water vapor number density can be directly evaluated by calculating the absolute error in the DCS for uncertainty in a specific parameter. The same parameter uncertainty can be combined with the atmospheric state to calculate the specific humidity retrieval error. This analysis uses the standard atmosphere at its two extremes, high-humidity tropical (TRO) and low-humidity sub-Arctic winter (SAW) (Figure 3), to quantify errors with respect to retrievals of specific humidity.
The sideline domain considered for analysis here is shown in Figure 1 by the gray region, spanning 822.875–822.920 nm. The upper limit of this range is bracketed by the online wavelength at 822.9210 nm for completeness; however, in practice, the range will likely be limited to 822.9125 nm. The lower limit is bracketed by the wavelength that yields the equivalent cross-section to the offline wavelength at surface level, i.e., where the sideline–offline differential optical depth is zero. The largest contributors to the systematic error budget are considered in this section and comprise the laser spectral width uncertainty, laser center frequency uncertainty, spectral purity, Rayleigh–Doppler (RD) broadening, and atmospheric state.
The Fourier-transform-limited laser linewidth of the Er:YAG laser being considered here is 3 MHz (assuming a 100-ns full-width at half-maximum (FWHM) temporal pulse duration with Gaussian distribution). Prior studies showed that a linewidth uncertainty of <400 MHz is required to minimize the error in water vapor number density estimates (Bösenberg J., 1998); however, these uncertainty bounds are typically line dependent and assume operation at the line center. Pressure broadening of the absorption line influences the magnitude of the error and can also vary for operations on the side of the selected absorption line. This is also relevant at the offline wavelength (Figure 1) due to the non-negligible absorption for the selected line.
The effective absorption cross-section is a convolution of the laser line shape represented in frequency space by
where the constant
Figure 4 shows the error in specific humidity for linewidth uncertainty at surface level (Figures 4A, D), 5 km (Figures 4B, E), and 10 km (Figures 4C, F) for all sideline wavelengths. For small deviations, small errors are observed for all sideline wavelengths, indicating that the even moderate detuning from transform-limited operation, <100 MHz, will be negligible (<0.01%). Errors are highest in the upper FT due to the absence of pressure broadening, where a 1% error can occur from a 250-MHz linewidth uncertainty on the laser linewidth. Within the PBL, low errors of <0.1% are observed across all wavelengths. A low-error inflection point, caused by the presence of a weak line near 822.88–822.89 nm (Figure 1), can be observed at the surface level and manifests more drastically at higher altitudes.
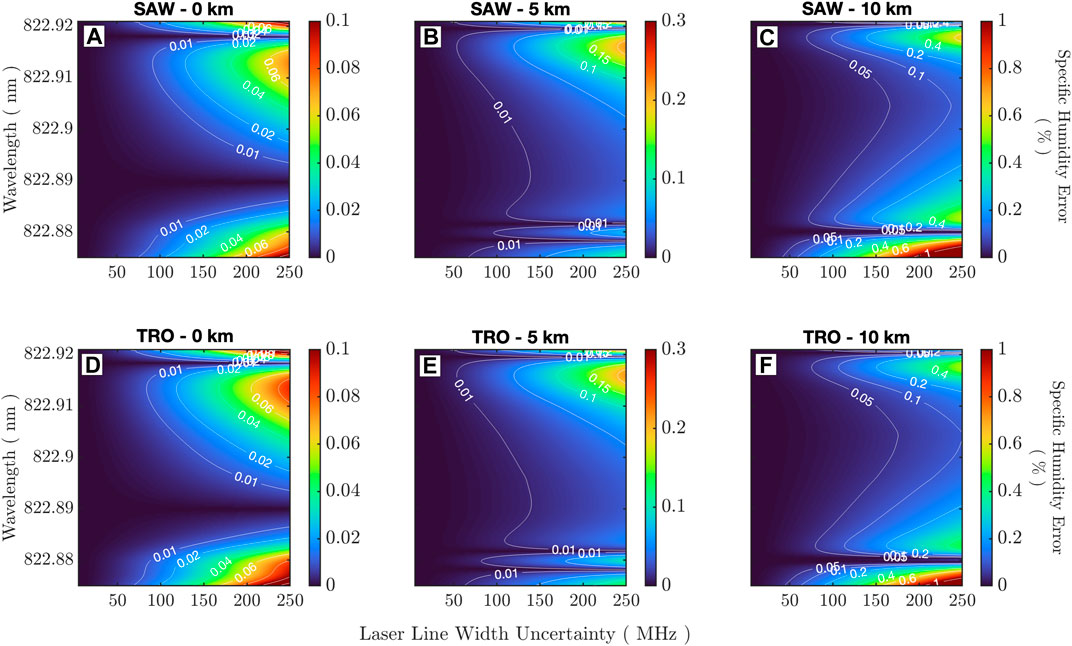
Figure 4. Specific humidity error due to laser spectral width uncertainty for sideline–offline retrievals (822.875–822.921 nm is shown to include the online); (A–C) sub-arctic winter; (D–F) tropical. Surface/PBL (A,D), lower FT (B,E), upper FT (C,F).
Precise knowledge about the transmitted wavelength of the pulsed laser is necessary to reduce systematic errors resulting from uncertainty in the knowledge of the DCS. Stabilization of the seed laser wavelength to the 1,645-nm methane line results in an absolute frequency knowledge of <1 MHz (Nehrir et al., 2018). Based on laboratory results, frequency pulling of the Er:YAG oscillator with respect to the injection seeding source can result in an additional uncertainty in the transmitted center frequency of up to 20 MHz; however, typical root-mean-square (RMS) uncertainty is within 1–5 MHz on a shot-to-shot basis.
To understand the impact of the uncertainty in the transmitted wavelength uncertainty on the water vapor retrieval, Eq. 3 can be utilized with a frequency offset introduced,
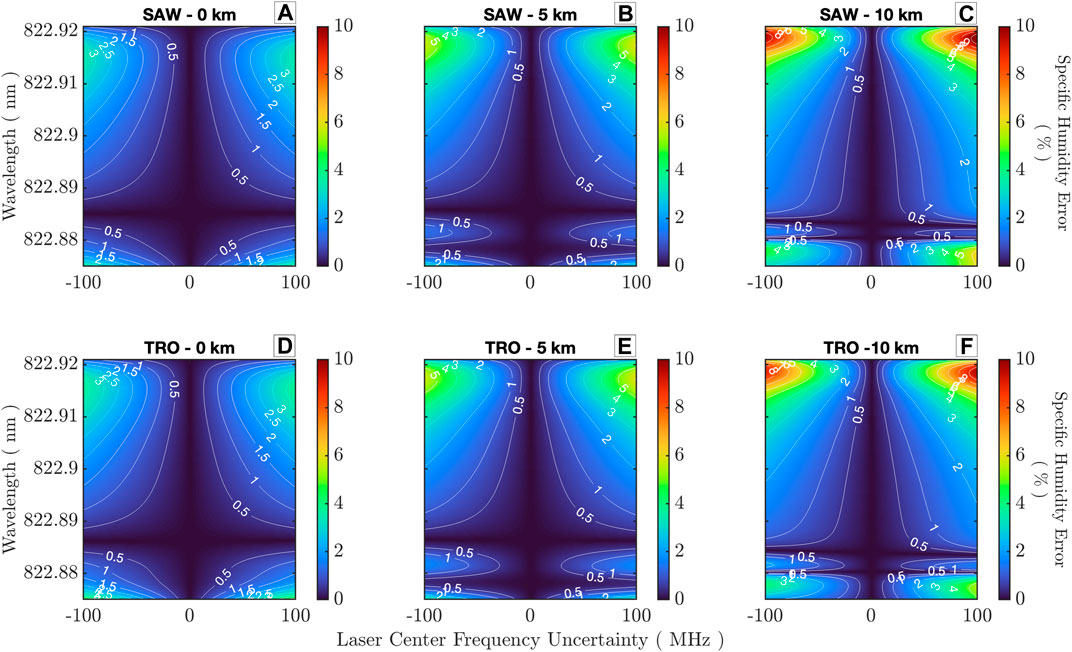
Figure 5. Specific humidity error due to uncertainty in the laser center frequency for sideline–offline retrievals; (A–C) sub-Arctic winter; (D–F) tropical. Surface/PBL (A,D), lower FT (B,E), and upper FT (C,F).
Spectral purity is defined as the ratio of the laser energy transmitted within a narrow spectral band (typically <1 GHz) to that of the total transmitted energy. Spectral impurity can result from broadband amplified spontaneous emission (ASE) or higher-order laser modes (i.e., degraded injection seeding for the system discussed here) and is generally treated as an unabsorbed component of the transmitted online laser energy, thereby decreasing the effective cross-section at the absorbing wavelength. The unabsorbed spectrally impure component of the transmitted energy is dependent on the spectral purity, α, and the water vapor optical depth,
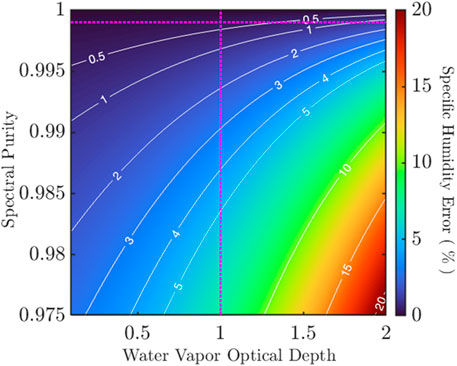
Figure 6. Error in specific humidity from spectral purity for a generalized optical depth. A retrieval error of <0.5% with a spectral purity of 99.9% is achieved for an optical depth of 1.
When operating on the side of the absorption line, multi-modal operation sets a scenario where blueward modes see smaller cross-section values and redward modes see larger cross-section values (relative to the main mode), creating a non-linear effective cross-section response. To assess the retrieval sensitivity to this effect, we simulate a worst-case scenario of degraded injection seeding, where we introduce first- and second-order longitudinal modes that contain 1% and 0.1% of the total transmitted energy, respectively. The simulated longitudinal modes for the Er:YAG laser are separated from the fundamental by the laser free spectral range (FSR), which is ∼400 MHz (800 MHz) at 1,645 nm (823 nm), with each exhibiting a transform-limited linewidth of ∼3 MHz. Due to the end-pumped design, additional higher-order axial modes are negligible and not considered here (Burns et al., 2021).
The transmitted multi-mode spectra can be convolved with the absorption spectra across the sideline and offline spectral ranges at different altitudes to evaluate the error in specific humidity (Figure 7. Errors of ∼8% at higher altitudes near the line peak are observed due to line narrowing and the relative slope difference observed by each of the additional modes, but they decrease to <2% as the sideline wavelength is tuned to lower wavelengths. The impact near the surface in the PBL is minimal by comparison, with errors <0.5–1.5% over the entire tuning range. This indicates that spectral purity as an error source is greatly reduced when operating on the sideline and within the pressure-broadened PBL regions.
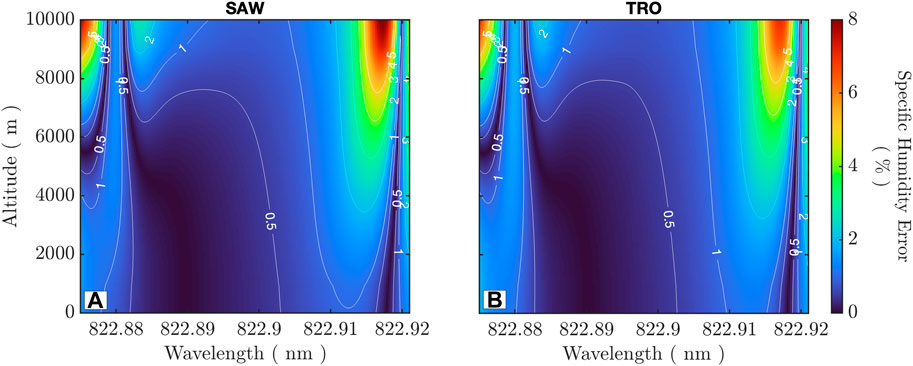
Figure 7. Specific humidity retrieval impact due to worst-case multimode laser operation (additional modes of 1% and 0.1% included with a 400-MHz FSR at 1,645 nm and 3-MHz linewidth at the fundamental wavelength). (A) Dry Arctic; (B) moist tropics. The maximum error occurs at high altitude and near the line peak. A <0.5–1% error is observed for all wavelengths within the PBL.
RD broadening of the backscattered laser light is a manifestation of the thermal motion of air molecules and can be calculated for an assumed Gaussian shape at the absorption line peak (Measures, 1984). For example, when considering the online wavelength, 822.921 nm, an RD FWHM of 3.22 pm, 1.42 GHz, is estimated when considering a temperature of 217 K at 10 km (SAW), which is ∼500x the laser transform-limited linewidth of the laser. The RD effect can introduce errors when the assumed backscattered spectra are assumed to be of a single frequency, yet the actual spectra are Doppler-broadened, thereby reducing the effective absorption cross-section (Ansmann, 1985; Ansmann and Bosenberg, 1987). The RD effect is absent in clouds and aerosols due to a lower velocity distribution, but errors can manifest at transition regions from molecular to aerosol/cloud scattering, such as at the transition to a clean air-topped PBL that is laden with aerosol, and yield a >20% retrieval error when not corrected for (Späth et al., 2020). Corrections for the RD effect have been demonstrated (Ansmann and Bosenberg, 1987; Ismail and Browell, 1989) when operating at the line peak and result in a residual error from the RD effect of <2% (smaller backscatter gradients yield lower residual error) and are routine in airborne multi-wavelength DIAL operations at 935 nm (Carroll et al., 2022).
A recent study examined sideline tuning and the RD effect at the 818-nm absorption line and found that the effect decreased with operation on the side of the absorption line when compared to the line peak (Späth et al., 2020). This is due to counteracting absorption effects that offset each other due to the non-linear line slope. Additionally, the authors found that specific sideline wavelengths yielded negligible error; however, this was altitude dependent and specific to the atmospheric state and aerosol loading. Notably, Spath et al. (2020) showed that the RD effect corrections posed by Ansmann and Bosenberg (1987) were translatable to sideline operation, which have also been demonstrated at 935 nm by Carroll et al. (2022). Collectively, these studies indicate agnosticism to the specific line being examined and that the primary impact of the RD effect at 823 nm will be at the online wavelength, i.e., mid-to-upper troposphere retrievals. Given this work, it is expected that the RD effect at 823 nm can be corrected to a 1%–2% residual error.
The sensitivity of the DIAL retrieval to uncertainty in temperature and pressure is highly dependent on the absorption line and the derived observable (i.e., number density vs. specific humidity). Examples of temperature sensitivity in the 720- and 828-nm regions have been performed (Browell et al., 1991; Nehrir et al., 2009). Ground-state energies of E’’ = 70–300 cm-1 (number density) and E’’ = 220–500 cm-1 (mixing ratio) will be insensitive to temperature fluctuations within the lower-mid-troposphere, with E’’ = 350–550 cm-1 being suitable for PBL measurements (Browell et al., 1991). From, the absorption line considered for this study is fixed by the narrow gain/emission spectra of the Er:YAG laser and exhibits a ground-state energy at 822.9218 nm (line center) of E’’ = 134.9016 cm-1 (HITRAN2016), which is a lower value than that indicated above for the expected specific humidity retrieval within the PBL.
Retrieval sensitivity to uncertainty in the knowledge of pressure is relaxed due to pressure broadening throughout the mid-lower troposphere; however, a monthly bias of <1 hPa in surface-pressure reanalysis products is known to exist (Gelaro et al., 2017). Additionally, errors from unaccounted pressure shifts in the location of the absorption line center can arise from uncertainty in absolute pressure (Grossmann and Browell, 1989; Nehrir et al., 2011). These two effects can be mostly minimized by utilizing accurate reanalysis products with low atmospheric state uncertainty along with accurate spectroscopic parameters of the temperature and pressure dependence of the absorption line (Bösenberg, 1985).
Figures 8A–D show the error in the specific humidity retrieval with ± 3 K of temperature uncertainty for the TRO/SAW atmospheres at the surface level. The line discussed here shows minor temperature dependency, with up to 2.5% error in the retrieved humidity at the upper bounds of the temperature offset. Realistic reanalysis product uncertainty of ± 1.5 K provides <1% error (Gelaro et al., 2017). This indicates that although the ground-state energy is not at a temperature-neutral point for measurements from 10 km to the surface, the overall temperature sensitivity is still acceptable for much of the wavelength range considered here. Similarly, Figures 8E–H show the error in specific humidity for ± 2 hPa of pressure uncertainty for the TRO/SAW atmospheres, and the resulting humidity error is observed to be <0.5% across the entire wavelength range.
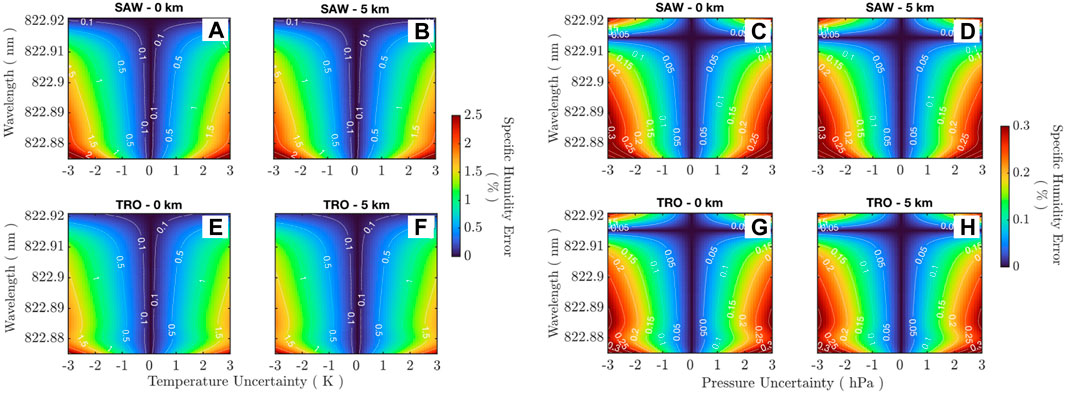
Figure 8. (A–D) Specific humidity error due to temperature uncertainty. An error of <1% is observed for
Given the tight DIAL spectral requirements (Table 2), spacecraft motion along the orbit track can introduce Doppler shifts, which translate to uncertainty in the absolute wavelength and resultant effective absorption cross-section (see Section 3.1.2). This error is proportional to the transmit frequency, spacecraft velocity, pointing uncertainty, and direction of the off-nadir pointing. Satellite platforms exhibit pointing uncertainties on order of <120 urad (1-sigma) along the track (Yost, 2021), which translates to a ∼ +/−2-MHz absolute frequency uncertainty (a residual error of <1% in specific humidity).
Estimates for the allowable systematic error are provided by Nehrir et al. (2017), where a threshold (baseline) requirement of <5% (<2%) was identified for accurate lower tropospheric observing. The resulting instrument requirements can be drawn from the WALES technical literature (European Space Agency, 2001; Gérard et al., 2004), where <60-MHz laser frequency stability, <160-MHz linewidth (FWHM), and >99.9% spectral purity were given to allow for accurate observations from the stratosphere to the surface when operating at 935 nm. These requirements are more stringent than those identified here as an emphasis on lower tropospheric and PBL sensing allows relaxed spectroscopic and transmitter requirements at 823 nm. As discussed in Section 3.1.2, a baseline ± 5-MHz frequency stability is expected such that the error contribution from uncertainty in the transmitted frequency will be minimized. The errors arising from inaccurate measurements of the water vapor absorption cross-section are estimated at 2% (European Space Agency, 2001); however, this could be reduced with laboratory experiments to derive higher-accuracy 823-nm line parameters. The overall receiver error from sources such as transmitter/receiver misalignments (resulting from pointing jitter between “on” and “off” wavelengths) and detection non-linearity are expected to be 1%–2%.
The baseline and threshold systematic error estimates for the surface atmosphere (i.e., PBL) from Section 3.2 are given in Table 1 and Figure 9, from which the aggregate systematic error for the sideline operation region, 822.875–822.920 nm (see Figure 1), was determined. It was elected to emphasize the mid-latitude operating wavelength (822.9063 nm) in Table 1 as it provides an average error estimate between the polar (higher error) and tropical (lower error) operating wavelengths. The baseline systematic error is met at 1.129% in the PBL, which increases to 2% in the upper troposphere. The threshold systematic error is met at 1.591% in the PBL but increases to 5% in the upper troposphere. Here, we see that the surface-level pressure broadening relaxes the systematic error and allows a higher tolerance to non-ideal system characteristics than the sideline wavelength within the upper troposphere (where it is used in the online–sideline pair).
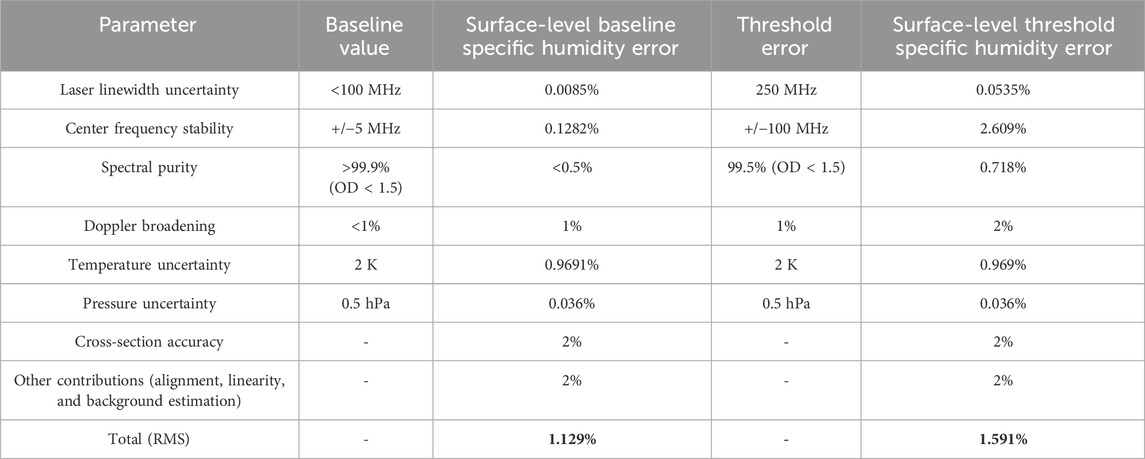
Table 1. Baseline and threshold system requirements and the resulting specific humidity retrieval error from individual contributors. The mid-latitude wavelength error values from Figure 9, 822.9063 nm, are considered as a pseudo-average between polar (higher) and tropical (lower) values.
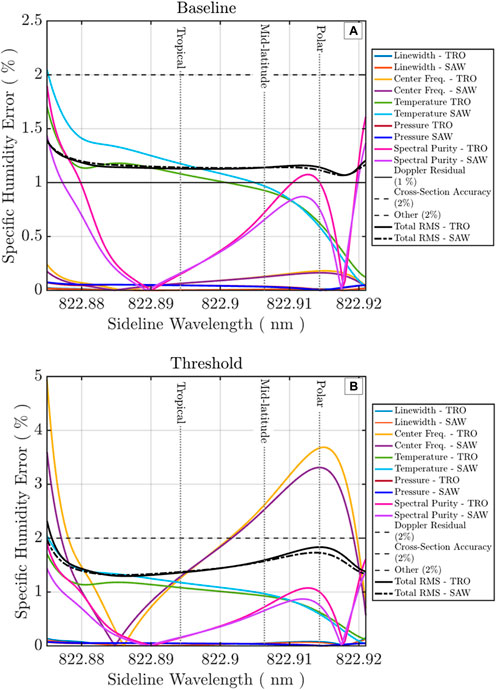
Figure 9. Systematic errors for PBL/surface retrievals for all contributors as a function of wavelength. (A) Components and total error for TRO/SAW considering the baseline instrument parameters in Table 1. (B) Components and total error for TRO/SAW considering the threshold instrument parameters in Table 1. The vertical lines show the average wavelengths of operation for polar, mid-latitude, and tropical atmospheres assuming a one-way optical depth of 1.
Table 1 and Figure 9 show that the cause and spectral location of the systematic errors vary between the baseline and threshold instrument parameters. The baseline error sees minor changes from the polar to tropical operating wavelengths, <0.1%, indicating a flat error response to sideline tuning (Figure 9A). A larger change is observed for the threshold error from polar to tropical operating wavelengths, 0.5%, with a non-linear response to sideline tuning (Figure 9B). Evaluating the individual contributors for the baseline case, Figure 9A shows that near the line peak, the error due to spectral purity is dominant, while at the lowest end of the tuning range, spectral purity exhibits a second peak along with temperature uncertainty. In the threshold case, Figure 9B shows that the primary driver is uncertainty in the transmitted frequency, with spectral purity and temperature uncertainty playing minor roles. Figure 5 indicates that a 100-MHz transmitted frequency uncertainty results in a 10%–12% error in the mid-troposphere, which reduces to 3%–4% within the PBL due to pressure broadening, and the total RMS threshold requirement of 5% can still be met. In both the baseline and threshold scenarios, the components from Doppler broadening correction residuals, absorption cross-section accuracy, and miscellaneous contributions also play a significant role in meeting baseline requirements as they make up a larger portion of the total RMS and should be considered from a total system design perspective.
The relative random error present in the DIAL retrieval is driven by the water vapor optical depth and SNR at each wavelength. Assuming Poissonian statistics, the random error in the number density estimate can be given as follows (Measures, 1984; Spuler et al., 2015):
where the number of range bins averaged is m, the number of horizontal shots averaged is k, and
Solar background noise is a primary factor for daytime performance and is driven by the receiver spectral bandpass and field of view, surface albedo, solar zenith angle, and water vapor optical depth. The solar background photon arrival rate at the detector face is given by the following equation:
where
Determination of the total irradiance requires integration over the spectral bandpass of the receiver. For optimal spectral filtering, the receiver considered here utilizes high-finesse etalons and spatially separated and dedicated detection channels for each DIAL wavelength. A single narrow-band interference filter (NBF) is placed upstream of the high-spectral resolution receiver to block broadband solar radiation and the transmission of higher-order etalon modes. The total irradiance centered at each DIAL wavelength can be represented as follows:
where
The instrument parameters used are given in Table 2, derived from the study by Nehrir et al. (2021), and Figure 3D shows the backscatter coefficients for a global mean aerosol profile (Tackett et al., 2018) and molecular offline profile (a lidar ratio of 40 is assumed to compute the extinction profile).
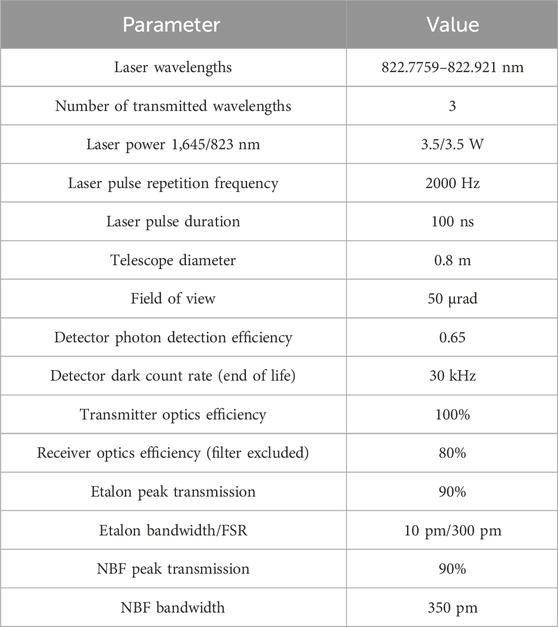
Table 2. Instrument parameters.
An example of the expected instrument performance for the parameters in given Table 2 with low, medium, and high surface albedos (A = 0.02, 0.2, and 0.5) in the SAW and TRO atmospheres is shown in Figure 10. Retrieval errors are shown for the online-to-sideline and sideline-to-offline pairs (the optimum sideline wavelength is used for each scene, i.e., SAW, 822.9170 nm, and TRO, 822.9052 nm), considering ΔR = 1 km vertical and ΔH = 50 km along track (online–sideline) and ΔR = 300 m vertical and ΔH = 50 km along track (sideline–offline) resolutions. In SAW, the online–sideline pair provides <20% error up to ∼7 km, and the sideline–offline pair provides <20% error for all surface albedos up to ∼4 km. In TRO, the performance of the sideline is enhanced with greater differential absorption optical depth (DAOD), yielding a <10% error, with sensitivity to above 10 km from the online–sideline pair and PBL errors of <20% up to 3 km over the brightest surfaces.
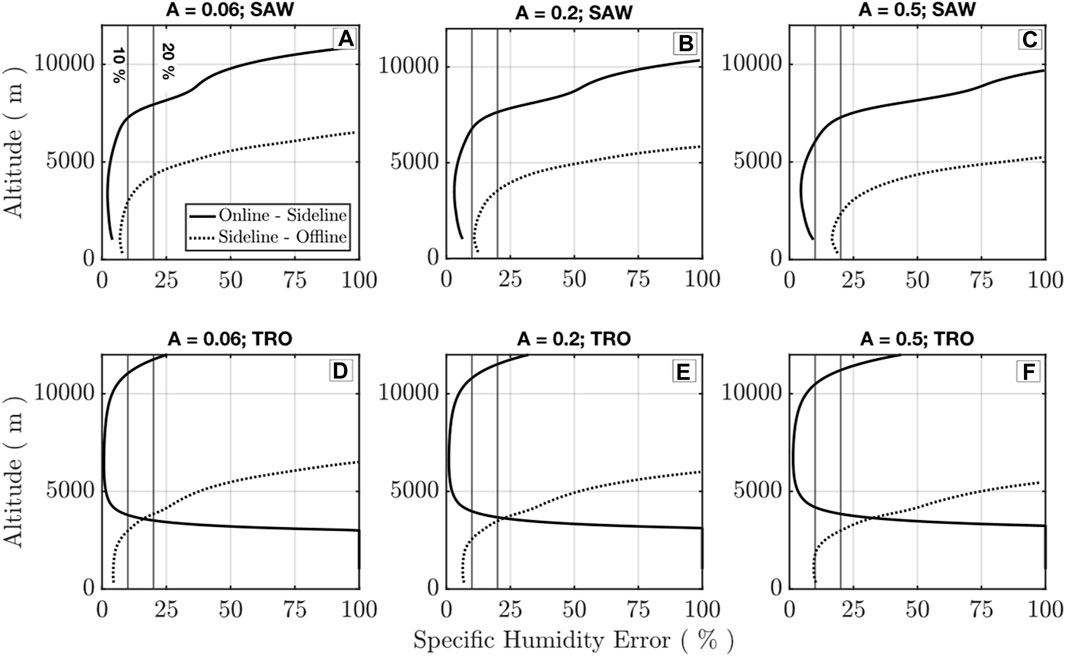
Figure 10. Specific humidity retrieval error from the surface to 12 km with the online to sideline (
Figure 11 examines the expected performance specifically for PBL retrievals under day and night conditions for the SAW and TRO atmospheres over a high-albedo surface (A = 0.5). The specific humidity retrieval error is calculated for all sideline wavelengths considering ΔR = 300 m vertical and ΔH = 50 km along track resolutions. Under night conditions (Figures 11A, C), the retrieval random error reaches <5% when the optimal wavelength is considered. The night backscatter profiles are shot noise-limited as the detector dark count rate is much lower than the integrated signal rate (
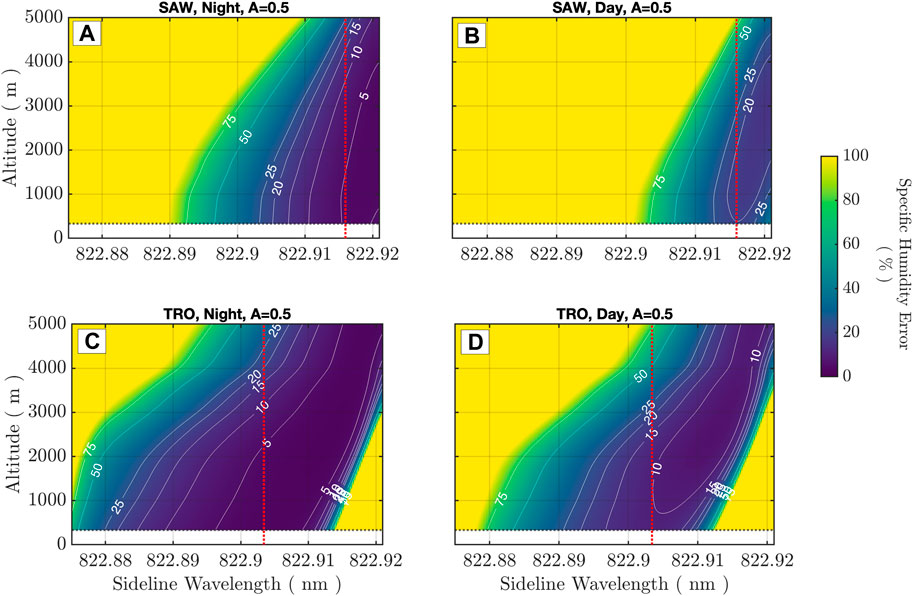
Figure 11. Lower troposphere-specific humidity retrieval error (sideline to offline) obtained with
Individual profiles of random errors in the retrieval are shown in Figure 11 for the sideline wavelengths, where daytime retrieval error is minimized at the surface. Additionally, the online–sideline retrieval error for these wavelength selections can be evaluated for mid-FT retrieval errors at coarser vertical resolutions (
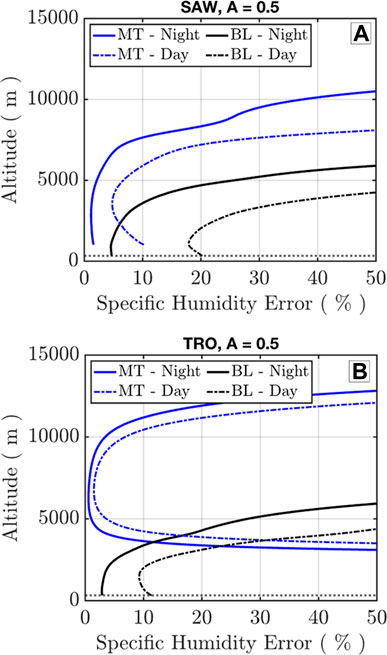
Figure 12. Specific humidity retrieval error from Figure 11 at the wavelengths indicated by the red lines. (A) Arctic retrievals. (B) Tropical retrievals. Both (A,B) show day and night for online–sideline middle troposphere (MT), 1 km × 50 km, and sideline–offline (BL), 300 m × 50 km.
Over open ocean, the surface albedo in the 823-nm band can be estimated at A = 0.04–0.08 (Varotsos et al., 2014), which yields a Lambertian surface reflectivity of ∼0.02 sr−1 (a complete treatment of ocean surface reflectivity is provided by Kiemle et al. (2014)). Figure 13 shows the day and night expected performance over open ocean for the same retrieval resolutions as shown in Figure 11. The reduced surface albedo significantly decreases the daytime retrieval error to <5% at the surface for the optimized sideline wavelength (Figure 13B). The profiles of random error for the daytime retrieval are shown in Figure 13C, where the PBL retrieval is <5% up to 2 km, <10% up to 3 km, and <20% up to 4 km. Combined together, the PBL and mid-FT line pairs yield a daytime error of <10% throughout the entire PBL region up to 5 km for ocean scenes.
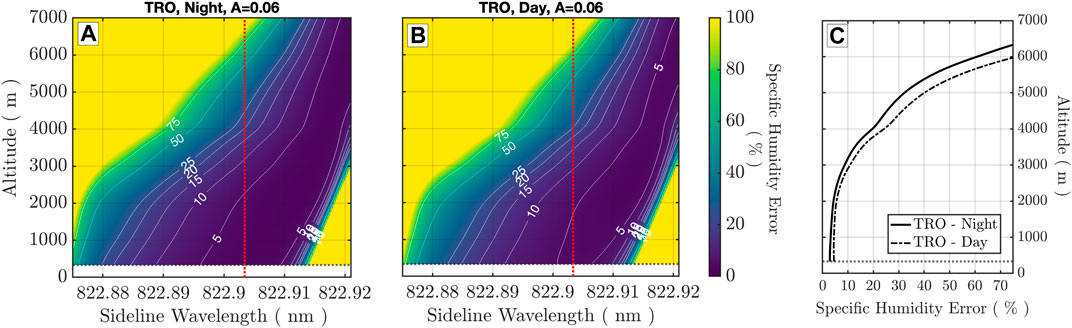
Figure 13. Lower troposphere-specific humidity retrieval error (sideline to offline) obtained at
The performance shown in Figure 13 indicates that there is an opportunity to leverage the inherent flexibility within the DIAL method to further optimize retrieval resolutions. Specifically, DIAL enables a trade between resolution and uncertainty, such that an increased spatial resolution can be afforded at the expense of precision. The retrieval error proportionality can be simplified to the averaging dependencies as
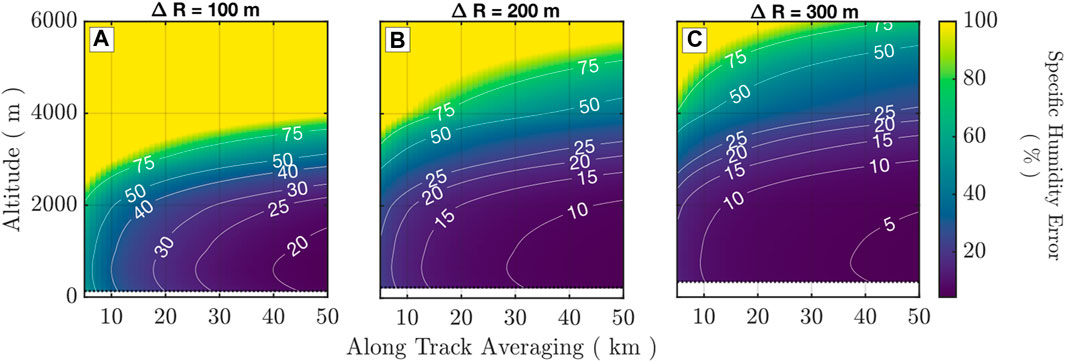
Figure 14. Profiles of random error in the specific humidity retrieval (sideline to offline) obtained at fixed vertical resolutions and varying along track integration for TRO over open ocean; A = 0.06 under daytime conditions. (A)
Uncertainty in the DIAL retrieval can arise from systematic (correlated) and random (uncorrelated) errors. Sources of systematic error can stem from the transmitter and receiver subsystems, such as laser frequency uncertainty or detection non-linearity, uncertainty in assumed atmospheric temperature and pressure states, and absorption cross-section accuracy. The random error discussed here is dominated by noise derived from solar background photon counts, detector dark counts, and shot noise. The simulation results given in Section 3 indicate that the systematic and random error magnitude resulting from the current space-based water vapor DIAL technology developments is within the requirements laid out by several community reports (National Academies of Sciences, Engineering, and Medicine, 2018; Teixeira et al., 2021). The requisite instrument specifications (power aperture product and laser spectral fidelity) needed to achieve the required SNR and retrieval performance are being developed. Additional future technology developments and maturation (increased laser power and detection efficiency) will provide increased performance to further increase science capabilities.
Table 1 and Figure 9 provide an encompassing view of the threshold and baseline systematic error. The threshold characteristics of the Er:YAG transmitter considered, i.e., a laser linewidth uncertainty of <250 MHz, center frequency stability of ± 100 MHz, and a spectral purity of 99.5% give a maximum systematic error of 2.317%, could be achieved over the 822.875–822.921-nm wavelength range with a minor peak of 1.833% at 822.9145 nm. Figure 9A shows a minimum error of 1.25%, providing upper and lower bounds (the tropical atmosphere exhibited the highest cumulative error due to the higher moisture loading). The baseline configuration with <100 MHz, center frequency stability of ± 5 MHz, and a spectral purity of >99.9% yield a maximum systematic error of 1.395% over the 822.875–822.921-nm wavelength range with a minor peak of 1.119% at 822.921 nm. Figure 9 shows that the baseline parameters have a flat error response to sideline tuning, <0.1%, whereas the threshold parameters exhibit a non-linear error response and have a change of >0.5% between the polar and tropical wavelength operating points. Combined, the estimated systematic error for all wavelengths of potential operation is below the baseline and threshold requirements provided by Nehrir et al. (2017) for nominal instrument parameters.
Spectral impurity of the laser source can be a prominent contributor to systematic errors; however, Figure 6 provides an indication that irrespective of the selected absorption line, a systematic error of <2% (considering spectral purity of >99.5% and a one-way optical depth of <1.5) will be present. DIAL retrieval sensitivity to multi-mode operation is largest when operating on the side of the absorption line near the line peak (Figure 7). For these conditions, the worst-case scenario of operating on three laser longitudinal modes (fundamental and two higher-order modes) results in a <2% error at the surface. Figure 9 and Table 1 assume the worst-case error of multi-mode operation to yield a peak error of 1.90% at 822.875 nm and a local max of 1.61% at 822.921 nm, both at the surface level. High spectral purity is evident for the Er:YAG system discussed here as stringent spectral purity and frequency stability requirements for methane IPDA at 1,645 nm are >99.9% and 10 MHz, respectively, such that the water vapor requirements will inherently be met. Additionally, by utilizing second harmonic generation to access the 823-nm spectral band for water vapor DIAL (Burns et al., 2021), any spectral impurity resulting from higher-order modes at the fundamental will inherently be reduced at the frequency-doubled output.
Doppler broadening of the backscatter spectra is of low impact for lower-tropospheric DIAL when utilizing sideline wavelengths. However, large aerosol gradients, such as those found in the Saharan air layer, could require corrections to minimize retrieval error, which can be performed using attenuated backscatter measurements provided at the “offline” wavelength (Späth et al., 2020). The post-correction residual error in specific humidity is assessed to be within 1%–2% across the entire wavelength tuning range. Errors resulting from the uncertainty in the atmospheric state inputs from reanalysis products for the calculation of the DCS was found to be <2% and <0.1% for temperature and pressure, respectively, which were within the error budget. Additional systematic contributions resulting from errors in the lidar optical system, such as misalignment between the transmitter and receiver and detection non-linearity between the onside and offline channels, were estimated at a conservative constant 2%. Dedicated engineering can readily reduce these errors to <1%.
Section 3.2 shows that random error is primarily dominated by shot noise on the backscattered photon counts and solar background noise. This error has strong dependence on the wavelength and the vertical and horizontal averaging scales. The system specifications (Table 2) (Nehrir et al., 2021) utilized here to constrain the instrument performance represent the current state-of-the-art for space-based DIAL employing low-energy and high PRF lasers and offer a feasible path to space. Simulated performance over ocean under daytime conditions, a shot noise-limited case, for different vertical and horizontal resolutions over the ocean during daytime conditions (
Considering an enhanced instrument configuration that employs an Er:YAG amplifier to increase the doubled pulse energy from 3.5 to 6 mJ at 2 kHz PRF and an increased collection aperture diameter of 1 m, a significant increase in daytime performance can be achieved. Figure 15 shows the surface-level retrievals for varying vertical and horizontal resolutions under daytime conditions over open ocean, A = 0.06, and a bright surface, A = 0.5. For
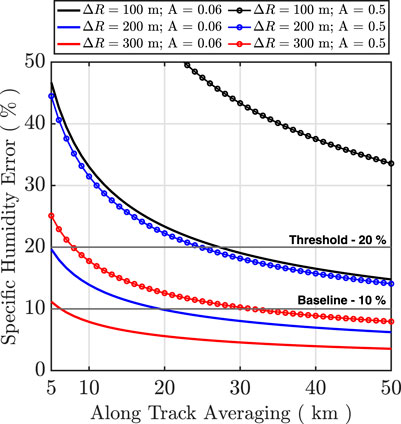
Figure 15. Specific humidity error at the surface for different vertical averaging for the TRO atmosphere with enhanced instrument performance by increasing the pulsed energy from 3.5 to 6 mJ at 2 kHz and an increasing collection aperture from 0.8 to 1 m.
The systematic and random error analysis presented here shows that a space-based DIAL with realistic performance metrics operating at the 823-nm line can meet the measurement requirements for high vertical resolution and accurate profiling of water vapor in the lower–middle troposphere. The technology currently being advanced to enable a space-based water vapor DIAL mission will meet the threshold and baseline requirements laid out by the PBL study team report (Teixeira et al., 2021) and the 2017 Decadal Survey (National Academies of Sciences, Engineering, and Medicine, 2018). In this paper, we showed that tunable operation along the side of the 823-nm absorption line allows for the optimization of the lower-tropospheric water vapor retrievals across different meteorological regimes and latitudes and provides the operational flexibility needed to dynamically optimize random errors and trade precision for the spatial resolution to accommodate different scientific applications. We show that specific humidity measurements with a <10% error can be achieved at 200 m by 50-km and <5% at 300 m by 50-km vertical and along-track resolutions under daytime conditions over open ocean. Combined, the total error budget demonstrated here indicates high impact for space-based DIAL with technologies being advanced for space missions within the next 5–10 years.
The raw data supporting the conclusion of this article will be made available by the authors, without undue reservation.
RBG: conceptualization, formal analysis, investigation, methodology, software, visualization, writing–original draft, and writing–review and editing. AN: conceptualization, investigation, methodology, and writing–review and editing.
The author(s) declare that financial support was received for the research, authorship, and/or publication of this article. This work was funded and supported by the NASA Earth Science Technology Office Instrument Incubator Program and the Decadal Survey Planetary Boundary Layer Incubation Program.
The authors declare that the research was conducted in the absence of any commercial or financial relationships that could be construed as a potential conflict of interest.
All claims expressed in this article are solely those of the authors and do not necessarily represent those of their affiliated organizations, or those of the publisher, the editors, and the reviewers. Any product that may be evaluated in this article, or claim that may be made by its manufacturer, is not guaranteed or endorsed by the publisher.
Anderson, G., Clough, S., Kneizys, F., Chetwynd, J., and Shettle, E. (1986). AFGL (Air Force Geophysical Laboratory) atmospheric constituent profiles (0–120 km). United States: Environmental research papers. AFGL-TR-86-0110, 954.
Ansmann, A. (1985). Errors in ground-based water-vapor DIAL measurements due to Doppler-broadened Rayleigh backscattering. Appl. Opt. 24, 3476–3480. doi:10.1364/ao.24.003476
Ansmann, A., and Bosenberg, J. (1987). Correction scheme for spectral broadening by Rayleigh scattering in differential absorption lidar measurements of water vapor in the troposphere. Appl. Opt. 26, 3026–3032. doi:10.1364/ao.26.003026
Ao, C. O., Waliser, D. E., Chan, S. K., Li, J. L., Tian, B., Xie, F., et al. (2012). Planetary boundary layer heights from GPS radio occultation refractivity and humidity profiles. J. Geophys. Res. Atmos. 117. doi:10.1029/2012jd017598
Aumann, H. H., Chahine, M., Gautier, C., Goldberg, M., Kalnay, E., McMillin, L., et al. (2003). AIRS/AMSU/HSB on the Aqua mission: design, science objectives, data products, and processing systems. IEEE Trans. Geoscience Remote Sens. 41 (2), 253–264. doi:10.1109/tgrs.2002.808356
Barton-Grimley, R. A., Nehrir, A. R., Kooi, S. A., Collins, J. E., Harper, D. B., Notari, A., et al. (2022). Evaluation of the high altitude lidar observatory (HALO) methane retrievals during the summer 2019 ACT-America campaign. Atmos. Meas. Tech. 15 (15), 4623–4650. doi:10.5194/amt-15-4623-2022
Bedka, K. M., Nehrir, A. R., Kavaya, M., Barton-Grimley, R., Beaubien, M., Carroll, B., et al. (2021). Airborne lidar observations of wind, water vapor, and aerosol profiles during the NASA Aeolus calibration and validation (Cal/Val) test flight campaign. Atmos. Meas. Tech. 14 (6), 4305–4334. doi:10.5194/amt-14-4305-2021
Bloom, H. J. (2001). “The cross-track infrared sounder (CrIS): a sensor for operational meteorological remote sensing. IGARSS 2001. Scanning the present and resolving the future,” in Proceedings. IEEE 2001 International Geoscience and Remote Sensing Symposium (Cat. No. 01CH37217) (IEEE), 1341–1343.
Bösenberg, J. (1985). Measurements of the pressure shift of water-vapor absorption lines by simultaneous photoacoustic spectroscopy. Appl. Opt. 24, 3531–3534. doi:10.1364/ao.24.003531
Bösenberg, J. (1998). Ground-based differential absorption lidar for water-vapor and temperature profiling: methodology. Appl. Opt. 37 (18), 3845–3860. doi:10.1364/ao.37.003845
Bousquet, P., Pierangelo, C., Bacour, C., Marshall, J., Peylin, P., Ayar, P. V., et al. (2018). Error budget of the MEthane Remote LIdar missioN and its impact on the uncertainties of the global methane budget. J. Geophys. Res. Atmos. 123 (20), 11–766. doi:10.1029/2018jd028907
Browell, E., Ismail, S., Mccormick, M., and Swissler, T. (1985). “Spaceborne lidar system for measurements of atmospheric water vapor and aerosols,” in Earth Observing Systems Conference (American Institute of Aeronautics and Astronautics). doi:10.2514/6.1985-2091
Browell, E. V., Ismail, S., and Grant, W. B. (1998). Differential absorption lidar (DIAL) measurements from air and space. Appl. Phys. B 67 (4), 399–410. doi:10.1007/s003400050523
Browell, E. V., Ismail, S., and Grossmann, B. E. (1991). Temperature sensitivity of differential absorption lidar measurements of water vapor in the 720-nm region. Appl. Opt. 30 (12), 1517–1524. doi:10.1364/ao.30.001517
Browell, E. V., Thomas, D. W., and McIlrath, T. J. (1979). Water vapor differential absorption lidar development and evaluation. Appl. Opt. 18 (20), 3474–3483. doi:10.1364/ao.18.003474
Burns, P. M., Chen, M., Orlowski, K., and Pachowicz, D. (2021). “Maturation of a single frequency ErYAG laser for water vapor/methane DIAL application,” in Laser radar technology and applications XXVI 11744, 46–54. doi:10.1117/12.2587891
Carroll, B. J., Nehrir, A. R., Kooi, S. A., Collins, J. E., Barton-Grimley, R. A., Notari, A., et al. (2022). Differential absorption lidar measurements of water vapor by the High Altitude Lidar Observatory (HALO): retrieval framework and first results. Atmos. Meas. Tech. 15 (3), 605–626. doi:10.5194/amt-15-605-2022
Chahine, M. T., Pagano, T. S., Aumann, H. H., Atlas, R., Barnet, C., Blaisdell, J., et al. (2006). AIRS: improving weather forecasting and providing new data on greenhouse gases. Bull. Am. Meteorological Soc. 87, 911–926. doi:10.1175/bams-87-7-911
Clerbaux, C., Boynard, A., Clarisse, L., George, M., Hadji-Lazaro, J., Herbin, H., et al. (2009). Monitoring of atmospheric composition using the thermal infrared IASI/MetOp sounder. Atmos. Chem. Phys. 9, 6041–6054. doi:10.5194/acp-9-6041-2009
Di Girolamo, P., Behrendt, A., Kiemle, C., Wulfmeyer, V., Bauer, H., Summa, D., et al. (2008). Simulation of satellite water vapour lidar measurements: performance assessment under real atmospheric conditions. Remote Sens. Environ. 112 (4), 1552–1568. doi:10.1016/j.rse.2007.08.008
Di Girolamo, P., Behrendt, A., and Wulfmeyer, V. (2006). Spaceborne profiling of atmospheric temperature and particle extinction with pure rotational Raman lidar and of relative humidity in combination with differential absorption lidar: performance simulations. Appl. Opt. 45 (11), 2474–2494. doi:10.1364/ao.45.002474
Di Girolamo, P., Behrendt, A., and Wulfmeyer, V. (2018). Space-borne profiling of atmospheric thermodynamic variables with Raman lidar: performance simulations. Opt. Express 26 (7), 8125–8161. doi:10.1364/oe.26.008125
Di Girolamo, P., Summa, D., Bauer, H., Wulfmeyer, V., Behrendt, A., and Ehret, G. (2004). “Simulation of the performance of wales based on an end-to model,” in 22nd Internation Laser Radar Conference (ILRC 2004). Vol. 561 (Paris: European Space Agency).
Ehret, G., Kiemle, C., Renger, W., and Simmet, G. (1993). Airborne remote sensing of tropospheric water vapor with a near–infrared differential absorption lidar system. Appl. Opt. 32, 4534–4551. doi:10.1364/ao.32.004534
Ehret, G., Kiemle, C., Wirth, M., Amediek, A., Fix, A., and Houweling, S. (2008). Space-borne remote sensing of CO2, CH4, and N2O by integrated path differential absorption lidar: a sensitivity analysis. Appl. Phys. B 90 (3), 593–608. doi:10.1007/s00340-007-2892-3
European Space Agency, 2001: WALES—WAter vapour lidar experiment in space. The Five Candidate Earth Explorer Core Missions, European Space Agency, Report for Assessment, ESA SP-1257(2), September 2001.
European Space Agency, “WALES – water vapour lidar experiment in space,” technical and programmatic annex, Reports for Mission Selection, Annex to ESA SP-212 Bibliography1279 (3), ISBN 92-9092-962-6, ESTEC, Noordwijk, The Netherlands (2004).
Fix, A., Steinebach, F., Wirth, M., Schäfler, A., and Ehret, G. (2019). Development and application of an airborne differential absorption lidar for the simultaneous measurement of ozone and water vapor profiles in the tropopause region. Appl. Opt. 58 (22), 5892–5900. doi:10.1364/ao.58.005892
Gelaro, R., McCarty, W., Suárez, M. J., Todling, R., Molod, A., Takacs, L., et al. (2017). The modern-era retrospective analysis for research and applications, version 2 (MERRA-2). J. Clim. 30, 5419–5454. doi:10.1175/jcli-d-16-0758.1
Gérard, É., Tan, D. G. H., Garand, L., Wulfmeyer, V., Ehret, G., and Di Girolamo, P. (2004). Major advances foreseen in humidity profiling from the water vapour lidar experiment in space (WALES). Bull. Am. Meteorological Soc. 85 (2), 237–252. doi:10.1175/bams-85-2-237
Gordon, I. E., Rothman, L. S., Hill, C., Kochanov, R. V., Tan, Y., Bernath, P. F., et al. (2017). The HITRAN2016 molecular spectroscopic database. J. Quant. Spectrosc. Ra. 203, 3–69. doi:10.1016/j.jqsrt.2017.06.038
Grossmann, B., and Browell, E. V. (1989). Water-vapor line broadening and shifting by air, nitrogen, oxygen, and argon in the 720-nm wavelength region. J. Mol. Spectrosc. 138, 562–595. doi:10.1016/0022-2852(89)90019-2
Hernandez, G. (1988). Fabry-Perot interferometers, 1. paperback ed. (with corr.). Cambridge: Cambridge Univ. Press.
Ismail, S., and Browell, E. V. (1989). Airborne and spaceborne lidar measurements of water vapor profiles: a sensitivity analysis. Appl. Opt. 28 (17), 3603–3615. doi:10.1364/ao.28.003603
Kahn, B. H., Fetzer, E. J., Teixeira, J., and Yue, Q. (2023). Two decades of temperature and specific humidity variance scaling with the Atmospheric Infrared Sounder. J. Geophys. Res. Atmos. 128, e2023JD039244. doi:10.1029/2023JD039244
Kiemle, C., Kawa, S. R., Quatrevalet, M., and Browell, E. V. (2014). Performance simulations for a spaceborne methane lidar mission. J. Geophys. Res. Atmos. 119 (7), 4365–4379. doi:10.1002/2013jd021253
Kim, E., Lyu, C. J., Anderson, K., Vincent Leslie, R., and Blackwell, W. J. (2014). S-NPP ATMS instrument prelaunch and on-orbit performance evaluation. J. Geophys. Res. Atmos. 119 (9), 5653–5670. doi:10.1002/2013jd020483
Kopp, G., George, L., and Gary, R. (2005). The total irradiance monitor (TIM): science results. Sol. Radiat. Clim. Exp. (SORCE) Mission Descr. Early Results 230, 129–139. doi:10.1007/s11207-005-7433-9
Liu, Bo, Wang, Z., Cai, Y., Wechsler, P., Kuestner, W., Burkhart, M., et al. (2014). Compact airborne Raman lidar for profiling aerosol, water vapor and clouds. Opt. Express 22, 20613–20621. doi:10.1364/oe.22.020613
Machol, J. L., Ayers, T., Schwenz, K. T., Koenig, K. W., Hardesty, R. M., Senff, C. J., et al. (2004). Preliminary measurements with an automated compact differential absorption lidar for the profiling of water vapor. Appl. Opt. 43 (15), 3110–3121. doi:10.1364/ao.43.003110
Maddy, E. S., and Barnet, C. D. (2008). Vertical resolution estimates in version 5 of AIRS operational retrievals. IEEE Trans. Geoscience Remote Sens. 46 (8), 2375–2384. doi:10.1109/TGRS.2008.917498
McKay, J. A. (1998). Modeling of direct detection Doppler wind lidar. I. The edge technique. Appl. Opt. 37 (27), 6480–6486. doi:10.1364/ao.37.006480
McKay, J. A. (1999). Single and tandem Fabry–Perot etalons as solar background filters for lidar. Appl. Opt. 38 (27), 5851. doi:10.1364/AO.38.005851
Measures, R. M. (1984). Laser remote sensing: fundamentals and applications. New York: Wiley-Interscience, 521.
Millán, L. F., Lebsock, M. D., Cooper, K. B., Siles, J. V., Dengler, R., Rodriguez Monje, R., et al. (2024). Water vapor measurements inside clouds and storms using a differential absorption radar. Atmos. Meas. Tech. 17 (2), 539–559. doi:10.5194/amt-17-539-2024
Nagasawa, C., Abo, M., Sugisaki, T., and Uchino, O. (1995). “Simulation for atmospheric water vapor measurements from spaceborne DIAL,” in Lidar techniques for Remote sensing II. Vol, 2581 (SPIE). doi:10.1117/12.228517
National Academies of Sciences, Engineering, and Medicine (2018). Thriving on our changing planet: a decadal strategy for Earth observation from space. Washington, DC: The National Academies Press. doi:10.17226/24938
Nehrir, A. R., Hair, J. W., Ferrare, R. A., Hostetler, C. A., Kooi, S. A., Notari, A., et al. (2018). The High Altitude Lidar Observatory (HALO): a multi-function lidar and technology testbed for airborne and space-based measurements of water vapor and methane. NASA Earth Science Technology Forum. Available at: https://esto.nasa.gov/forums/estf2018/presentations/Nehrir_ESTF2018_A1P2.pdf (Accessed february 15, 2024).
Nehrir, A. R., Kiemle, C., Lebsock, M. D., Kirchengast, G., Buehler, S. A., Löhnert, U., et al. (2017). Emerging technologies and synergies for airborne and space-based measurements of water vapor profiles. Surv. Geophys. 38, 1445–1482. doi:10.1007/s10712-017-9448-9
Nehrir, A. R., Posselt, D. J., and Kurowski, M. (2021). Atmospheric boundary layer lidar PathfindEr (ABLE): crosscutting DIAL for humidity profiling. NASA Earth Science Technology Forum. Available at: https://esto.nasa.gov/forums/estf2021/Presentations/ May27/Nehrir_ABLE_ESTF2021_May27.pdf (Accessed february 15, 2024).
Nehrir, A. R., Repasky, K. S., and Carlsten, J. L. (2011). Eye-safe diode-laser-based micropulse differential absorption lidar (DIAL) for water vapor profiling in the lower troposphere. J. Atmos. Ocean. Technol. 28 (2), 131–147. doi:10.1175/2010jtecha1452.1
Nehrir, A. R., Repasky, K. S., Carlsten, J. L., Obland, M. D., and Shaw, J. A. (2009). Water vapor profiling using a widely tunable, amplified diode-laser-based differential absorption lidar (DIAL). J. Atmos. Ocean. Technol. 26 (4), 733–745. doi:10.1175/2008jtecha1201.1
Schotland, R. M. (1965). “The determination of the vertical profile of atmospheric gases by means of a ground based optical radar,” in Proceeding of the Third Symposium on Remote Sensing of Environment (U. Michigan, Ann Arbor: ESA).
Sherwood, S. C., Roca, R., Weckwerth, T. M., and Andronova, N. G. (2019). Tropospheric water vapor, convection and climate. Rev. Geophys. 48 (RG2001). doi:10.1029/2009rg000301
Späth, F., Behrendt, A., Muppa, S. K., Metzendorf, S., Riede, A., and Wulfmeyer, V. (2014). High-resolution atmospheric water vapor measurements with a scanning differential absorption lidar. Atmos. Chem. Phys. Discuss. 14 (21), 29057–29099. doi:10.5194/acpd-14-29057-2014
Späth, F., Behrendt, A., Muppa, S. K., Metzendorf, S., Riede, A., and Wulfmeyer, V. (2016). 3-D water vapor field in the atmospheric boundary layer observed with scanning differential absorption lidar. Atmos. Meas. Tech. 9 (4), 1701–1720. doi:10.5194/amt-9-1701-2016
Späth, F., Behrendt, A., and Wulfmeyer, V. (2020). Minimization of the Rayleigh-Doppler error of differential absorption lidar by frequency tuning: a simulation study. Opt. Express 28 (20), 30324–30339. doi:10.1364/oe.396568
Spuler, S. M., Hayman, M., Stillwell, R. A., Carnes, J., Bernatsky, T., and Repasky, K. S. (2021). MicroPulse DIAL (MPD)–a diode-laser-based lidar architecture for quantitative atmospheric profiling. Atmos. Meas. Tech. 14 (6), 4593–4616. doi:10.5194/amt-14-4593-2021
Spuler, S. M., Repasky, K. S., Morley, B., Moen, D., Hayman, M., and Nehrir, A. R. (2015). Field-deployable diode-laser-based differential absorption lidar (DIAL) for profiling water vapor. Atmos. Meas. Tech. 8 (3), 1073–1087. doi:10.5194/amt-8-1073-2015
Stephen, M., Fahey, M., and Miller., I. (2017). Solid, 3-mirror fabry–perot etalon. Appl. Opt. 56 (10), 2636–2640. doi:10.1364/ao.56.002636
Tackett, J. L., Winker, D. M., Getzewich, B. J., Vaughan, M. A., Young, S. A., and Kar, J. (2018). CALIPSO lidar level 3 aerosol profile product: version 3 algorithm design. Atmos. Meas. Tech. 11 (7), 4129–4152. doi:10.5194/amt-11-4129-2018
Teixeira, J., Piepmeier, J. R., Nehrir, A. R., Ao, C. O., Chen, S. S., Clayson, C. A., et al. (2021). Toward a global planetary boundary layer observing system: the NASA PBL incubation study team report. NASA PBL Incubation Study Team, 134.
Varotsos, C. A., Melnikova, I. N., Cracknell, A. P., Tzanis, C., and Vasilyev, A. V. (2014). New spectral functions of the near-ground albedo derived from aircraft diffraction spectrometer observations. Atmos. Chem. Phys. 14 (13), 6953–6965. doi:10.5194/acp-14-6953-2014
Wang, K.-N., Ao, C. O., Morris, M. G., Hajj, G. A., Kurowski, M. J., Turk, F. J., et al. (2024). Joint 1DVar retrievals of tropospheric temperature and water vapor from Global Navigation Satellite System radio occultation (GNSS-RO) and microwave radiometer observations. Atmos. Meas. Tech. 17, 583–599. doi:10.5194/amt-17-583-2024
Whiteman, D. N., Di Girolamo, P., Behrendt, A., Wulfmeyer, V., and Franco, N. (2022). Statistical analysis of simulated spaceborne thermodynamics lidar measurements in the planetary boundary layer. Remote Sens. 3, 810032. doi:10.3389/frsen.2022.810032
Whiteman, D. N., Melfi, S. H., and Ferrare, R. A. (1992). Raman lidar system for the measurement of water vapor and aerosols in the Earth's atmosphere. Appl. Opt. 31, 3068–3082. doi:10.1364/ao.31.003068
Whiteman, D. N., Rush, K., Rabenhorst, S., Welch, W., Cadirola, M., McIntire, G., et al. (2010). Airborne and ground-based measurements using a high-performance Raman lidar. J. Atmos. Ocean. Technol. 27 (11), 1781–1801. doi:10.1175/2010jtecha1391.1
Wirth, M., Fix, A., Mahnke, P., Schwarzer, H., Schrandt, F., and Ehret, G. (2009). The airborne multi-wavelength water vapor differential absorption lidar WALES: system design and performance. Appl. Phys. B 96 (1), 201–213. doi:10.1007/s00340-009-3365-7
Wulfmeyer, V., Bauer, H., Di Girolamo, P., and Serio, C. (2005). Comparison of active and passive water vapor remote sensing from space: an analysis based on the simulated performance of IASI and space borne differential absorption lidar. Remote Sens. Environ. 95 (2), 211–230. doi:10.1016/j.rse.2004.12.019
Wulfmeyer, V., and Bösenberg, J. (1998). Ground-based differential absorption lidar for water-vapor profiling: assessment of accuracy, resolution, and meteorological applications. Appl. Opt. 37 (18), 3825–3844. doi:10.1364/ao.37.003825
Wulfmeyer, V., and Craig, W. (2001). Future performance of ground-based and airborne water-vapor differential absorption lidar. I. Overview and theory. Appl. Opt. 40 (30), 5304–5320. doi:10.1364/ao.40.005304
Wulfmeyer, V., Hardesty, R. M., Turner, D. D., Behrendt, A., Cadeddu, M. P., Di Girolamo, P., et al. (2015). A review of the remote sensing of lower tropospheric thermodynamic profiles and its indispensable role for the understanding and the simulation of water and energy cycles. Rev. Geophys. 53 (3), 819–895. doi:10.1002/2014rg000476
Keywords: lidar, differential absorption lidar, planetary boundary layer, boundary layer, water vapor, DIAL
Citation: Barton-Grimley RA and Nehrir AR (2024) Sensitivity analysis of space-based water vapor differential absorption lidar at 823 nm. Front. Remote Sens. 5:1404877. doi: 10.3389/frsen.2024.1404877
Received: 21 March 2024; Accepted: 24 May 2024;
Published: 08 July 2024.
Edited by:
Daniel Perez Ramirez, University of Granada, SpainReviewed by:
Dave Turner, Global Systems Laboratory, United StatesCopyright © 2024 Barton-Grimley and Nehrir. This is an open-access article distributed under the terms of the Creative Commons Attribution License (CC BY). The use, distribution or reproduction in other forums is permitted, provided the original author(s) and the copyright owner(s) are credited and that the original publication in this journal is cited, in accordance with accepted academic practice. No use, distribution or reproduction is permitted which does not comply with these terms.
*Correspondence: Rory A. Barton-Grimley, rory.a.barton-grimley@nasa.gov
Disclaimer: All claims expressed in this article are solely those of the authors and do not necessarily represent those of their affiliated organizations, or those of the publisher, the editors and the reviewers. Any product that may be evaluated in this article or claim that may be made by its manufacturer is not guaranteed or endorsed by the publisher.
Research integrity at Frontiers
Learn more about the work of our research integrity team to safeguard the quality of each article we publish.