 Jingzhou Xin
94% of researchers rate our articles as excellent or good
Learn more about the work of our research integrity team to safeguard the quality of each article we publish.
Find out more
ORIGINAL RESEARCH article
Front. Mater. , 04 February 2022
Sec. Structural Materials
Volume 9 - 2022 | https://doi.org/10.3389/fmats.2022.847193
This article is part of the Research Topic Advanced Concretes and Their Structural Applications View all 23 articles
To study the bearing capacity of a corroded reinforced concrete (RC) arch and analyze the deterioration mechanism of an in-service RC arch bridge, a deterioration simulation under the coupling effect of the environment and load was performed by employing non-immersion energization, and considering the dead load on the arch, single point loading tests of the arch models were carried out; the crack development, structural deformation, and ultimate bearing capacity of a corroded RC arch under service stress were studied; the failure mode of the corroded arch was explored; and a bearing capacity prediction model considering dual deterioration effects of reinforcement corrosion deterioration and arch axis deterioration was established. Results indicated that the spacing of cracks caused by a load on the non-corroded arch was more uniform, and the number and distribution range of load-induced cracks in the corroded arch was smaller, while the maximum crack width was larger. Corrosion significantly reduced the strength of the arch rib; for the deteriorated arch with a corrosion rate of 7.62%, the cracking load and the bearing capacity decreased by 28.57 and 9.84%, respectively. Corrosion weakened structural stiffness, while it does not convert the failure mode of the arch. Only considering section resistance degradation may underestimate the damaging effects of corrosion on the arch structure.
Reinforced concrete (RC) arch bridges are widely used in China, especially in mountainous areas, because of their high structural stiffness, beautiful appearance, and economy advantage (Deng et al., 2019; Li et al., 2021). However, the performance degradation of RC structures has become acute as time goes on due to the coupling effect of the external service environment and internal materials degradation (Fu et al., 2017; Castorena-González et al., 2020; Fang, 2020). Accurate assessment of the carrying capacity of RC arch bridges in service is of great scientific significance and has a high engineering application value in order to carry out scientific management, as well as reduce the maintenance costs.
According to engineering experience, arch bridges are generally considered to have better durability than girder bridges (Shao et al., 2021). The reason is that on the one hand, service areas of an RC arch bridge are mainly located in the southwest region of China, accounting for about 60% of the total, and the atmospheric environment in the southwest region of China is less corrosive to the service structures than the chloride environment in the coastal area. On the other hand, all sections of the main arch ring are subjected to compressive stress, and compared with the beam structures, the cracks are less, which reduce the migration rate of chloride and other erosion factors, and the durability of the structure is less prominent than that of the beam structures (Fu et al., 2020; Qiu et al., 2021). Therefore, the research on the performance of corroded concrete members mainly focuses on flexural members (Liu et al., 2016; Dong et al., 2017; Dai et al., 2019), while the research on RC arch bridges mainly focuses on intact structures; for example, Huang and Chen (2009) conducted an experiment on a RC box arch under two loads asymmetrically in-plane and analyzed the non-linear behavior and its influence on the ultimate load-carrying capacity. Du and Chen (2013) performed model tests on two reactive powder concrete arches subjected to concentrated loads. The load–displacement curves, cracks, strains, failure modes, and ultimate load capacities of the arches were analyzed and compared with the results of conventional RC model arches. Zhang et al. (2017) carried out a 1:7.5 scale model test on the world’s largest span stiff skeleton concrete arch bridge to investigate the structural behavior during the construction process.
However, it is an inevitable developmental law of any physical system that the structural performance will be degraded with an extension in service years. The existing literature shows that with the increase in service life, the bearing capacity degradation of arch structures caused by materials degradation is non-negligible (Zhang et al., 2007). Several studies have been carried out around the performance degradation of RC arch bridges; for instance, Petryna et al. (2002) proposed the time-variant reliability assessment method of deteriorating RC structures under fatigue conditions, and reliability estimates were obtained within the response surface method using the important/adaptive sampling techniques and the time-integrated approach. Based on the field measurement results and numerical simulation, Zanardo et al. (2004) studied the static and seismic performance of the existing short span RC arch bridges, before and after strengthening interventions. Zhang et al. (2007) evaluated the residual bearing capacity of two arch ribs removed from a 28-year-old bridge based on full-scale tests. Tang et al. (2005) presented a tensorial damage theory and an isotropic application to the arch ribs of a real bridge. The damage theory-additional load-finite element method was developed to numerically simulate the failure process of RC structures. Based on the similarity theory of model design, Fan et al. (2007) examined the effects of the damage extent and location on the static and dynamic responses of the scaled damaged arch bridge model fabricated by organic glasses; the prototype of the scale was a 43-year-old RC arch bridge. Ma et al. (2016) investigated the effect of corrosion-induced cracking damage on the static behavior of RC arch ribs based on an experimental method; the reduction rate in the ultimate bearing capacity of arch ribs caused by rust expansion could reach 60% by their results. Overall, there are relatively few experimental studies on RC arch bridges. In these few experimental studies, researchers poured more attention on the damage evolution mechanism of the intact arch structure during loading, and the failure process and behavior evolution of the statically indeterminate system are the main concerns. Research works on the adverse effects of various deterioration factors on the bearing capacity of an RC arch brought by a long-term service are relatively scarce.
The present study is an extension of the research on the performance degradation mechanism of RC arch bridges but with the following substantial differences. First, the coupling effects of load and corrosion on the arch were considered in this experiment. Second, a bearing capacity prediction model of the RC arch considering the two-dimensional deterioration effect of transverse and longitudinal directions was proposed. Note that corrosion of practical bridges often occurs under the stress state. Consequently, the present study has superior practical significance.
The rest of this article is organized as follows. In the Experimental Program section, experiments on arch models are elaborated, including the specimen design, the accelerated corrosion test program, the instrumentation, and the loading manner. In the Result and Discussion section, critical results are presented and then discussed. In the Prediction Model of Bearing Capacity for Corroded RC Arch section, a new prediction method of bearing capacity is put forward. On the basis of considering the influence of unfavorable factors caused by corrosion on the resistance, the increasing effect of the load caused by the deflection of the arch axis is also considered. Finally, the main conclusions are summarized in the Conclusion section.
The model design referred to a real bridge; the clear span of the catenary model arch was 4,200 mm, the rise was 840 mm, and the arch axis coefficient was 1.67. According to Li (2012), for arch bridges with rectangular sections, the section height is about 0.0167–0.025 times of the span and the section width is about 0.5–2.0 times of the section height. In addition, the width to span ratio should not be less than 1/20, considering the lateral stability. Considering the aforementioned factors comprehensively, the section size was determined as 120 mm × 240 mm.
Other details of specimens are as follows: all RC ribs were symmetrically reinforced with six longitudinal bars of 12 mm diameter and 6 mm stirrups with 100 mm spacing; the average yield strength of the virgin longitudinal bar and the stirrup was 400 and 335 MPa, respectively. The elastic modulus of steel bars was 210 GPa, and the thickness of the concrete cover at both tension and compression sides was 24 mm.
In order to make the stress condition of the model close to the real arch bridge, the influence of the load on the arch should be considered. Taking RC arch bridges with a main span of 70 and 210 m as references, this study calculated the internal force distribution and stress state of the main arch ring of real bridges under the dead load. As shown in Figure 1, the longitudinal stress distribution on the main arch ring of the real bridge was relatively uniform, and all sections were in compression. The maximum compressive stress on the arch bridge with the span of 210 m was 10.1 MPa, which was 28.5% of the axial compressive strength of the bridge concrete with Chinese specifications for grade C55. The maximum stress of the 70 m span arch bridge was 4.5 MPa, which was 16.8 % of the axial compressive strength of the bridge concrete with Chinese specifications for grade C40.
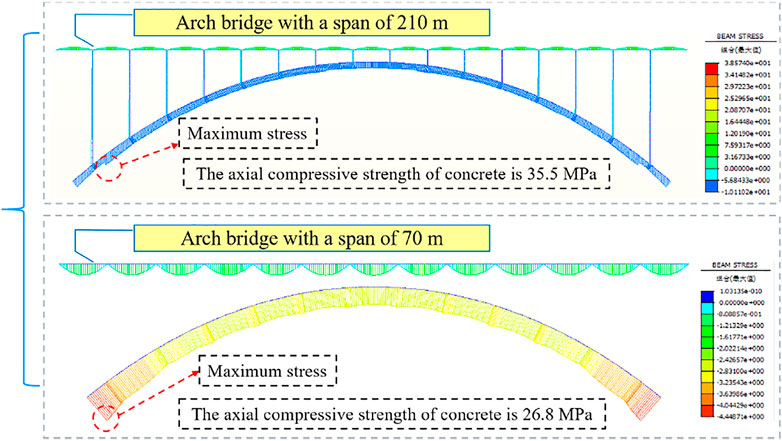
FIGURE 1. Stress state of the real bridges under the dead load (MPa).
In order to simulate the stress distribution and level of the real bridge, the test utilized a counterweight to simulate the load on the arch. The counterweight location and load are shown in Figure 2. Note that the stability of the counterweight load and the limitation of the test site were considered in this design. In this study, the scheme of lever loading was excluded as the later stage of it had unsatisfactory stability, the load was easy to deviate from the arch axis, and the requirements for the space were higher. The stress state of the model arch under a counterweight load is shown in Figure 3 and Table 1.
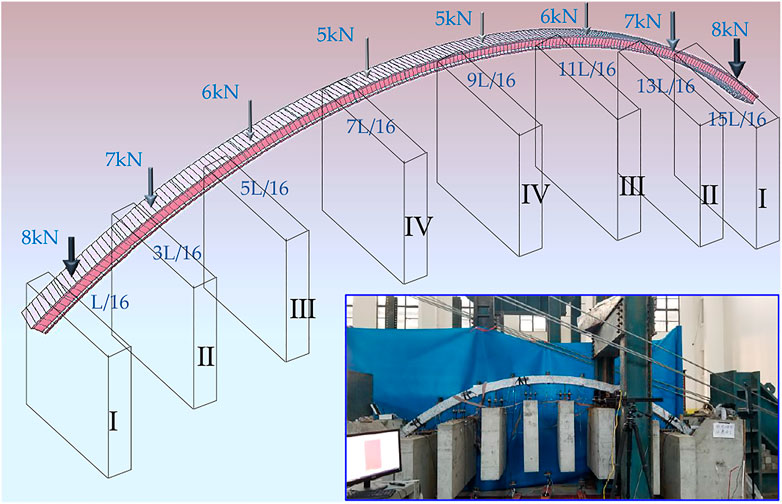
FIGURE 2. Stress state simulation of the arch model under the dead load.
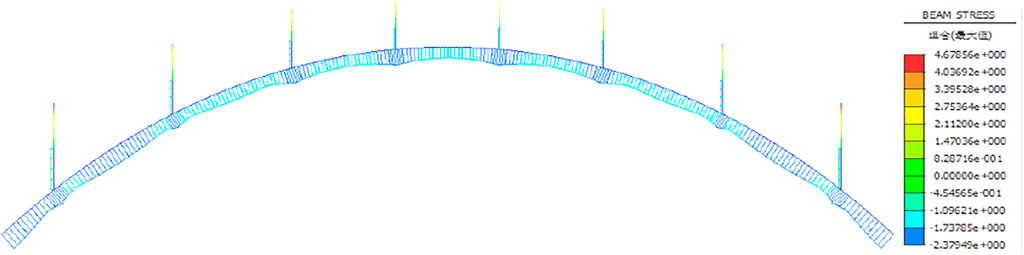
FIGURE 3. Stress nephogram of the arch model.
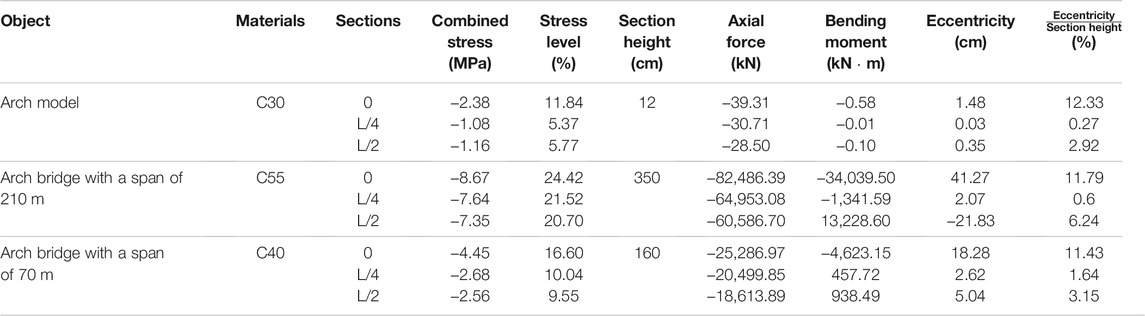
TABLE 1. Comparison of the stress state between real bridges and the arch model.
It can be seen from Figure 3 and Table 1 that the counterweight load conformed to the mechanical characteristics of a catenary arch bridge, that is, the load decreases gradually from the spring to the vault, the stress distribution in the longitudinal direction was relatively uniform, the maximum compressive stress was observed at the spring, about 2.38 MPa, which was 11.84% of the concrete axial compressive strength, and the ratio of eccentricity to the height of the arch ring was similar to that of real bridges. Therefore, the simulation effect of the model arches on the stress state of an existing RC arch bridge was satisfactory.
Two specimens were crafted, specimen 0# was the non-corrosion arch rib, and specimen 1# was the corroded one. When the arch rib was fabricated, the screw was embedded at the corresponding position of the counterweight, and the embedded bar and transverse and longitudinal reinforcement were welded to form the portal frame to enhance the bearing capacity of the screw. The axial compressive strength of specimen 0# and specimen 1# were 33.08 and 30.21 MPa, respectively.
Previous studies show that corrosion products, corrosion characteristics, and concrete expansion forms under the conditions of electrified corrosion, and natural corrosion were distinctive because of the difference in the electrochemical process (Zhang et al., 2009; Kashani et al., 2013; Fu et al., 2018; Zhou et al., 2020). The performance degradation caused by corrosion of reinforcement in a concrete structure could be divided into two parts at the material level: the first is the loss of the reinforcement section and the degradation of mechanical properties, and the second is expansion cracking of concrete cover and bond degradation. The former is mainly related to geometric characteristics of steel bars after corrosion, while the latter is mainly affected by the composition of corrosion products; the volumetric expansion rates of different corrosion products are different. Therefore, even under the same corrosion degree, the deterioration degrees in a concrete structure caused by different corrosion modes are diverse.
In order to reduce the inaccuracy of the assessment of the adverse effects of corrosion damage caused by the difference between the accelerated corrosion and natural corrosion, the accelerated corrosion program, which is different from the scheme of Ma et al. (2016), was adopted in this study (Figures 4, 5). The arch rib was divided into nine corroded regions according to the position of the counterweight. Each region was connected to the cathode and anode of the power supply separately. For the sake of safety, the surface of counterweight screw shall be treated with antirust coating, and the distance between the edge of each corrosion section and screw should be 5 cm. The stainless steel mesh and sponge were wrapped on the surface of the model arch from inside to outside. The anode of the constant direct current power supply was connected with the internal longitudinal reinforcement of the concrete, and the cathode was connected with the stainless steel mesh. Before electrolytic corrosion, the specimen was immersed in 5% sodium chloride solution for several days to facilitate the corrosion process by allowing chloride ions to permeate into concrete cover. To prevent the loss of water in the process of corrosion, the outer side of the sponge was sealed with a plastic cloth. At the same time, an infusion pipe was used to drip 5% sodium chloride solution into the sponge at a constant speed to keep the chloride concentration constant. The corrosion current is 1.5 A, the current density is 1.5 mA/cm2, and the power on time is 10.948 d.
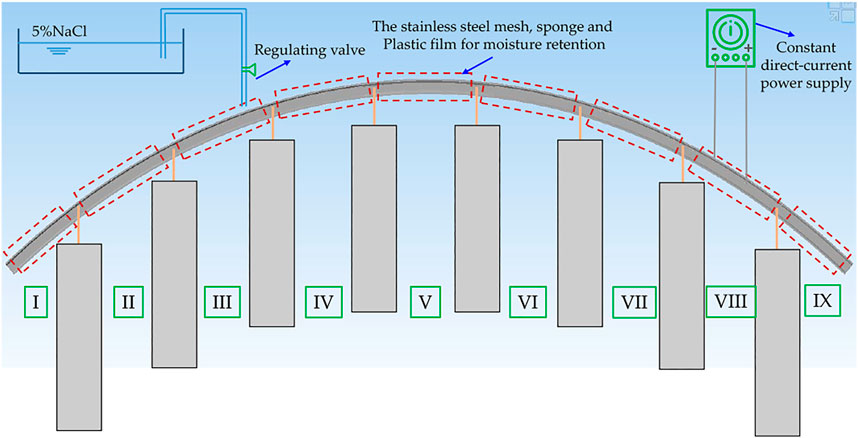
FIGURE 4. Corrosion diagram of the arch model.
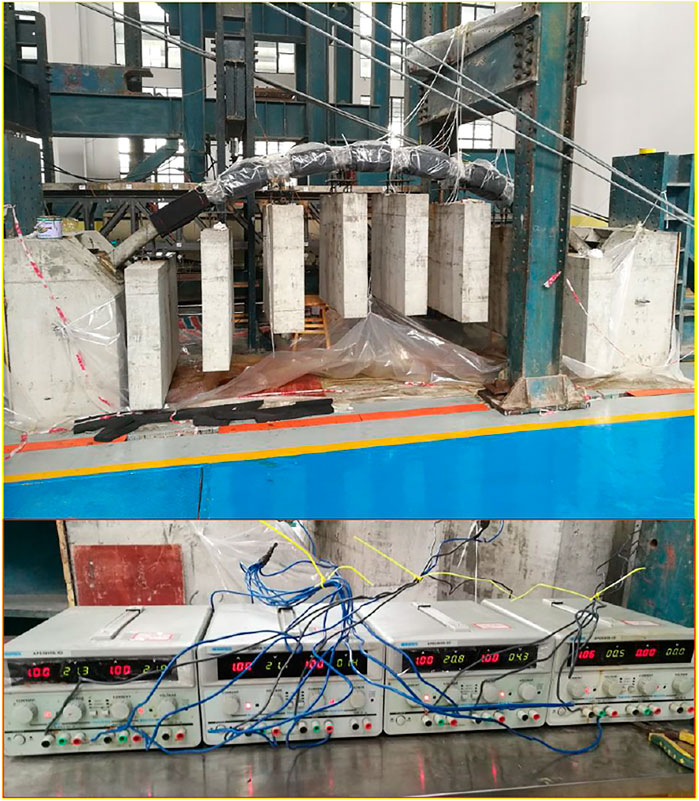
FIGURE 5. Actual corrosion process of the arch model.
Compared with the previous corrosion scheme, the advantages of this scheme could be summarized as follows: first, the corrosion process was carried out under conditions similar to the stress state of real bridges; second, the corrosion products were easy to be brought out by the solution during immersion accelerated corrosion, which reduced the damage of the corrosion products to the structure, and the non-immersion method adopted in this study evaded this issue; finally, it does not require a large electrolytic cell, and consequently, the corrosion of large components is easier to achieve.
In the loading test, the arch ribs were subjected to a single point load applied at the quarter point, and the wedge concrete block was set at the loading position so that the loading surface was plane; the calibrated pressure sensor was used to control the load.
Several details critical to the success in the experiment are explained as follows. A 3-cm-thick steel plate was placed on the wedge block to prevent local damage of concrete caused by stress concentration. Two reaction frames were symmetrically fixed by the laboratory ground anchor to ensure that there is no displacement in the longitudinal direction of the arch abutments. A U-shaped steel sleeve was reserved on the arch base, and cast in situ epoxy concrete was used to ensure the consolidation of the springs after the arch rib was hoisted on the arch abutments.
Seven dial indicators were applied along the longitudinal direction of the arch rib to measure the vertical deflection: L/8, L/4, 3L/8, L/2, 5L/8, 3L/4, and 7L/8. The layout of measuring points and loading point is shown in Figure 6. A preloading test was conducted to check all the instruments and measurement devices. The load monotonically increased at a rate of 2 kN/min, with a 5-min holding time for technicians to mark all cracks on the surfaces. The load-induced transverse cracks and corrosion-induced longitudinal cracks mapping were monitored by using a crack width observation instrument with an accuracy of 0.01 mm.
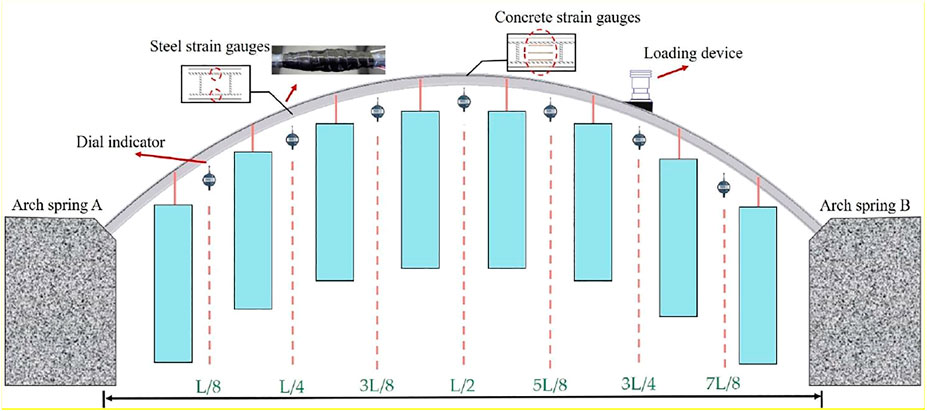
FIGURE 6. Arrangement of measuring points and the loading device.
In this study, the quality loss rate
where
Figure 7 shows the corrosion rate of the reinforcement in different corrosion regions. From Figure 7, it can be concluded that the corrosion scheme adopted in this study was satisfactory. The average corrosion rate of each corrosion section had little difference, and the average corrosion rate of the whole arch was 6.85%. More detailed comparative findings are explained as follows. The corrosion rate of the steel on the extrados was generally higher than that on the soffit. This phenomenon shows that there is a strong correlation between the corrosion rate of reinforcement and the concentration of chloride ion solution. In the corrosion method adopted in this study, sodium chloride solution diffused into concrete from top to bottom. Compared with the lower concrete, the infiltration effect of chloride and moisture in the upper concrete was more sufficient, and the corrosion current appeared earlier; thus, the upper reinforcement was corroded first. After that, the corrosion rate of the upper and lower sides of the concrete tended to be the same as the concrete in the corrosion section was fully saturated, so difference of the corrosion rate between the upper and lower sides of the same region was not distinctive.
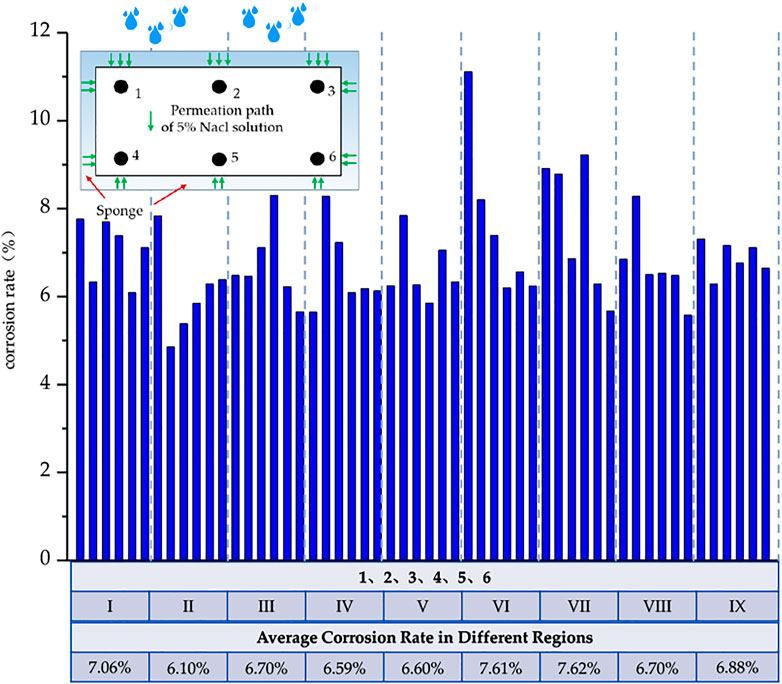
FIGURE 7. Corrosion rate of reinforcement in each corrosion section.
Figure 8 shows the distribution of corrosion-induced cracks in arch 1#. As plotted in Figure 8, there were many longitudinal corrosion-induced cracks, especially on the extrados. The cracks of corner steel bars (1#, 3#, 4#, and 6#) were more than those of middle steel bars (2# and 5#), which mainly resulted from the presence of more solution penetration paths in corner reinforcement than that in middle reinforcement. There were a certain number of vertical cracks caused by stirrup corrosion; the maximum crack width is 0.18 mm, appearing in region VI.
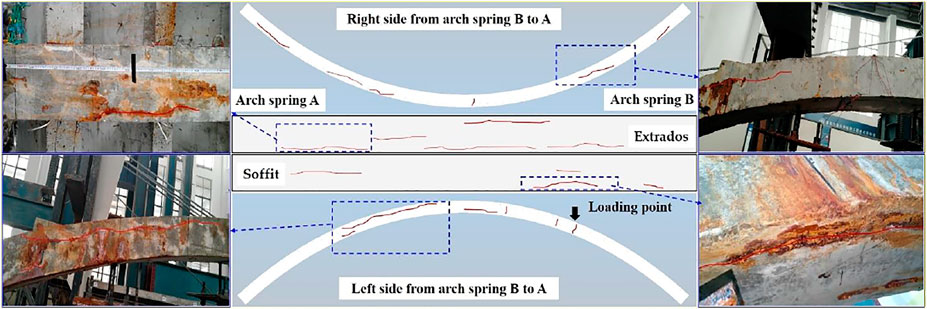
FIGURE 8. Distribution of corrosion-induced cracks.
Figure 9 shows the vertical displacement curves of the arch ribs in different loading stages, and the spline curve was employed to fit the deflection measurement point data under graded loading. As shown in Figure 9, the deflection evolution trend of the two arch ribs was basically the same. During the loading process, the deflection of the arch ribs under quarter point loading was approximately antisymmetric. The deformation at section L/4 was less than that at section 3L/4 (loading point), and the former was about 58.1∼71.3% of the latter. The antisymmetric center was close to the vault, near the L/4 side, and the deformation at the vault position was small, with the deflection of arch 0# and 1# being 0.6 and 0.8 mm, respectively. The corrosion-induced cracks reduced the stiffness of arch rib, and the deflection of corroded arch was larger than the non-corrosion one bearing the same load. The maximum deformations of arch 0# and arch 1# were 15.0 and 21.0 mm, respectively, and both of them appeared at the loading point position.
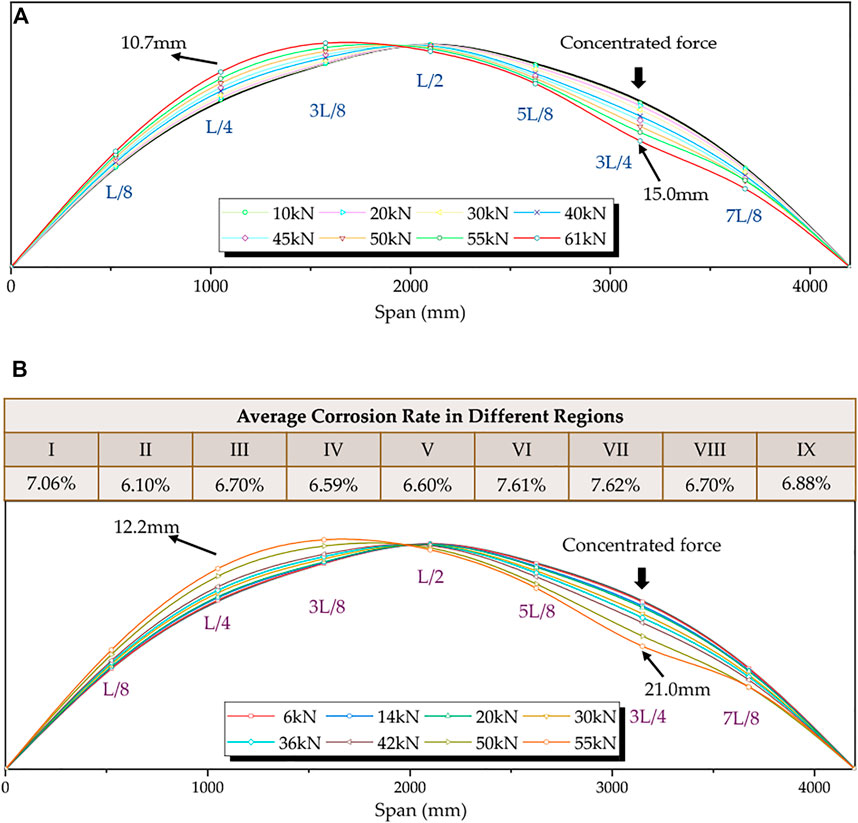
FIGURE 9. Load-deflection curve of arch ribs: (A) arch 0# and (B) arch 1#.
Figures 10A,B show the load–deflection curves for sections 3L/4 and L/4, respectively. It can be seen from Figure 10 that the mechanical process of corroded arch was similar to that of non-corrosion one, with obvious non-linear evolution characteristics, and it could be roughly divided into three stages: elastic stage, crack development stage, and steel bar yield stage. The end point of the elastic stage corresponded to the cracking load, that is, once the transverse crack caused by loading appears, the structure immediately enters the crack development stage, in which the slope of the load vertical deformation curve increases and the development rate of the vertical deformation of the structure increases. The three stages of the two sections were divided synchronously. The three stages of the non-corrosion arch were clearly divided, while the crack development stage and the yield stage of the corroded arch were not easy to separate. In the elastic stage, the slope of load–deformation curve of the corroded arch was similar to that of the non-corrosion one, but the elastic stage of the corroded arch was shorter, which was mainly due to the longitudinal cracking of concrete cover caused by the expansive stress, which weakened the strength contribution of concrete and reduced the cracking load.
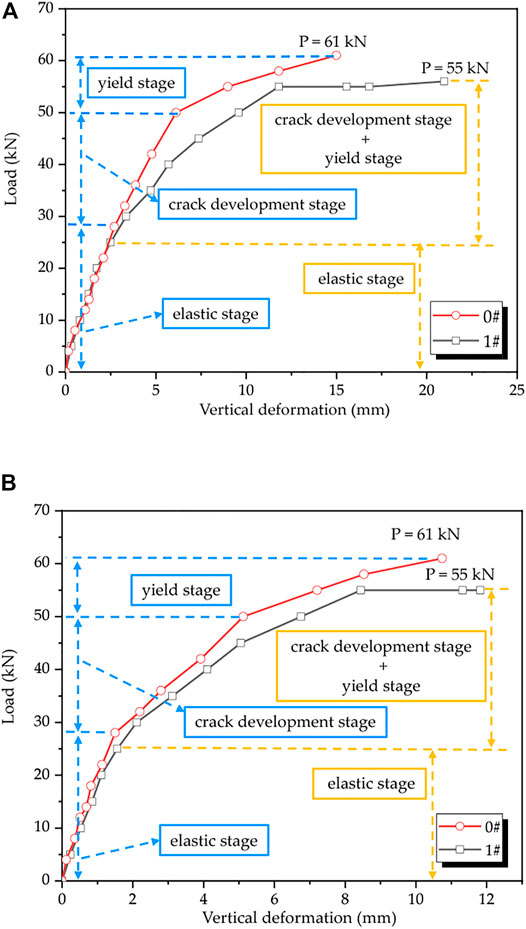
FIGURE 10. Load-deflection curve of typical sections: (A) section 3L/4 and (B) section L/4.
The crack distribution caused by the load on arch 0# and arch 1# is shown in Figures 11A,B, respectively. For the non-corrosion arch rib, when the load reached 28 kN, the first transverse crack of the structure appeared in the soffit at the loading point. With the increase in load, the extrados of the arch spring near the loading point and section L/4 cracked one after another; and the crack height, width, and distribution range increased with the increase in load. The cracks were concentrated in three areas, that is, the arch spring near the loading point, sections L/4 and 3L/4, and the crack width in the soffit of section 3L/4; the extrados of the arch spring near the loading point was obviously larger than that in section L/4. When the single hinge was formed, the maximum crack width of arch 0# was 2.80 mm, which was located at the extrados of the loading point; the maximum length of the crack distribution area was 47 cm, which was between the L/4 and L/2 spans. The law of crack propagation of the corroded arch was similar to that of the non-corrosion arch in the loading process. The cracking load of the corroded arch was reduced to 20 kN. In addition, the crack spacing of the intact arch was relatively uniform. In contrast, the number and distribution range of cracks in corroded arch were smaller, while the maximum crack width increased.
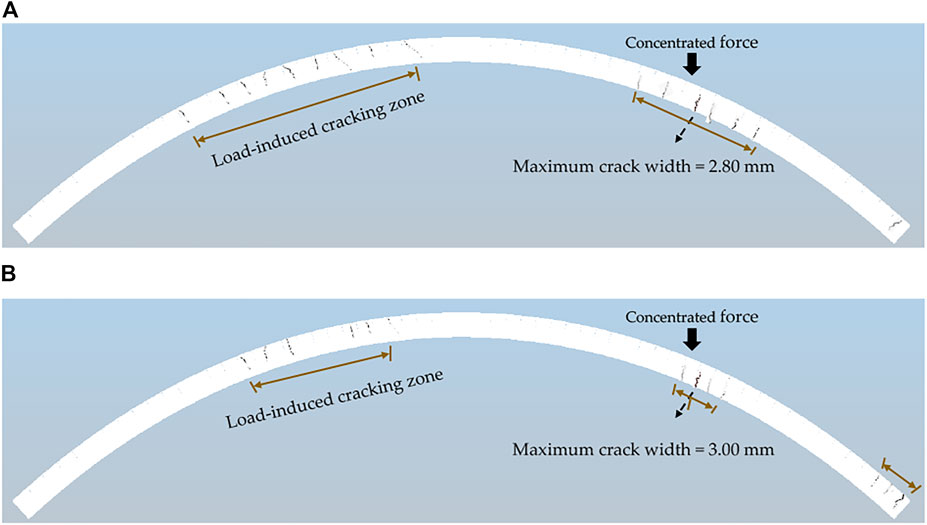
FIGURE 11. Distribution of transverse cracks caused by loading: (A) arch 0# and (B) arch 1#.
Figures 12A,B show the failure modes of the non-corrosion arch and the corroded arch, respectively. It can be seen from Figure 12 that the failure of the two arch ribs occurred at the loading point, and both of them showed obvious compression-bending failure. Before the loading process, all the sections of the arch rib were compressed under the dead load of the counterweight. With the application of the concentrated force at the section 3L/4, the tension trend of soffit at section 3L/4 was developed, while the compressive stress of extrados was further increased. As the load increased further, the concrete in the soffit cracked. The development of cracks made the tensile stress of steel bars in the tension area to increase rapidly and reach the yield strength. Then the neutral axis moved to the upper edge of the section; when the concrete cracked to 0.7 times of the sectional height, the steel bars in the compression zone yielded, the concrete in the extrados reached the ultimate compressive strain and was crushed, and the structure was destroyed.
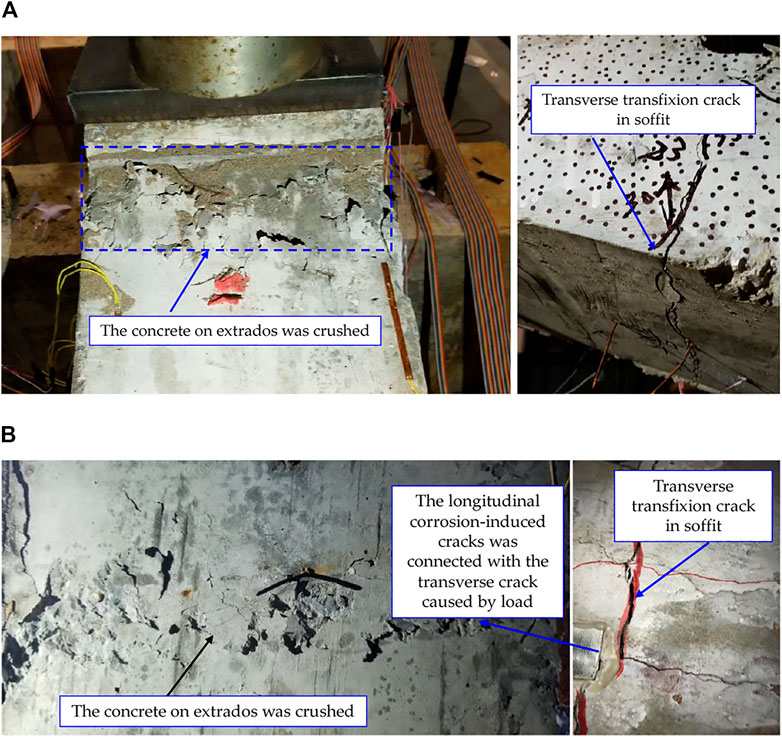
FIGURE 12. Failure mode: (A) arch 0# and (B) arch 1#.
Although corrosion did not transform the failure mode of the arch rib, the section resistance of the arch rib was reduced. The corrosion-induced longitudinal cracks were connected with load-induced transverse cracks, which accelerated the failure process. The failure load of arch 0# and 1# were 61 and 55 kN, respectively, that is, the ultimate bearing capacity of the arch decreased by 9.84% with the corrosion level of 7.62%.
Note that the failure mode of the structure is determined by the priority of different failure paths. The consistency of the failure mode before and after corrosion showed that the quantitative weakening degree of corrosion to the compression-bending failure and shear failure of the arch rib is not distinct. In addition, the ultimate load obtained in this study corresponded to the state of single hinge failure at the loading point, that is, the bearing capacity mentioned in this study was the section bearing capacity. Therefore, the corrosion rate here was the average corrosion rate of the loading point area, and the following theoretical bearing capacity was calculated accordingly.
An arch is a member mainly carrying the bending moment and axial force. Based on the principle of equivalent beam–column, the bearing capacity of arches could be calculated as eccentric compression columns. A continuous moment–axial force (M-N) curve was the complete expression of the bearing capacity of the eccentric compression members.
For RC members whose sectional dimensions, reinforcement arrangement, and materials strength are determined, pure compression and pure bending can be regarded as two ultimate states of eccentric compression. From a continuum mechanics point of view, the transition between three mechanical states of pure compression, eccentric compression, and pure bending should be continuous. The curves of eccentric compression members should be smooth without breaking points. Based on the aforementioned properties, our previous study presented a bearing capacity evaluation model of deteriorated eccentric members based on a unified formula (Xin et al., 2019), which is shown in Figure 13. First, the axial compression point, the pure bending point, and the balanced failure point were selected as the basic points because of the definite stress states. The deteriorated strength of the basic points was calculated by considering various deterioration factors caused by steel corrosion. Second, the interpolation points were generated by the piecewise cubic Hermite interpolating polynomial (PCHIP). Third, the explicit expression of the interpolation points fitting function was realized by the trigonometric Fourier series model. The flowchart of the proposed model is shown in Figure 13. The validity and accuracy of the model had been proved by comparing the existing test data and models (Xin et al., 2019; Zhang et al., 2019).
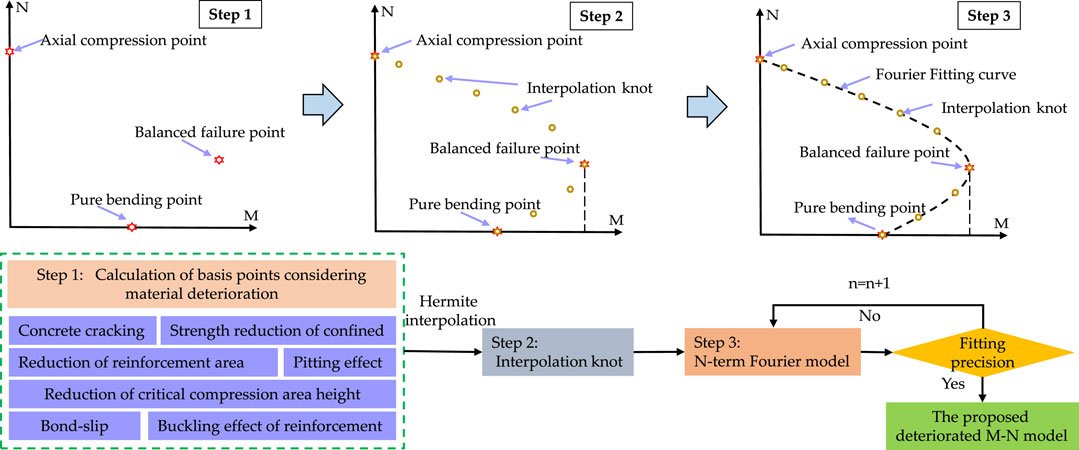
FIGURE 13. Bearing capacity model considering section resistance degradation (Xin et al., 2019).
The essence of the bearing capacity model of corroded RC members considering the influence of various deterioration factors proposed in Bearing Capacity Model Considering Section Resistance Degradation was the resistance correction of the transverse section of the arch rib. This correction occurred in the transverse direction. Correspondingly, the internal force development paths of different sections were different under the same load in the longitudinal plane of the structure. In Figure 14,
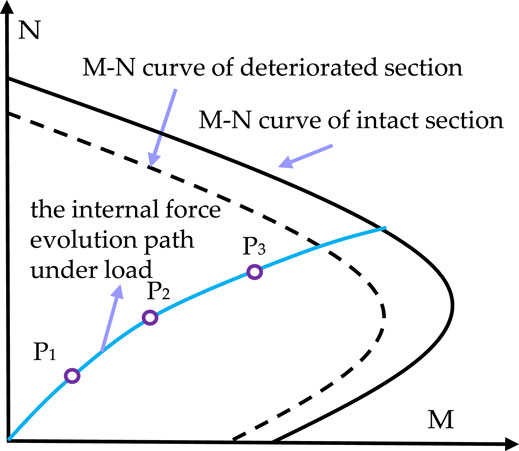
FIGURE 14. Degradation mechanism of section strength considering material deterioration.
According to the principle of structural mechanics, the internal force of the arch structure is mainly related to the position of the load and the structural parameters of longitudinal plane such as rise, span, and arch axis coefficient. In Figure 15, the segment of the hingeless arch rib between the arch spring section and any section i was taken as the isolation body, where the solid line was the longitudinal axis of the non-corrosion arch under load, and the dotted line was the longitudinal axis of the corroded arch under the same load. The coordinate origin was located at the arch spring; the horizontal direction was defined as X-axis, while the vertical direction was defined as Y-axis; and P represents the external load.
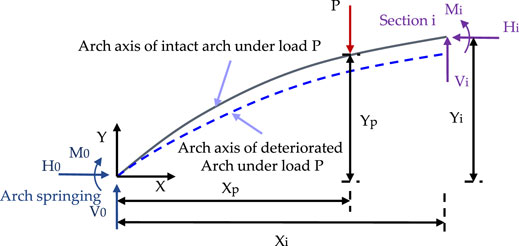
FIGURE 15. Sectional internal force diagram of the deteriorated arch.
According to the static equilibrium condition, the internal force of the section i of the hingeless arch could be obtained by the following equations:
where
For the catenary arch bridge (Figure 16), the arch axis equation can be expressed as follows:
where
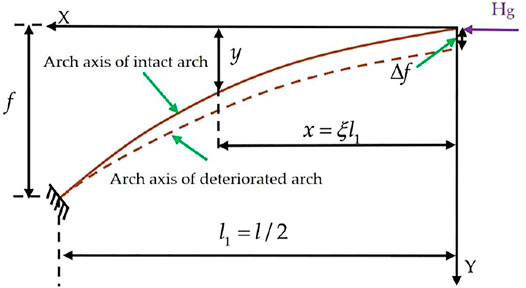
FIGURE 16. Calculation diagram of a catenary arch.
For the arch spring section,
The horizontal thrust of the catenary arch can be calculated by the following equation:
After deterioration, the stiffness of the arch decreases and the deformation increases. The axial equation of the arch can be expressed by the following:
In general, the deformation of the deteriorated arch is very small compared with the rise in height, which is close to 0, so it is assumed that the internal force of the arch foot will not change after the deformation of the deteriorated arch. Then the bending moment of section i of the deteriorated arch can be calculated as follows:
where
As shown in Eq. 11, under the same load, the deteriorated arch has additional bending moment in the same section compared with the intact arch, and the local limit state of the deteriorated arch is easier to achieve, as shown in Figure 17,
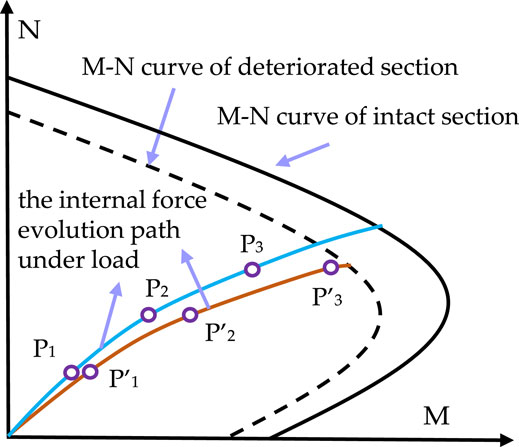
FIGURE 17. Failure mechanism of the arch structure considering double deterioration effect.
The horizontal compression displacement is not considered in this study. For the section at the loading point,
Table 2 shows the calculation and test results of the ultimate bearing capacity of arch 0# and arch 1#. It can be seen from Table 2 that the calculation results based on the equivalent beam-column method were smaller than the model test results, and the calculation result was conservative, which was consistent with the research conclusion of Lin and Chen (2016). The bearing capacity reduction rate obtained from the test was in good agreement with the theoretical value, which was 9.84 and 12%, respectively. Compared with the bearing capacity model only considering the section resistance degradation, the predictive value considering double deterioration effect of section resistance degradation and arch axis degradation was smaller, and only considering the section resistance degradation may underestimate the adverse effect of corrosion on the arch structure, which was more unsafe.

TABLE 2. Bearing capacity of the arch model.
The existing studies pay insufficient attention to the durability deterioration of reinforced concrete arch bridges. To address this deficiency, an experiment on an RC arch rib under the coupling action of a load and corrosion was carried out in this study, and a theoretical prediction method of ultimate load considering the effect of resistance degradation and arch axis degradation was employed. Some concluding remarks can be summarized as follows.
1) The spacing of load-induced cracks in the non-corrosion arch was relatively uniform. In contrast, the number and distribution range of load-induced cracks in corroded arch were smaller, while the maximum crack width increased. The mechanical performance of the arch rib was sensitive to corrosion damage.
2) Corrosion significantly reduced the bearing capacity of the arch rib. Compared with the non-corrosion arch rib, when the corrosion level was 7.62%, the cracking load and bearing capacity of the corroded arch decreased by 28.57 and 9.84%, respectively.
3) Corrosion weakened the stiffness of the structure, and the deformation of the corroded arch was larger than that of the non-corrosion arch under the same load. Corrosion does not transform the failure mode of the arch rib, and both of arch models showed obvious compression-bending failure.
4) Compared with the bearing capacity model only considering the section resistance degradation, the calculation value considering double deterioration effect was smaller, and the theoretical design of bearing capacity prediction model based on dual deterioration effects was more comprehensive; only considering the section resistance deterioration effect may underestimate the detrimental effect of corrosion on the arch structure, which was unsafe.
This study takes the equivalent beam-column method as the underlying theoretical basis, and the equivalent beam-column theory is proposed from the straight column research results. As the stress characteristics of the arch is closer to the curved bar, the accuracy of the equivalent beam-column theory decreases with the breakthrough of the arch bridge span. Future studies should focus on new simplified computational methods to enhance bearing capacity prediction accuracy of long span arch bridges from the basic method level.
The original contributions presented in the study are included in the article/Supplementary Material; further inquiries can be directed to the corresponding author.
JX conceived and wrote this manuscript. JW offered useful suggestions for the preparation and writing the manuscript. XY collected the data. ZL advised on data analysis and manuscript organization. JZ was involved in manuscript writing.
This work was supported by the National Natural Science Foundation of China (51908094, U20A20314), the Natural Science Foundation of Chongqing (cstc2020jcyj-msxmX0532), and the Scientific and Technological Research Project of Chongqing Education Commission (KJQN202001211).
JX and JW were employed by Guangxi Communications Investment Group Corporation Ltd.
The remaining authors declare that the research was conducted in the absence of any commercial or financial relationships that could be construed as a potential conflict of interest.
All claims expressed in this article are solely those of the authors and do not necessarily represent those of their affiliated organizations, or those of the publisher, the editors, and the reviewers. Any product that may be evaluated in this article, or claim that may be made by its manufacturer, is not guaranteed or endorsed by the publisher.
Castorena-González, J. H., Martin, U., Gaona-Tiburcio, C., Núñez-Jáquez, R. E., Almeraya-Calderón, F. M., Bastidas, J. M., et al. (2020). Modeling Steel Corrosion Failure in Reinforced Concrete by Cover Crack Width 3D FEM Analysis. Front. Mater. 7, 41. doi:10.3389/fmats.2020.00041
Dai, L., Wang, L., Bian, H., Zhang, J., Zhang, X., and Ma, Y. (2019). Flexural Capacity Prediction of Corroded Prestressed concrete Beams Incorporating Bond Degradation. J. Aerosp. Eng. 32 (4), 04019027. doi:10.1061/(ASCE)AS.1943-5525.0001022
Deng, K., Yan, G., Yang, H., and Zhao, C. (2019). RC Arch Bridge Seismic Performance Evaluation by Sectional N-M Interaction and Coupling Effect of Brace Beams. Eng. Structures 183, 18–29. doi:10.1016/j.engstruct.2019.01.013
Dong, J., Zhao, Y., Wang, K., and Jin, W. (2017). Crack Propagation and Flexural Behaviour of RC Beams under Simultaneous Sustained Loading and Steel Corrosion. Construction Building Mater. 151, 208–219. doi:10.1016/j.conbuildmat.2017.05.193
Du, R. Y., and Chen, B. C. (2013). Experimental Research on the Ultimate Load Capacity of Reactive Powder concrete Arches. Eng. Mech. 30 (5), 42–48. doi:10.6052/j.issn.1000-4750.2011.11.0783
Fan, Y. F., Zhou, J., Hu, Z. Q., and Zhu, T. (2007). Study on Mechanical Response of an Old Reinforced concrete Arch Bridge. Struct. Control. Health Monit. 14 (6), 876–894. doi:10.1002/stc.184
Fang, S. (2020). Axial Compressive Performance of Corroded Concrete Columns Strengthened by Alkali-Activated Slag Ferrocement Jackets. Front. Mater. 7, 567777. doi:10.3389/fmats.2020.567777
Fu, C., Jin, N., Ye, H., Jin, X., and Dai, W. (2017). Corrosion Characteristics of a 4-year Naturally Corroded Reinforced concrete Beam with Load-Induced Transverse Cracks. Corrosion Sci. 117, 11–23. doi:10.1016/j.corsci.2017.01.002
Fu, C., Jin, N., Ye, H., Liu, J., and Jin, X. (2018). Non-uniform Corrosion of Steel in Mortar Induced by Impressed Current Method: An Experimental and Numerical Investigation. Construction Building Mater. 183, 429–438. doi:10.1016/j.conbuildmat.2018.06.183
Fu, C., Ye, H., Jin, N., and Huang, Y. (2020). Chloride Penetration in Reinforced Concrete Beams under Combined Sustained Loading and Drying-Wetting Cycles. J. Mater. Civ. Eng. 32 (4), 04020025. doi:10.1061/(ASCE)MT.1943-5533.0003076
Huang, Q. W., and Chen, B. C. (2009). Experimental Research on Whole Process Behaviors of Reinforced concrete Box Arch under In-Plane Loads. J. Fuzhou Univ. (Natural Sci. Edition) 37 (3), 394–400. CNKI:SUN:FZDZ.0.2009-03-023.
Kashani, M. M., Crewe, A. J., and Alexander, N. A. (2013). Use of a 3D Optical Measurement Technique for Stochastic Corrosion Pattern Analysis of Reinforcing Bars Subjected to Accelerated Corrosion. Corrosion Sci. 73, 208–221. doi:10.1016/j.corsci.2013.03.037
Li, J. (2012). Research on Moment Increasing Coefficient of Reinforced concrete Arch Bridge. [D]: [Doctoral Dissertation].[Chengdu]. Southwest Jiaotong University.
Li, X., Zhou, J., Wu, Y., Wang, Z., and Li, X. (2021). Structural Analysis and Improvement for a New Form Traveler in Long-Span Cantilever-Casting Arch Bridge. Adv. Mech. Eng. 13 (4), 168781402110099. doi:10.1177/16878140211009997
Lin, S. S., and Chen, B. C. (2016). Calculation of Load-Carrying Capacity of Reinforced concrete Arch Basing on Equivalent Beam-Column Method. J. Fuzhou Univ. (Natural Sci. Edition) 44 (1), 110–114.
Liu, Y., Jiang, N., Deng, Y., Ma, Y., Zhang, H., and Li, M. (2016). Flexural experiment and Stiffness Investigation of Reinforced concrete Beam under Chloride Penetration and Sustained Loading. Construction Building Mater. 117, 302–310. doi:10.1016/j.conbuildmat.2016.04.110
Ma, Y., Xu, F., Wang, L., Zhang, J., and Zhang, X. (2016). Influence of Corrosion-Induced Cracking on Structural Behavior of Reinforced concrete Arch Ribs. Eng. Structures 117, 184–194. doi:10.1016/j.engstruct.2016.03.008
Petryna, Y. S., Pfanner, D., Stangenberg, F., and Krätzig, W. B. (2002). Reliability of Reinforced concrete Structures under Fatigue. Reliability Eng. Syst. Saf. 77 (3), 253–261. doi:10.1016/s0951-8320(02)00058-3
Qiu, J., Zhang, H., Zhou, J., and Zhang, W. (2021). An SMFL-Based Non-destructive Quantification Method for the Localized Corrosion Cross-Sectional Area of Rebar. Corrosion Sci. 192, 109793. doi:10.1016/j.corsci.2021.109793
Shao, X., He, G., Shen, X., Zhu, P., and Chen, Y. (2021). Conceptual Design of 1000 M Scale Steel-UHPFRC Composite Truss Arch Bridge. Eng. Structures 226, 111430. doi:10.1016/j.engstruct.2020.111430
Tang, X. S., Zhang, J. R., Li, C. X., Xu, F. H., and Pan, J. (2005). Damage Analysis and Numerical Simulation for Failure Process of a Reinforced concrete Arch Structure. Comput. Struct. 83 (31), 2609–2631. doi:10.1016/j.compstruc.2005.03.017
Xin, J., Zhou, J., Zhou, F., Yang, S., and Zhou, Y. (2019). Bearing Capacity Model of Corroded RC Eccentric Compression Columns Based on Hermite Interpolation and Fourier Fitting. Appl. Sci. 9 (1), 24. doi:10.3390/app9010024
Zanardo, G., Pellegrino, C., Bobisut, C., and Modena, C. (2004). Performance Evaluation of Short Span Reinforced concrete Arch Bridges. J. Bridge Eng. 99 (5), 4245–4434. doi:10.1061/(ASCE)1084-070210.1061/(asce)1084-0702(2004)9:5(424)
Zhang, D., Zeng, Y., Fang, M., and Jin, W. (2019). Service Life Prediction of Precast concrete Structures Exposed to Chloride Environment. Adv. Civil Eng. 2019 (1), 1–14. doi:10.1155/2019/3216328
Zhang, J., Li, C., Xu, F., and Yu, X. (2007). Test and Analysis for Ultimate Load-Carrying Capacity of Existing Reinforced Concrete Arch Ribs. J. Bridge Eng. 12 (1), 4–12. doi:10.1061/(asce)1084-0702(2007)12:1(4)
Zhang, R., Castel, A., and François, R. (2009). The Corrosion Pattern of Reinforcement and its Influence on Serviceability of Reinforced concrete Members in Chloride Environment. Cement Concrete Res. 39 (11), 1077–1086. doi:10.1016/j.cemconres.2009.07.025
Zhang, S. Y., Zhao, R. D., Jia, Y., Wang, Y. B., and Xie, H. Q. (2017). Model Test Study on Long-Span Railway Concrete Arch Bridge with Rigid Skeleton. J. Southwest. Jiaotong Univ. 52 (6), 1088–1096. doi:10.3969/j.issn.0258-2724.2017.06.008
Keywords: reinforced concrete arch, corrosion, static loading test, bearing capacity, mechanism of performance degradation
Citation: Xin J, Wang J, Liu Z, You X and Zhou J (2022) Experimental Study on Bearing Capacity of Corroded Reinforced Concrete Arch Considering Material Degradation. Front. Mater. 9:847193. doi: 10.3389/fmats.2022.847193
Received: 01 January 2022; Accepted: 17 January 2022;
Published: 04 February 2022.
Edited by:
Zhigang Zhang, Chongqing University, ChinaReviewed by:
Yu Wang, Tsinghua University, ChinaCopyright © 2022 Xin, Wang, Liu, You and Zhou. This is an open-access article distributed under the terms of the Creative Commons Attribution License (CC BY). The use, distribution or reproduction in other forums is permitted, provided the original author(s) and the copyright owner(s) are credited and that the original publication in this journal is cited, in accordance with accepted academic practice. No use, distribution or reproduction is permitted which does not comply with these terms.
*Correspondence: Jieyun Wang, wangjygx@126.com
Disclaimer: All claims expressed in this article are solely those of the authors and do not necessarily represent those of their affiliated organizations, or those of the publisher, the editors and the reviewers. Any product that may be evaluated in this article or claim that may be made by its manufacturer is not guaranteed or endorsed by the publisher.
Research integrity at Frontiers
Learn more about the work of our research integrity team to safeguard the quality of each article we publish.