 Rui Sun
 Ricardo Perera2
- 1Key Laboratory of New Technology for Construction of Cities in Mountain Area, Ministry of Education, School of Civil Engineering, Chongqing University, Chongqing, China
- 2Department of Structural Mechanics, Technical University of Madrid, Madrid, Spain
- 3AVIC, The First Aircraft Institute, Xi’an, China
- 4School of Civil Engineering, Central South University, Changsha, China
This paper is proposed for modelling concrete beams reinforced with fiber reinforced polymer (FRP) bars in a simplified way. In order to appropriately model the FRP-reinforced concrete beams the stiffness matrix is developed in the frequency domain using fast Fourier Transform. Numerical results with the proposed spectral model for the load-displacement response and the shear stress distribution between FRP reinforcement and surrounding concrete are obtained for beams statically tested. Tens of elements are deployed in this work due to the simplicity of the proposed model. Using the same spectral model the natural frequency and mode shapes are evaluated since the frequency-dependent stiffness matrix enables it to apply for dynamic study, e.g. modal analysis. The feasibility of the proposed numerical approach for performing dynamic analysis especially for high frequency excitations in an efficient way makes it a promising tool for use in the field of structural health monitoring according to the changes in dynamic characteristics.
Introduction
The long-term durability of reinforced concrete structures has become a major concern over the past few decades, mainly due to the corrosion risk of steel reinforcements. Fibre-reinforced polymer (FRP) is being increasingly used in civil engineering as a reinforcement to replace steel bars because of its rather durable properties (Rizkalla and Nanni, 2003), especially in aggressive environments where steel reinforcements are easily corroded. Additionally, under some special circumstances, such as in the magnetic resonance imaging rooms of hospitals, there is a demand for electromagnetic permeability, and such needs can be met by FRP bars since they are non-metallic. Since FRP bars possess mechanical characteristics different from those of steel bars (e.g., lower elastic modulus, non-yielding properties), numerous experimental investigations have been carried out to study the behaviour of concrete members reinforced by FRP bars (Barris et al., 2009; Kassem et al., 2011; Al-Sunna et al., 2012; Barris et al., 2013; Miàs et al., 2013; Habeeb and Ashour, 2014; Acciai et al., 2016). Unlike concrete members with steel reinforcement, the experimental results showed that FRP reinforced concrete members behave elastically until failure due to the characteristics of the FRP reinforcement, and structural failure would occur at a relatively large displacement.
Some studies applied analytical models to determine the responses of FRP-RC members. Branson’s equation, which was developed for the design of concrete beams reinforced with steel bars (Branson, 1977; ommittee 318 (2008)., 2008), was adjusted by introducing empirical coefficients (Benmokrane et al., 1996) and a modified equivalent moment of inertia (Bischoff, 2005). In refs. Razaqpur et al. (2000); Rasheed et al. (2004), bilinear and tri-linear moment-curvature relationships have been used to derive closed-form equations for predicting the deflection of FRP-reinforced members. A local deformation model was developed in ref. Gravina and Smith (2008) to capture the flexural response and moment distribution of indeterminate concrete beams reinforced by FRP bars, in which the progressive cracking process with an increasing load was considered. An iterative analytical procedure was also proposed for the prediction of the flexural behaviour of FRP-reinforced concrete beams in ref. Almusallam (1997). During the iterative process, the neutral axis depth is changed until force equilibrium is reached. Furthermore, ref. Kara et al. (2013) presented an analytical model for evaluating the deflection of FRP-reinforced concrete structures, and the flexural and shear cracks in cracked regions were reduced by introducing an effective moment of inertia. Although several studies have been conducted to develop design formulas, many researchers have noted that deviations occur when using these equations to predict the deflection of FRP-reinforced concrete beams (Aiello and Ombres, 2000; Mota et al., 2006).
A two-dimensional finite element (FE) model was used to study the performance of concrete beams reinforced with steel and FRP bars (Bencardino et al., 2016), and it was shown that a 2D FE model can be used to simulate the load-deflection relationship of concrete beams reinforced with different ratios of steel and FRP. Furthermore, a spatial 3D FE model that is more realistic for simulation was used to calculate the flexural deflections of FRP-RC beams (Zhang et al., 2015), and the results show better agreement with the experimental data than the equations from the design code. To clarify the failure mechanism of FRP-RC members, a limit analysis strategy is integrated with an FE model (De Domenico et al., 2014) by using the linear matching method (LMM) and the elastic compensation method (ECM), which is adequate for obtaining the upper and lower bounds of the peak load value. Furthermore, to calculate both global deformation and local strain, several FE models were developed by considering the constitutive laws of materials and the interfacial bond-slip model of an FRP bar and concrete (Nour et al., 2007; Rafi et al., 2008; Hawileh, 2012; Hawileh, 2015). A proportional integral derivative (PID) controller (Echeverria and Perera, 2013) was introduced into the 3D FE approach to capture the softening branch of the interfacial bond-slip performance between FRP rods and concrete.
Obviously, an analytical model can be used to evaluate the global behaviour of an FRP-RC beam, but it is very difficult to capture the local behaviours, e.g. concrete strain and shear stress distribution. Although this shortcoming can be overcome by using a refined FE model, a huge number of elements are needed, which results in a heavy computational cost and possibly a convergence problem due to the highly nonlinear properties of the materials and the interface. In refs. Perera and Bueso-Inchausti (2010); Sun et al. (2015), a 4-degree-of-freedom spectral element model was used to simulate the flexural behaviours of RC beams strengthened with externally bonded FRP strips by considering the interfacial bond slip between the FRP strip and the RC beam. This numerical approach has shown promise due to its simplicity since it is derived from the frequency domain. Thus, it is adopted in this study for determining the global and local performance of an FRP-RC beam by assuming a perfect bond between the FRP bars and the surrounding concrete for simplicity. Only 23 spectral elements are used to calculate the load-displacement response and concrete strain while tens of thousands elements are needed using FE model. The interfacial bond behaviour between FRP bars and concrete, which is a very local phenomenon, is also evaluated to study the development of shear stress distribution with the gradually increasing load. Obviously, the computational cost has been reduced dramatically due to the simplicity and efficiency of the proposed spectral element method, and the accuracy is verified comparing the numerical results with the experimental data.
Of particular interest is the ability of the present model to obtain the dynamic characteristics of FRP-RC beams, since to the best of the author’s knowledge, few studies have focused on the dynamic analysis of FRP-RC beams (Capozucca and Bossoletti, 2014; Capozucca et al., 2015). By making a frequency sweep for the dynamic stiffness-matrix, the natural frequencies and mode shapes are efficiently calculated even in high frequency range as long as the uniformity of concrete beam remains unchanged (Trefethen, 2000; Gopalakrishnan et al., 2008). Structural damages can be identified according to the changes of dynamic characteristics under intact and damaged scenario, which makes the proposed model promising for damage detection due to its simplicity and efficiency.
Spectral Model of a Concrete Beam Reinforced With FRP Bars
Since one of the main advantages of the proposed spectral model is its simplicity for calculating the structural behaviour, in which the formulations are established in the frequency domain, it can be used to analyse the global and local responses of an FRP-RC beam in this study. To this end, the governing equations are derived in this section. First, the axial and transverse displacement of the beam can be formulated as follows by using first-order shear deformation theory:
where
where
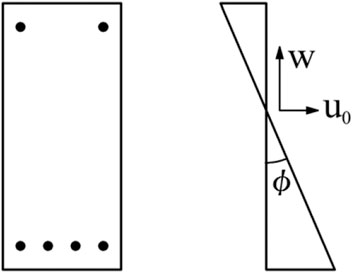
FIGURE 1. Kinematics of the transverse section of the concrete beam reinforced with FRP bars.
The constitutive relation of the FRP bar is assumed to be linearly elastic, and the nonlinearity of the concrete material is considered since it has a great influence on the load-resisting mechanism. The nonlinear constitutive relationships of concrete in compression and tension are based on the CEB-FIP code in (fib, 2010). Furthermore, the bond behaviour between the bar and concrete is an essential aspect of the reinforced beam. Although the bond-slip relationship was discussed, it still highly depends on the surface condition, material strength and confinement provided by the surrounding concrete (Yan et al., 2016; Solyom and Balázs, 2020; Solyom and Balázs, 2021). Since one of the main purposes of this study is to numerically simulate FRP-RC beams in a simplified way to reduce computational costs, a perfect bond relationship based on the equilibrium of FRP bars and the surrounding concrete is used in this work. Therefore, the stresses of the concrete and bar can be expressed as follows:
where
Based on the expressions above, the strain energy of the reinforced beam composed of concrete and FRP bars is formulated as
where z1 and z2 are the Z-coordinates of the bottom and top surfaces limiting the beam, respectively, and the variables bC and L denote the width and length of the beam, respectively. NB is the number of FRP bars, and the area of each bar is ABj. Since a perfect bond relationship between the FRP bars and the surrounding concrete is used in this word, the shear strain energy of FRP reinforcement is neglected for simplicity.
By introducing Hamilton’s principle, the differential equations of motion can be derived by incorporating the kinematic energy of the beam. The equations of motion for the displacement field are given by
and the boundary force equations are
where N, V and M are the boundary forces related to the variables u0, w and ϕ, respectively.
The coefficients in Eqs 8–13, which are related to the material properties, are given by the following expressions:
where ρC denotes the density of concrete and EBj is the elastic modulus of each FRP bar. To model the progressive cracking process, the entire beam is divided into several layers through the height, and the material properties of the concrete in each layer will be updated by using the nonlinear stress-strain relationship of concrete. Furthermore, the elastic modulus of the FRP’s EB is treated as a constant due to its non-yielding properties.
By applying a fast Fourier transformation (FFT), the displacement field is transferred from time domain to frequency domain as follows:
where N is the number of frequency sampling points, which depends on the Nyquist frequency.
where W is a 3 × 3 matrix with functions of frequency and wavenumber as follows:
For each frequency point, the wavenumber kmn can be obtained by solving a 6-th order equation when W equals zero in Eq. 18, and the six related eigenvectors Ri (i = 1, … 6) can be used to formulate the general solution of nodal displacement as
Furthermore, the displacements of the two nodes in an element with a length of L can be expressed as
where {A} is the vector of the constants, which depends on the associated boundary conditions. Substituting Eq. 21 into Eq. 20, the nodal displacements can be obtained as
where [N] is the matrix of the shape functions of the proposed spectral model. By combining the boundary forces given by Eqs 11–13, the dynamic stiffness matrix (DSM) [K] is formed to compute the displacement in the frequency domain:
Based on the derivation of the equations presented above, the 6 × 6 DSM [K] is formulated, as shown in Eq. 23. Additional details regarding the FFT process and implementation of the spectral element model can be found in Trefethen (2000); Capozucca et al. (2015). The DSM, which is frequency-dependent, is established according to the governing equations and boundary conditions in Eqs 8–13, and it can be considered a combination of a mass matrix and a stiffness matrix that introduces exact dynamic shape functions. Since circular frequency
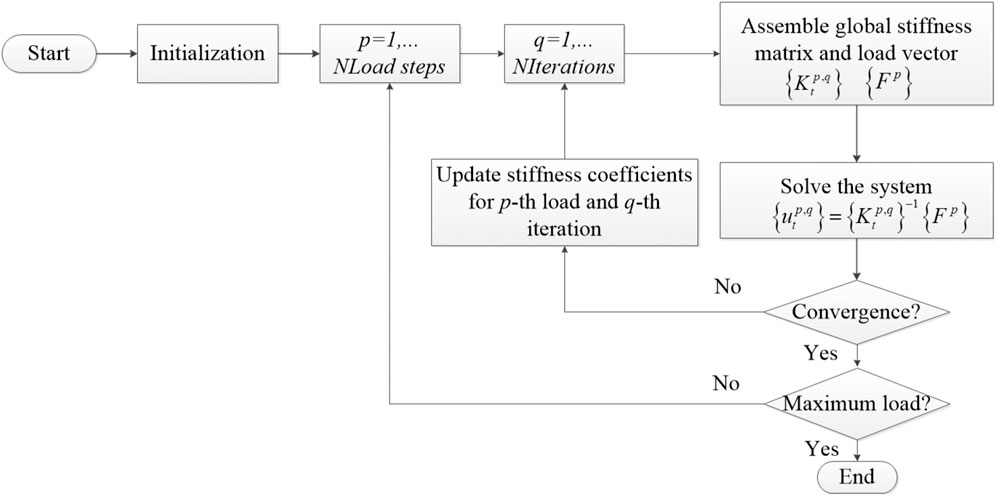
FIGURE 2. Framework of proposed numerical strategy for static study.
Case Study of the Proposed Model
Concrete beams reinforced with FRP bars tested by Al-Sunna (2006) were selected to validate the capability of the proposed spectral model. In his tests, twenty-eight concrete beams and slabs reinforced with FRP or steel bars were fabricated, two FRP bars with nominal diameters of 6 mm were located in the compressive zone, and FRP bars with diameters of 9.5 and 12.7 mm were used as the main flexural reinforcement for concrete beams BG1 and BG2, respectively. The reinforced beams were 150 mm wide, 250 mm deep and 2,550 mm long, and the span between two supports was 2,300 mm. The experimental test setup is shown in Figure 3. The specimens were tested by progressive four-point loading with a shear span of 767 mm (one-third of the length), and two loading platens were used to control the deflection of FRP-RC beams during testing. Fourteen strain sensors were installed to measure the local strain of the reinforced beam; four of them were adhered to the FRP bar to capture the strains of the bar, and the other ten gauges were located around the crack inducer at the midspan to measure the local behaviour at the crack locations. In this study, the experimental data of two concrete beams reinforced with GFRP (glass-fibre-reinforced polymer) are chosen to validate the accuracy of the proposed approach, and the material properties and geometrical parameters of the specimens are illustrated in Table 1.
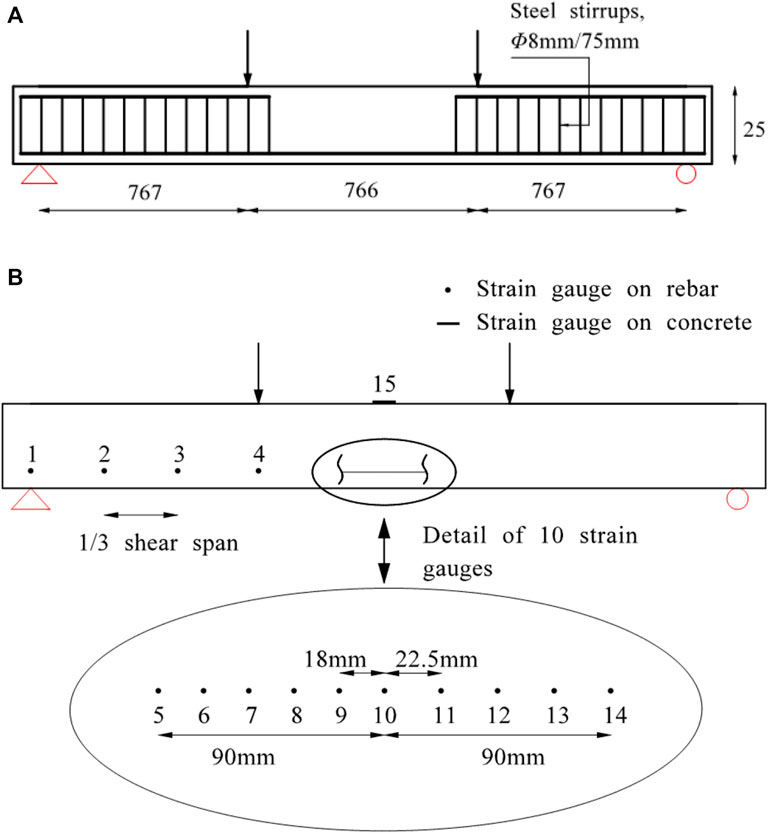
FIGURE 3. (A) Experimental test setup, (B) arrangement of rebar and concrete strain gauges.
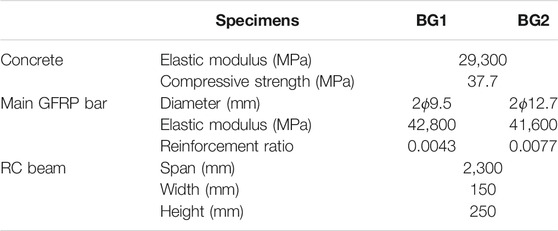
TABLE 1. Material and geometrical properties of the tested specimens.
As presented previously, the proposed approach can simulate the behaviours of a reinforced beam with only one spectral element if there is no discontinuity of the geometrical and material properties. Since the two specimens maintain their uniformity along the length of the beam, it is very convenient to evaluate global and local behaviours by using the proposed one-dimensional model due to its simplicity. The mechanical behaviours, particularly for local behaviours such as stress and strain, can be obtained with higher accuracy by using more elements, and the computational burden would simultaneously increase. Hence, the number of elements can be determined by balancing the computational costs and the desired degree of precision. To this end, the element size is chosen as 100 mm in this study, resulting in a total of 23 spectral elements for the RC beams. Obviously, the computational costs decrease remarkably by reducing the number of elements from tens of thousands in the FE model to tens of elements. Additionally, the static behaviour of the FRP-RC beams can be directly calculated by making the circular frequency
The longitudinal FRP bars are modelled as an elastic material by assigning the elastic modulus according to the tested data given in Table 1. The strain-stress relationship of concrete in the European Code (fib, 2010) is introduced in the present work. The nonlinear property of concrete is simulated by adopting a secant procedure, in which the elastic modulus of concrete is updated by the secant modulus associated with the concrete strain with the increasing load. The parameters of Eqs 14–16 related to the material properties are represented by the equivalent secant modulus of concrete. The cross section of each element is divided into twenty layers along the height of the beam to model the progressive cracking of concrete as the load increase. Furthermore, the applied load is divided into several sub-load steps, and the material properties of the RC beam would be updated implicitly in an iterative manner until force equilibrium is reached for each load step. By conducting this load-control strategy, the nonlinear behaviour throughout the FRP-RC beam can be evaluated in details.
To model the mechanical behavior of FRP reinforced concrete beam using conventional finite element method, a refined mesh is usually required leading to a huge number of elements. However, a small number of elements are needed by using the proposed spectral approach, since only one spectral element is enough to calculate the structural response as the geometry and material remains uniform. In this study, an element size of 100 mm is selected in the proposed model resulting in only 23 spectral elements to numerically simulate the flexural and local behaviors of the FRP-RC beam with a length of 2.3 m. Therefore, the computational burden is significantly released compared with the FE model due to the simplicity and efficiency of the proposed spectral approach.
Validation of the Proposed Model
Flexural Behaviours
The FE model was implemented in Al-Sunna (2006) by using commercial software to numerically simulate the FRP-RC beams. The relationship between the load and the deflection at the midspan of specimens BG1 and BG2 obtained from the experimental test and numerical simulation are compared, as shown in Figure 4. In general, the load-deflection curves present an approximate bilinear response. Both of the beams exhibit a brittle elastic behaviour with no softening prior to failure. In the first stage, before the first crack occurs at the load of 14 kN, the FRP-RC beams follow a linear elastic behaviour pattern with a steep slope. The reinforcement ratio of FRP bars has an insignificant effect on the stiffness of the load deflection curves with only a slight influence on the cracking loads for the two beams. In the second stage, a subsequent reduction in the slope is observed due to the progressive cracking of the beam occurs, which shows linear and non-ductile behaviour with increasing load because of the non-yielding properties of the FRP bars. The deflection of BG2 after the first crack has been reduced remarkably compared to that of BG1, and the geometrical and material properties are the same except for the amount of FRP reinforcement at the bottom of the RC beams. With the increase of reinforcement area, a greater increase in the stiffness and also the ultimate load of BG2 than BG1 is observed. Failure mode of BG1 might be governed by FRP rupture since the midspan deflection of BG1 is much higher than that of BG2 at the same load level. In general, a small deviation is noticed between the numerical and the test results, which indicates the ability of the proposed approach to predict the pre- and post-cracking deflections of the FRP-RC beams and demonstrates the accuracy of the proposed spectral model.
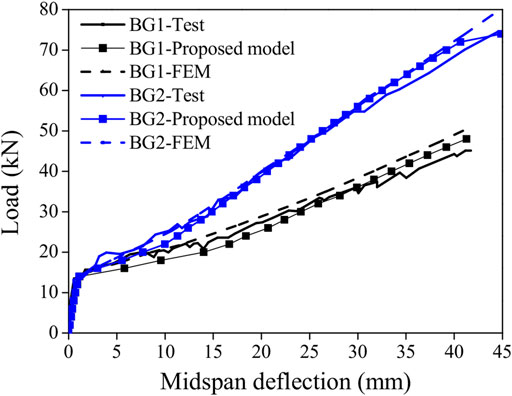
FIGURE 4. Load-deflection comparison at the midspan.
Strain of the FRP bar
According to the material properties of the FRP bars, which are elastic until failure, the load-strain relationship of the FRP bar at the midspan is shown in Figure 5. The load-strain curves of the two RC beams show a linear relationship before concrete cracking at 14 kN. Afterwards, the rebar undergoes additional strain with the development of cracks at higher load levels. Finally, the FRP approaches the rupture strain, which is approximately 15,000 microstrains according to the test data. The non-yielding properties of the FRP bars cause the lack of ductility of FRP-RC beams, which would result in sudden brittle failure because of FRP rupture. This phenomenon is one of the main differences between concrete beams reinforced with steel and those with FRP. As reported in Al-Sunna (2006), the failure mode of BG1 is the rupture of FRP bars during the four-point loading test, while for BG2 it is concrete crushing immediately followed by the rupture of the FRP bars, which results in balanced failure. The prediction of the current numerical model is in good agreement with the experimental results and FE simulation.
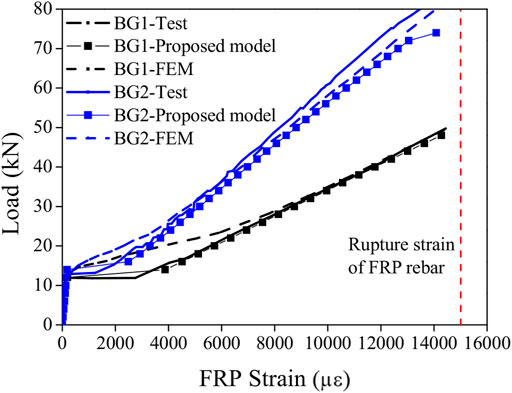
FIGURE 5. Load-strain relationship of the FRP bar at the midspan.
By applying the proposed spectral model for both specimens, the strain distributions of the FRP bars under different load levels along the lengths of the beams are shown in Figure 6. The strains obtained by the experimental test and FE simulation are compared with the results predicted by the spectral approach and show good agreement. According to the results obtained from the proposed model, low strain of the bar is observed over the support of the beam, and increasing strain occurs from the shear span to the midspan, reaching a plateau between the two loading points. Figure 6 reveals that the plateaus of the FRP stain at the midspan in the numerical simulation are different from those of the experimental results, in which strain concentration exists. This result is mainly due to the application of the smeared crack model in the proposed numerical approach to represent flexural cracks instead of a discrete crack model. The concrete and steel properties were updated using the secant modulus during the iterative nonlinear analysis until force equilibrium was reached as the load level increased. Therefore, the flexural cracks at the midspan are simulated uniformly by using the proposed spectral model. It can be observed that the measured FRP strains are more localized due to the penetration of cracks and their nearby openings; thus, the strain variation at the midspan exhibits conditions that are different than the average conditions assumed in the numerical simulation.
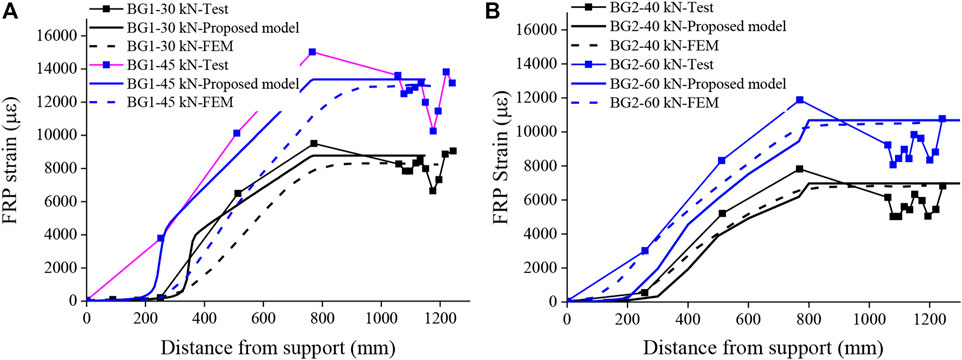
FIGURE 6. FRP strain along the length of (A) BG1 and (B) BG2.
Concrete Strain
In the test, to measure the strain development of concrete, the strain gauges were located on top of the FRP-RC beams at the midspan. The typical load-strain relationships of both specimens are shown in Figure 7. As shown, the proposed numerical approach predicts the measured concrete strains for BG1 and BG2 reasonably well. Similar to the development of the FRP strains in Figure 6, the concrete strain is negligible before cracking, and it increases remarkably with load until failure after concrete cracking at a load level of 14 kN. The experimental strain of the concrete on the top surface is compared with the predictions of the proposed model and FE simulation. The differences between the tested data and numerical results are shown in Figure 7. One of the reasons for this discrepancy may be the heterogeneity of the concrete material, as it is assumed to be homogeneous for the numerical calculation to simplify the nonlinear analysis. Nevertheless, considering the fact that only one-dimensional and two-dimensional elements are used for numerical simulation in the proposed spectral approach and FEM, respectively, the predicted global and local behaviours are reasonable, as presented previously, which demonstrates the reliability of the proposed spectral model.
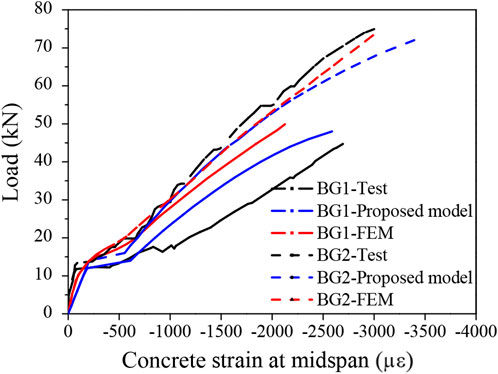
FIGURE 7. Load-concrete strain comparison at the midspan.
As previously presented, the cross section of the reinforced beam was divided into several fibres to update the material properties during nonlinear analysis. Hence, the concrete strains of BG1 and BG2 at the midspan can be evaluated along the depth of the beam at different load levels. Figure 8 shows the strain profiles on the cross section at different load levels for the two RC beams. The slopes of the strain profiles represent the curvature of the cross section. Obviously, the concrete strain across the depth of the section shows a linear relationship, and a larger strain in the compressive and tensile sections are observed at higher load levels.

FIGURE 8. Concrete strain of BG1 and BG2 along the depth at the midspan.
By using the strain sensors located at the top of the reinforced concrete beam, the neutral axis depth can be deduced by using the curvature (φ) and concrete strain at the top fibre of the midspan (εc) as follows:
According to the distribution of the concrete strain along the depth of the cross section, as illustrated in Figure 8, the average neutral axis depth can be evaluated numerically by using linear interpolation. The numerical prediction and experimental neutral axis depth are compared in Figure 9. The neutral axis depth, which is located at the middle of the cross section, has a value of 125 mm before cracking and decreases significantly when a cracking load of 14 kN is reached. Thereafter, the neutral axis depth increases slightly until the maximum load level. The influence of the reinforcement ratio on the neutral axis depth is also shown in Figure 9; good agreement can be observed between the numerical simulation and the experimental results.
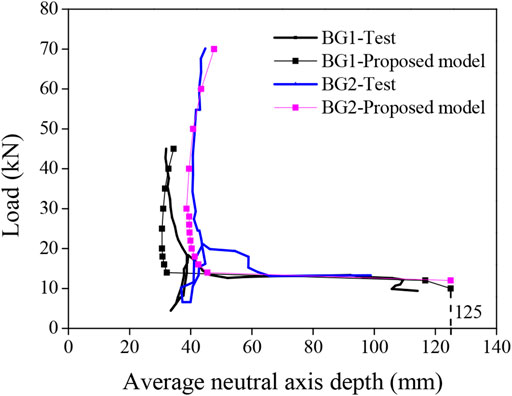
FIGURE 9. Average neutral axis depth of BG1 and BG2.
Bond Shear Stress
For a segment of the tensile bar surrounded by concrete with a length of
where
where d is the diameter of the bar, and
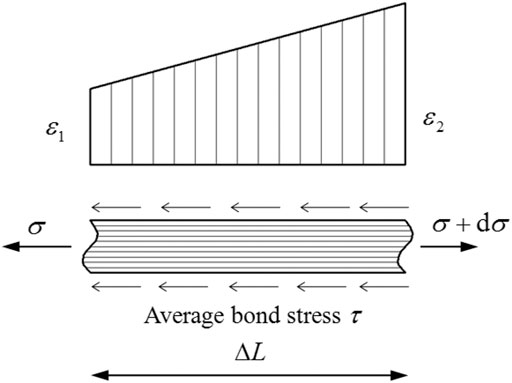
FIGURE 10. Bond behaviour of a segment of FRP bar.
Different surface conditions of the FRP bars in the manufacturing process would affect the bond behaviour due to the mechanical interlock between the deformed bar and the confined concrete. This effect is beyond the scope of this study, considering the simplicity of proposed one-dimensional model. Hence, to study the interfacial bond behaviour, the average bond shear stress along the length of bar is numerically evaluated using Eq. 26. A refined mesh is needed to study the interfacial bond stress, and the length of the proposed one-dimensional element is defined as 0.01 m, resulting in 230 spectral elements for the two specimens. Nevertheless, the computational cost has decreased dramatically compared with that of conventional FEM. Since few strain gauges were used in the test, the bond stresses along the lengths of the beams were not measured. To clarify, the numerical results are discussed in this section.
The average bond shear stress of BG1 and BG2 distributed along the length of the FRP bar are evaluated numerically, as shown in Figures 11A,B, respectively. As the smeared crack model is employed to model flexural cracks in this study, concrete cracking is represented by reducing the elastic modulus of each element. Hence, the bond stress concentrations near the flexural cracks are not represented in a distributed way. As shown, the predicted bond stress between the two loading points at the midspan of the RC beams tends to be zero, and it increases from the loading point to the shear span until reaching a peak stress. With increasing load, the value of peak bond stress increases. The location of the peak point would gradually move towards the supported end of the beam with increasing load, from 0.52 m at 20 kN to 0.24 m at 50 kN for BG1, and from 0.58 m at 20 kN to 0.2 m at 70 kN for BG2. This phenomenon demonstrates that the concrete surrounding the FRP bar might peel off near the beam’s support at a high load level, as the maximum bond strength is exceeded. Furthermore, it is worth noting that the value of the peak bond stress of BG1 (from 11.69 to 13.79 MPa) is higher than that of BG2 (from 4.93 to 7.25 MPa) before the ultimate load is achieved, which means that debonding failure of the FRP bars at the support region might occur in an RC beam with a lower reinforcement ratio.
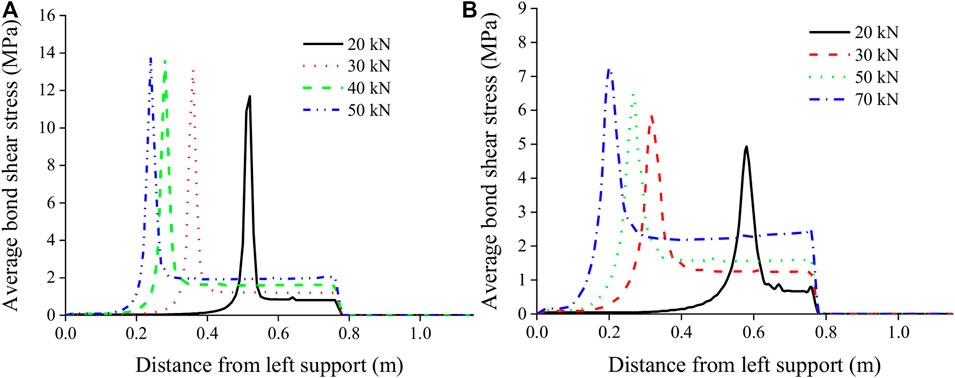
FIGURE 11. Average bond shear stress of (A) BG1 and (B) BG2.
Figure 12 shows the distance of the peak bond stress from the left support of the reinforced beam under different load levels. The peak bond stresses are located at the point of loading initially and could migrate towards the supporting end of the beam as the load increased, until failure, as long as the cracking load is reached. The turning points of both curves are associated with the cracking load at load levels of 12 and 14 kN for BG1 and BG2, respectively. As seen in Figure 12, the location of the peak bond stress of BG1 is closer to the free end than BG2 at the same load level. Additionally, the peak stress of BG1 is higher than that of BG2, as shown in Figure 11. Therefore, it can be concluded that end-peeling, which usually occurs in a sudden and brittle way, is more likely to occur at the surface between the FRP bar and the surrounding concrete in BG1 than in BG2. Due to a higher axial stress resistance, a higher reinforcement ratio of the FRP bars can enhance the shear bond performance of a reinforced beam.
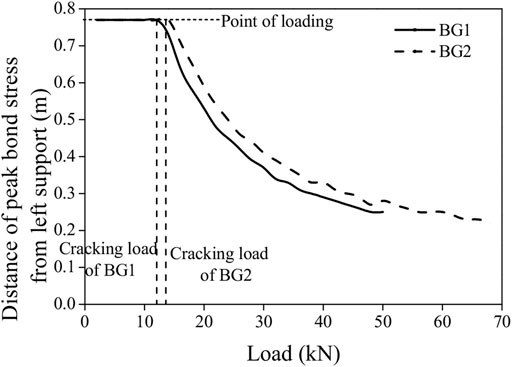
FIGURE 12. Distance of the peak bond stress from the left support.
Dynamic Validation
As shown in Eq. 23, the DSM [K], in which the circular frequency
In this work, the signal of the excitation force is applied at the two loading points, and the dynamic responses are captured at four points equally spaced along the beam to simulate different output channels. Despite the fact that only one element can sufficiently represent entire reinforced beam (Sun et al., 2018) as long as the material and geometric properties remains unchanged, more elements are applied in this study so that the nodes of the spectral model correspond with the location of the applied load and output channels. After that, the frequency sampling points are swept from 0 to 2,000 Hz to obtain the natural frequencies of the specimen, and the average normalized power spectral densities are obtained according to the spectra signatures from all channels.
A typical profile of the average normalized power spectral density (ANPSD) of BG1 is shown in Figure 13, and the natural frequencies can be obtained by the frequencies associated with the peak values in the curve. Using the same method, the modal frequencies of both specimens are shown in Table 2, and it is clear that the differences between BG1 and BG2 are quite small (from 0.23 to 0.65 percent), which shows that the increasing reinforcement ratio only slightly influences the modal frequencies.
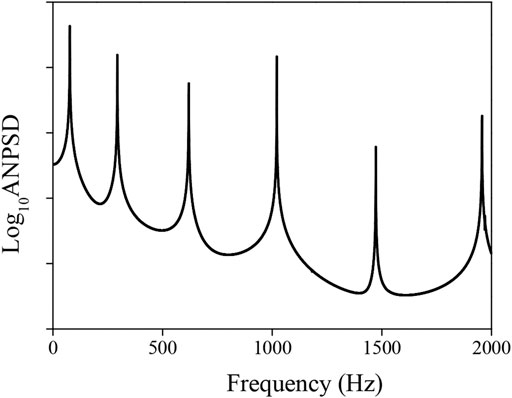
FIGURE 13. ANPSD of BG1.
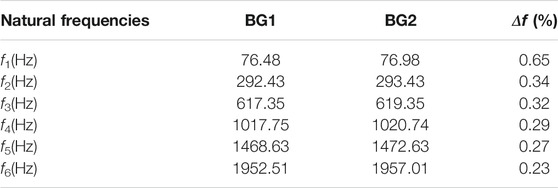
TABLE 2. Comparison of the natural frequencies of BG1 and BG2.
Taking the computational efficiency and accuracy into account, the spectral method can also be used for damage identification by employing a vibration-based technique that can reflect changes in the stiffness, mass or damping ratio of a structure. To achieve this goal, the element size is set as 0.1 m, resulting in 23 elements for BG1 and BG2. Two damage scenarios (D1 and D2) are introduced by reducing the elastic modulus of the element at 1.0 m by 10–20 percent to numerically simulate the flexural crack at the midspan of the specimens. Using the same procedure, the frequency changes among the different levels of damage scenarios can be calculated, as shown in Table 3. The frequency changes can be clearly observed which demonstrate the influence of structural damage on natural frequencies.
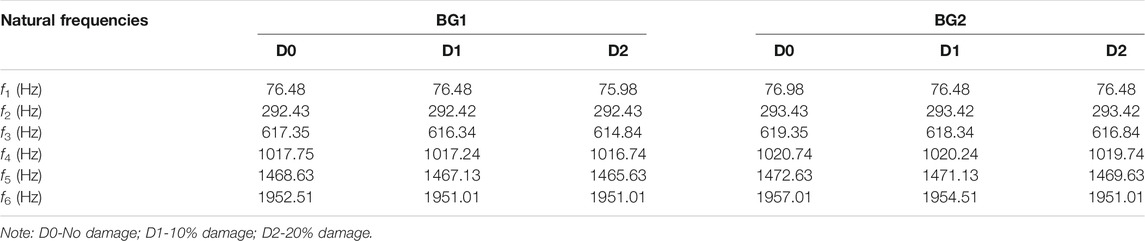
TABLE 3. Comparison of frequency changes due to damage.
The measurement of natural frequencies can exhibit the global structural changes, but it is insufficient when being used for the localization of structural damages. The mode shape curvature, which is extracted from the second-order differentiation of displacement mode shapes as shown in Eq. 27, is more sensitive for depicting structural damage than the frequency characteristics. Hence, it will be used herein to indicate the damage location of the reinforced beam.
In this study, mode shapes can be extracted directly from the nodal displacement related to each natural frequency since the proposed spectral model is formulated in the frequency domain. The damage scenario D2 (20% damage) of BG1 is chosen to study the alternation of mode shape curvature. The first four mode shape and mode shape curvature are shown in Figures 14, 15. According to the abrupt changes of mode shape curvature observed at the location of damaged element, the structural changes correlated to changes in material properties, which are usually caused by structural damage, can be clearly indicated.
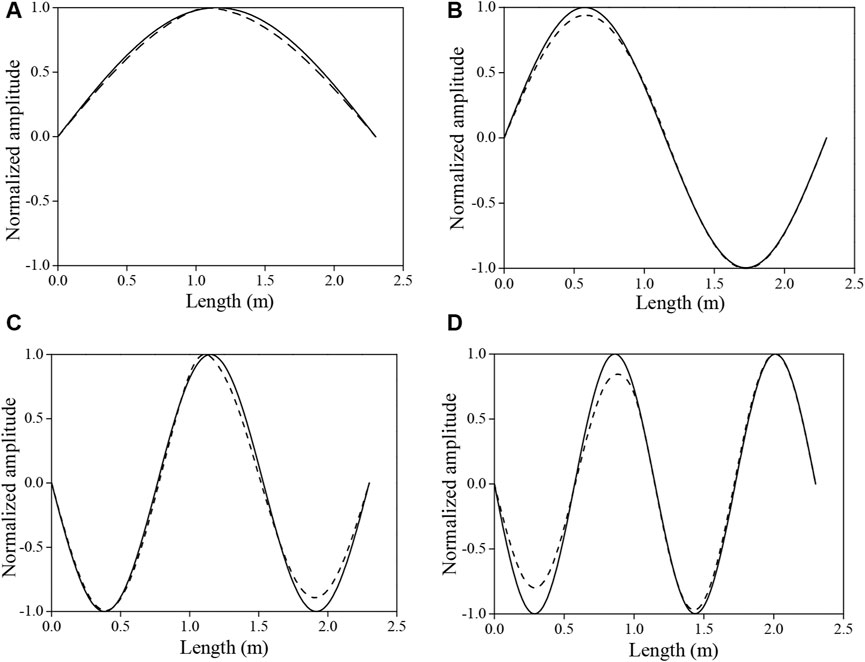
FIGURE 14. First four mode shapes of BG1 of intact (solid line) and damaged (dash line) scenarios. (A): The first mode, (B): The second mode, (C): The third mode, (D): The fourth mode.
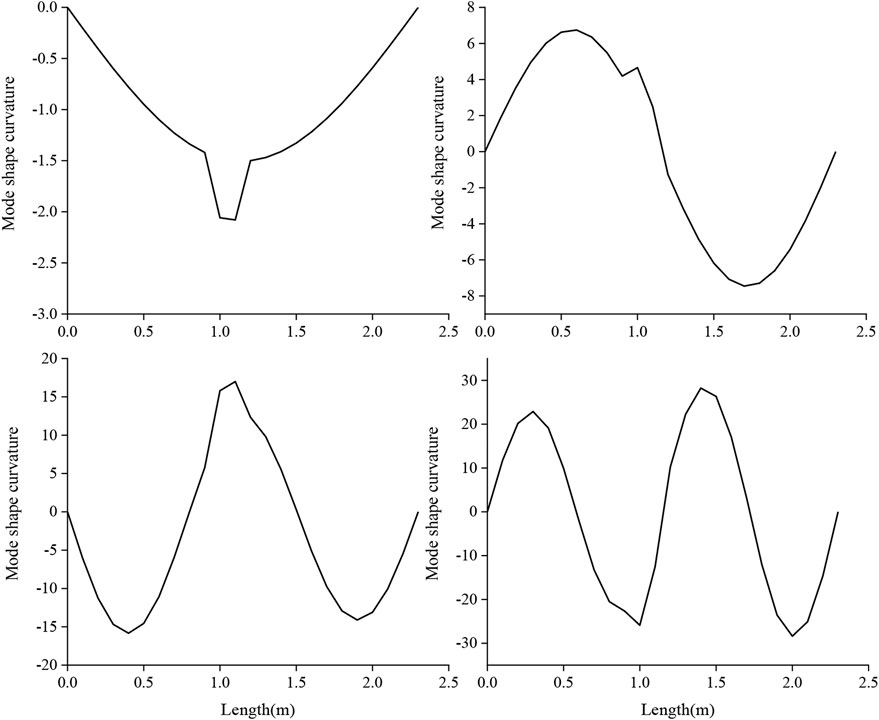
FIGURE 15. First four mode shape curvatures of BG1 of damaged scenario.
Furthermore, an interesting application of the proposed model for damage identification is to be used as the baseline model of FRP-RC beams under a framework of model updating strategy, in which the static and dynamic measurements are usually used to update the baseline model in order to assess the structural conditions. Due to its simplicity and efficiency, the proposed one-dimensional spectral model enables the updating procedure to be conducted in a fast way, compared with that of FE model which requires high computational costs. From this preliminary study, it is found that the quantification of structural damage at an early stage can be used to predict catastrophes and the proposed model has great potential to achieve this purpose.
Conclusion
This study numerically investigated the static and dynamic performances of a concrete beam reinforced with FRP bars by using a simplified spectral model. A one-dimensional spectral model is developed to study the flexural behaviour of FRP-RC beams, and the global deflection and local strain of concrete and FRP bars are calculated. Compared with experimental and FE results, the accuracy of the proposed model has been demonstrated, and satisfactory precision can be achieved by using a small number of elements. The interfacial bond behaviour between the FRP bar and the surrounding concrete is simulated. Despite the simplicity of the proposed one-dimensional model, the peak shear stress and its propagation towards the support end of the RC beam with increasing load have been appropriately captured. This phenomenon represents the tendency of end-peeling of FRP bars when the interfacial shear strength is exceeded.
Since the proposed spectral model is derived in the frequency domain, the dynamic characteristics of the FRP-RC beam, such as the natural frequencies and mode shapes, are obtained by using a small number of elements. Compared with the FE analysis, the computational costs are reduced dramatically due to the simplicity of the proposed model. Furthermore, damage location can be clearly observed based on the changes of the mode shape curvatures. Therefore, due to the simplicity and efficiency, the proposed model might be used as a baseline model for damage identification to prevent catastrophes at an early stage.
Data Availability Statement
The original contributions presented in the study are included in the article/Supplementary Material, further inquiries can be directed to the corresponding authors.
Author Contributions
RS conceived the work and wrote the manuscript. RP and JG developed the numerical model. YW analyzed the results and revised the manuscript.
Funding
The authors acknowledge the financial supports from the Fundamental Research Funds for the Central Universities (NO. 2020CDJ-LHZZ-017, 2021CDJQY-039), Chongqing Research Program of Basic Research and Frontier Technology (No. cstc2020jcyjmsxmX0946), and Spanish Ministry of Economy and Competitiveness (project BIA 2017-84975-C2-1-P).
Conflict of Interest
The authors declare that the research was conducted in the absence of any commercial or financial relationships that could be construed as a potential conflict of interest.
Publisher’s Note
All claims expressed in this article are solely those of the authors and do not necessarily represent those of their affiliated organizations, or those of the publisher, the editors and the reviewers. Any product that may be evaluated in this article, or claim that may be made by its manufacturer, is not guaranteed or endorsed by the publisher.
References
Acciai, A., D'Ambrisi, A., De Stefano, M., Feo, L., Focacci, F., and Nudo, R. (2016). Experimental Response of FRP Reinforced Members without Transverse Reinforcement: Failure Modes and Design Issues. Composites B: Eng. 89, 397–407. doi:10.1016/j.compositesb.2016.01.002
ACI Committee 318 (2008). Building Code Requirements for Structural concrete (ACI318-08) and Commentary (ACI 318R-08). Farmington Hills (Mich, USA): American concrete institute.
Aiello, M. A., and Ombres, L. (2000). Load-Deflection Analysis of FRP Reinforced Concrete Flexural Members. J. Compos. Constr. 4, 164–171. doi:10.1061/(asce)1090-0268(2000)4:4(164)
Al-Sunna, R. (2006). Deflection Behaviour of FRP Reinforced concrete Flexural Members, PhD Thesis. Sheffield, UK): The University of Sheffield.
Al-Sunna, R., Pilakoutas, K., Hajirasouliha, I., and Guadagnini, M. (2012). Deflection Behaviour of FRP Reinforced concrete Beams and Slabs: An Experimental Investigation. Composites Part B: Eng. 43, 2125–2134. doi:10.1016/j.compositesb.2012.03.007
Almusallam, T. H. (1997). Analytical Prediction of Flexural Behavior of Concrete Beams Reinforced by FRP Bars. J. Compos. Mater. 31 (7), 640–657. doi:10.1177/002199839703100701
Barris, C., Torres, L., Comas, J., and Miàs, C. (2013). Cracking and Deflections in GFRP RC Beams: an Experimental Study. Composites Part B: Eng. 55 (12), 580–590. doi:10.1016/j.compositesb.2013.07.019
Barris, C., Torres, L., Turon, A., Baena, M., and Catalan, A. (2009). An Experimental Study of the Flexural Behaviour of GFRP RC Beams and Comparison with Prediction Models. Compos. Structures 91, 286–295. doi:10.1016/j.compstruct.2009.05.005
Bencardino, F., Condello, A., and Ombres, L. (2016). Numerical and Analytical Modeling of concrete Beams with Steel, FRP and Hybrid FRP-Steel Reinforcements. Compos. Structures 140, 53–65. doi:10.1016/j.compstruct.2015.12.045
Benmokrane, B., Chaallal, O., and Masmoudi, R. (1996). Flexural Response of concrete Beams Reinforced with FRP Reinforcing Bars. ACI Struct. J. 93 (1), 46–55. doi:10.14359/9839
Bischoff, P. H. (2005). Reevaluation of Deflection Prediction for Concrete Beams Reinforced with Steel and Fiber Reinforced Polymer Bars. J. Struct. Eng. 131 (5), 752–767. doi:10.1061/(asce)0733-9445(2005)131:5(752)
Capozucca, R., Blasi, M. G., and Corina, V. (2015). NSM Technique: Bond of CFRP Rods and Static/dynamic Response of Strengthened RC Beams. Compos. Structures 127, 466–479. doi:10.1016/j.compstruct.2015.03.013
Capozucca, R., and Bossoletti, S. (2014). Static and Free Vibration Analysis of RC Beams with NSM CFRP Rectangular Rods. Composites Part B: Eng. 67, 95–110. doi:10.1016/j.compositesb.2014.06.005
De Domenico, D., Pisano, A. A., and Fuschi, P. (2014). A FE-Based Limit Analysis Approach for concrete Elements Reinforced with FRP Bars. Compos. Structures 107, 594–603. doi:10.1016/j.compstruct.2013.08.039
Echeverria, M., and Perera, R. (2013). Three Dimensional Nonlinear Model of Beam Tests for Bond of Near-Surface Mounted FRP Rods in concrete. Composites Part B: Eng. 54, 112–124. doi:10.1016/j.compositesb.2013.05.008
fib (2010). Model Code 2010. Bull. 55 Vol. 1 (5)Lausanne, Switzerland: Federation Internationale du Beton; 2010.
Gopalakrishnan, S., Ghakraborty, A., and Roy Mahapatra, D. (2008). Spectral Finite Element Method. 1st ed. London: Springer.
Gravina, R. J., and Smith, S. T. (2008). Flexural Behaviour of Indeterminate concrete Beams Reinforced with FRP Bars. Eng. Structures 30, 2370–2380. doi:10.1016/j.engstruct.2007.12.019
Habeeb, M. N., and Ashour, A. F. (2014). Flexural Behavior of Continuous GFRP Reinforced concrete Beams. J. Compos. Constr 12 (2), 115–124. doi:10.1061/(asce)1090-0268(2008)12:2(115)
Hawileh, R. A. (2015). Finite Element Modeling of Reinforced concrete Beams with a Hybrid Combination of Steel and Aramid Reinforcement. Mater. Des. (1980-2015) 65, 831–839. doi:10.1016/j.matdes.2014.10.004
Hawileh, R. A. (2012). Nonlinear Finite Element Modeling of RC Beams Strengthened with NSM FRP Rods. Construction Building Mater. 27, 461–471. doi:10.1016/j.conbuildmat.2011.07.018
Kara, I. F., Ashour, A. F., and Dundar, C. (2013). Deflection of concrete Structures Reinforced with FRP Bars. Composites Part B: Eng. 44, 375–384. doi:10.1016/j.compositesb.2012.04.061
Kassem, C., Farghaly, A. S., and Benmokrane, B. (2011). Evaluation of Flexural Behavior and Serviceability Performance of concrete Beams Reinforced with FRP Bars. J. Compos. Constr. 15 (5), 682–695. doi:10.1061/(asce)cc.1943-5614.0000216
Miàs, C., Torres, L., Turon, A., and Barris, C. (2013). Experimental Study of Immediate and Time-dependent Deflections of GFRP Reinforced concrete Beams. Compos. Structures 96, 279–285. doi:10.1016/j.compstruct.2012.08.052
Mota, C., Alminar, S., and Svecova, D. (2006). Critical Review of Deflection Formulas for FRP-RC Members. J. Compos. Constr. 10 (3), 183–194. doi:10.1061/(asce)1090-0268(2006)10:3(183)
Nour, A., Massicotte, B., Yildiz, E., and Koval, V. (2007). Finite Element Modeling of concrete Structures Reinforced with Internal and External Fibre-Reinforced Polymers. Can. J. Civ. Eng. 34 (3), 340–354. doi:10.1139/l06-140
Perera, R., and Bueso-Inchausti, D. (2010). A Unified Approach for the Static and Dynamic Analyses of Intermediate Debonding in FRP-Strengthened Reinforced concrete Beams. Compos. Structures 92, 2728–2737. doi:10.1016/j.compstruct.2010.04.006
Rafi, M. M., Nadjai, A., and Ali, F. (2008). Finite Element Modeling of Carbon Fiber-Reinforced Polymer Reinforced concrete Beams under Elevated Temperatures. ACI Struct. J. 105 (6), 701–710. doi:10.14359/20098
Rasheed, H. A., Nayal, R., and Melhem, H. (2004). Response Prediction of concrete Beams Reinforced with FRP Bars. Compos. Structures 65, 193–204. doi:10.1016/j.compstruct.2003.10.016
Razaqpur, A. G., Svecova, D., and Cheung, M. S. (2000). Rational Method for Calculating Deflection of Fiber Reinforced Polymer Reinforced Beams. ACI Struct. J. 97 (1), 175–184. doi:10.14359/847
Rizkalla, S. H., and Nanni, A. (2003). Field Applications of FRP Reinforcements: Case Studies. Farmington Hills (Mich, USA): American Concrete Institute (ACI) Special Publication SP-215.
Solyom, S., and Balázs, G. L. (2021). Analytical and Statistical Study of the Bond of FRP Bars with Different Surface Characteristics. Compos. Structures 270, 113953. doi:10.1016/j.compstruct.2021.113953
Solyom, S., and Balázs, G. L. (2020). Bond of FRP Bars with Different Surface Characteristics. Construction Building Mater. 264, 119839. doi:10.1016/j.conbuildmat.2020.119839
Sun, R., Perera, R., Sevillano, E., and Gu, J. (2018). Parameter Identification of Composite Materials Based on Spectral Model by Using Model Updating Method. Int. J. Polym. Sci., 2018, 7310846–9. doi:10.1155/2018/7310846
Sun, R., Sevillano, E., and Perera, R. (2015). A Discrete Spectral Model for Intermediate Crack Debonding in FRP-Strengthened RC Beams. Composites Part B: Eng. 69, 562–575. doi:10.1016/j.compositesb.2014.10.017
Yan, F., Lin, Z., and Yang, M. (2016). Bond Mechanism and Bond Strength of GFRP Bars to concrete: A Review. Composites Part B: Eng. 98, 56–69. doi:10.1016/j.compositesb.2016.04.068
Keywords: frp reinforcement, numerical simulation, simplified model, flexural behaviour, modal analysis
Citation: Sun R, Perera R, Gu J and Wang Y (2021) A Simplified Approach for Evaluating the Flexural Response of Concrete Beams Reinforced With FRP Bars. Front. Mater. 8:765058. doi: 10.3389/fmats.2021.765058
Received: 26 August 2021; Accepted: 29 September 2021;
Published: 28 October 2021.
Edited by:
Fangying Wang, University of Nottingham, United KingdomReviewed by:
Liang Xia, Huazhong University of Science and Technology, ChinaJu Chen, Zhejiang University, China
Copyright © 2021 Sun, Perera, Gu and Wang. This is an open-access article distributed under the terms of the Creative Commons Attribution License (CC BY). The use, distribution or reproduction in other forums is permitted, provided the original author(s) and the copyright owner(s) are credited and that the original publication in this journal is cited, in accordance with accepted academic practice. No use, distribution or reproduction is permitted which does not comply with these terms.
*Correspondence: Rui Sun, cnVpc3VuQGNxdS5lZHUuY24=; Yi Wang, d2FuZ3lpLmNlQGNzdS5lZHUuY24=