- 1Second Institute of Oceanography, MNR, Hangzhou, China
- 2School of Geography and Marine Science, Nanjing University, Nanjing, China
- 3Deltares, Delft, Netherlands
- 4College of Civil Engineering, Tongji University, Shanghai, China
- 5Marine Science and Technology College, Zhejiang Ocean University, Zhoushan, China
Submerged artificial sandbars (SABs) are increasingly favored as an efficient method for beach nourishment, helping to mitigate beach erosion and maintain the sediment transport budget, thus promoting ecological stability. A comprehensive understanding of the morphodynamical evolution of the submerged artificial sandbar-beach profile is essential. This study employs a scaled-down moving-bed flume test to examine the dynamic geomorphological evolution of the submerged artificial sandbar-beach system under regular wave conditions. Twenty experiments, each with different wave heights and periods representative of the Zhejiang coast, were conducted. The study investigated the profile evolution and wave parameters of the submerged artificial sandbar-beach model. The results reveal low wave reflection in front of the sandbar, indicating that under the tested wave conditions, the sandbar primarily serves as a sediment source rather than effectively reflecting wave energy. In all scenarios, the top of the sandbar migrates shoreward, and the sandbar’s contour shape becomes asymmetric. For smaller wave periods, localized erosion occurs in the troughs, while larger periods result in complete siltation. Continuous sediment transport into the trough characterizes the beach face, with sediment movement controlled by wave height and period. A linear or nonlinear relationship between sandbar erosion depth, beach slope, and wave parameters (height, period) is established, providing an empirical model for SAB-beach profiles. These findings enhance the understanding of SAB-beach systems and offer valuable insights for coastal protection and disaster prevention in engineering applications.
1 Introduction
Beaches are valuable natural resources and dynamic zones of land-sea interaction, holding significant scientific and tourism value. However, in recent decades, beach erosion has intensified due to global climate change, rising sea levels, and the pressures of human tourism and development (Agardy, 1993; Zhao et al., 2020). As the limitations of “hard” coastal protection methods such as dikes and offshore embankments become more apparent, the need for ecological beach restoration methods has grown. The submerged artificial sandbar, an emerging “soft” beach nourishment technique, shows considerable promise. With its low environmental impact and high ecological compatibility, the submerged artificial sandbar is particularly effective in restoring sandy coastlines. First used in the Santa Barbara beach restoration project in the United States in 1935, SABs have since been widely implemented in beach restoration projects worldwide. Countries including the Netherlands, the UK, Germany, Spain, Denmark, and Australia have conducted numerous such projects. Notably, the Netherlands’ Sand Motor project involves placing a large sandbar along the coastline and allowing natural wave action to distribute sand to adjacent areas, reducing dependence on traditional beach replenishment methods. Notable projects include the Gold Coast project in Australia, the Skagen coastal maintenance project in Denmark, and beach nourishment initiatives in New Jersey, USA (de Schipper et al., 2021; Brand et al., 2022; Lorenzoni et al., 2024; Waal, 2024). The use of submerged artificial sandbars in China began later, starting with the 2008 Beidaihe restoration project in Qinhuangdao City, Hebei Province. Since then, this technique has been applied in various beach restoration projects, including those at Laohushi Park in Qingdao, Shandong, Xinkai Estuary and Dapeng New District in Shenzhen, Guangdong, the Sanya Bay coastal protection project in Hainan, Lianyungang in Jiangsu, and the coastal zone ecological restoration in Xiamen, Fujian (Wu et al., 2012; Pan et al., 2022a; Li and Zhang, 2023). However, the technique remains largely unused in Zhejiang’s headland-bay beaches.
Understanding the behavior of submerged artificial sandbars and their response to wave dynamics is crucial for optimizing design and guiding engineering practices. One key function of submerged artificial sandbars is continuous beach replenishment. For this “feeder” role to be effective, the lateral migration of sediment around the sandbars is essential. The strength of wave energy significantly impacts sediment transport and migration. Under typical wave conditions, sediment movement around the sandbar is weak, and there is a long-term trend of sediment accumulation shoreward (Spielmann et al., 2011; Brutsché et al., 2014). However, under strong storm waves, substantial amounts of nearshore sediment are transported. These intense wave conditions can compromise the stability of submerged sandbars, potentially leading to erosion, damage, or displacement of the sandbar structure, which, in turn, causes a significant alteration in offshore sediment transport. This may lead to the rapid dissipation of the submerged sandbar (Grasso et al., 2011a; Smith et al., 2017b, a). Another important function of submerged artificial sandbars is the “lee” effect. This refers to the ability of sandbars to induce wave breaking and energy dissipation, thereby reducing sediment transport behind them and mitigating beach erosion (Van Duin et al., 2004; Grunnet et al., 2005). The lateral migration and sediment transport under wave action are influenced by various factors, including water depth, beach slope, sediment particle size, settling velocity, and recent attention to wave-induced water particle velocity skewness and acceleration (Baldock et al., 2011; Gao et al., 2019, 2021, 2023, 2024; Atkinson and Baldock, 2020).
Research on the interaction between submerged artificial sandbars and waves has employed several methods, including field investigations, physical modeling, and numerical simulations, as demonstrated in several studies on the interaction between submerged artificial sandbars and waves (Grunnet and Ruessink, 2005; Ojeda et al., 2008; Spielmann et al., 2011; Zhang and Larson, 2020; Pan et al., 2023). Physical model experiments are widely employed due to their high spatiotemporal accuracy in observations. Over the past decade, numerous laboratories have focused on studying the fundamental evolution of submerged artificial sandbars, short-term erosion from storms, and related processes (Roelvink and Stive, 1989; Dette et al., 2002; Grasso et al., 2011b; Cao et al., 2015). More recently, scholars have shifted attention to the morphological and dynamic evolution of submerged artificial sandbars, as well as the nonlinear processes induced by waves. Pan et al. (2022b, 2023) investigated the morphological response of submerged artificial sandbars under storm surge conditions and their impact on beach evolution. Similarly, Li et al. (2022b, 2022a) examined experimental research on the morphological response of submerged artificial sandbars under storm surge conditions and their impact on beach evolution, while (Islam et al., 2024) explored the interaction between waves and sediments during the erosion patterns and wave breaking processes on sandbars using a scaled model. Despite these efforts, understanding of the morphodynamic changes across the entire submerged artificial sandbar-beach system under varying wave forces remains limited.
This study aimed to explore the wave propagation in the cross-shore direction and the morphological evolution of a submerged artificial sandbar-beach system along the Zhejiang coast through scaled physical model experiments. The relationship between wave dynamics and beach profile evolution influenced by submerged artificial sandbars is investigated. This research contributes to a deeper understanding of the dynamic behavior of the submerged sandbar-beach system under diverse wave conditions and offers insights into the ecological conservation and restoration of coastal beaches in Zhejiang.
2 Materials and methods
Scaled dynamic bed tests have proven effective for simulating sandbar-trough system formation, beach evolution, and dune erosion under wave action (Vellinga, 1984; Kriebel et al., 1986; Grasso et al., 2011a; Yin et al., 2017; Pan et al., 2019). Consequently, this study employed a scaled dynamic bed flume experiment to examine the general characteristics of submerged artificial sandbar-beach surface evolution under regular wave conditions.
2.1 Experimental setup
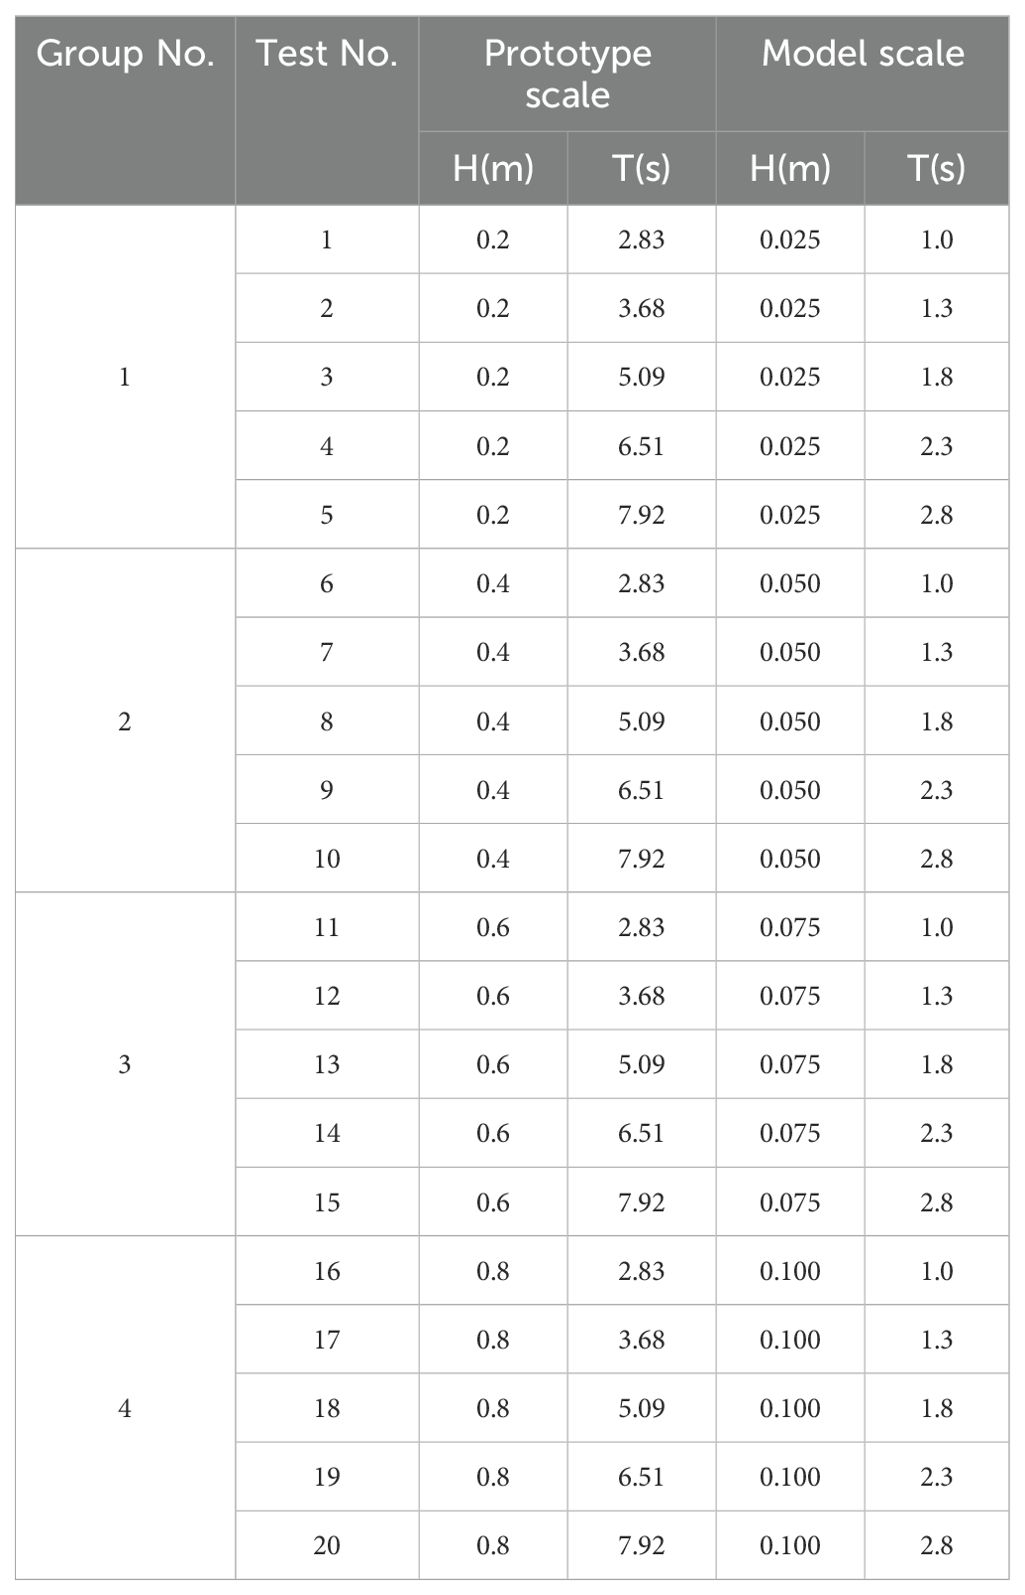
The experiment was conducted at the Liubao Experimental Base of the Zhejiang Institute of Hydraulics & Estuary, using a wave flume measuring 70 m in length, 1.2 m in width, and 1.7 m in height. The experimental setup is shown in Figure 1. The sandbar has a 1.0 m length, 0.5 m height, and a 1:2 slope on both the front and rear. The beach face is 0.8 m high with a 1:5 slope, supported by hard wooden boards at the back. To minimize the impact of the water flume width on test results, the water flume test section was divided, with the outer 0.5 m being used as the effective testing area. The flume floor consists of a concrete platform, 0.2 m high, 10 m long, and sloping at 1:20 at the front. The test area lies above this platform. Wave data were recorded using eight capacitive wave height gauges (W1-W8) at a sampling frequency of 50 Hz, with their layout shown in Figure 1. The entire experimental process was recorded by four DSLR cameras, positioned near the sandbar, trough, and beach face. Contour measurements were taken through image captures. Before each test, the model was manually restored to its initial profile. The tests generally lasted for 120 minutes, except in cases where erosion and deposition occurred rapidly. Evolution of the model was driven by regular waves, with 20 different wave height-period combinations tested, as detailed in Table 1. Based on marine hydrological data collected by Gong (2023) and Zhang (2021) in Zhejiang Province, the prototype wave’s effective wave height (H1/3) ranged from 0.2 m to 1 m, and the effective wave period (T1/3) ranged from 2 s to 8 s. Wave parameters for the experiments were designed accordingly (Table 1). The model uses the following coordinate system (Figure 1): the foot of the sandbar slope is the horizontal origin, wave propagation is along the positive X-axis, and the vertical upward direction is the positive Z-axis.

Figure 1. Schematic diagram of the flume model test setup. W1-W8 are capacitive wave height meters that are used to collect wave data.
2.2 Determination of scaling coefficients
The model sand selected for this study is lightweight walnut sand. To ensure similarity in sediment initiation, settling, and hydrodynamics between the prototype and the physical model, it is essential to satisfy the Froude number, Shields number, and Ross number. Based on the modified Shields curve by Soulsby (1997) and the falling velocity of non-spherical particles according to Van Rijn (1993), a proportional relationship that ensures similarity in sediment initiation, sedimentation, and Froude criteria was derived (Van Rijn, 1993; Soulsby, 1997; Yin et al., 2017; Pan et al., 2019). The initial relationship is given by:
where ψc is the critical Hertz number, D* is the size parameter of a dimensionless particle, D is the particle size of a sediment particle, ωS is the settling velocity of a sediment particle, ρs is the dry density of sediment particles, ρ is the density of seawater, s=ρs/ρ, v is the viscosity coefficient of water body motion, g is the gravitational acceleration, τmc is the critical shear stress amplitude at the bottom, τmc=0.5ρfwU2mc, where fw is the wave friction coefficient and Umc is the critical trajectory velocity amplitude at the bottom.
Using Jonsson (1980) theory, the wave friction coefficient is calculated as:
where amc represents the maximum motion amplitude of the bottom water particle.
For this experiment, the natural and model sand materials are within the sediment particle size range of 0.1-0.5 mm, and the dry density range of sediment is 1.2-2.65. Within these ranges, Equations 1, 4 were numerically fitted (Pan et al., 2019; Cong et al., 2023a), resulting in the following expressions:
According to the wave similarity criterion, λUmc=√λh,λamc=λL, where λL represents the geometric scale.
By combining these formulas, the sediment initiation and settling ratio relationship for the sediment particle size range of 0.1 mm to 0.5 mm and dry density range of 1.2-2.65 is derived.
In the experimental simulation, Froude similarity must also be satisfied, which requires λω=λ0.5L.
Due to the limitations of the water tank test platform, the geometric scale used in this study is 8:1. Based on this, the value of λ(s-1) is calculated to be 7.2:1. With a natural sand density of 2.65, the model sand density is calculated to be 1.23. Based on research on the particle size characteristics of beach sediments in Zhejiang (Gong, 2023; Zhang, 2021), the D50 for the prototype sand is determined to be 0.2 mm, and the model sand particle size is calculated to be 0.27 mm. After multiple attempts, walnut shell sand with a particle size of 0.25 mm (s=1.2-1.3) was selected. After soaking and stabilizing, the dried walnut sand reaches an approximate particle size of 0.27 mm.
2.3 Data analysis
The images obtained are first preprocessed through cropping and correction Single-pixel marker points are then used to delineate the contours of the cross-section in each image. Origin data processing software is employed to extract the pixel coordinates of these marker points. Finally, these pixel coordinates are converted into the actual coordinate system and plotted as a graph.
In wave data analysis, each test utilized over 10,000 sampling points with a sampling frequency of 50 Hz. By analyzing the statistical characteristics of wave height and performing spectral analysis, the significant wave height Hs was determined. The formula used is as follows:
where m0 represents the zero-order moment of the spectrum.
The wave reflection coefficient Kr is derived by separating the amplitudes of the incident and reflected waves using the two-point method proposed by Goda and Suzuki (1977). This analysis is based on wave data collected from W3 and W4 wave height meters. The following formula was used for calculation:
where N is the total number of samples, and ai and ar denote the amplitudes of the incident wave and reflected wave, respectively.
As waves propagate towards the shore, the water depth decreases, leading to changes in waveforms and, in some cases, nonlinear phenomena such as wave breaking. The nonlinearity of the waves can be quantified by the skewness (Sk) and asymmetry (Asy) of the waveforms, which is as follows:
where η is the elevation of the free wave surface, ˉη is the corresponding average value, and ℋ represents Hilbert transform.
3 Results
3.1 Wave propagation characteristics
Spectral analysis of the collected wave data was performed to examine the variation in effective wave height along the wave propagation path (Figure 2). The figure illustrates that, as waves pass through the sandbar towards the seaward side, the effective wave height slightly decreases. Subsequently, due to the shallower water depth, wave shape deforms, and local wave heights increase. As the wave height reaches a critical level, it begins to decay again. This phenomenon is more pronounced for smaller input wave heights (H=0.025 m, H=0.05 m). In contrast, when the input wave height is larger (e.g., H=0.075 m, H=0.100 m), the fluctuation amplitude of the effective wave height in the area seaward of the sandbar is more significant, indicating stronger interactions between waves and the sandbar. Particularly for shorter periods, effective wave heights increase when waves reach the seaward side of the sandbar and decay rapidly after passing through it. This is due to the larger wave energy and the erosive effect of the sandbar, which leads to significant sediment deposition near the shore, causing a higher wave water level. Notably, Test19 (H=0.100 m, T=2.3 s) and Test20 (H=0.100 m, T=2.8 s) exhibit distinct wave characteristics, with a marked increase in wave height on the shoreward side of the sandbar. This may be attributed to wave reflection caused by the thicker sedimentation at the beach slope angle.
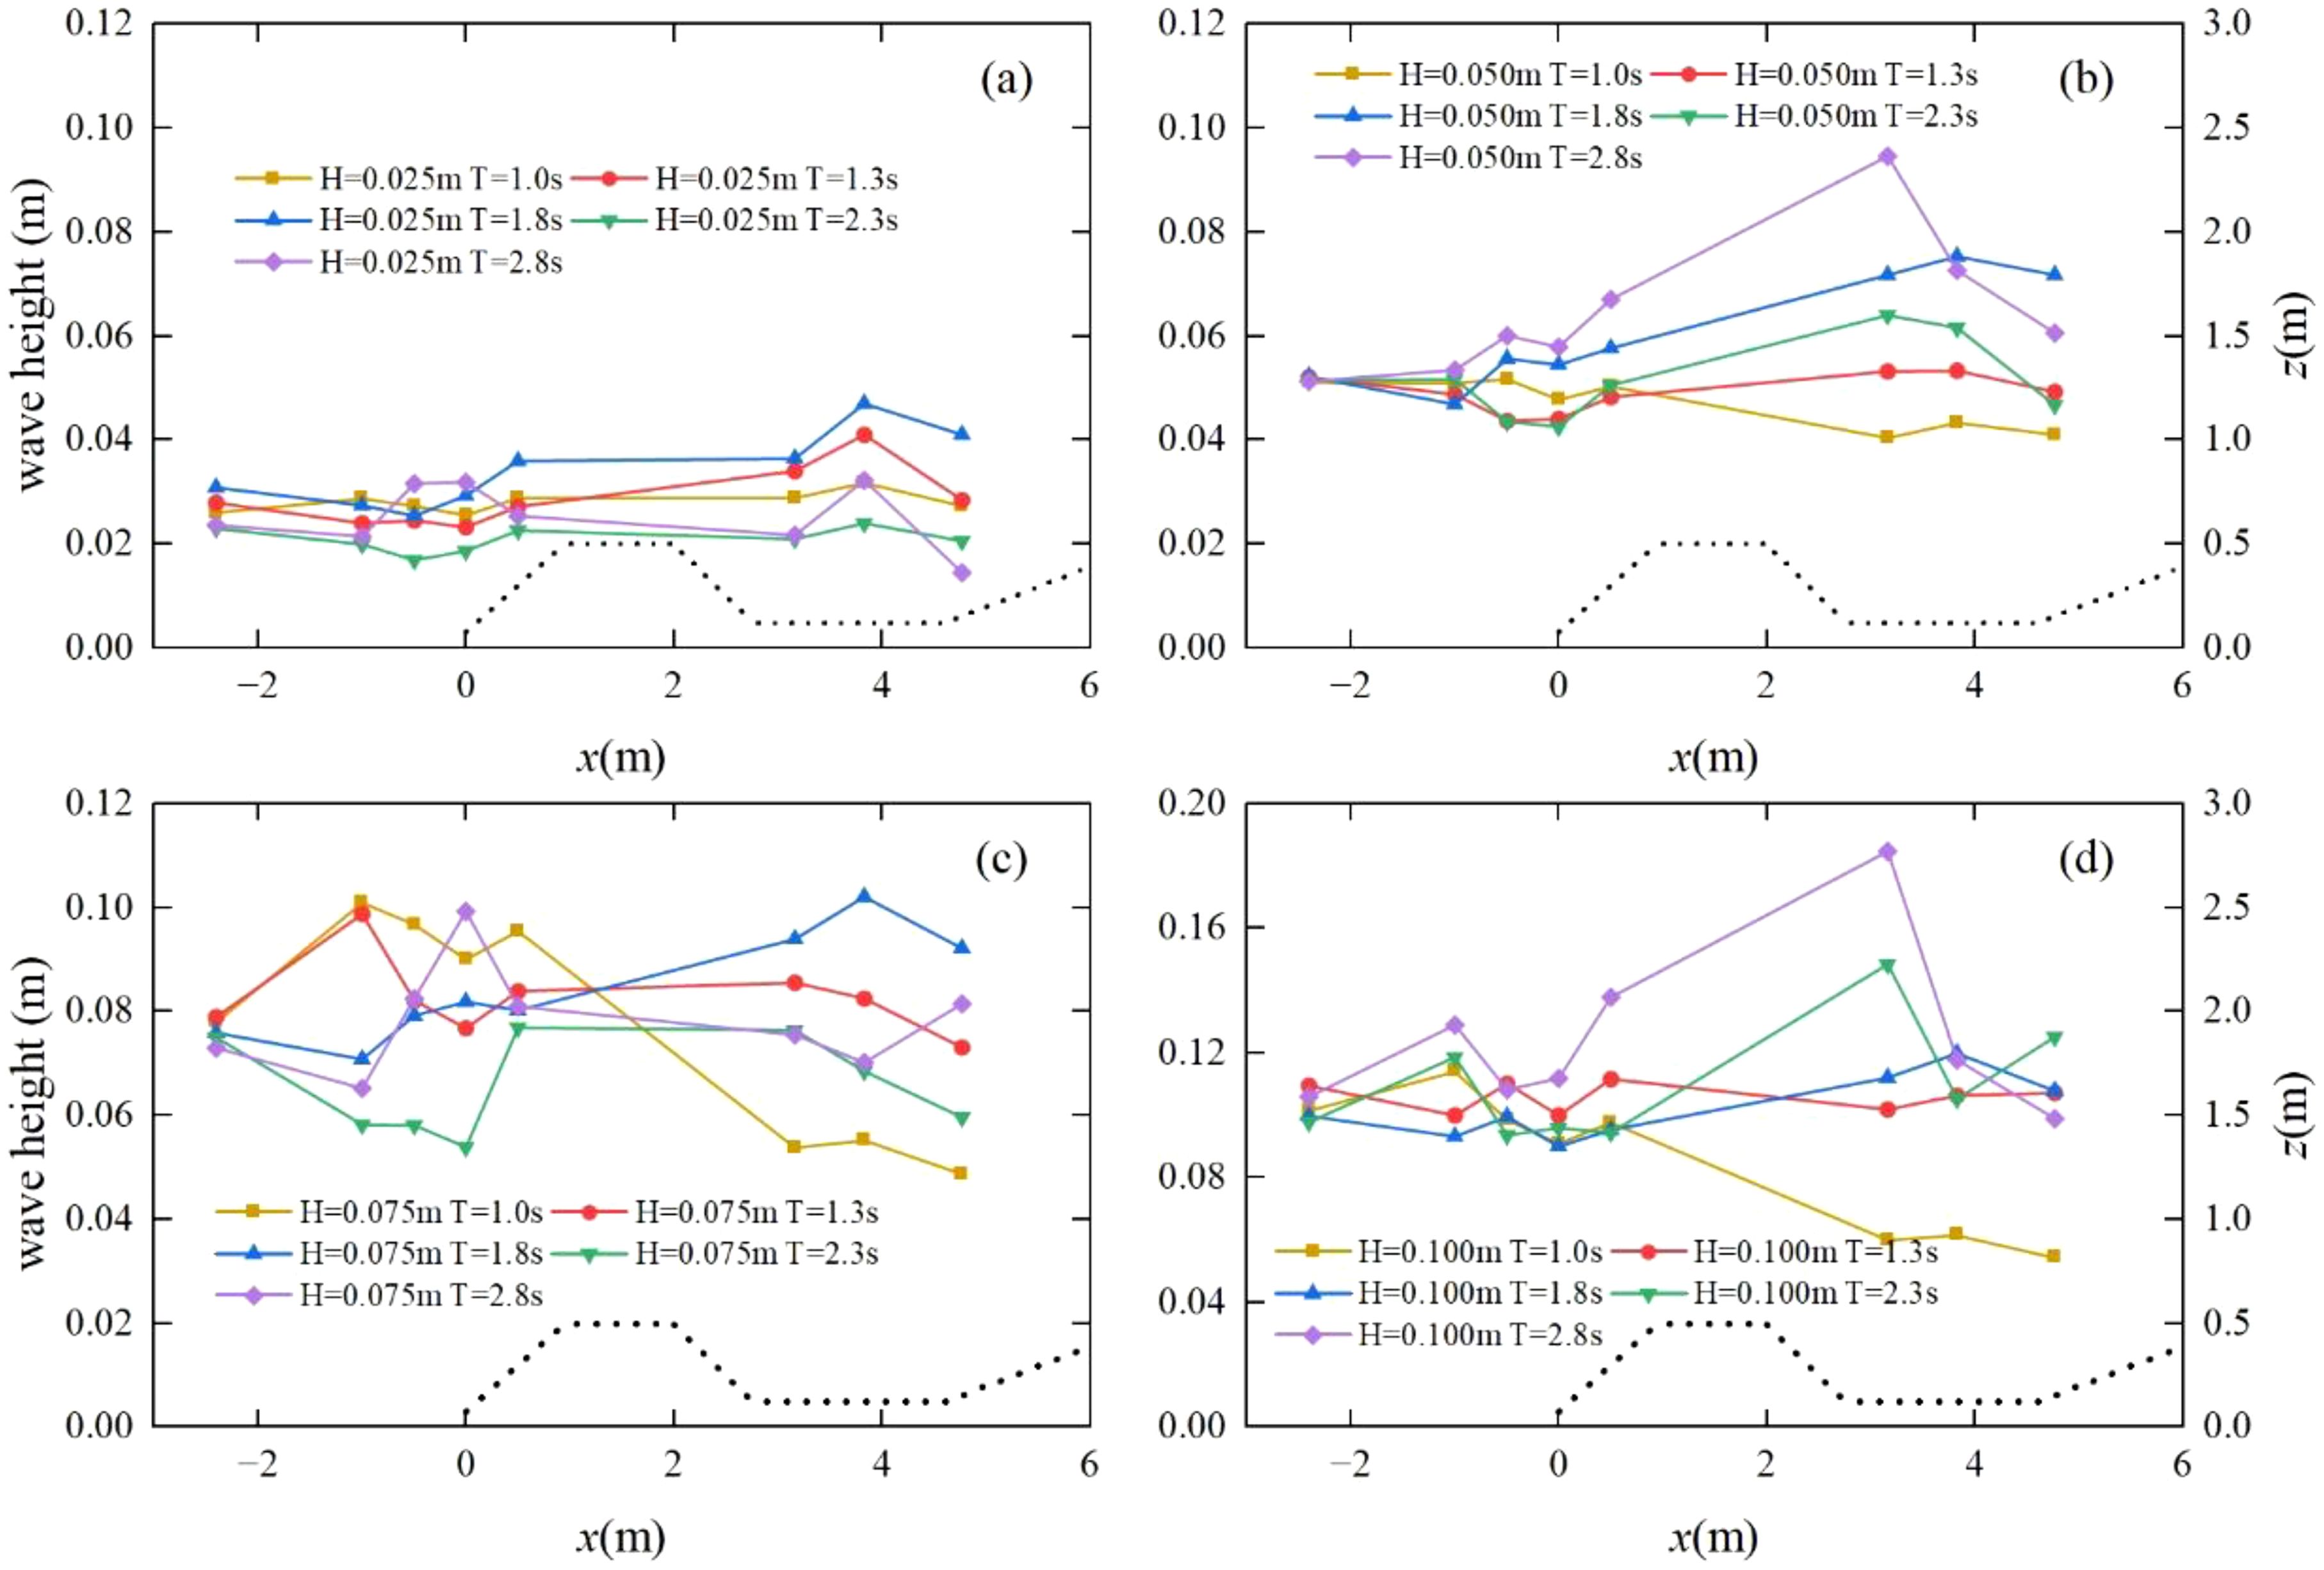
Figure 2. Effective wave height varies along the way. Panels (A–D) show Groups 1-4, with incident wave heights H of 0.025 m, 0.050 m, 0.075 m, and 0.100 m, respectively. The four periods T are 1.0 s, 1.3 s, 1.8 s, 2.3 s, and 2.8 s, respectively.
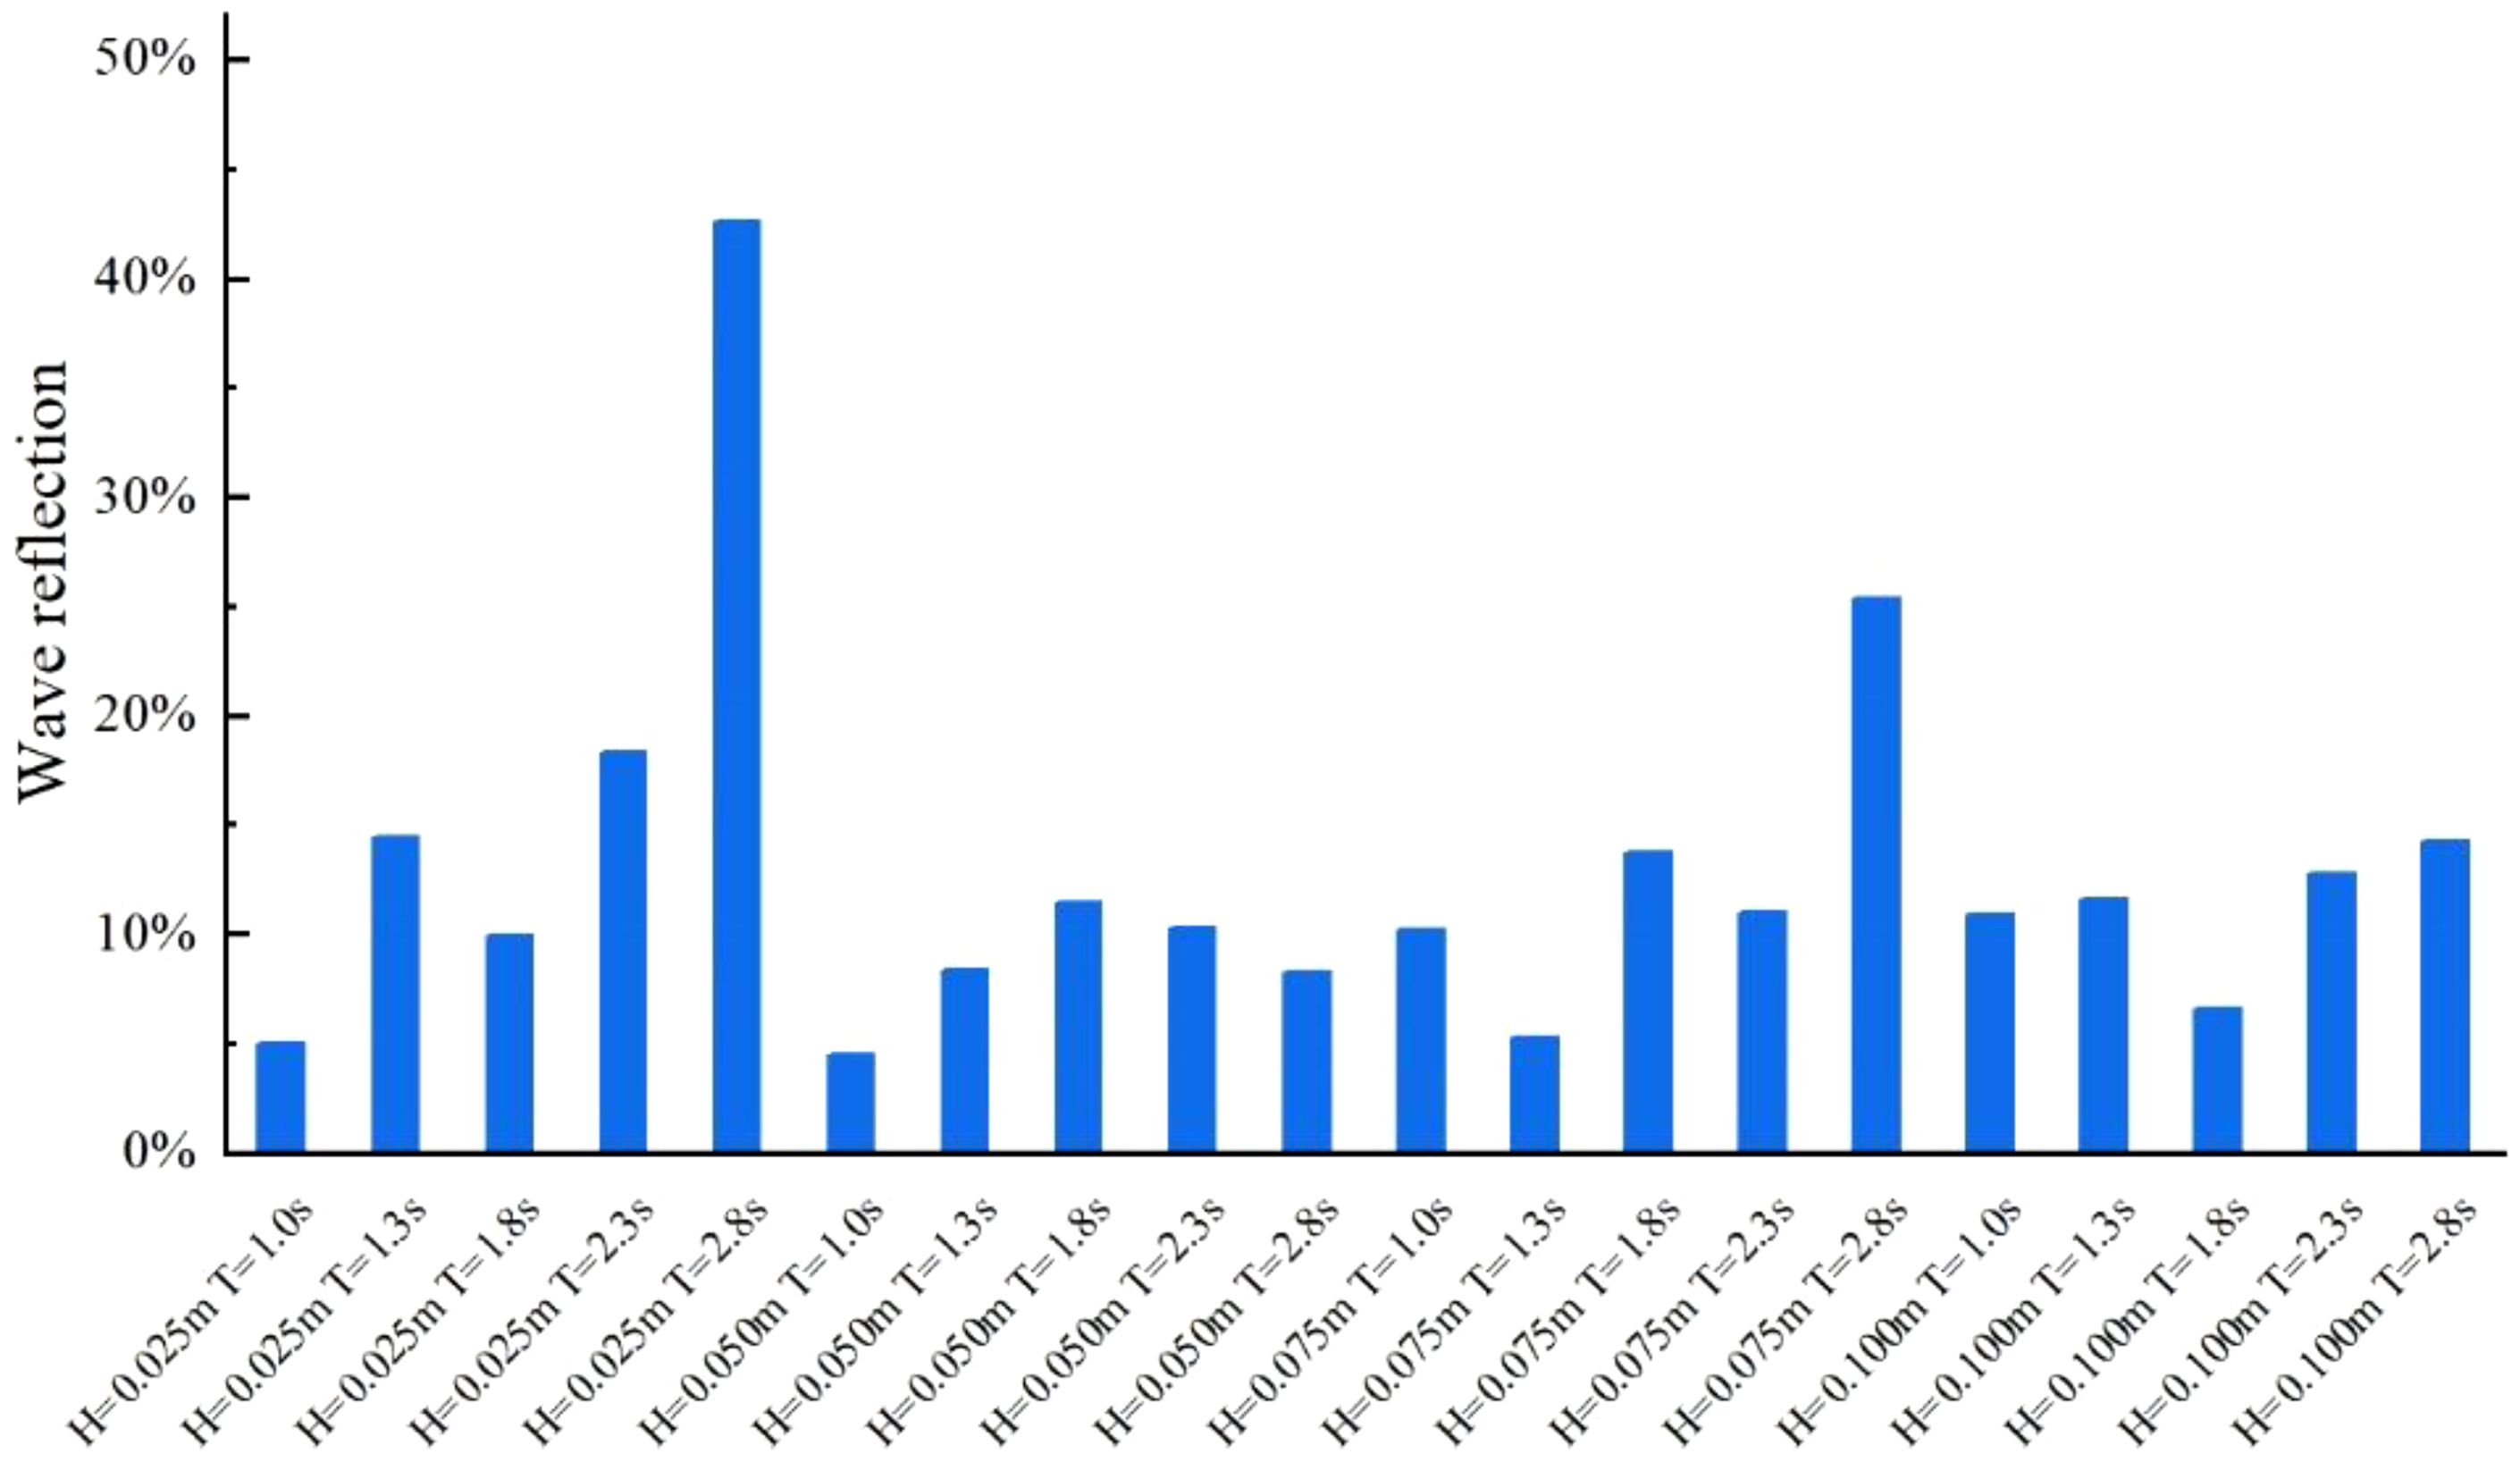
Figure 3 presents the wave reflection coefficient in front of the sandbar. Overall, the wave reflection coefficient is relatively low, with an average reflectivity of approximately 10%, consistent with the findings of Pan et al. (2022b) on the effects of submerged sandbar models. When the input wave height is small (H=0.025 m), the wave reflection coefficient tends to be higher than that in other cases. This is because wave reflection strength is closely linked to the shape of the sandbar profile. At H=0.025 m, the erosion of the seaward sandbar crest and the minimal sedimentation thickness of the shoreward sandbar crest result in higher wave reflection. In contrast, for groups 2, 3, and 4 (H ≥ 0.025 m), the irregular and undulating profile shapes (as observed in the following section) lead to partial dissipation of wave energy, thereby reducing the overall reflection.
Wave skewness and asymmetry are critical in characterizing wave shapes, playing a key role in understanding and predicting nonlinear wave propagation and coastal sediment transport. Figures 4, 5 illustrate wave skewness and asymmetry, respectively. Figure 4 shows that at larger periods, the fluctuations in wave skewness amplitude become more pronounced. Notably, wave deviation at W6 is significant, likely caused by shallow deformation or wave breaking. The skewness curve remains stable from W1 to W5, then increases rapidly between W5 and W6, reaching a peak at W6 before sharply decreasing between W6 and W7, and fluctuating again from W7 to W8. These changes are especially evident when the incident wave height is small (H ≤ 0.050 m), particularly at H = 0.025 m. Experimental videos show that most experiments in groups 3 and 4 experienced wave overshoot. Waves climbed up the beach face, crossing its peak (0.8 m high at x = 8 m), and collided with a hard wooden board behind. This scenario resulted in both reflection and backflow, causing significant fluctuations in wave skewness. The wave asymmetry (Figure 5) displays chaotic behavior, with smaller amplitudes compared to the skewness, resembling phenomena observed by Cong et al. (2023b) in the sandbar lagoon system.
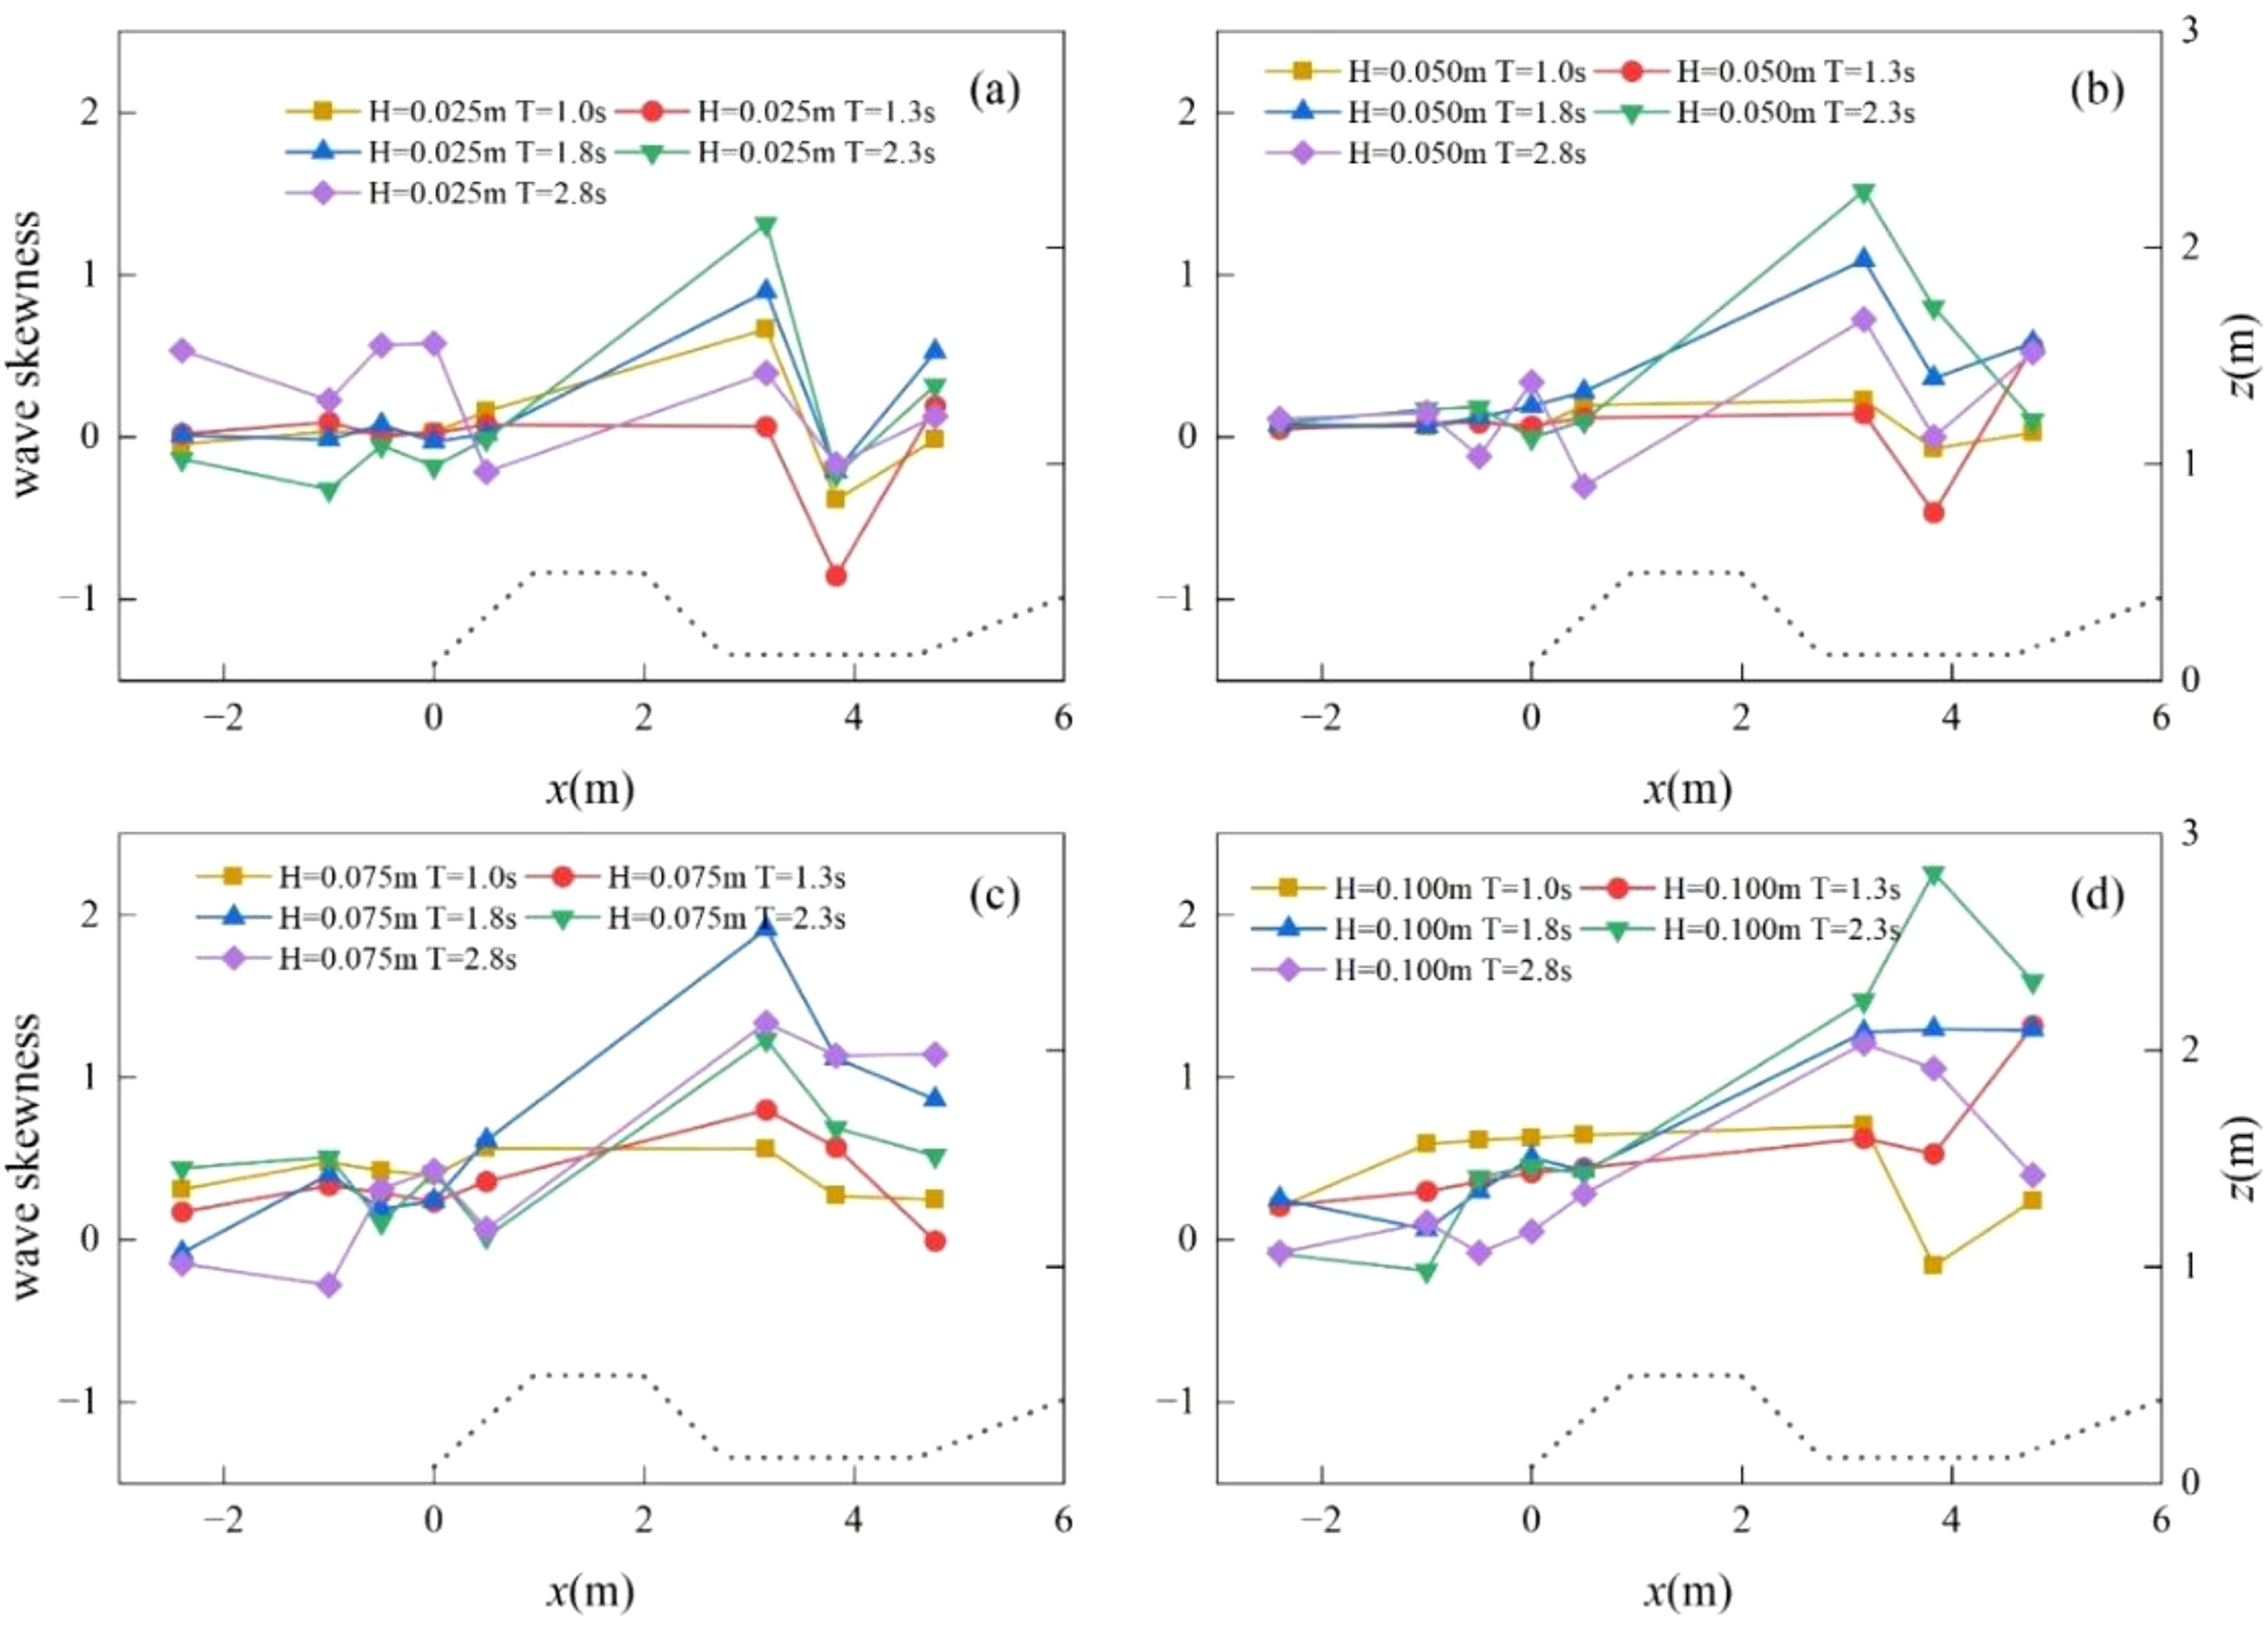
Figure 4. Wave skewness variation along the way. Panels (A–D) show Groups 1-4, with incident wave heights H of 0.025 m, 0.050 m, 0.075 m, and 0.100 m, respectively. The four periods T are 1.0 s, 1.3 s, 1.8 s, 2.3 s, and 2.8 s, respectively.
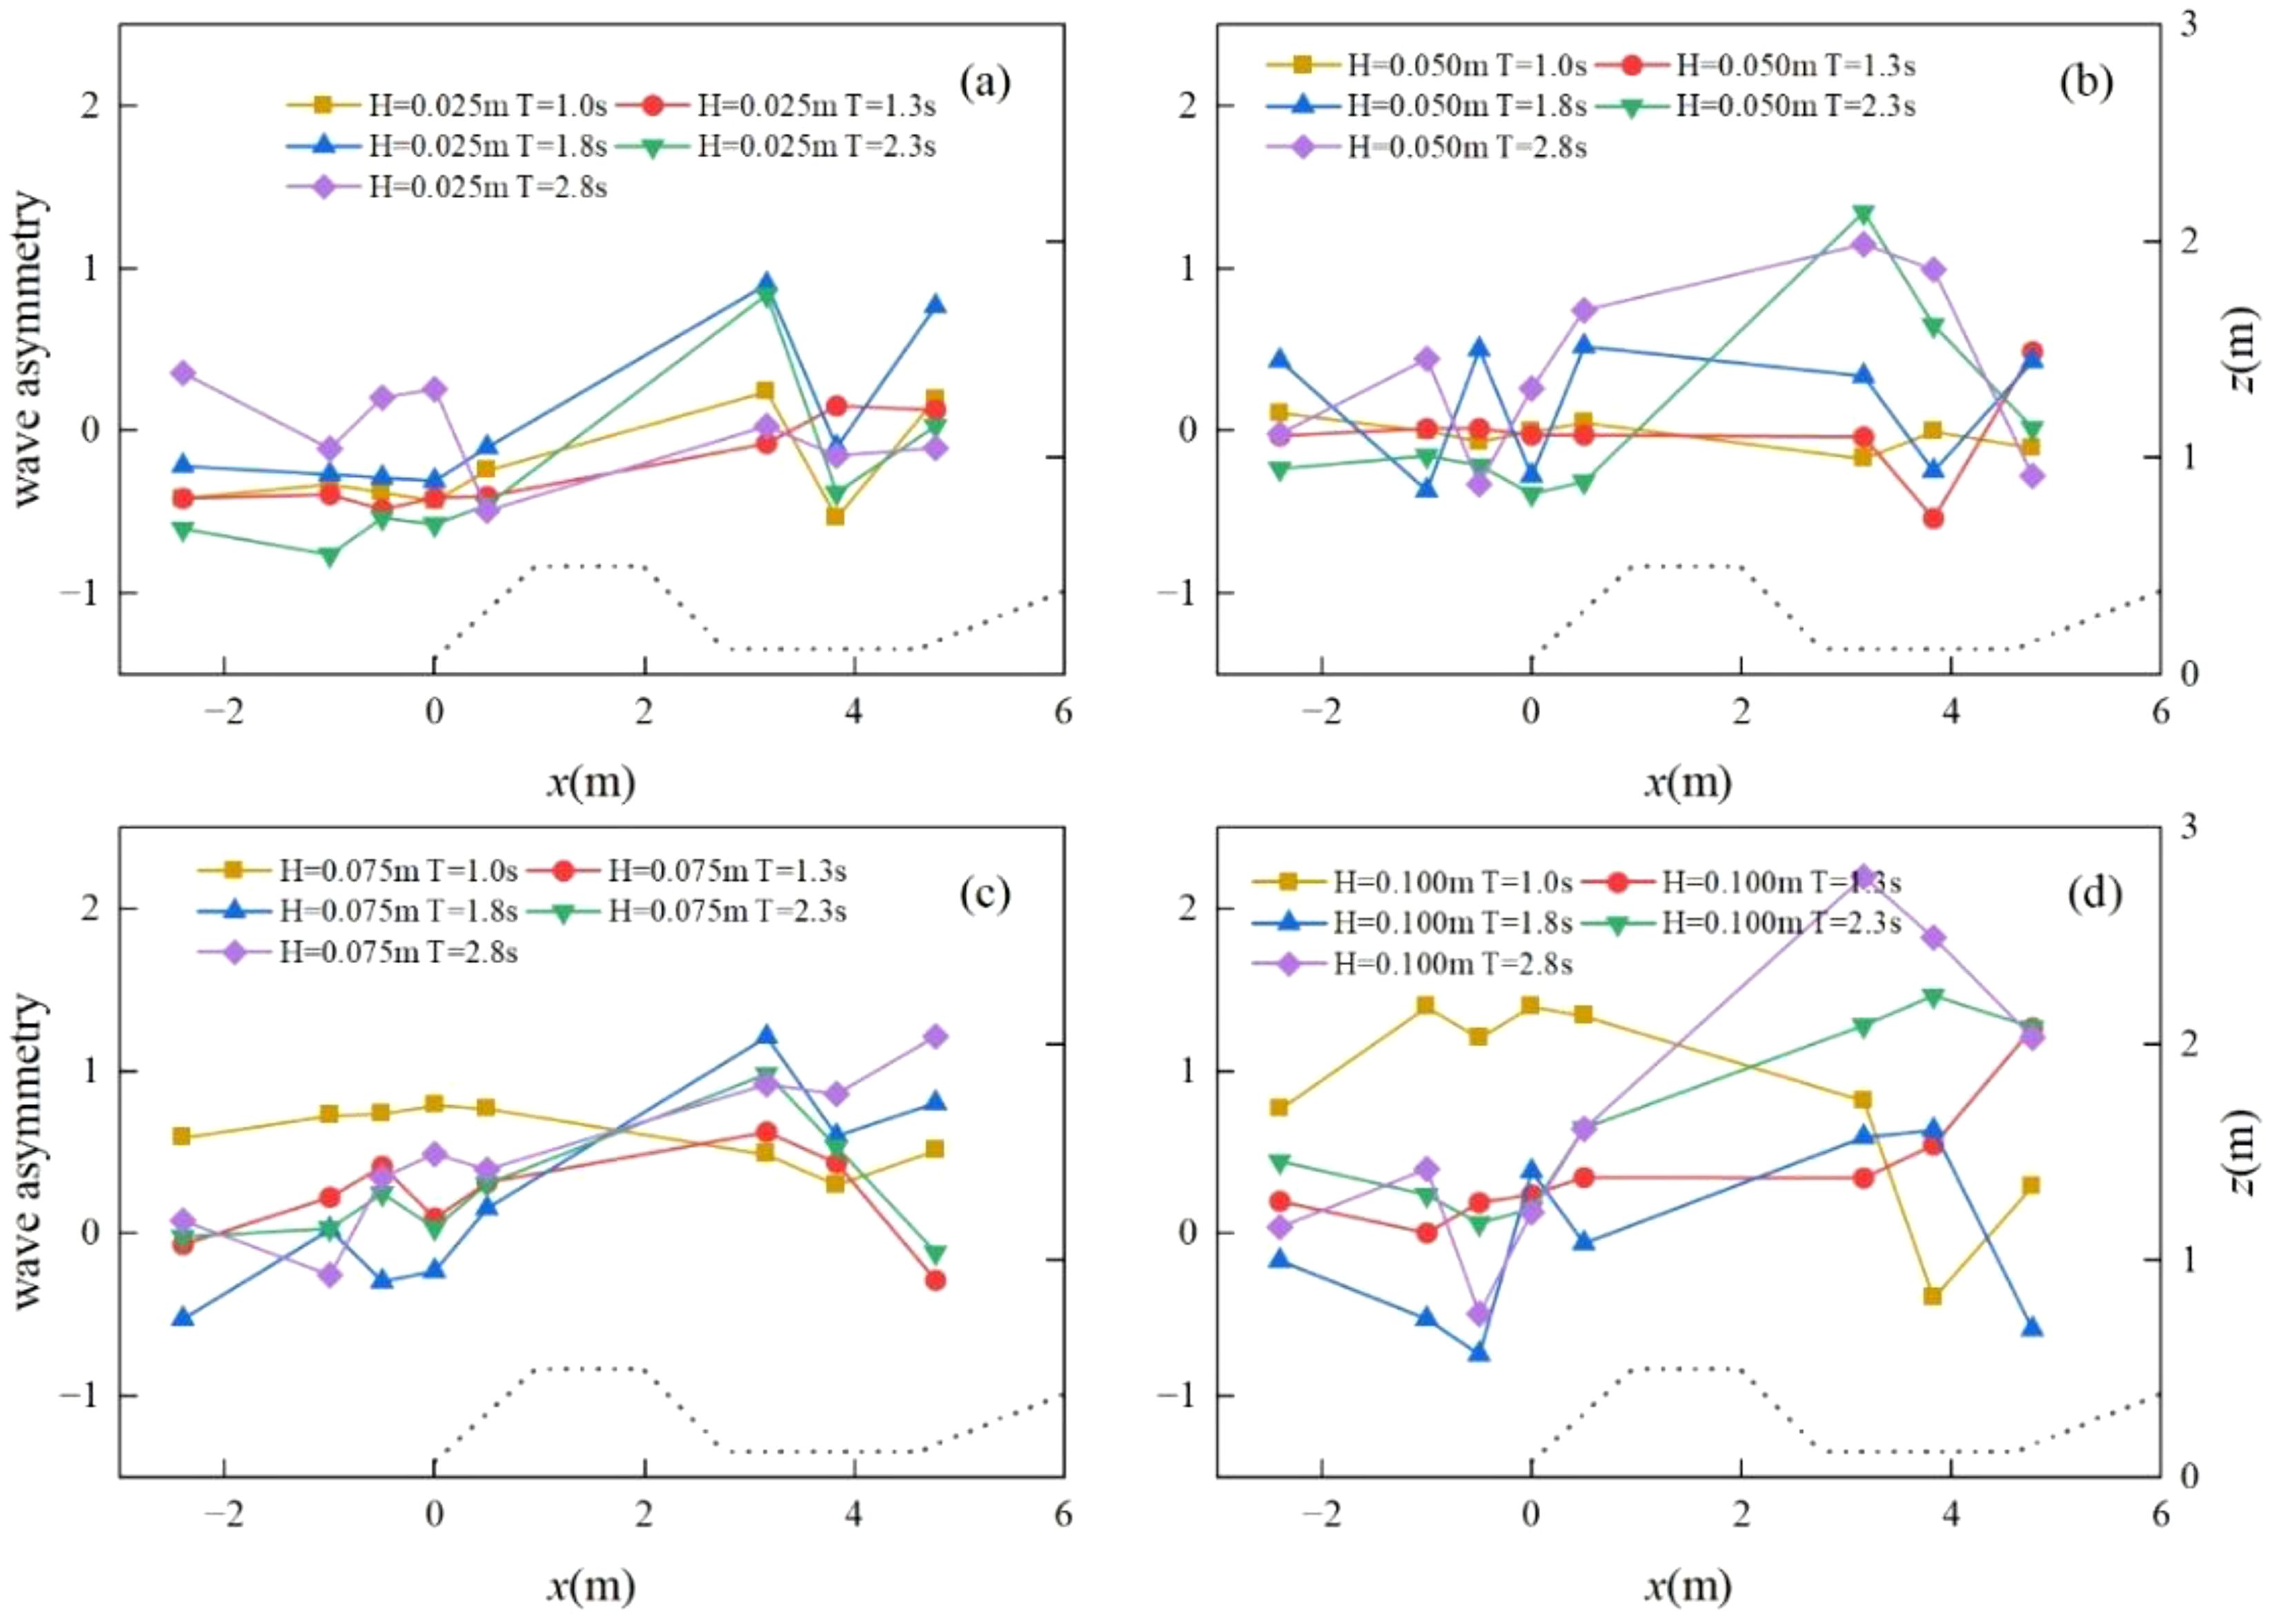
Figure 5. Variation in wave asymmetry along the path. Panels (A–D) show Groups 1-4, with incident wave heights H of 0.025 m, 0.050 m, 0.075 m, and 0.100 m, respectively. The four periods T are 1.0 s, 1.3 s, 1.8 s, 2.3 s, and 2.8 s, respectively.
3.2 Cross-shore profiles evolution
To further investigate the impact of wave height and period on profile evolution, Figures 6 and 7 show the final profiles of the model under different conditions: the same wave height but varying periods, and the same period but varying wave heights. As wave height and period increase, more noticeable dynamic changes occur, including intensified erosion of sandbars and beach faces, along with continuous deposition in troughs.
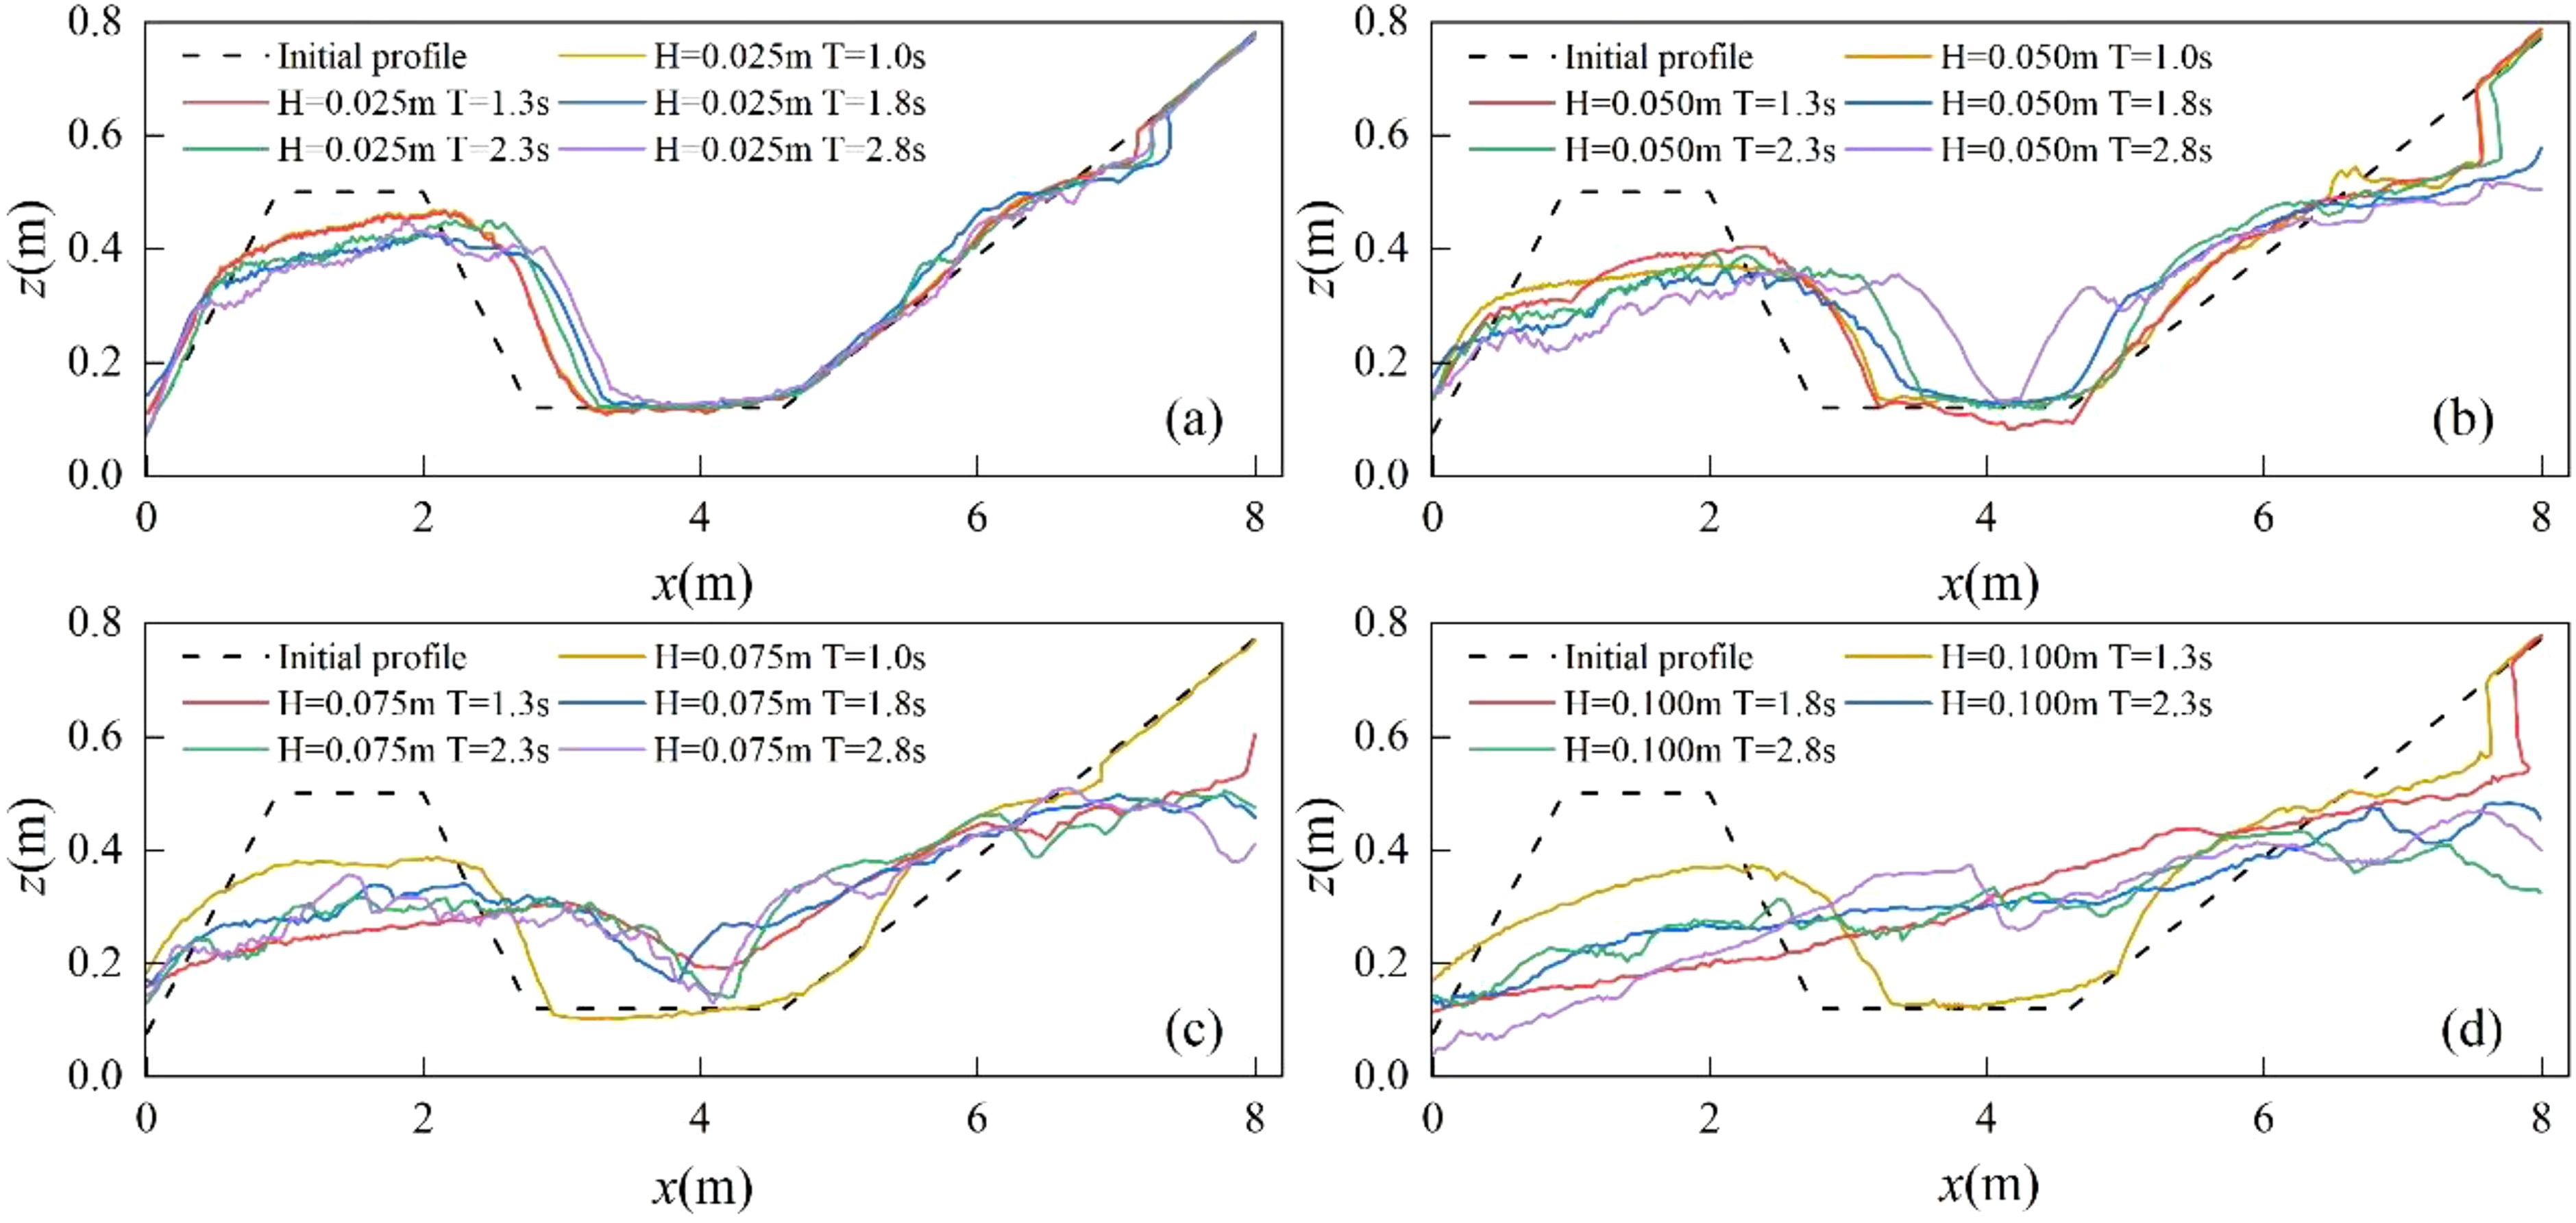
Figure 6. Profile variation. Panels (A–D) show Group No. 1-4, with incident wave heights H of 0.025 m, 0.050 m, 0.075 m, and 0.100 m in order, and all four periods T of 1.0 s, 1.3 s, 1.8 s, 2.3 s, and 2.8 s, respectively.
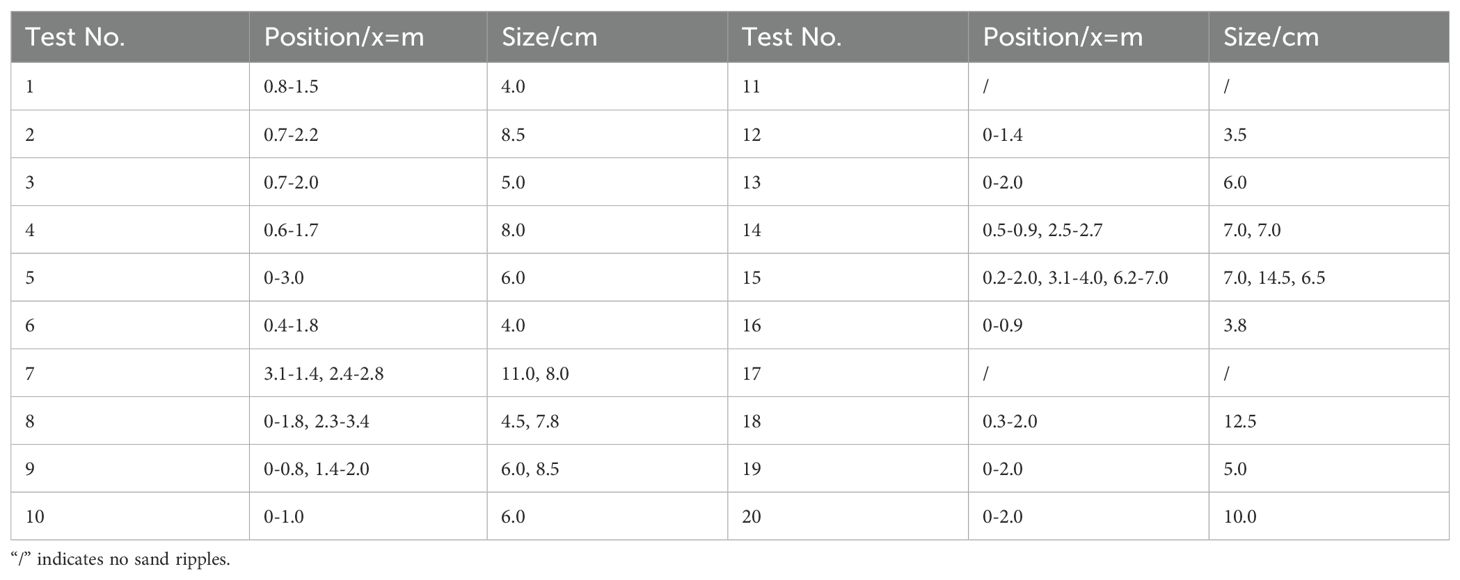
Figures 6A–D display model profiles under constant wave height but different periods (a, H = 0.025 m; b, H = 0.050 m; c, H = 0.075 m; d, H = 0.100 m), illustrating how period influences profile evolution. The data show that, with constant wave height, longer periods significantly promote the evolution of submerged sandbars. Additionally, increasing the period makes the profile more tortuous and irregular. As wave height increases, the profile evolves more intensely and becomes increasingly irregular. At lower wave heights (H ≤ 0.050 m), the submerged sandbars maintain noticeable “symmetry,” with relatively minor erosion and sedimentation on the beach face, especially at H = 0.025 m. At higher wave heights (H ≥ 0.075 m), the top of the submerged sandbar shifts landward due to sediment transport towards the shore, causing the sandbar’s contour to become more asymmetric, with a steeper incline toward the shore and a gentler slope toward the sea. The sediment thickness at the beach slope angle also increases. During testing of the H = 0.100 m group, the high wave energy caused significant sediment transport from the submerged sandbar to the shore, filling the trough with sediment and creating a smoother, more continuous profile. Interestingly, numerous sand ripples appeared at the top of the submerged sandbars, indicating more complex hydrodynamic actions at the sandbar top. To investigate the formation of sand ripples, the frequency and size (length) of sand ripples were recorded for each test (Table 2; Figure 7). Sand ripples appeared in nearly all tests except Test 11 and Test 17, concentrating at the sandbar. The formation of sand ripples depends heavily on wave breaking and water flow-induced transport of surface sediment (Ma, 2016). Waves over the sandbar are prone to shallow-water deformation and breakage, driving the laminar movement of surface sediments.
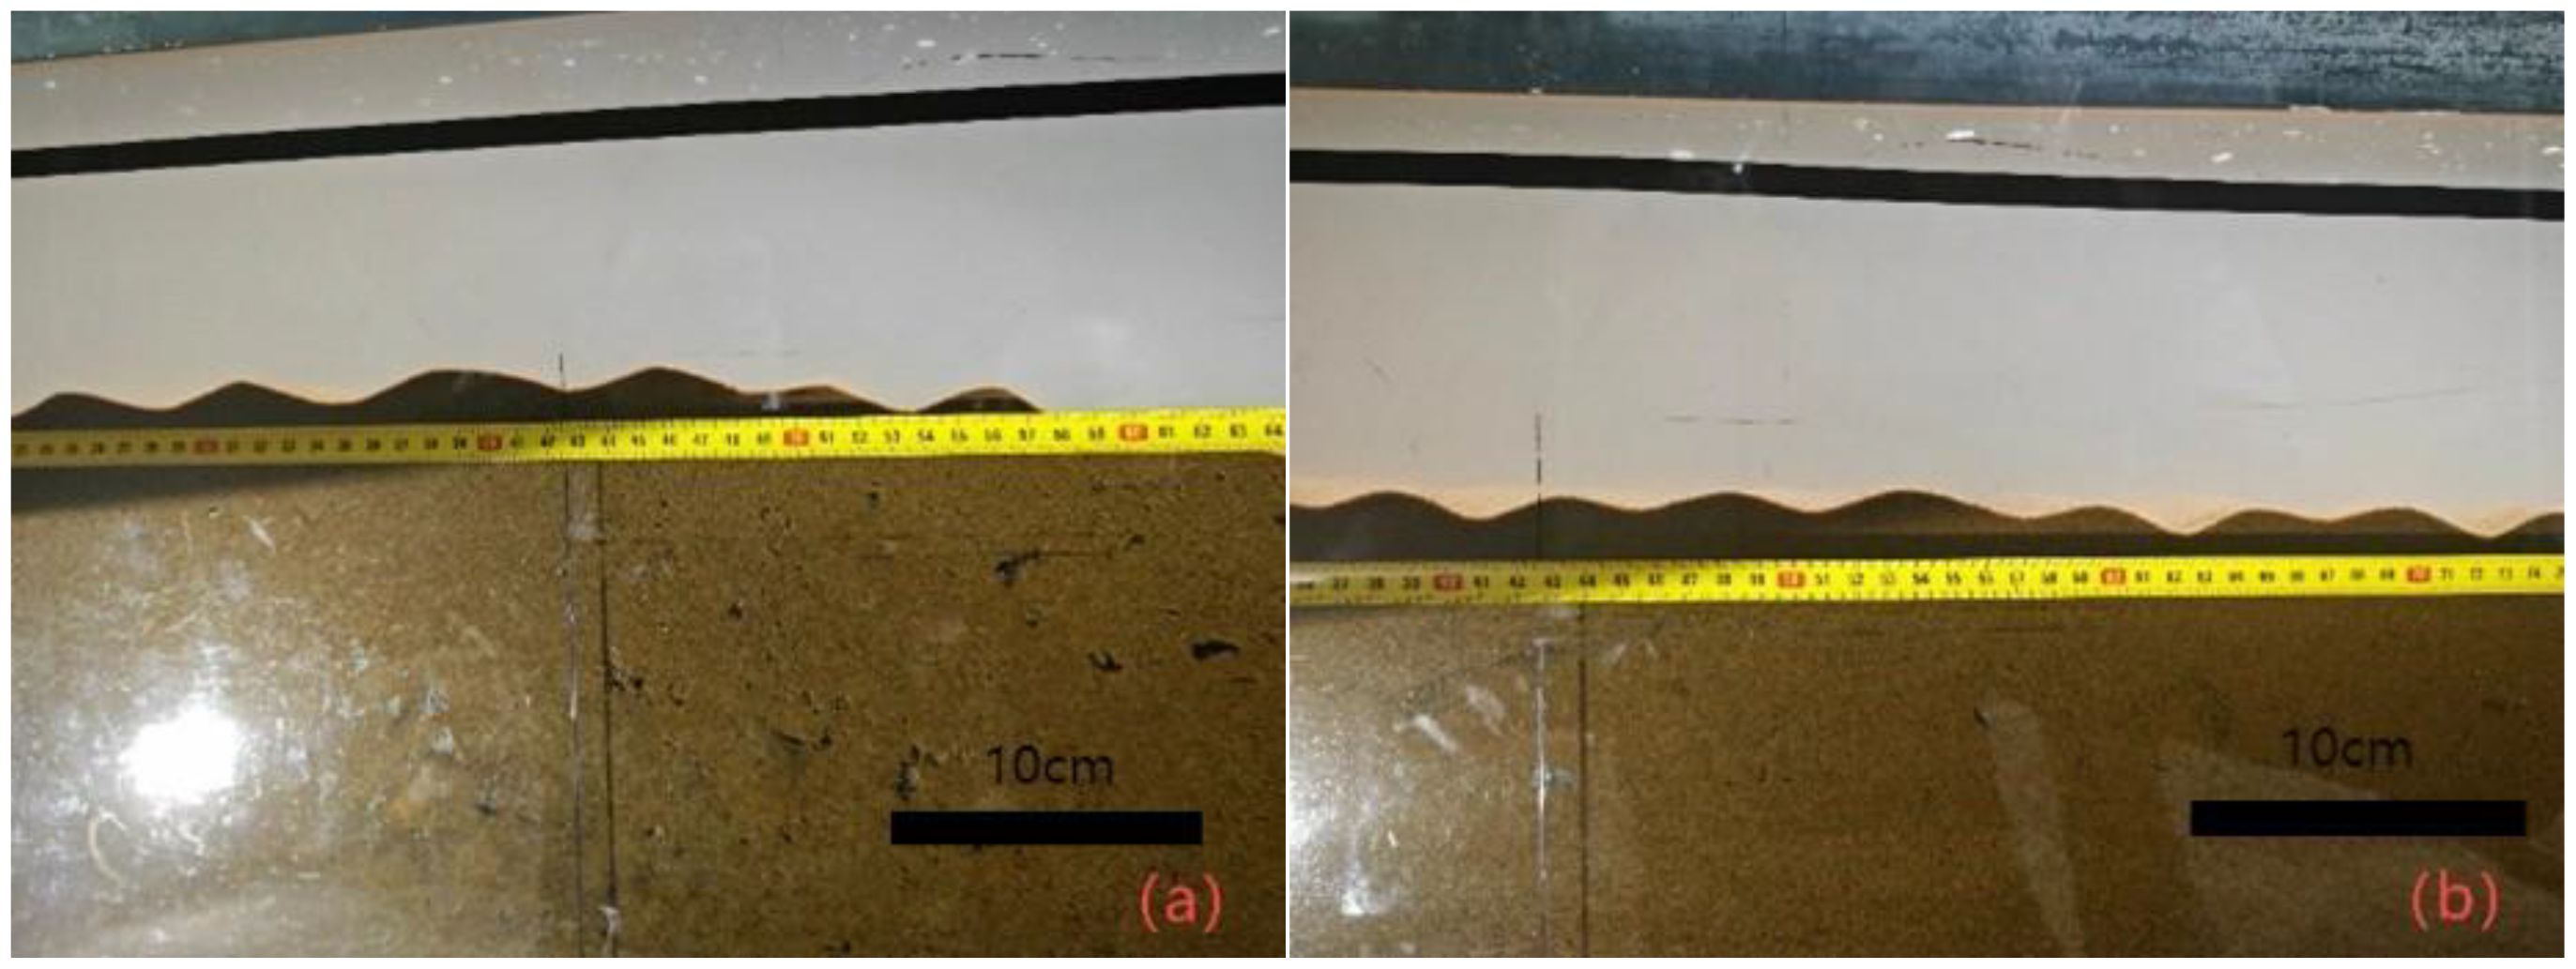
Figure 7. (A, B) Example photo of sand ripples. The black short lines in the image represent the scale.
Figures 8A–E show the final profiles of the model under different wave height conditions with the same period (a, T=1.0 s; b, T=1.3 s; c, T=1.8 s; d, T=2.3 s; e, T=2.8 s), highlighting the influence of wave height on profile evolution when the period is constant. It is evident that increasing wave height primarily reduces the top height of the submerged sandbar. For periods up to T ≤ 1.3 s, the sandbar profile exhibits typical asymmetric changes. For periods T ≥ 1.8 s, the profile undergoes significantly larger changes, with greater amplitude in the submerged sandbar compared to those at T=1.0 s and 1.3 s. The increase in period significantly enhances sediment transport along the shore, resulting in a more tortuous profile. Notably, in some cases, such as Test5 and Test10, two peaks form at the sandbar crest, which may be attributed to rolling waves (Section 4.4 for further explanation).
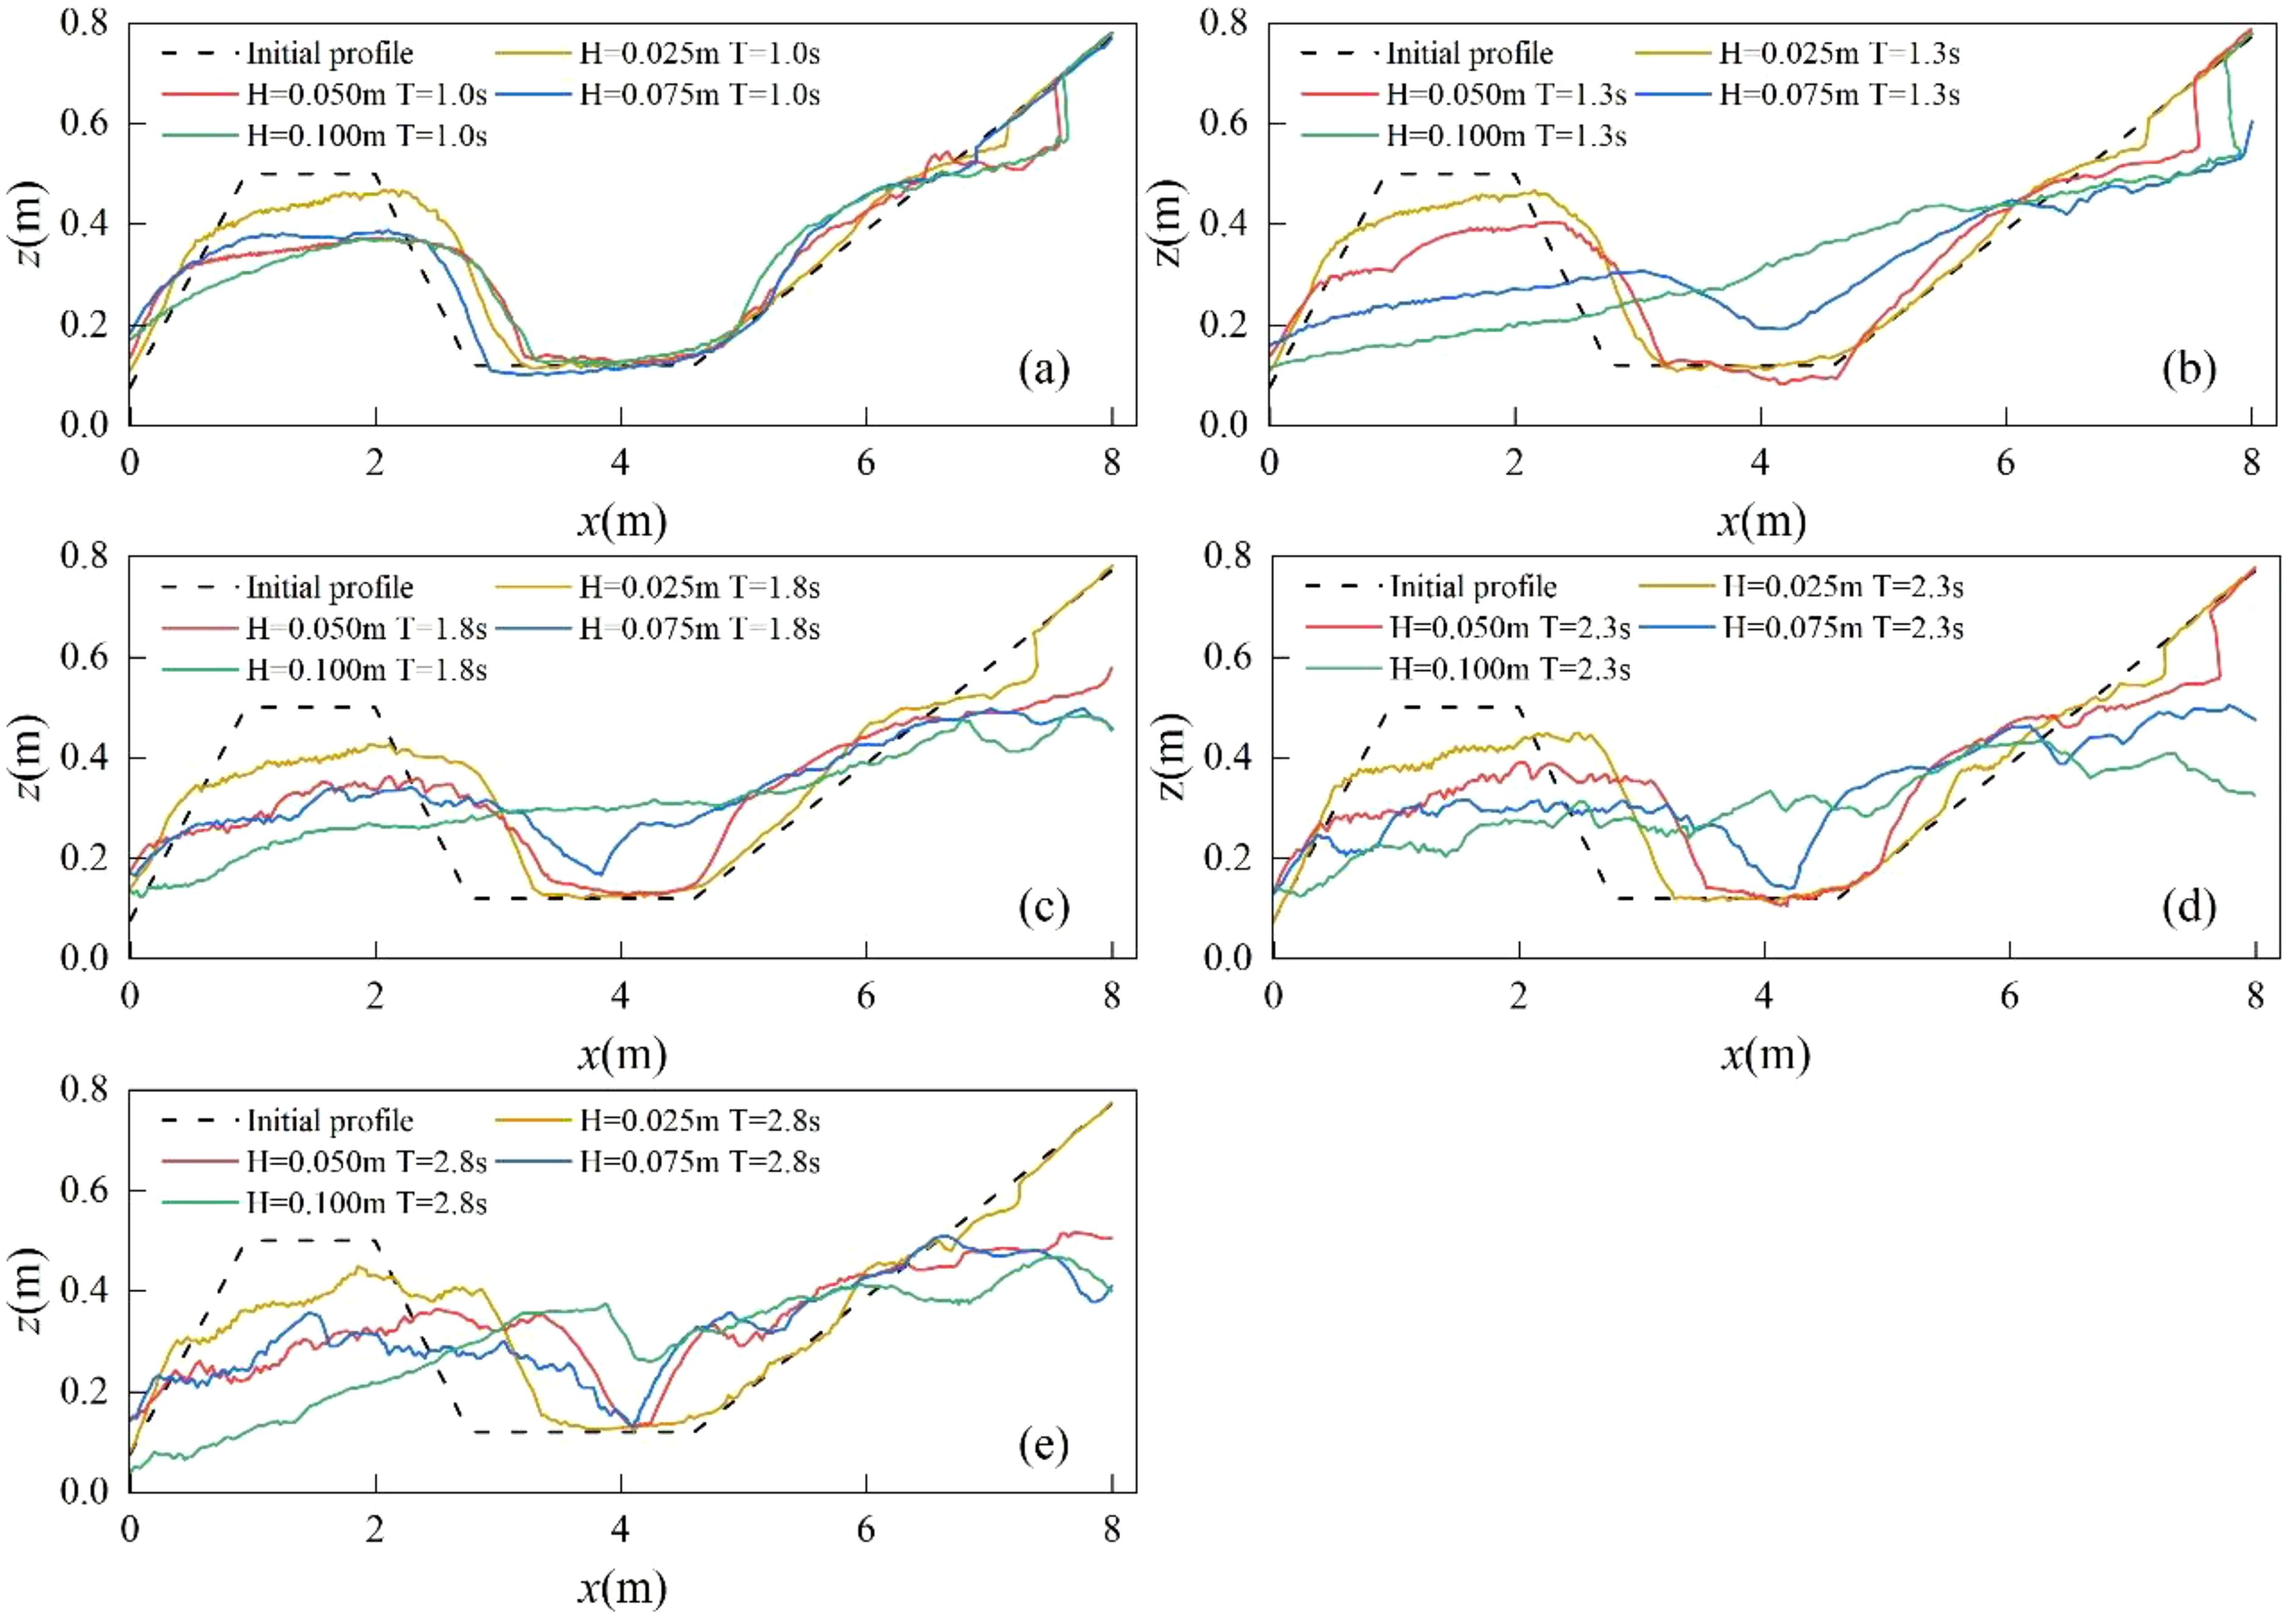
Figure 8. Profile changes. Panels (A–E) show the incident wave periods T are 1.0 s, 1.3 s, 1.8 s, 2.3 s, and 2.8 s, respectively. The four wave heights H are 0.025 m, 0.050 m, 0.075 m, and 0.100 m, respectively.
To quantitatively assess the effects of wave height and period on profile topography evolution, the maximum sedimentation and erosion thicknesses of sandbars, troughs, and beach faces were calculated, as shown in Figure 9. Overall, the maximum sedimentation thickness in sandbars exceeds the maximum erosion thickness. For groups 1 to 4, the maximum sedimentation thickness ranges from 0.08 to 0.38 m, while the maximum erosion thickness ranges from 0.11 to 0.28 m, with an increasing trend in sedimentation and a decreasing trend in erosion. Sedimentation is primarily concentrated on the shoreward side of the sandbar, with minor sedimentation observed at the seaward slope, where thickness remains small. Erosion predominantly occurs at the sandbar crest, particularly on the seaward side. This is due to increased wave height, which transfers more energy to the area above the sandbar, where waves break, causing energy dissipation and sediment transport to the trough. Continuous erosion of the sandbar crest leads to the deposition of suspended sediment on the seaward slope. In most cases, the trough is fully sedimented, with only a few instances of local erosion, particularly with shorter periods. Short-period waves are more likely to break, generating downward scouring currents that erode the sandbar shoreward. For the beach face, both maximum sedimentation and erosion thicknesses increase with wave height. This is because higher wave energy is transferred to the beach face, intensifying erosion and increasing sediment transport offshore to the trough, which also raises the sediment thickness at the beach face’s slope.
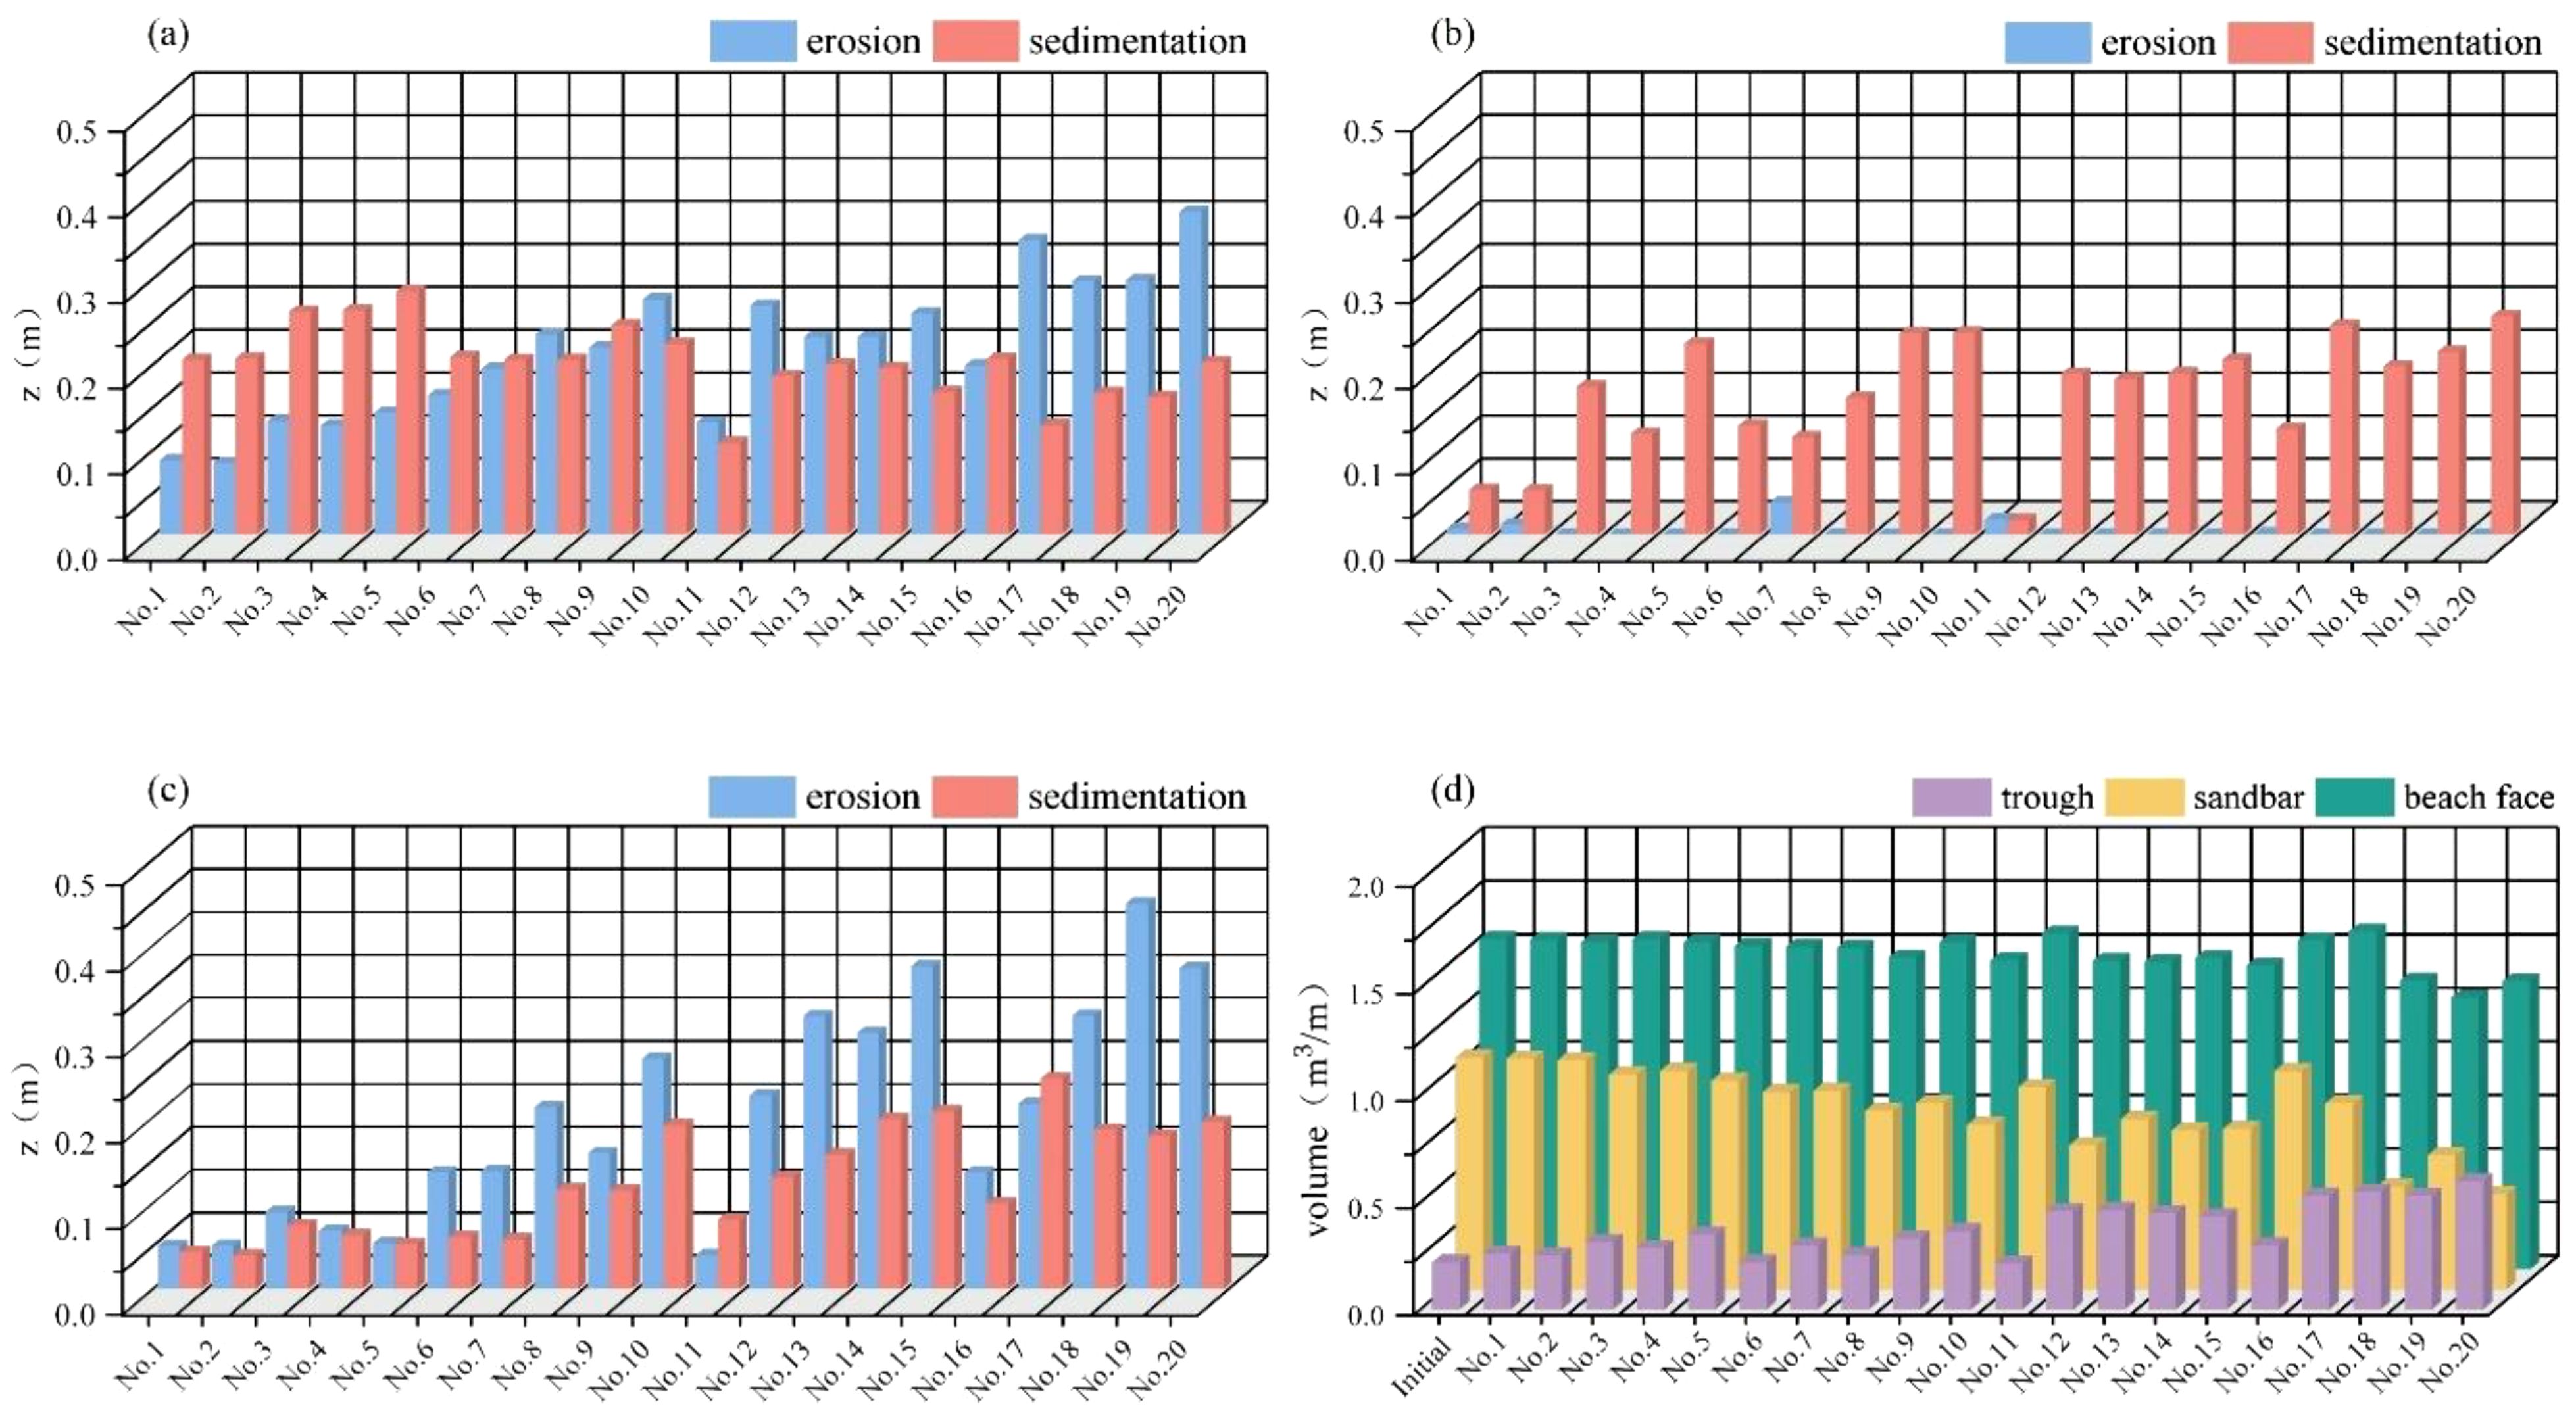
Figure 9. Maximum erosion, sedimentation thickness, and volume per unit width of sandbars, trough, and beaches. Panels (A–C) show the maximum erosion and sedimentation thickness of sandbars (x=0-2.76), trough (x=2.76-4.6), and beach face (x=4.6-8.0), respectively. Panel (D) shows the volume per unit width of sandbars, trough, and beach face.
The single-width volume of each region, calculated and shown in Figure 9D, reveals a consistent trend: from Group 1 to Group 4, the single-width volume of the sandbar and beach face decreases, while that of the trough increases. This pattern corresponds to changes in the maximum erosion and sedimentation thickness across the three regions. The sediment deposited in the trough originates from the sandbars and beach face, with the sandbars being the primary source of sediment transport. The sediment transport volume (the difference between the volume per unit width of each region and the initial profile’s volume per unit width, in m³/m) shows that the sandbars contribute most of the sediment to the trough, while the contribution from the beach face is comparatively small.
4 Discussion
4.1 Relationship between wave parameters and sandbar erosion
To explore the relationship between wave parameters (height and period) and sandbar erosion, the best-fit lines for the average erosion thickness of the sandbar against wave height and period were plotted, as shown in Figures 10A–D. In these plots, the origin (0, 0) represents zero wave height and period. Figures 10A, B demonstrate a clear linear correlation between wave height and sandbar erosion thickness: as wave height increases, so does the erosion thickness. The T = 1.0s group (Figure 10A) has a coefficient of determination of 0.76, likely because the smaller period limits the influence of wave height on sandbar erosion, resulting in a weaker linear correlation. In contrast, the absolute coefficients for all other groups are above 0.92, with some reaching as high as 0.99.
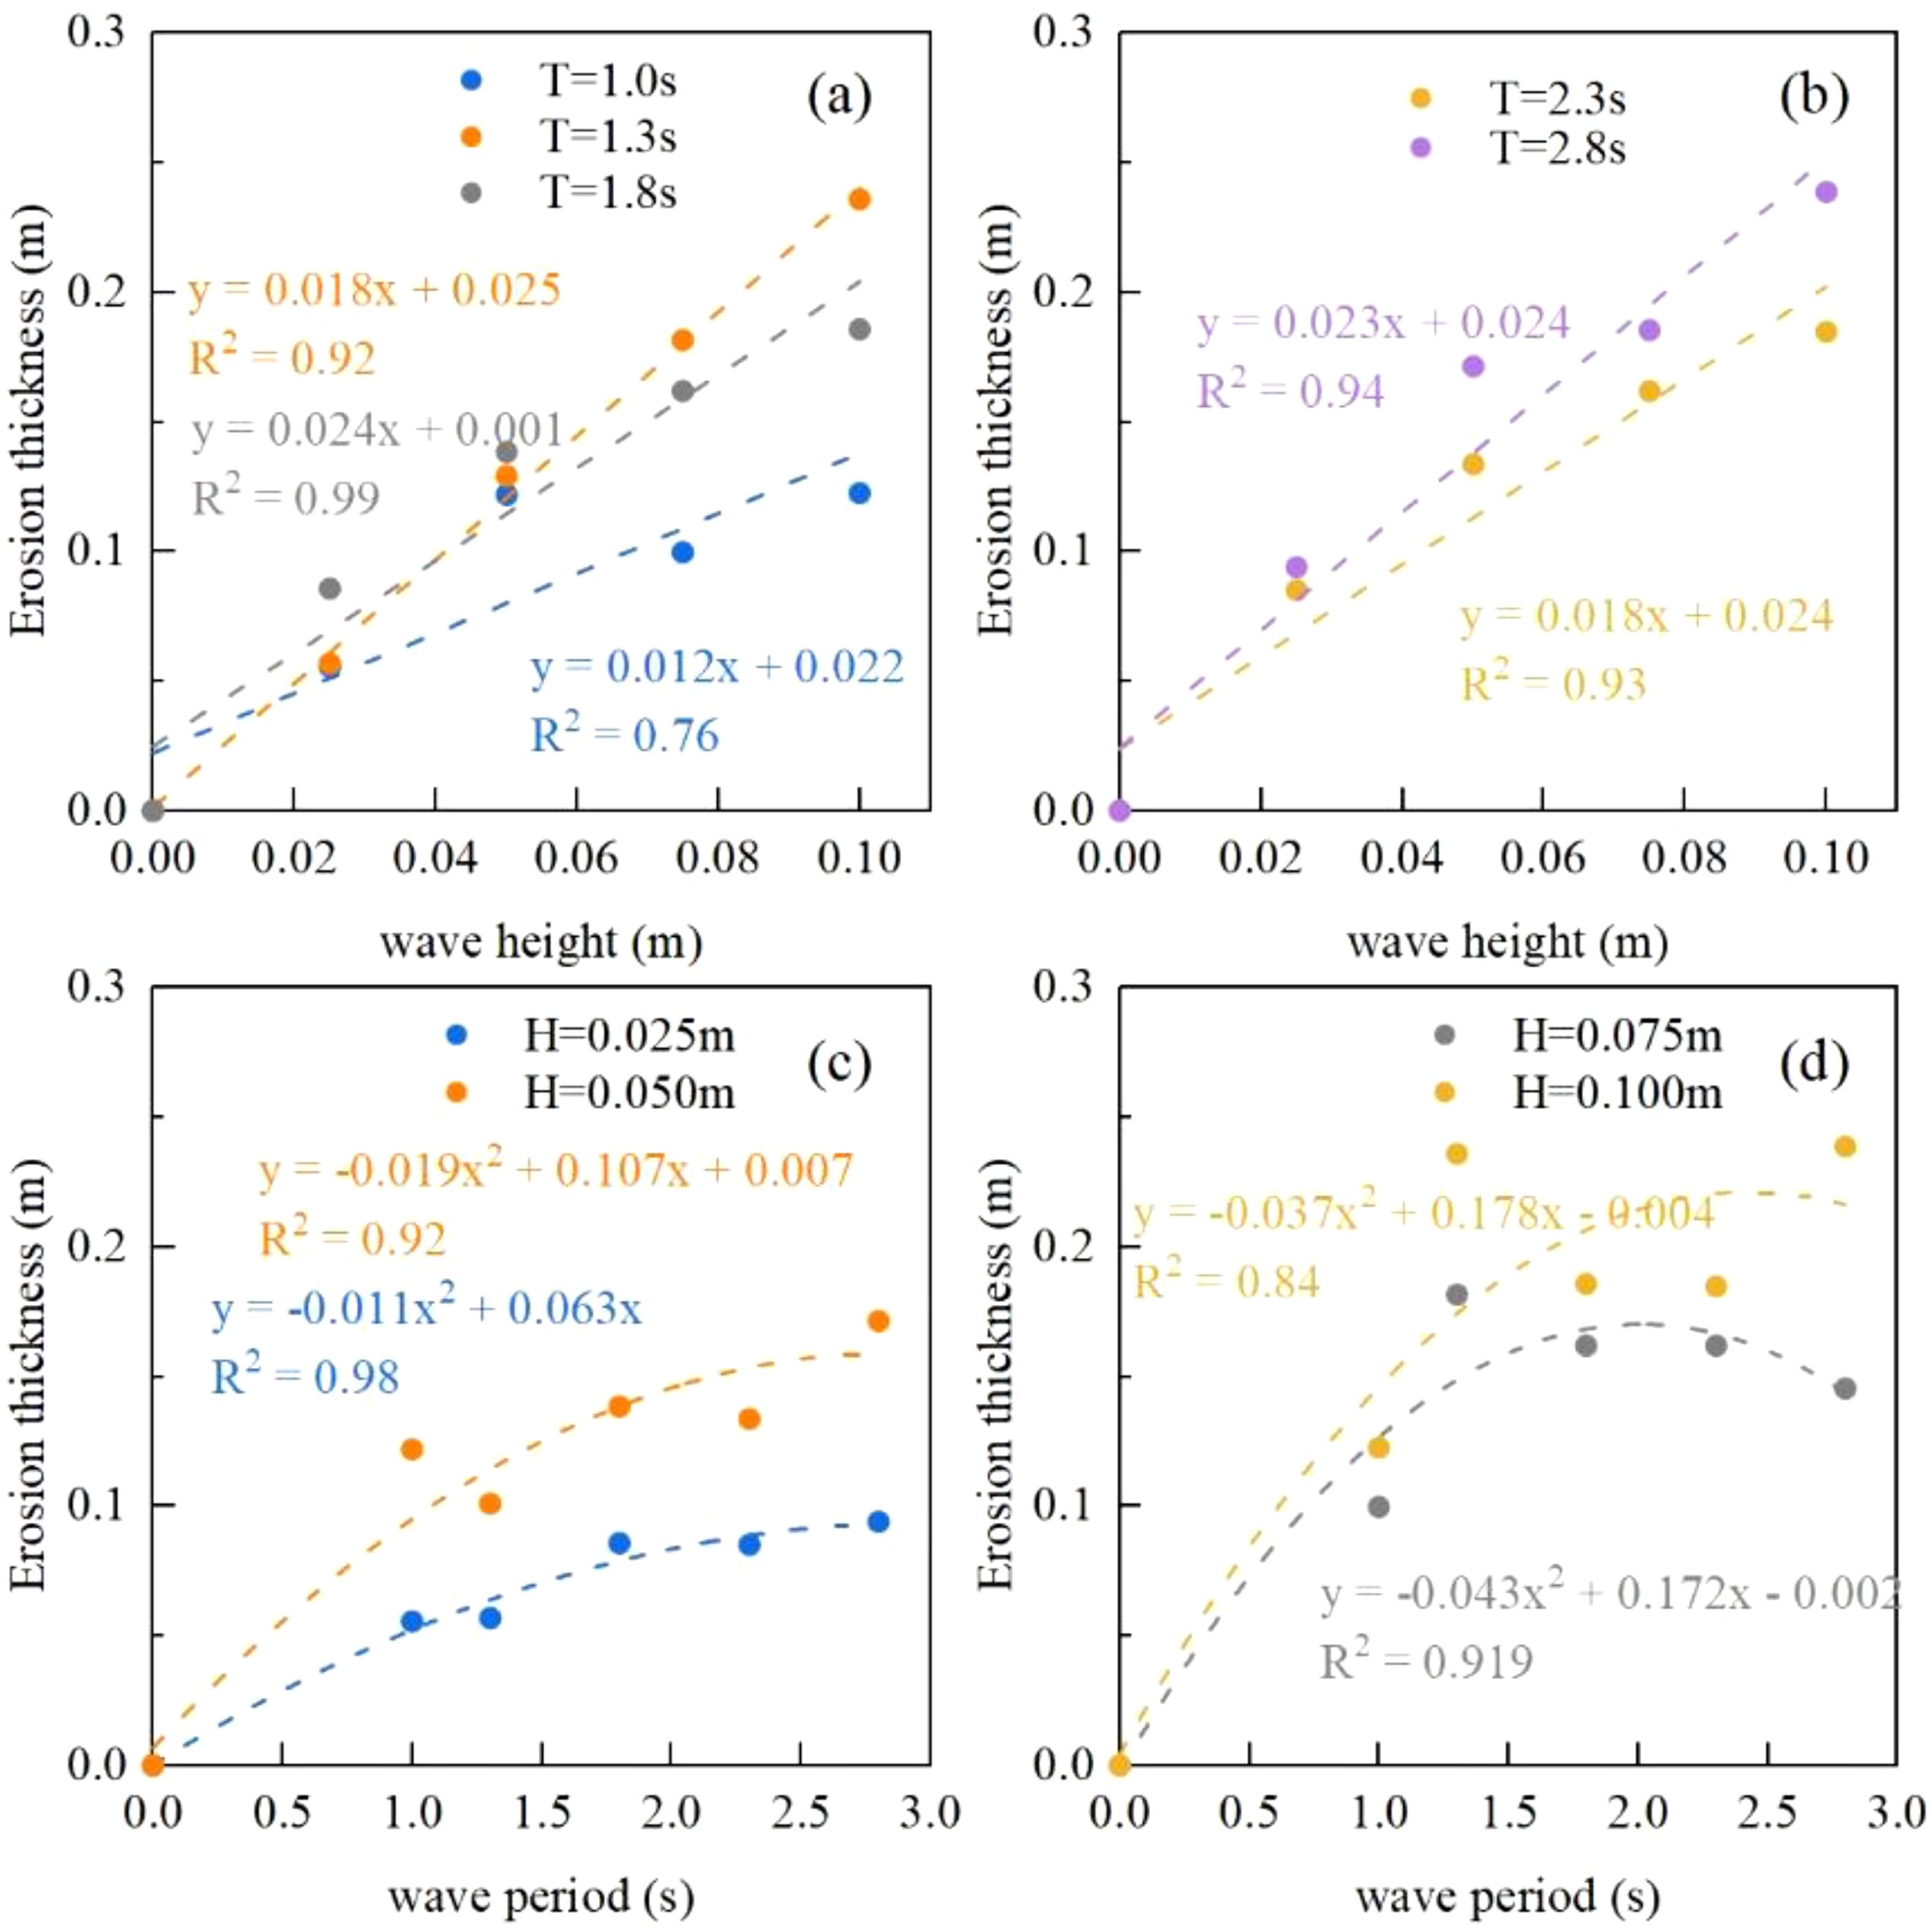
Figure 10. Relationship between the average erosion thickness of sandbars and wave height and period. Panels (A, B) show the relationship between the average erosion thickness of sandbars and wave height at periods of 1.0, 1.3, 1.8, 2.3, and 2.8 seconds. Panels (C, D) show the relationship between the average erosion thickness and period of sandbars with wave heights of 0.025 m, 0.050 m, 0.075 m, and 0.100 m.
In Figures 10C, D, the relationship between wave period and sandbar erosion thickness is modeled as a quadratic polynomial. Group 4 (H = 0.100 m) exhibits a coefficient of determination of 0.84, while the coefficients for other groups exceed 0.9, indicating a generally strong correlation. This leads to the following empirical formula:
where ES is the erosion thickness, and a* is the fitting coefficient, and * represents different subscripts.
Quadratic polynomial behavior suggests that there is a specific wave period at which sandbar erosion reaches its maximum for a given wave height. Understanding this relationship is crucial for engineers when selecting materials and designing structures to resist wave erosion.
In summary, sandbar erosion thickness is significantly influenced by wave parameters such as height and period. However, the interaction between waves and terrain is a complex process. The reflection, transmission, and breaking of waves significantly affect both the erosion thickness and the topographic evolution of sandbars. Therefore, further data collection is necessary to refine and calibrate more accurate empirical models.
4.2 Relationship between wave parameters and beach slope
To examine the relationship between wave parameters (height and period) and beach slope, the best-fit lines for average beach slope against wave height and period were plotted, as shown in Figures 11A–D. This study excludes areas where waves do not affect the top of the beach or where steep slopes are formed by landslides. From Figures 11A, B, a clear correlation is observed between wave height and beach slope, with the beach slope decreasing as incident wave height increases. Notably, the T=1.0 s group (indicated by the dashed line in Figure 11A) exhibits a significantly lower rate of slope change compared to other groups. This may be due to the lower wave energy input in this group, where more energy is dissipated or reflected during wave propagation, limiting the energy that reaches and shapes the beach face. Figures 11C, D also show a linear correlation between the wave period and beach slope, with the beach slope decreasing as the incident wave period increases. Similarly, the H=0.025 m group (circled by the dashed line in Figure 11C) shows a slower rate of slope change compared to other groups, likely due to the same energy dissipation and reflection mechanisms. In Figure 11D, two points (circled by dashed lines) deviate from the fitted line, corresponding to the minimum incident periods at H=0.075 m and 0.100 m, respectively. Removing these points increases the coefficient of determination of the fitted line from 0.69 and 0.57 to 0.79 and 0.92. This suggests the presence of a critical value where the wave period abruptly impacts the slope. Overall, the relationship between wave period and beach slope appears to be more complex than that between wave height and slope.
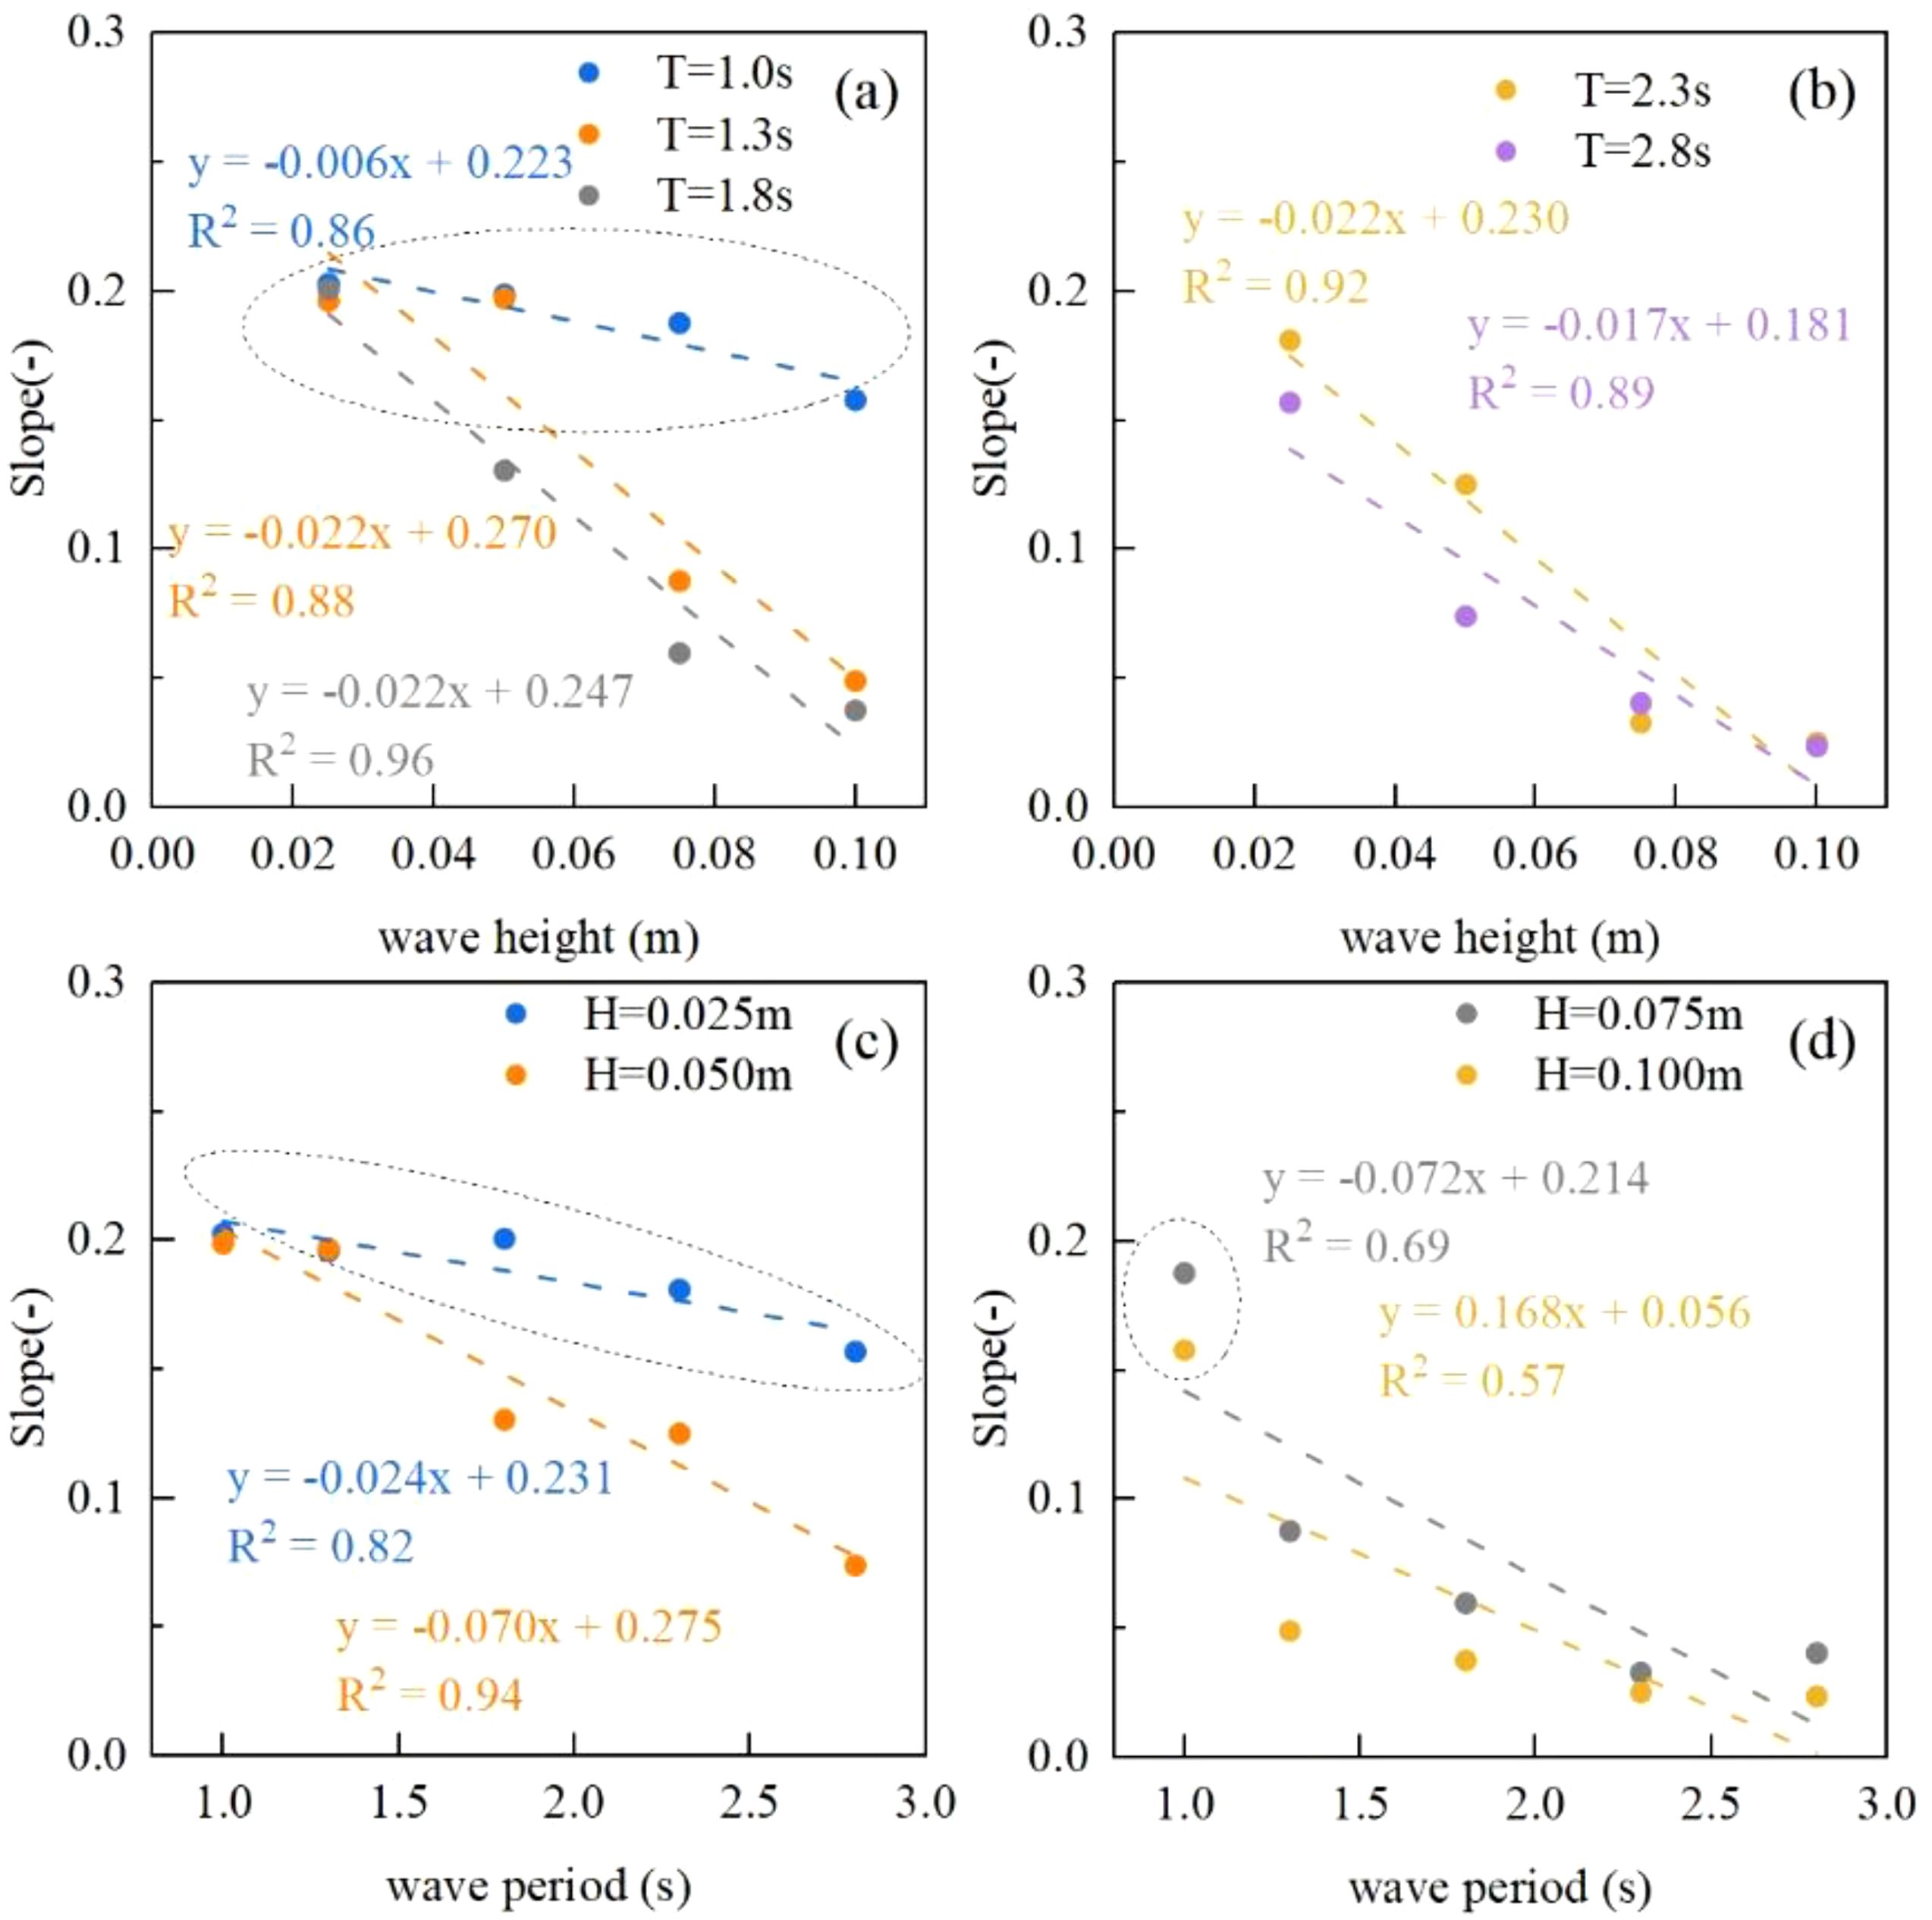
Figure 11. Relationship between the average slope of the beach face and wave height and period. Panels (A, B) show the relationship between the average slope of the beach face and wave height at periods of 1.0 s, 1.3 s, 1.8 s, 2.3 s, and 2.8 s. Panels (C, D) show the relationship between the average slope of the beach face and the period at wave heights of 0.025 m, 0.050 m, 0.075 m, and 0.100 m.
4.3 Beach profile morphology
The beach equilibrium profile is influenced by various coastal factors, including local wave conditions, sediment characteristics, sediment supply, and coastal topography (Li and Chen, 2009). Human activities, such as beach maintenance and engineering construction, further complicate beach profiles, often deviating from naturally formed shapes. Several classic beach profile models, such as Dean (1991) power function, Bodge (1992) exponential formula, and Lee (1994) logarithmic model, have been proposed. However, these models are mainly applicable to natural beach profiles without sandbar maintenance. As shown in Figure 6, the monotonicity and convergence of these models fail to accurately simulate profiles shaped by engineering activities. To address this, we propose a new empirical formula for calculating the profile morphology of submerged sandbar-beach systems.
The formula is a three-stage approach, similar to the segmented formula by Inman et al. (1993). For the x≤x1 region, Dean’s power function formula is used. For the x1<x<x2 region, polynomial fitting is applied. For x≥x2 part, according to Pruszak et al. (1997), the profile equation is expanded around the segmentation point using Taylor’s formula. To enhance its practical application, a second-order approximation is adopted. The precise locations of the segment boundaries, x1 and x2, are critical. x1 corresponds to the crest on the shoreward side of the sandbar, while x2 marks the start of the angular slope of the beach face (Figure 12). In practical engineering applications, these points can be determined by analyzing the profile difference, specifically the abrupt change in the profile slope.
In equation z3(x), the zero-order coefficient mx1 and the first-order coefficient mx2 are determined by the boundary conditions (Equation 17). The second-order coefficient ms, which reflects the average slope of the beach profile (Figure 13E), is obtained through fitting with profile data. Given the inherent variability of beach equilibrium profile morphology, the model’s findings are statistically significant only to a certain extent. Consequently, the physical meanings and implications of the other model parameters, which are derived through fitting, are not discussed in detail here.
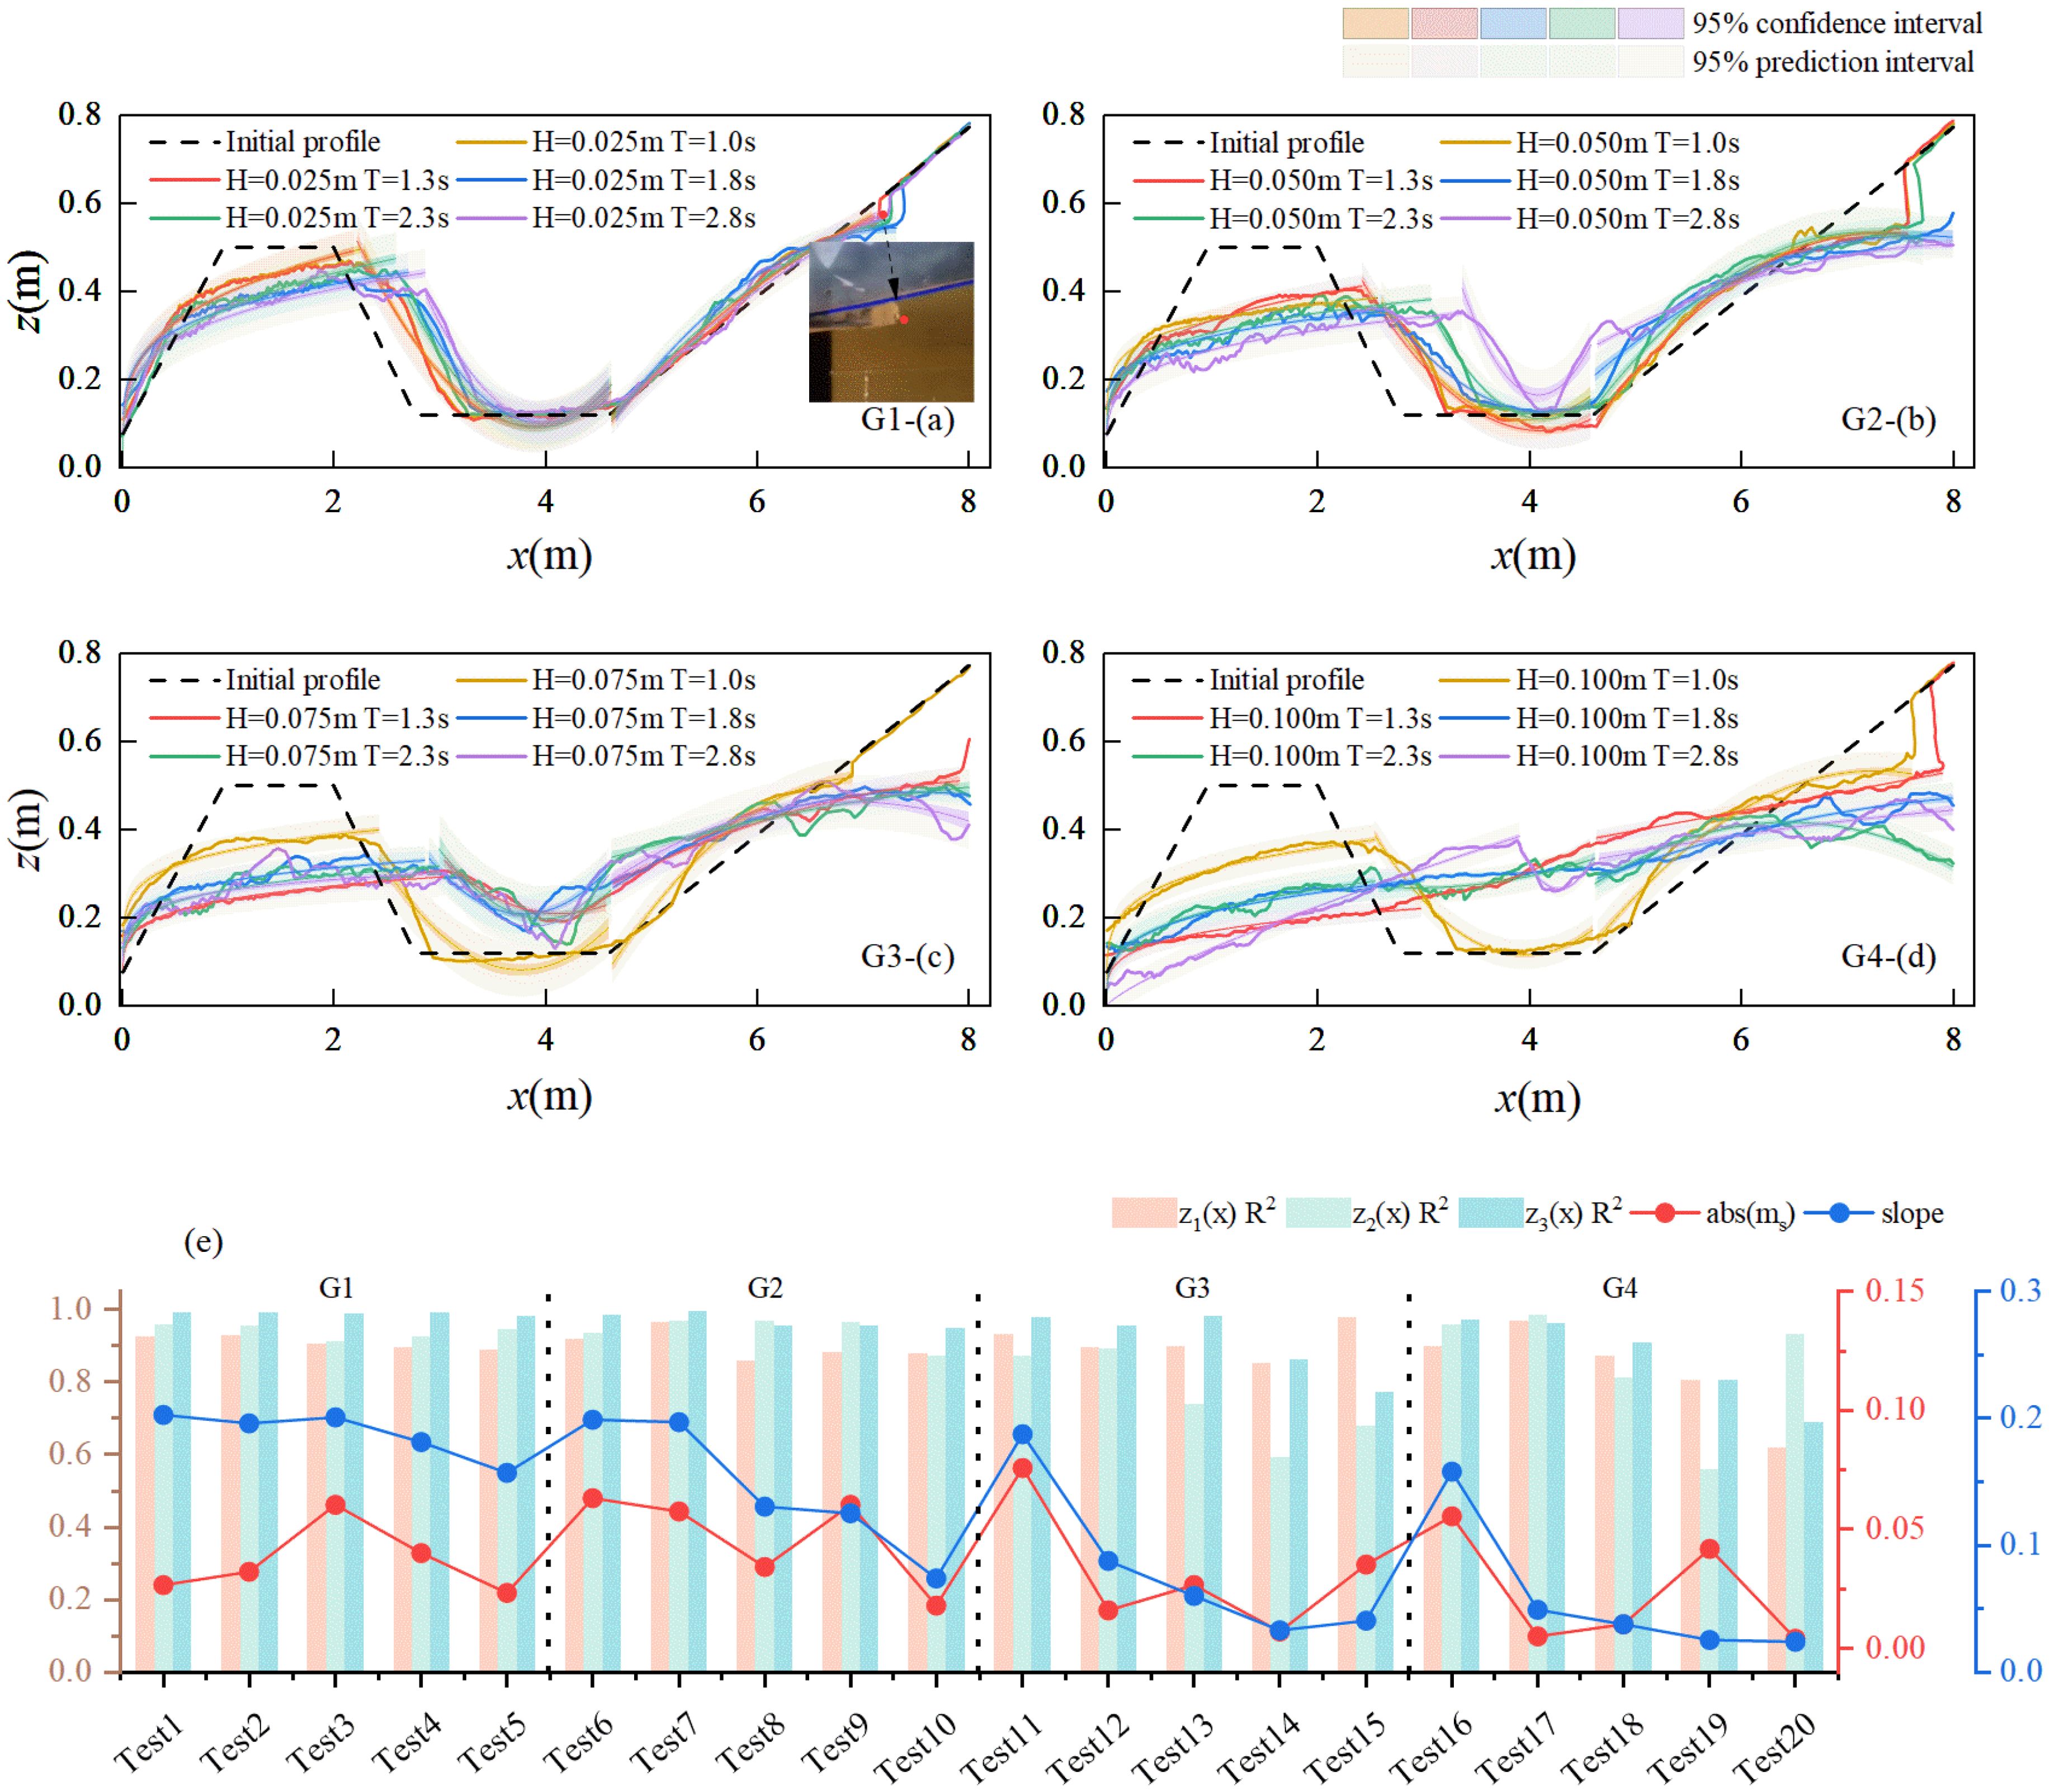
Figure 13. Profile fitting. Panels (A–D) (G1-G4) show the profile fitting with a 95% confidence level and a predictive interval. The predictive band is the predictor variable, while the confidence band is the expected value of the predictor variable. Panel (E) shows that,z1(x)R2,z2(x)R2, and z3(x)R2 are the fitting determination coefficients for Groups 1-4, z1(x),z2(x), and z3(x), respectively. Abs (ms) is the absolute value of the coefficient ms, and “slope” denotes slope.
Figures 13A–E present the fitting results, with recommended i values of 2. In most cases, the coefficient of determination is approximately 0.93, indicating a good model fit. However, when wave energy is high, sandbar erosion increases, significantly altering the structure and morphology of the sandbar. As a result, the “sandbar characteristics” of the entire profile become less distinct, leading to poor fit results for some tests, such as Test 14, 15, 19, and Test 20.
4.4 Sand ripple and bimodal sandbar crest
Following each experiment, the occurrence of sand ripples was recorded. The location of these ripples, as explained earlier, will not be reiterated here. However, the size of the sand ripples, formed by the lightweight model sand used in this experiment, cannot be conclusively attributed to natural sand ripple formation or experimental artifacts caused by the lightweight material or other model effects (Pan et al., 2022b). Thus, only a statistical analysis of the ripple size was performed. Further research is needed to elucidate the formation mechanism of sand ripples and investigate their role in natural environments, potentially through comparisons with different materials in future studies.
Additionally, in specific cases, such as Test 5 and Test 10, two peaks appeared on the sandbar crest. The formation of a bimodal sandbar crest may be attributed to rolling waves. This wave-breaking mode generates strong downward scouring currents, forming a groove on the sandbar crest. The sand washed from this groove accumulates on either side, gradually forming two elevated sand mounds or small peaks. As this process continues, a distinct bimodal shape emerges at the sandbar’s top. Notably, the peak on the offshore side further facilitates wave breaking at the same location, creating a feedback loop. In this loop, the scouring effect generated by wave breaking shapes the bimodal terrain, which, in turn, influences the wave-breaking mode.
5 Conclusions
This study utilizes physical model experiments to examine the effects of artificial submerged sandbars on wave propagation and deformation, as well as the terrain evolution response to wave action. A total of 20 experiments were conducted under varying conditions by adjusting wave height and period combinations. The following conclusion can be drawn.
The analysis of wave skewness and asymmetry reveals how wave shape varies in both the horizontal and vertical directions. These shape changes directly influence sediment transport processes. Wave breaking observed in the experiment formed a bimodal pattern at the crest of the sandbar under conditions with longer wave periods, highlighting the intricate feedback between wave energy and terrain interaction.
Variations in wave height and period significantly affect sandbar erosion and sedimentation. Under conditions of low wave height and period, reduced wave energy results in minimal erosion on the seaward side and limited sediment accumulation on the shoreward side of the sandbar. The relatively low wave reflection coefficient measured in front of the sandbar suggests that the sandbar primarily serves as a sediment source under wave action, facilitating sediment transport rather than significantly reflecting wave energy. As wave height and period increase, the interaction between waves and sandbars intensifies, leading to more pronounced terrain changes.
Quantitative analysis of maximum erosion and sedimentation thicknesses revealed that sandbar deposition predominantly occurs on the shoreward side, while erosion is concentrated on the seaward side. Troughs typically exhibit deposition, with beach accumulation occurring primarily at the slope angle. A strong linear correlation exists between wave height and sandbar erosion thickness, with erosion increasing as wave height rises. The relationship between wave period and erosion thickness follows a quadratic polynomial, indicating a specific wave period that maximizes erosion. These linear and nonlinear correlations provide critical insights for sandbar design. Given the complex interaction between waves and sandbars, additional field data and modeling are necessary to refine and optimize design strategies. Furthermore, this study introduces an empirical formula for submerged sandbar beach face systems, offering a better fit for the evolving profiles of beaches with artificial submerged sandbars.
Data availability statement
The original contributions presented in the study are included in the article/supplementary material. Further inquiries can be directed to the corresponding authors.
Author contributions
WZ: Writing – original draft, Writing – review & editing. JG: Writing – review & editing. LS: Conceptualization, Funding acquisition, Writing – review & editing. ZL: Investigation, Visualization, Writing – review & editing. QY: Writing – review & editing. CK: Investigation, Writing – review & editing. YP: Investigation, Visualization, Writing – review & editing. HQ: Investigation, Project administration, Writing – review & editing.
Funding
The author(s) declare financial support was received for the research, authorship, and/or publication of this article. This research was funded by the auspices of the Zhejiang Provincial Natural Science Foundation of China [No. LHZ22D060001], the National Key Research and Development Program of China [No. 2022YFC3106200], and the Scientific Research Funds of the Second Institute of Oceanography, MNR (JG2315, XRJH2309).
Acknowledgments
The author would like to thank the Zhejiang Institute of Hydraulics & Estuary for providing experimental site support.
Conflict of interest
The authors declare that the research was conducted in the absence of any commercial or financial relationships that could be construed as a potential conflict of interest.
Generative AI statement
The author(s) declare that no Generative AI was used in the creation of this manuscript.
Publisher’s note
All claims expressed in this article are solely those of the authors and do not necessarily represent those of their affiliated organizations, or those of the publisher, the editors and the reviewers. Any product that may be evaluated in this article, or claim that may be made by its manufacturer, is not guaranteed or endorsed by the publisher.
References
Agardy M. T. (1993). Accommodating ecotourism in multiple use planning of coastal and marine protected areas. Ocean Coast. Manage. 20, 219–239. doi: 10.1016/0964-5691(93)90068-A
Atkinson A. L., Baldock T. E. (2020). Laboratory investigation of nourishment options to mitigate sea level rise induced erosion. Coast. Eng. 161, 103769. doi: 10.1016/j.coastaleng.2020.103769
Baldock T. E., Alsina J. A., Caceres I., Vicinanza D., Contestabile P., Power H., et al. (2011). Large-scale experiments on beach profile evolution and surf and swash zone sediment transport induced by long waves, wave groups and random waves. Coast. Eng. 58, 214–227. doi: 10.1016/j.coastaleng.2010.10.006
Bodge K. R. (1992). Representing equilibrium beach profiles with an exponential expression. J. Coast. Res. 8, 47–55.
Brand E., Ramaekers G., Lodder Q. (2022). Dutch experience with sand nourishments for dynamic coastline conservation – An operational overview. Ocean Coast. Manage. 217, 106008. doi: 10.1016/j.ocecoaman.2021.106008
Brutsché K. E., Wang P., Beck T. M., Rosati J. D., Legault K. R. (2014). Morphological evolution of a submerged artificial nearshore berm along a low-wave microtidal coast, Fort Myers Beach, west-central Florida, USA. Coast. Eng. 91, 29–44. doi: 10.1016/j.coastaleng.2014.04.010
Cao K., Shi B., Zhao D., Zhao E. (2015). Study of the effect of the artificial sandbank on the eroded beach nourishment. Trans. Oceanology Limnology 4, 127–131. doi: 10.13984/j.cnki.cn37-1141.2015.04.019
Cong X., Kuang C., Huang G., Zou Q., Han X., Shen C., et al. (2023a). Experimental study on the morphodynamic evolution of sandbar-lagoon system with emergent vegetation. Coast. Eng. 184, 104340. doi: 10.1016/j.coastaleng.2023.104340
Cong X., Kuang C., Zheng Y., Han X., Fan J., Zhao F., et al. (2023b). Experimental observation on wave propagation and geomorphological evolution in a sandbar-lagoon system. Appl. Ocean Res. 141, 103785. doi: 10.1016/j.apor.2023.103785
Dean R. G. (1991). Equilibrium beach profiles-characteristics and applications. J. Coast. Res. 7, 53–84.
de Schipper M. A., Ludka B. C., Raubenheimer B., Luijendijk A. P., Schlacher T. A. (2021). Beach nourishment has complex implications for the future of sandy shores. Nat. Rev. Earth Environ. 2, 70–84. doi: 10.1038/s43017-020-00109-9
Dette H. H., Larson M., Murphy J., Newe J., Peters K., Reniers A., et al. (2002). Application of prototype flume tests for beach nourishment assessment. Coast. Eng. 47, 137–177. doi: 10.1016/S0378-3839(02)00124-2
Gao J., Hou L., Liu Y., Shi H. (2024). Influences of bragg reflection on harbor resonance triggered by irregular wave groups. Ocean Eng. 305. doi: 10.1016/j.oceaneng.2024.117941
Gao J., Ma X., Dong G., Chen H., Liu Q., Zang J. (2021). Investigation on the effects of Bragg reflection on harbor oscillations. Coast. Eng. 170, 103977. doi: 10.1016/j.coastaleng.2021.103977
Gao J., Shi H., Zang J., Liu Y. (2023). Mechanism analysis on the mitigation of harbor resonance by periodic undulating topography. Ocean Eng. 281, 86–95. doi: 10.1016/j.oceaneng.2023.114923
Gao J., Zhou X., Zhou L., Zang J., Chen H. (2019). Numerical investigation on effects of fringing reefs on low-frequency oscillations within a harbor. Ocean Eng. 172, 86–95. doi: 10.1016/j.oceaneng.2018.11.048
Goda Y., Suzuki Y. (1977). “Estimation of incident and reflected waves in random wave experiments,” in Coastal Engineering 1976 (Honolulu, Hawaii, United States: American Society of Civil Engineers), 828–845. doi: 10.1061/9780872620834.048
Gong Z. (2023). Geomorphological characteristics and influencing factors of beach in different seasons in Zhejiang Province. (dissertation/master's thesis). Nanjing University, Shandong, Qingdao.
Grasso F., Michallet H., Barthélemy E. (2011a). Experimental simulation of shoreface nourishments under storm events: A morphological, hydrodynamic, and sediment grain size analysis. Coast. Eng. 58, 184–193. doi: 10.1016/j.coastaleng.2010.09.007
Grasso F., Michallet H., Barthélemy E. (2011b). Sediment transport associated with morphological beach changes forced by irregular asymmetric, skewed waves. J. Geophys. Res. 116, C03020. doi: 10.1029/2010JC006550
Grunnet N. M., Ruessink B. G. (2005). Morphodynamic response of nearshore bars to a shoreface nourishment. Coast. Eng. 52, 119–137. doi: 10.1016/j.coastaleng.2004.09.006
Grunnet N. M., Ruessink B. G., Walstra D.-J. R. (2005). The influence of tides, wind and waves on the redistribution of nourished sediment at Terschelling, The Netherlands. Coast. Eng. 52, 617–631. doi: 10.1016/j.coastaleng.2005.04.001
Inman D. L., Elwany M. H. S., Jenkins S. A. (1993). Shorerise and bar-berm profiles on ocean beaches. J. Geophys. Res. 98, 18181–18199. doi: 10.1029/93JC00996
Islam M. S., Suzuki T., Thilakarathne S. (2024). Physical modeling of sandbar dynamics to correlate wave-induced pore pressure gradient, sediment concentration, and bed-level erosion. Ocean Eng. 307, 118161. doi: 10.1016/j.oceaneng.2024.118161
Jonsson I. G. (1980). A new approach to oscillatory rough turbulent boundary layers. Ocean Eng. 7, 109–152. doi: 10.1016/0029-8018(80)90034-7
Kriebel D., Dally W., Dean R. (1986). Undistorted Froude Model for Surf Zone Sediment Transport. Available online at: https://xueshu.baidu.com/usercenter/paper/show?paperid=210f60f0a19e4bacbe1102d0476de8ad (Accessed September 22, 2024).
Lee Z. F. (1994). Beach systems of the central Netherlands coast: Processes, morphology and structural impacts in a storm driven multi-bar system. J. Coast. Res. 10, 1–17.
Li Z., Chen Z. (2009). Analysis on the parameters′ meanings and relations in equilibrium beach profile models. Ocean Eng. 27, 108–115. doi: 10.16483/j.issn.1005-9865.2009.04.009
Li Y., Zhang C. (2023). Review on morphological evolution of nearshore artificial sandbar and underlying sediment transport mechanisms. Haiyang Xuebao 45, 79–89. doi: 10.12284/hyxb070
Li Y., Zhang C., Chen S., Sui T., Chen D., Qi H. (2022a).Influence of artificial sandbar on nonlinear wave transformation: Experimental investigation and parameterizations. In: Ocean engineering. Available online at: https://xueshu.baidu.com/usercenter/paper/show?paperid=1a5x06d0712n0m90ds4c04f0xp029239 (Accessed September 22, 2024).
Li Y., Zhang C., Dai W., Chen D., Sui T., Xie M., et al. (2022b). Laboratory investigation on morphology response of submerged artificial sandbar and its impact on beach evolution under storm wave condition. Mar. Geology 443, 106668. doi: 10.1016/j.margeo.2021.106668
Lorenzoni I., Day S. A., Mahony M., Tolhurst T. J., Bark R. H. (2024). Innovation in coastal governance: management and expectations of the UK’s first sandscaping scheme. Reg. Environ. Change 24, 101. doi: 10.1007/s10113-024-02248-x
Ma Y. (2016). Simulation Studies on Shoreface Beach Nourishment Based on the Artificial Sandbar. (dissertation/master's thesis). Ocean University of China, Shandong, Qingdao.
Ojeda E., Ruessink B. G., Guillen J. (2008). Morphodynamic response of A two-barred beach to A shoreface nourishment. Coast. Eng. 55, 1185–1196. doi: 10.1016/j.coastaleng.2008.05.006
Pan Y., Qu X. K., Yang Y. B., Zhang J. B., Wang G., Yin S., et al. (2023). Laboratory experiments on the evolution of a submerged berm driven by low-energy irregular waves. Coast. Eng. 182, 104301. doi: 10.1016/j.coastaleng.2023.104301
Pan Y., Xue S., Wang X., Kuang C., Chen Y., Zhang C. (2022a). A review of studies on submerged berms. J. tongji university(natural science) 50, 1295–1302. doi: 10.11908/j.issn.0253-374x.21334
Pan Y., Yin S., Chen Y., Yang Y., Xu Z., Xu C. (2019). A practical method to scale the sedimentary parameters in a lightweight coastal mobile bed model. J. Coast. Res. 35, 1351. doi: 10.2112/JCOASTRES-D-18-00168.1
Pan Y., Yin S., Chen Y. P., Yang Y. B., Xu C. Y., Xu Z. S. (2022b). An experimental study on the evolution of a submerged berm under the effects of regular waves in low-energy conditions. Coast. Eng. 176, 104169. doi: 10.1016/j.coastaleng.2022.104169
Pruszak Z., RóŻyński G., Zeidler R. B. (1997). Statistical properties of multiple bars. Coast. Eng. 31, 263–280. doi: 10.1016/S0378-3839(97)00010-0
Roelvink J. A., Stive M. J. F. (1989). Bar-generating cross-shore flow mechanisms on a beach. J. Geophys. Res. 94, 4785–4800. doi: 10.1029/JC094iC04p04785
Smith E. R., D’Alessandro F., Tomasicchio G. R., Gailani J. Z. (2017a). Nearshore placement of a sand dredged mound. Coast. Eng. 126, 1–10. doi: 10.1016/j.coastaleng.2017.05.002
Smith E. R., Mohr M. C., Chader S. A. (2017b). Laboratory experiments on beach change due to nearshore mound placement. Coast. Eng. 121, 119–128. doi: 10.1016/j.coastaleng.2016.12.010
Soulsby R. (1997). The Dynamics of Marine Sands: A Manual for Practical Applications. Oceanogr. Lit. Rev. 9, 947.
Spielmann K., Certain R., Astruc D., Barusseau J.-P. (2011). Analysis of submerged bar nourishment strategies in a wave-dominated environment using a 2DV process-based model. Coast. Eng. 58, 767–778. doi: 10.1016/j.coastaleng.2011.03.015
Van Duin M. J. P., Wiersma N. R., Walstra D. J. R., Van Rijn L. C., Stive M. J. F. (2004). Nourishing the shoreface: observations and hindcasting of the Egmond case, The Netherlands. Coast. Eng. 51, 813–837. doi: 10.1016/j.coastaleng.2004.07.011
Van Rijn L. C. (1993). Principles of sediment transport in rivers, estuaries and coastal seas. Available online at: https://documentatiecentrum.watlab.be/owa/imis.php?module=ref&refid=85377 (Accessed October 30, 2024).
Vellinga P. (1984). Beach and dune erosion during storm surges — Reply. Coast. Eng. 8, 191–192. doi: 10.1016/0378-3839(84)90014-0
Waal B.v. d. (2024). The effect of nourishments on dune erosion during a storm sequence. Available online at: https://studenttheses.uu.nl/handle/20.500.12932/46423 (Accessed November 8, 2024).
Wu J., Shi B., Li Z., Liu D., Fan F. (2012). Experimental study on the shore nourishment for beach protection and siltation promotion. Mar. Sci. Bull. 31, 176–180. doi: 10.11840/j.issn.1001-6392.2012.2.008
Yin S., Pan Y., Chen Y. (2017). Scale design based on local curve fitting method for low-energy sandy beach. Hydro-Science Eng. 4, 43–51. doi: 10.16198/j.cnki.1009-640x.2017.04.007
Zhang M. (2021). Study on Geomorphological Characteristics and Development Model of Beaches in Zhejiang Province. (dissertation/master's thesis). Institute Of Oceanography, MNR, Zhejiang, Hangzhou.
Zhang J., Larson M. (2020). A numerical model for offshore mound evolution. JMSE 8, 160. doi: 10.3390/jmse8030160
Keywords: submerged artificial sandbar, regular wave, flume test, sandbar-beach profile evolution, beach nourishment
Citation: Zhang W, Guo J, Shi L, Liu Z, Ye Q, Kuang C, Peng Y and Qi H (2025) Experimental study on the evolution of submerged artificial sandbar-beach profile under the regular waves condition. Front. Mar. Sci. 11:1530904. doi: 10.3389/fmars.2024.1530904
Received: 19 November 2024; Accepted: 16 December 2024;
Published: 16 January 2025.
Edited by:
Achilleas G. Samaras, Democritus University of Thrace, GreeceReviewed by:
Junliang Gao, Jiangsu University of Science and Technology, ChinaFeng Liu, Sun Yat-sen University, China
Copyright © 2025 Zhang, Guo, Shi, Liu, Ye, Kuang, Peng and Qi. This is an open-access article distributed under the terms of the Creative Commons Attribution License (CC BY). The use, distribution or reproduction in other forums is permitted, provided the original author(s) and the copyright owner(s) are credited and that the original publication in this journal is cited, in accordance with accepted academic practice. No use, distribution or reproduction is permitted which does not comply with these terms.
*Correspondence: Lianqiang Shi, lqshi@sio.org.cn; Qinghua Ye, Qinghua.Ye@deltares.nl
 Wenliang Zhang