 Linxi Fu1,2
 Yuhang Zhong1,2Ping Zhang1,2
 Lixia Niu1,2
 Xiaohe Zhang1,2Jianliang Lin1,2
 Huayang Cai1,2Qingshu Yang1,2*
- 1School of Ocean Engineering and Technology, Sun Yat-sen University, Guangzhou/Southern Marine Science and Engineering Guangdong Laboratory, Zhuhai, China
- 2Guangdong Provincial Engineering Research Center of Coasts, Islands and Reefs, Sun Yat-sen University, Zhuhai, China
Shoals and troughs are the fundamental geomorphological units of estuarine systems. However, their definition and morphodynamic characteristics, influenced by the complex dynamic environment, remain a critical challenge. This work introduces a depth–area spatial function as a quantitative criterion for the definition of shoals and troughs, while simultaneously elucidating their geodynamic implications. The Lingdingyang Bay (LDB) of the Pearl River Estuary serves as a case study. From 1901 to 2018, the LDB consisted of the West Shoal, Middle Shoal, and East Shoal and the West Trough and East Trough. The threshold depth of the LDB shifted from −5.75 m in 1901 to −4.75 m between 1964 and 2018. The depth–area distribution curve of the LDB exhibits two dominant peak depths (approximately 0 m and −2 m) within the shoal stable state, which categorizes shallow areas into high, medium and low tidal flats. The shoal–trough area ratio in the LDB, relative to the threshold depths, increased from 1901 to 1998, followed by a decline between 2008 and 2018, and culminated in a restoration to the level seen in 1901 (65% shoals and 35% troughs). Regional variations in dominant forces influencing shoal formation and evolution were observed by the vertical classification of the shoal state. The West Shoal is river dominated, the East Shoal is tide dominated, and the Middle Shoal reflects an interaction between riverine inflows and tides. Stabilized curves observed between 2008 and 2018 indicate that this estuary is progressively achieving new equilibrium states. The depth–area spatial function is useful for identifying shoals and troughs within various estuaries, which also provides a geomorphological framework for understanding the estuarine evolution and sediment dynamics.
1 Introduction
Shoal–trough structures are a prevalent geomorphological feature in estuaries and deltas and vital marine buffer zones (Chen and Chen, 2002; Laignel et al., 2023). This structure illustrates the dynamic equilibrium between hydrodynamic and geomorphological processes and functions. Defining the shoal–trough structures and understanding their geomorphology are critical estuarine coastal geomorphology topics (de Swart and Zimmerman, 2009).
Shoal–trough morphology is dictated by a complex interaction of factors such as runoff, tides, waves, alongshore currents, sediment transport, and human activities. These intricate dynamics shape the estuarine shoal–trough geomorphology and are central themes in coastal research. Accurate delineation of the shoal–trough structural boundaries is crucial for quantifying their geomorphological and dynamical implications, and for understanding the morphological evolution under varying hydrodynamic and sedimentary conditions (Li et al., 2019). Depth contours are commonly used to outline shoals and troughs for comparative analyses of their morphological evolution (Gerald et al., 2017; Wei et al., 2017). For example, Wu et al. (2014) scrutinized the evolution of shoal–trough structures in the Lingdingyang Bay (LDB), classifying the intertidal and subtidal flats according to depths ranging from −2 m to −5 m below the water surface. They quantified the structural evolution and forecasted future deepening trends. However, the selection and definition of depth contours for outlining shoals and troughs are still ambiguous and call for further exploration.
In fluvial dynamics, the hydraulic geometric relationships (depth, gradient, and flow velocity) are used to assess shoal–trough structures in river channels (Richards, 1976; Ha et al., 2012). The determination of floodplain water level is a key factor in riverbed evolution studies, as shoals are formed by runoff-driven processes. However, estuarine systems are much more dynamically complex due to the combined effects of riverine and tidal dynamics. Currents and coastal waves are fundamental in the physical mechanisms of sediment resuspension, causing geomorphological responses (Green and Coco, 2014; Wang et al., 2024). Therefore, it is necessary to conduct further research on delineating shoal–trough structures and identifying the dominant dynamics.
Sediment exchange between shoals and troughs, driven by complex estuarine dynamics, results in erosion and deposition within the system. For example, research on the Xinqiao Trough and Bian Dan Shoal in the Yangtze River Estuary revealed a linear relationship between the shoal area and trough volume from 1998 to 2016 (Lou et al., 2020). Although this correlation illustrates the dynamic geomorphology, the mechanisms driving these transformations and the thresholds governing the shifts remain insufficiently understood. The notion of an equilibrium state is common in estuarine studies (Li, 2018; Van et al., 2008; Wu et al., 2018). However, the identification of critical thresholds for geomorphological transformations under varying tidal influences, sediment transport, and human intervention requires further investigation. Human endeavors such as land reclamation, sand mining, dredging, and upstream reservoir construction have notably altered the geomorphological boundary conditions and sediment supply. These changes profoundly affect the hydrodynamic patterns and sediment transport, affecting geomorphological pattern evolution and shoal–trough configurations (Talke and Jay, 2020; Wang et al., 2010; Zhang et al., 2022b).
The LDB is a typical estuarine bay heavily influenced by human activities. Reclamation, port and channel dredging, bridge construction, and sand mining have dramatically altered its geomorphology, particularly the shoal–trough structures (Luo et al., 2007). The evolution and stability of the LDB shoal–trough structures have been thrust into the spotlight due to these interventions, prompting critical questions about their long-term trends and resilience. The analysis of the evolution and steady-state transition of the shoal–trough structures in the LDB is not only at the forefront of estuarine geomorphological research but also offers vital theoretical support for estuarine management, disaster protection, and port and navigation development.
This work has three aims 1) constructing depth–area spatial functions to define the boundaries of shoals and troughs in the LDB; 2) analyzing the dynamic geomorphological characteristics of the shoal–trough structures; and 3) examining the evolution of erosion and deposition in the shoal–trough structures within the LDB, along with its underlying mechanisms.
2 Materials and methods
2.1 Description of the study area
The LDB is a crucial estuarine bay in the eastern Pearl River Delta (PRD). It lies at the heart of the Guangdong–Hong Kong–Macao Greater Bay Area. The PRD is the third-largest delta in China, with an average annual runoff of 313.8 billion m3 and a sediment load of 69.8 million tons recorded from 1950 to 2020 (Ministry of Water Resources of China, 2020). The PRD has a complex structure comprising river networks and estuarine bays, where three major rivers converge and eight outlets discharge into it. As the largest estuarine bay in the PRD, the LDB receives runoff and sediment from the four river outlets found to its east—Humen, Jiaomen, Hongqili, and Hengmen—and has a funnel-shaped morphology that is oriented from north-northwest to south-southeast (Figure 1). The mouth of the bay spans approximately 60 km but it narrows to 4 km at its head near the Humen outlet.
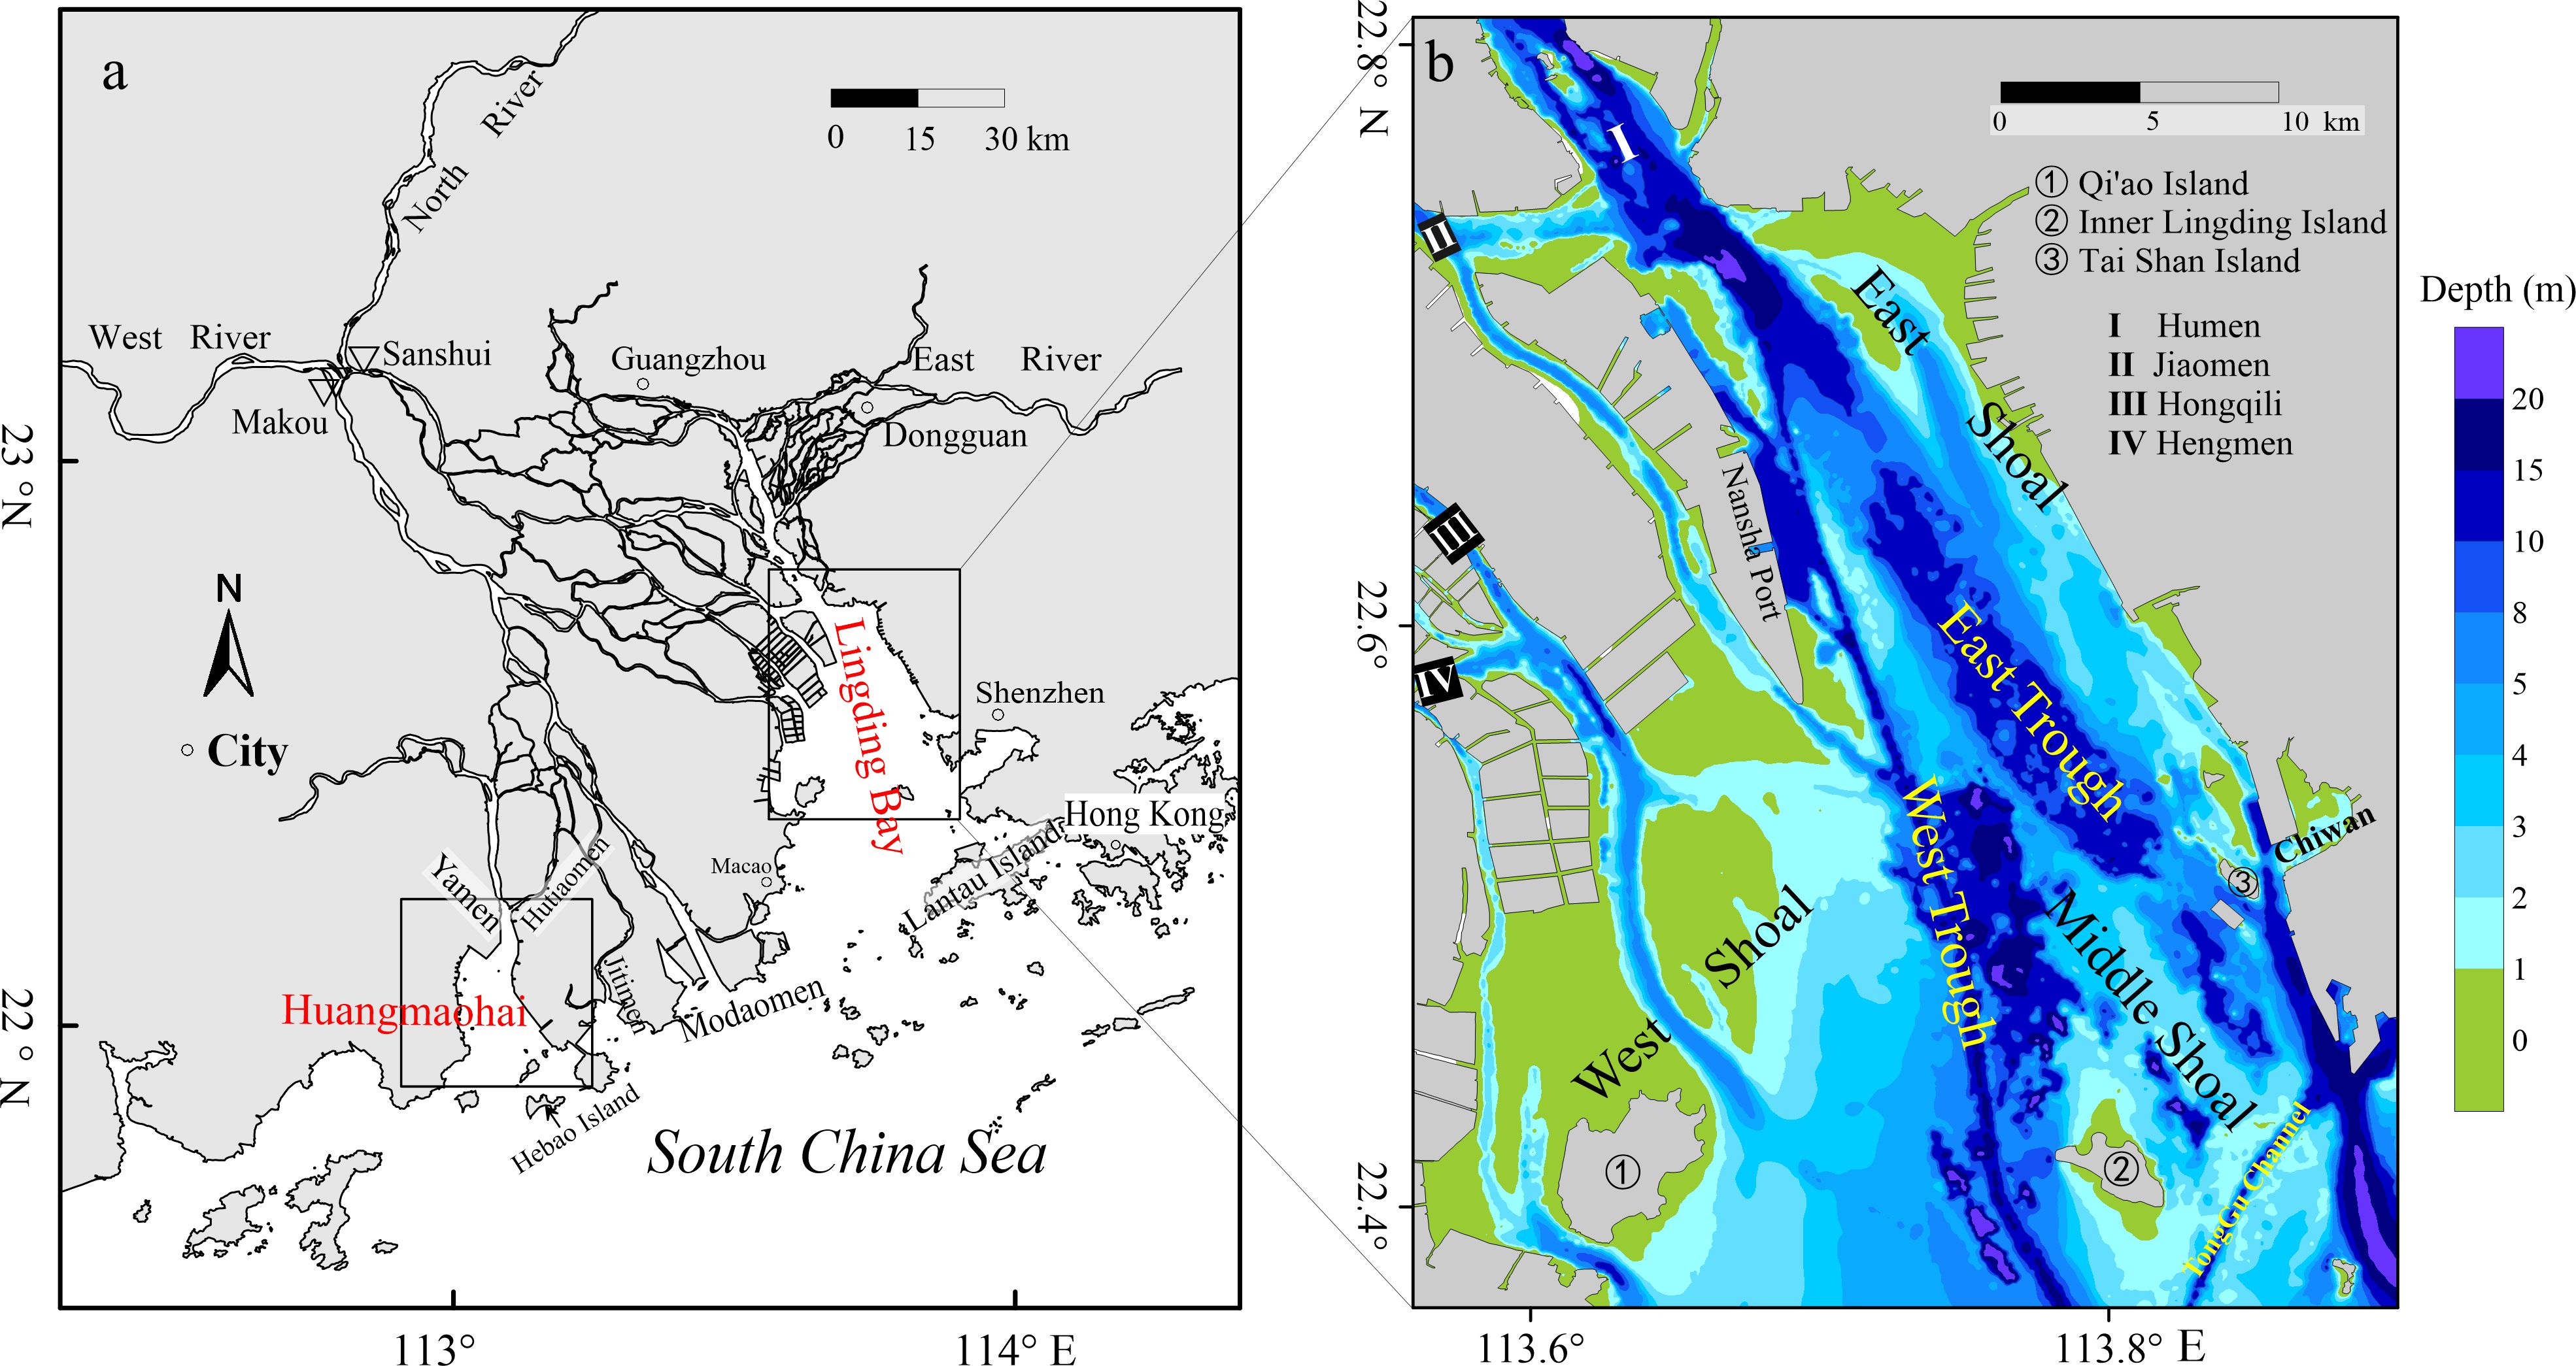
Figure 1. Map of the mainstream of the Pearl River Delta (PRD) and its connection with the South China Sea (A); bathymetry of LDB in 2018 (B).
The evolution of the LDB is predominantly influenced by runoff patterns and tidal currents. Tides enter this estuary are semi-diurnal type. The tidal range varies spatially from approximately 1.0 m near Lantau Island to 1.7 m close to the Humen outlet (Figure 1). The tidal range can be as low as 0.7 m during neap tides, while it may extend to 2 m during spring tides around Lantau Island (Zhang et al., 2019).
The LDB is divided by a line that connects Qi’ao Island and Inner Lingding Island. The region north of this line is the Inner LDB, while the area to the south is the Outer LDB. This work concentrates on the Inner LDB, henceforth simply termed the LDB. The underwater topography of the LDB consists of the following features from west to east: West Shoal, West Trough, Middle Shoal, East Trough, and East Shoal (Figure 1B).
The LDB has been profoundly influenced by human activities, which have modified both its planform and underwater topography (shoal–trough structures). First, the LDB has experienced the effects of land reclamation since the 1970s. Between 1979 and 2005, its shoreline expanded at an average rate of 16.8 m per year (Zhang et al., 2015). Reclamation efforts in 1998 and 2008 created nearly 200 km2 of new land (Wu et al., 2014), thereby contributing to an increased convergence of width along the bay. Second, dredging projects have affected the morphology of the troughs, particularly in the West Trough. Since 1959, the West Trough has been deepened from −5 m to −17 m by 2014 for shipping purposes (Wu et al., 2018). Third, watershed development initiatives—such as the operation of Longtan Dam starting in 2006—have had major effects on sediment transport into the PRD. Longtan Dam operation has reduced the sediment load by approximately 67%, from an annual average of 75 million tons during the period from 1954 to 2006 to 25.2 million tons per year between 2006 and 2016 (Wu et al., 2016b). Fourth, extensive sand mining activities within the Pearl River Basin have also influenced sediment input to this estuarine bay (Zhang et al., 2012). Under these cumulative human pressures, the LDB’s sedimentation rate drastically declined from an average of 16.6 mm/year during 1955–1964 to merely 1.6 mm/year between 1998 and 2008 (Wu et al., 2016b). Unregulated sand extraction at Middle Shoal has induced local depth changes of up to 5 m annually (Wu et al., 2016a), resulting in substantial resuspension of sediments around deep pits; this phenomenon generates temporary depocenters either upstream or downstream from mining areas (Chen et al., 2020). Driven by these human influences, the LDB has become more confined and deeper. The shoal–trough structures have abruptly transformed and reorganized within this system.
2.2 Topographic data
To analyze the morphological evolution of the three shoals and two troughs and to characterize the shoal–trough structures in the LDB, we collected five nautical charts from 1901, 1964, 1998, 2008 and 2018 (Table 1). These charts were digitized using ArcGIS software. To ensure consistency across the datasets, the theoretical bathymetric datum was employed to standardize the reference plane of all charts. Factors such as sea level rise were excluded during water depth data processing.
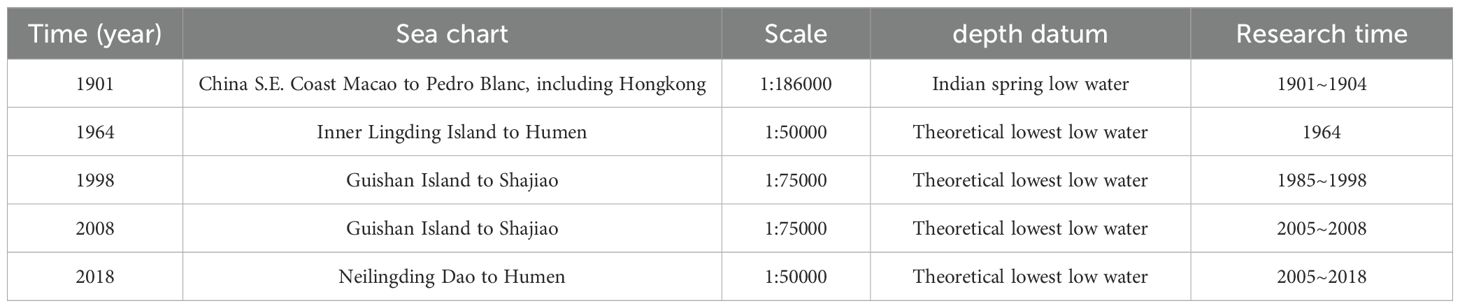
Table 1. Topographic data.
The digitized depth data were interpolated using the Kriging method, resulting in a uniform grid terrain file with a resolution of 50 m × 50 m to downgrade the landscape property variation between neighbouring cells (Sørensen and Seibert, 2007). This facilitated the construction of a digital elevation model (DEM) for the study area. Calculating the differences in the DEM values between consecutive years quantified the changes in the shoal–trough morphology over time. Positive differences indicate net sediment deposition, while negative differences represent erosion. Classifying these differences by their corresponding areas and time intervals, we can derive the annual average deposition (erosion) volumes and net deposition (erosion) intensity within the bay.
2.3 Depth–area spatial function
The analysis of depth–area evolution is a widely employed technique in geomorphological studies. This method captures the temporal evolution of depth distribution patterns and provides crucial insights into the morphological dynamics of estuarine systems. Depth distribution is a key index for characterizing estuary systems, reflecting their geomorphological structure and processes. In this work, the water depth h varies spatially and temporally, expressed as:
where (x, y) denotes the spatial coordinates and t represents time. To analyze the depth distribution, depths are categorized into n discrete levels. For each depth level hxi, a probability space function is constructed based on the area corresponding to a specific water depth. The probability Pxi of depth hxi at a given time is defined as:
where A(hxi) represents the area associated with the respective depth level, and the summation denotes the total area across all considered depth levels. The probability function adheres to fundamental properties of probability space:
For consistent and accurate comparisons, depth levels are classified at intervals of 0.5 m, aligning with the resolution of depths (in 1/4 fathom or 0.1 m) provided by the nautical charts used in the study. This interval ensures high fidelity in capturing bathymetric changes and is adequate for representing the deposition and erosion dynamics of the study area. Based on the depth range of the LDB, depths shallower than 3 m (no more than 0.6% of the total area) are classified into the 2.5–3 m depth level. Similarly, depths exceeding 22 m (no more than 0.1% of the total area) are categorized into the −21.5–−22 m depth level. Consequently, the total number of depth levels n is established at 50. This classification approach minimizes distortion in the shape of the depth distribution (Wu et al., 2018).
Following this method, two key curves are generated: (1) The depth–area distribution curve illustrates the probability density associated with each depth level, emphasizing dominant geomorphological units that occupy larger areas. (2) The cumulative frequency curve displays the cumulative probability distribution across different depth levels, offering insights into spatial variations in depths.
The peak values seen in the depth–area distribution curve correspond to geomorphological units with large areas. Collectively, these curves provide a comprehensive representation of both spatial and temporal variability in depth distributions and serve as a robust foundation for analyzing morphological evolution in the LDB.
3 Results
3.1 Definition of the shoal–trough structures
The identification of shoals and troughs is crucial for understanding their structure, evolution, and geomorphological dynamics. Using data from 1901 as an example (Figure 2), the depth–area distribution curve reveals five distinct peaks at 0 m, −2.25 m, −5.75 m, −9.25 m, and −21.75 m. The geomorphological units corresponding to these peak depths are illustrated in Figure 2C. The 0 m shoal is characterized as a high-elevation tidal shoal that spans both the eastern and western coasts. The East Shoal runs parallel to the coastline, while the West Shoal intersects the western coastline at an angle of approximately 90°–100°, indicating different formation mechanisms. Shoals located at −2.25 m are found along the periphery of the 0 m shoals, primarily within the intertidal zone near Inner Lingding Island. Notably, the Middle Shoal does not feature 0 m or −2.25 m shoals. The peak at −5.75 m encompasses the largest area of the 50 depth divisions (9%) and extends across the LDB, defining Middle Shoal’s distribution within the range of −2.25 to −5.75 m. The peak at −9.25 m corresponds to narrow geomorphological units situated near Humen and Inner Lingding Island; the −21.75 m peak relates to localized deeper geomorphological units.
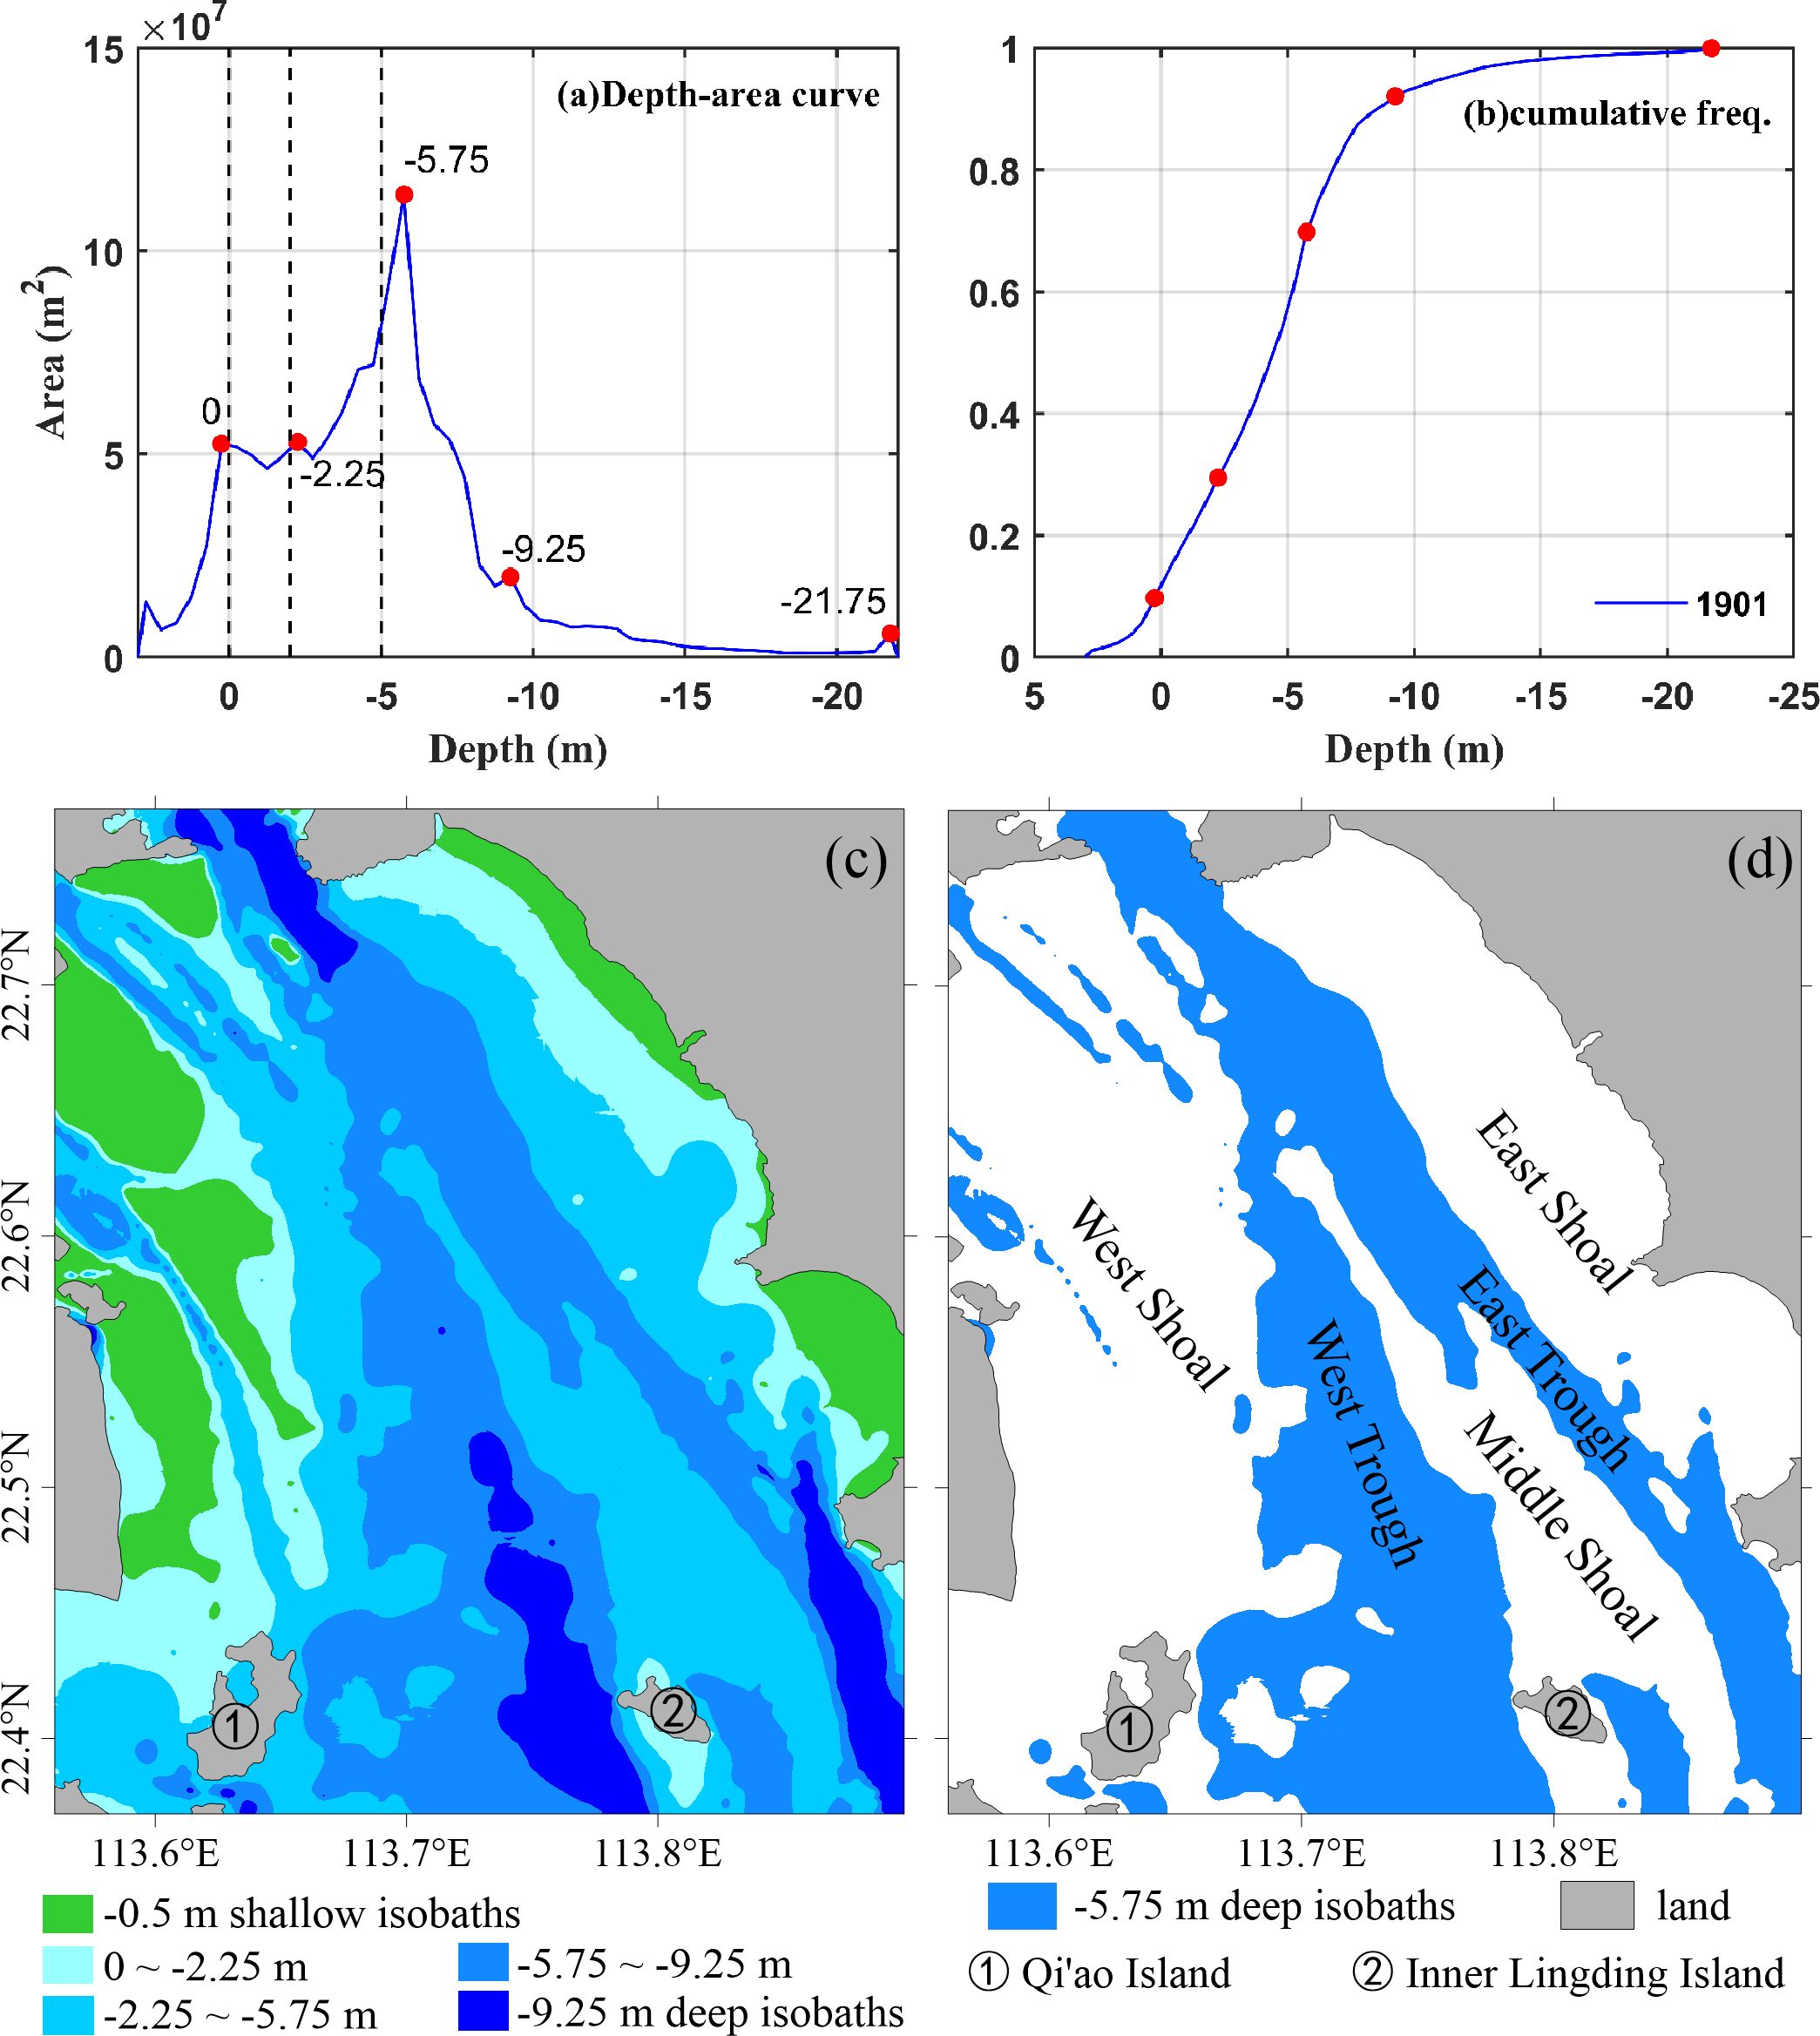
Figure 2. The depth-area distribution curve (A), cumulative frequency curve (B) of LDB in 1901; isobaths between peak depths (C) and area of the shoal and trough (D).
The first water depth peak isobath (−5.75 m) follows the longitudinal axis of the estuary and can be used to define shoals and troughs: First, shallow geomorphological units collectively termed shoals, which account for 65% of the total area of the estuary, are adjacent to both coastlines and to Inner Lingding Island. The West Shoal aligns with the runoff direction and sediment transport while physically intersecting to the coastline. The East Shoal runs parallel to the eastern coastline. Second, deep geomorphological units defined as troughs represent 35% of the estuarine area. These features are characterized by their narrowness and elongation closely aligned with the deeper isobaths around the −5.75 m isobath (Figure 2).
3.2 Characteristics of shoal–trough structures across different periods
Based on the depth–area spatial function, the depth–area distribution curves and the cumulative frequency curves for five periods from 1901 to 2018 are illustrated in Figure 3, and the distribution of different peaks are illustrated in Figure 4. The area peaks for different years correspond to the depths listed in Table 2. The ratio of the shoal area to the trough area is the shoal–trough ratio. Notably, the depth distribution consistently skews toward shallower values, with shallow areas constituting the majority.
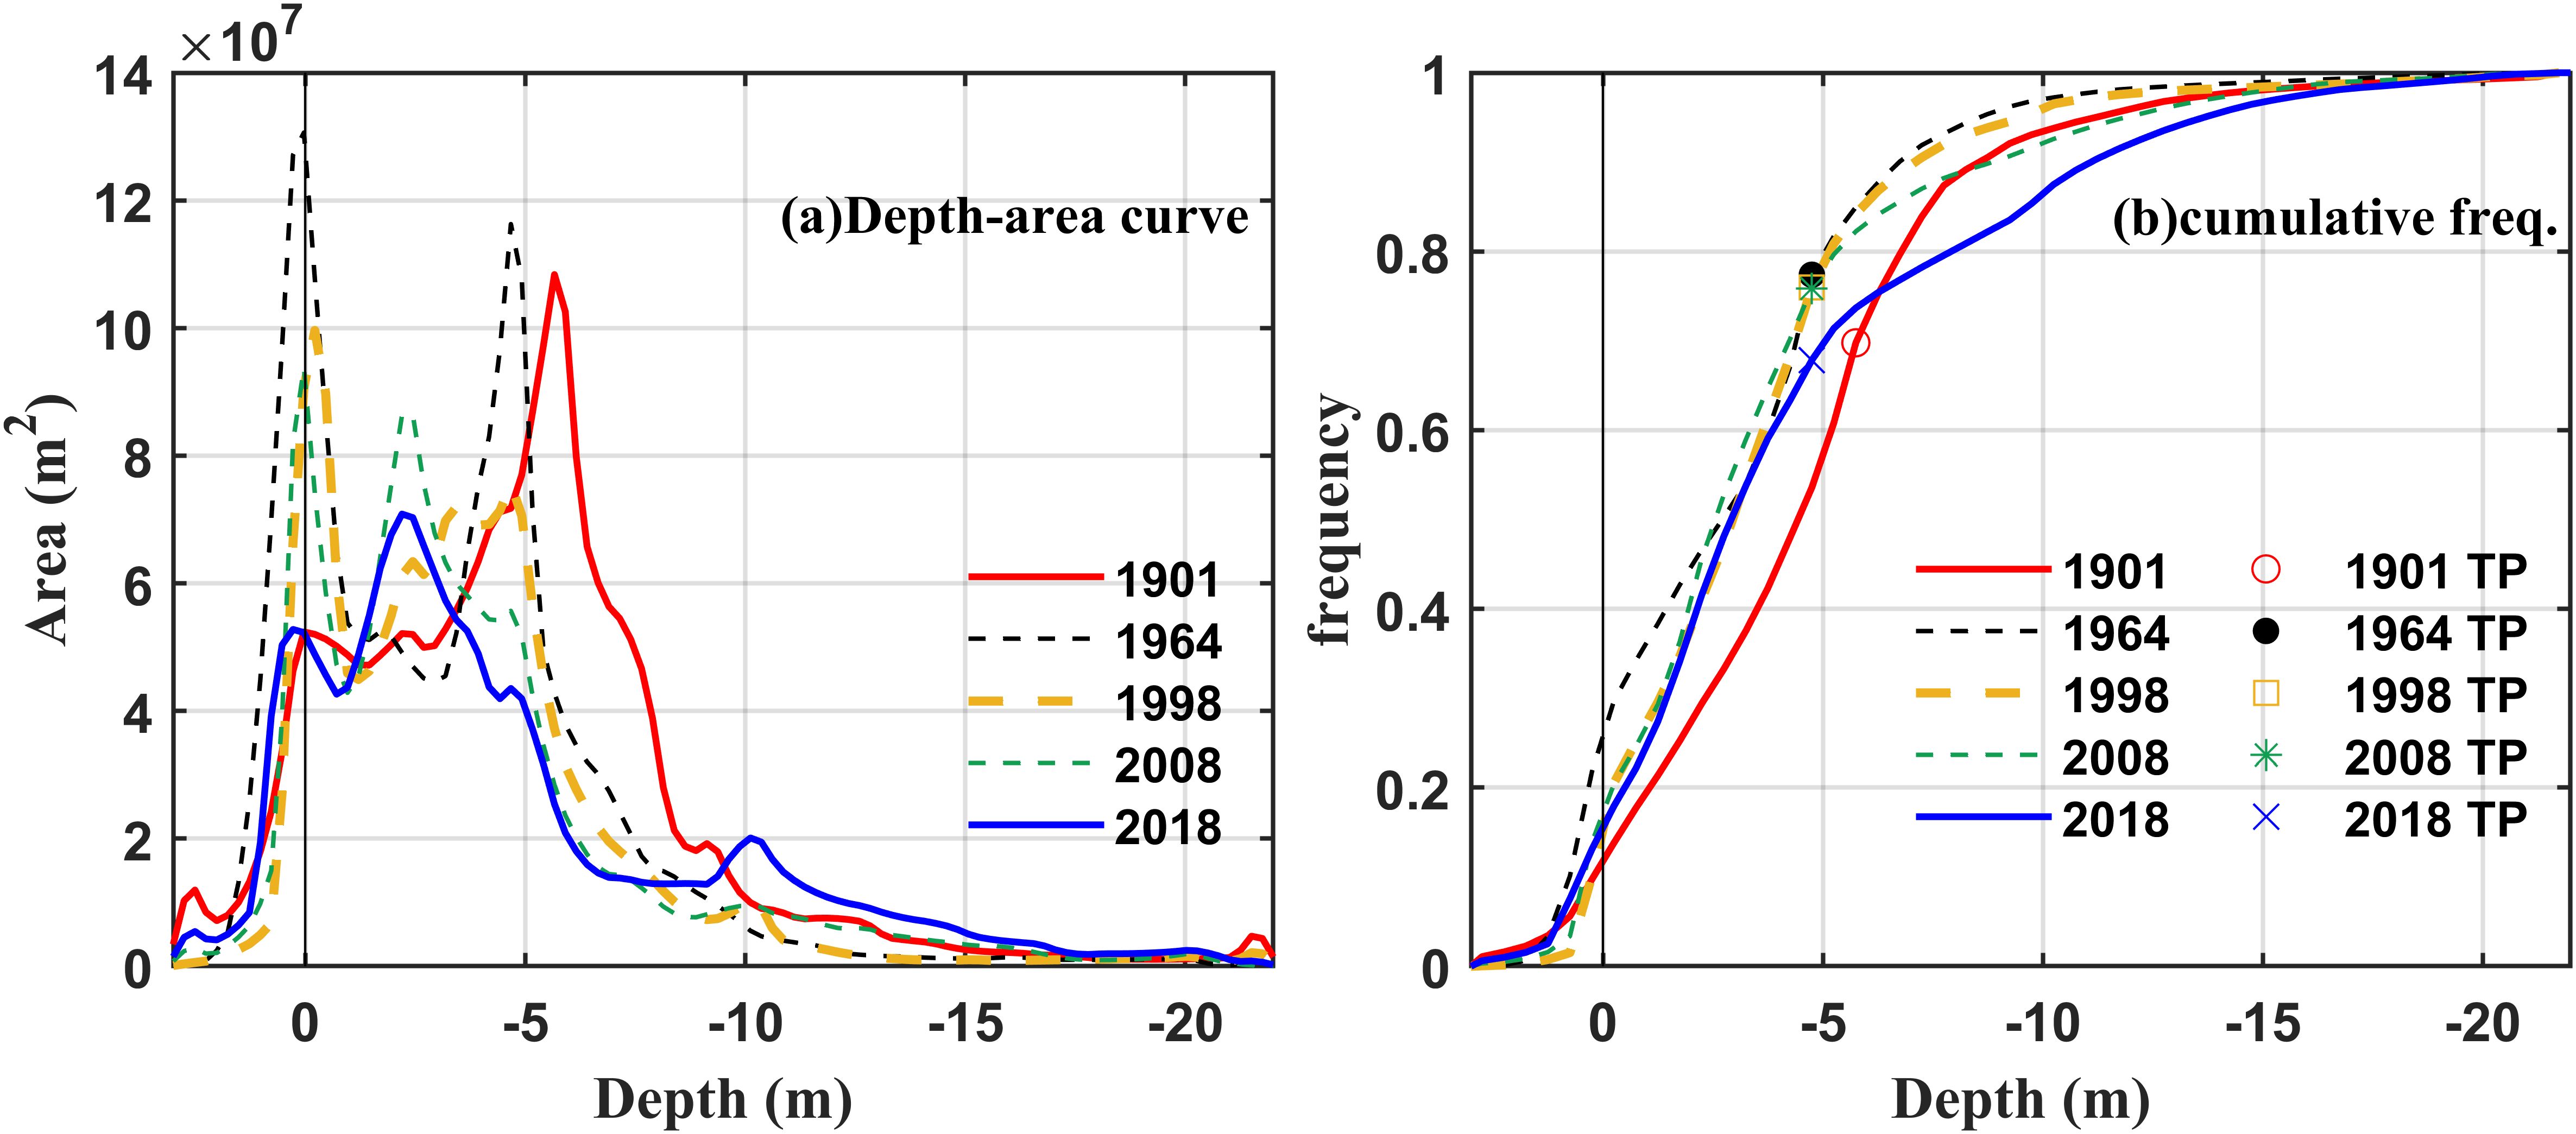
Figure 3. Depth-area distribution curve and cumulative frequency curve of each year (depth-area distribution curves have been smoothed).
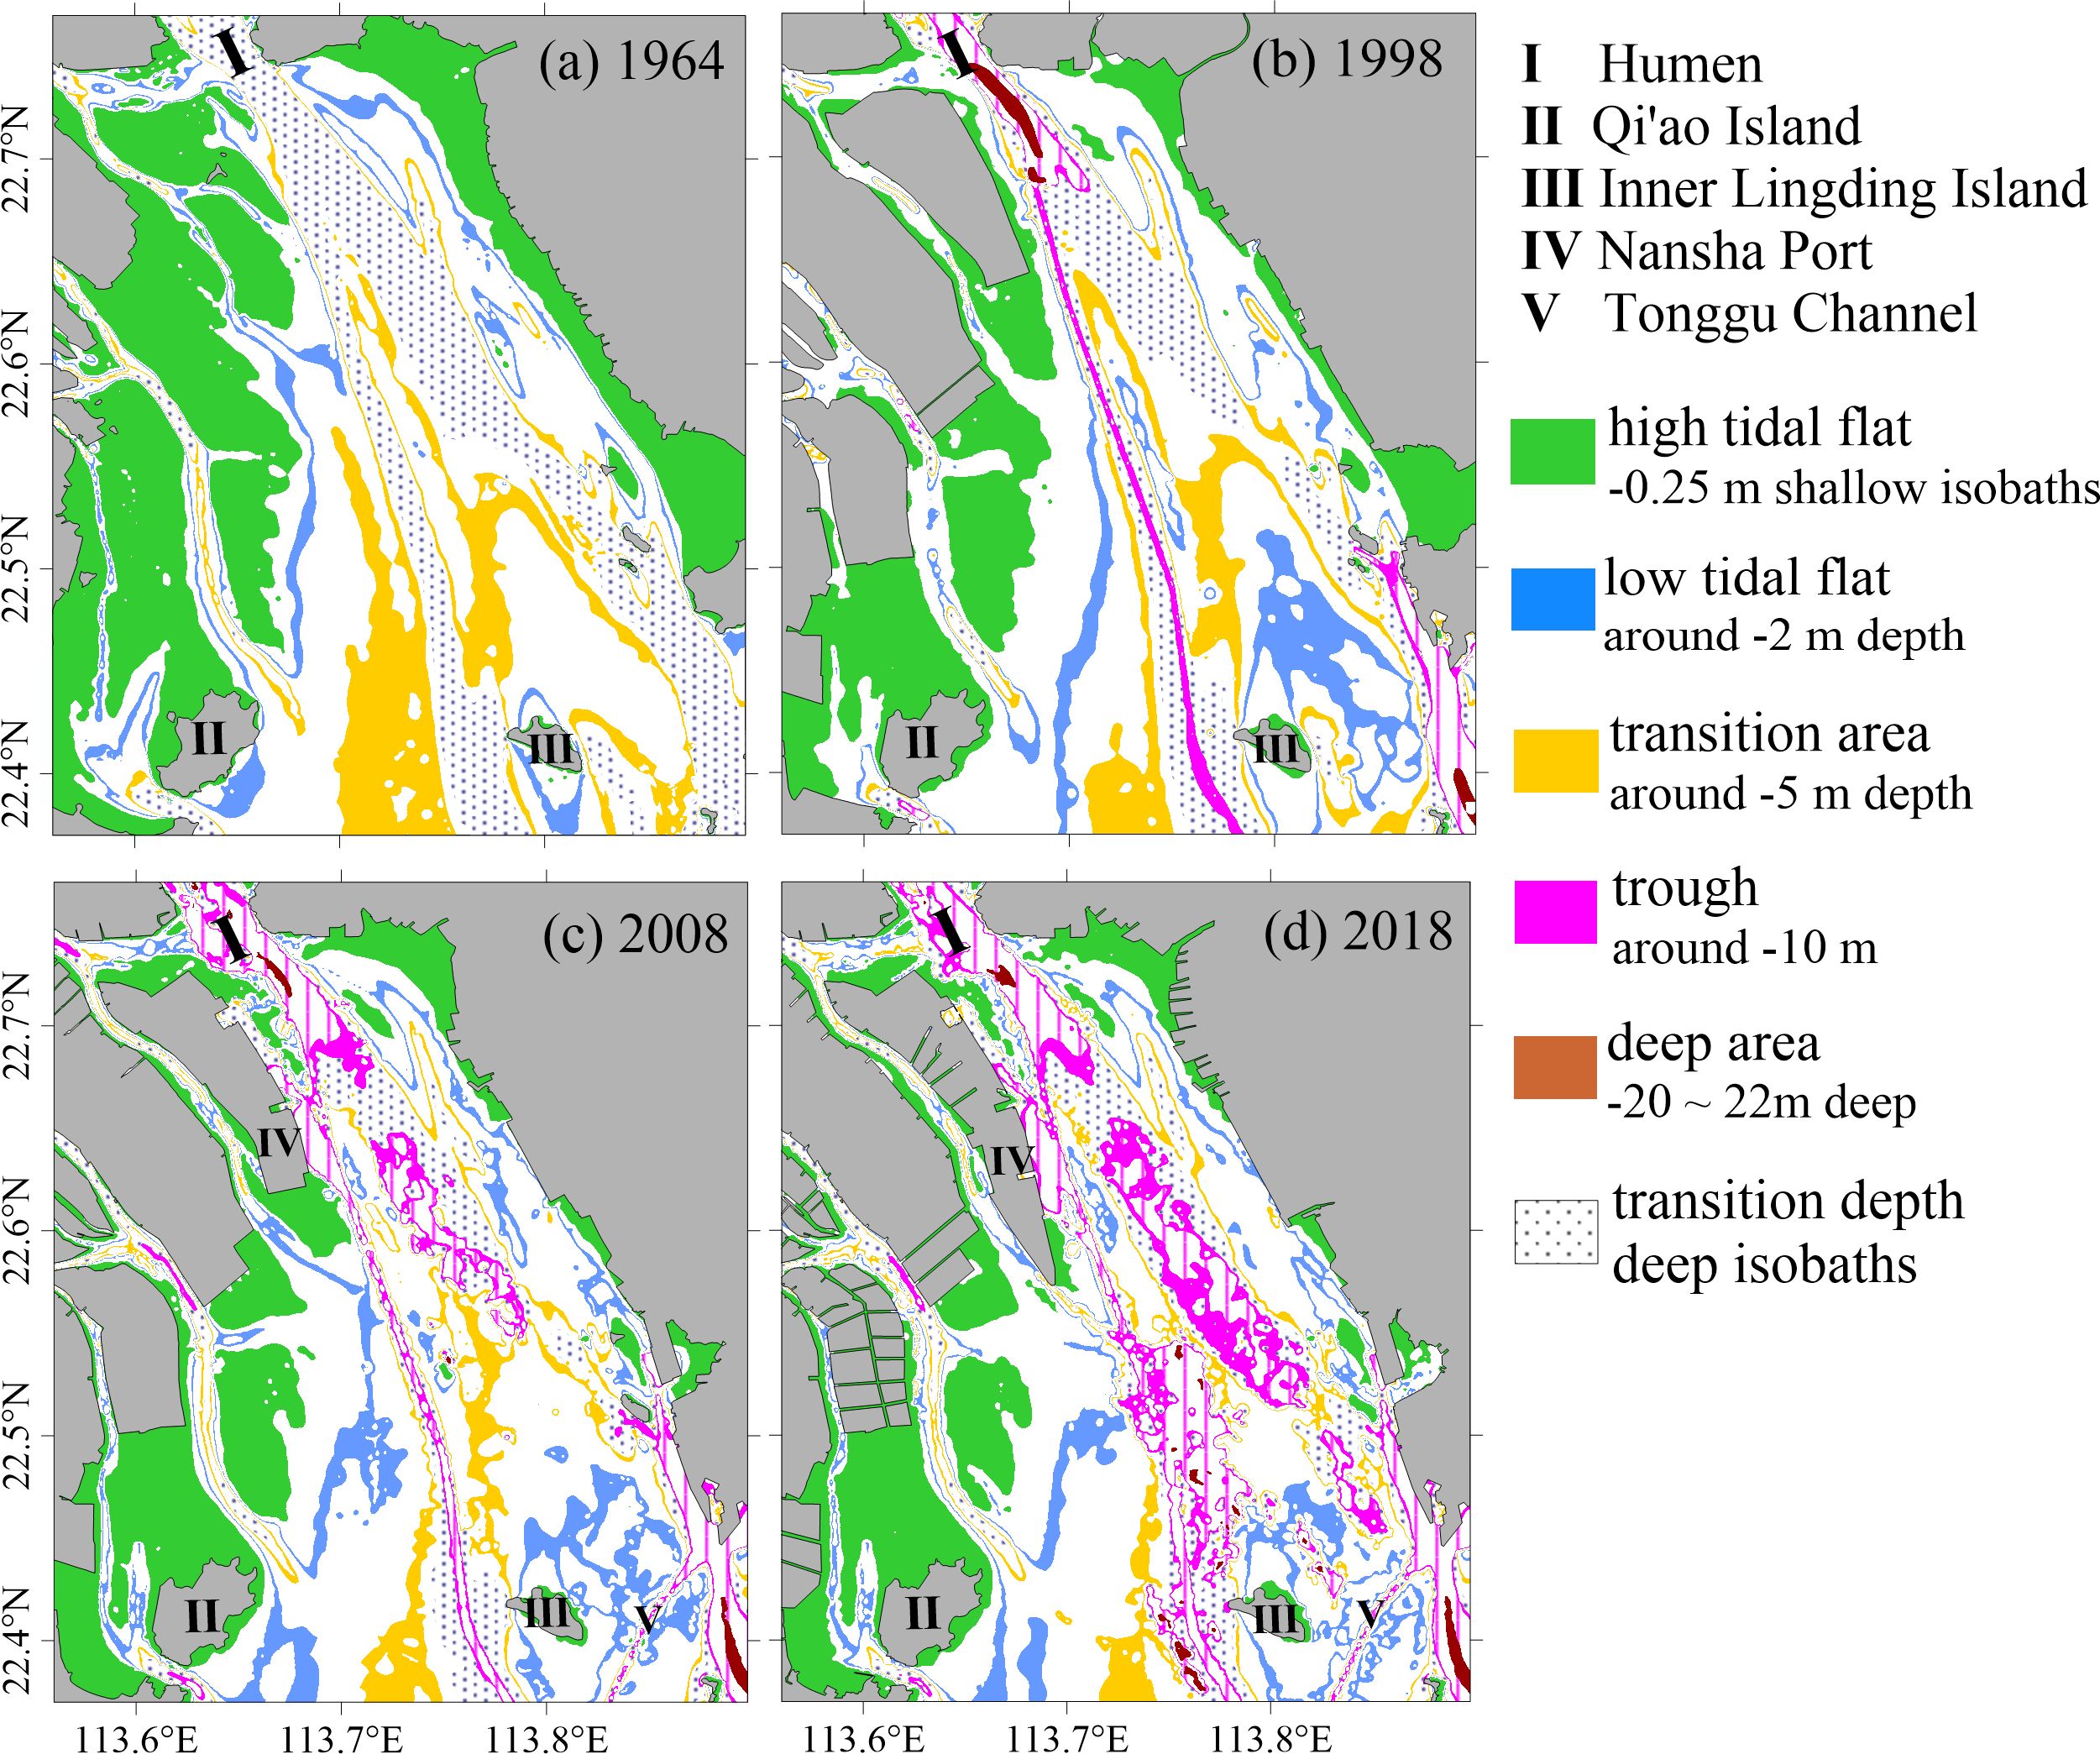
Figure 4. Implement of the peak depths in LDB in the year of 1964, 1998, 2008 and 2018.
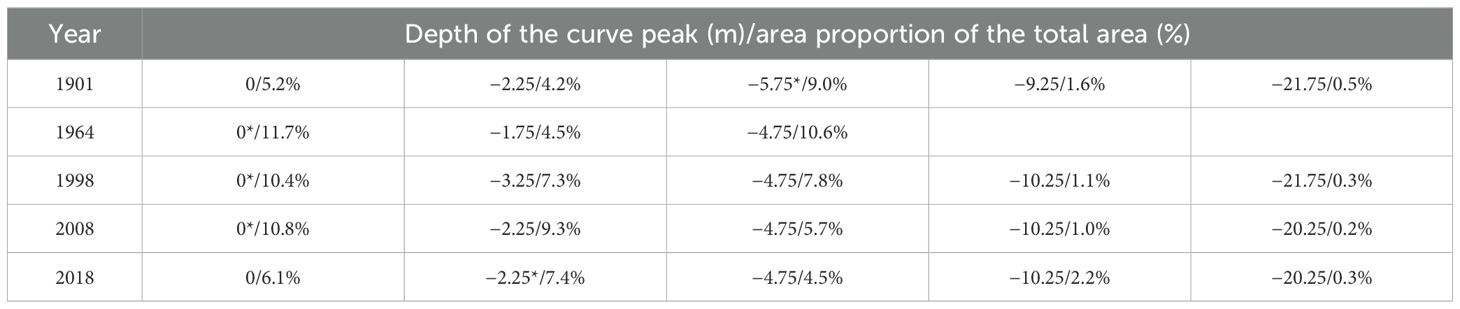
Table 2. Depth of the curve’s peak and its percentage (‘*’ stands for the peak depth with the largest area).
3.2.1 The shoal–trough structures in 1964
The depth–area distribution curve for 1964 reveals three peaks at 0 m, −1.75 m, and −4.75 m; no peaks are seen at greater depths. The area at a depth above 0 m accounts for approximately 26.7% of the total area, covering an expanse of 292.9 km2, which corresponds to the dominant shoal (the high tidal flat). This shoal is distributed along both the western and eastern coasts of the estuary; however, its presence is minimal within Middle Shoal. Specifically, it constitutes approximately 19.8% of the total area of West Shoal and 6.8% within East Shoal. The second peak at −4.75 m encompasses an area measuring 116.3 km2 (10.6%). Based on the depth–area spatial function and the typical characteristics of shoals and troughs, this second peak at −4.75 m is identified as the critical depth for analysis purposes. The third peak corresponds to a shallow depth of −1.75 m, found at the edge of the 0-m depth, representing a low tidal flat. The shoal–trough ratio for the entire LDB in 1964 is 2.45.
3.2.2 The shoal–trough structures in 1998
In 1998, the depth–area distribution curve exhibited five peaks at 0 m, −3.25 m, −4.75 m, −10.25 m, and −21.75 m. The peak at 0 m is still the most prominent, with the 0 m shoal accounting for approximately 18% of the area of the LDB, or 99.6 km2. This high tidal flat developed along both the eastern and western coasts of the estuary, representing 13.8% in the West Shoal and 3.9% in the East Shoal, while exhibiting negligible distribution within the Middle Shoal. The second peak at −4.75 m is in the central region of the LDB. The third peak at −3.25 m is concentrated northeast of Inner Lingding Island (primarily within the Middle Shoal). The fourth peak at −10.25 m corresponds to a typical trough within the West Trough with an approximate width of 300 m. The fifth peak at −21.75 m covers merely 0.3% of the total area and lies within the deep horizontal gently sloping section of the cumulative frequency curve. It is found exclusively in Humen and the southern part of the East Trough. Depths shallower than −4.75 m fall within the shallow horizontal gently sloping section of the cumulative frequency curve; thus, the second peak at −4.75 m is the critical depth, with shoal areas shallower than −4.75 m and trough areas deeper than −4.75 m. Defined by the depth of −4.75 m, the shoal–trough ratio in 1998 is 2.70.
3.2.3 The shoal–trough structures in 2008
In 2008, the depth–area distribution curve had five peaks at depths of 0 m, −2.25 m, −4.75 m, −10.25 m, and −20.25 m. The first peak at 0 m represents 10.8% of the total area and corresponds to high tidal flats that developed along the eastern and western coasts of the estuary; this area has decreased to 93.8 km2 compared to its extent in 1998. The second peak at −2.25 m is associated with low tidal flats and accounts for 9.3% of the total area; these are distributed around Inner Lingding Island. The third peak at −4.75 m covers 5.7% of the total distribution and extends throughout the LDB region. The fourth peak at −10.25 m lies within the deep horizontal gently sloping section of the cumulative frequency curve. This isobath is characterized by its narrow and trough-like features, distributed along the western side of Nansha Port, near Humen, the Tonggu Channel, and the southern part of the East Trough. The fifth peak appears at a depth of −20.25 m and comprises only 0.2% of the total area; it is only found in Humen and the southern part of the East Trough within deep horizontal gently sloping section on the cumulative frequency curve. Defined by the depth of −4.75 m, shoal areas form approximately 73% and trough areas account for approximately 27%. The shoal–trough ratio stays stable at 2.70.
3.2.4 The shoal–trough structures in 2018
The peak depths seen in 2018 are consistent with those in 2008, although the proportion of the area at a depth of 0 m has decreased to 6.1%, comprising 5.1% in the West Shoal and 0.9% in the East Shoal. The highest peak corresponds to a depth of −2.25 m, with an area proportion of 7.4%. The peak at −4.75 m, shows a decrease in area proportion to 4.5%, and extends through the LDB. The fourth peak at −10.25 m has an increased area proportion of 2.2% compared to this peak in 2008, resulting in a cumulative frequency that reaches 88% (see Figure 3B), indicating an expansion of the trough area. The fifth peak at −20.25 m covers only 0.2% of the total area and is situated within the deep horizontal gently sloping section of the cumulative frequency curve, distributed only in the southern part of Humen and in the troughs. Geomorphological units shallower than −4.75 m are concentrated within the shallow, gently sloping sections represented on the cumulative frequency curve. The shoal–trough structures are delineated by the threshold of −4.75 m. The shoal areas account for approximately 65% and the trough areas form approximately 35%. The shoal–trough ratio in 2018 has decreased to 1.86.
3.3 Evolution of erosion and deposition in the shoal–trough system
The evolution of erosion and deposition in the LDB was analyzed using the shoal–trough structures defined by the depth–area spatial function across five different periods from 1901 to 2018 (Figure 5). The results for the LDB, along with its geomorphological subunits, are summarized in Table 3.
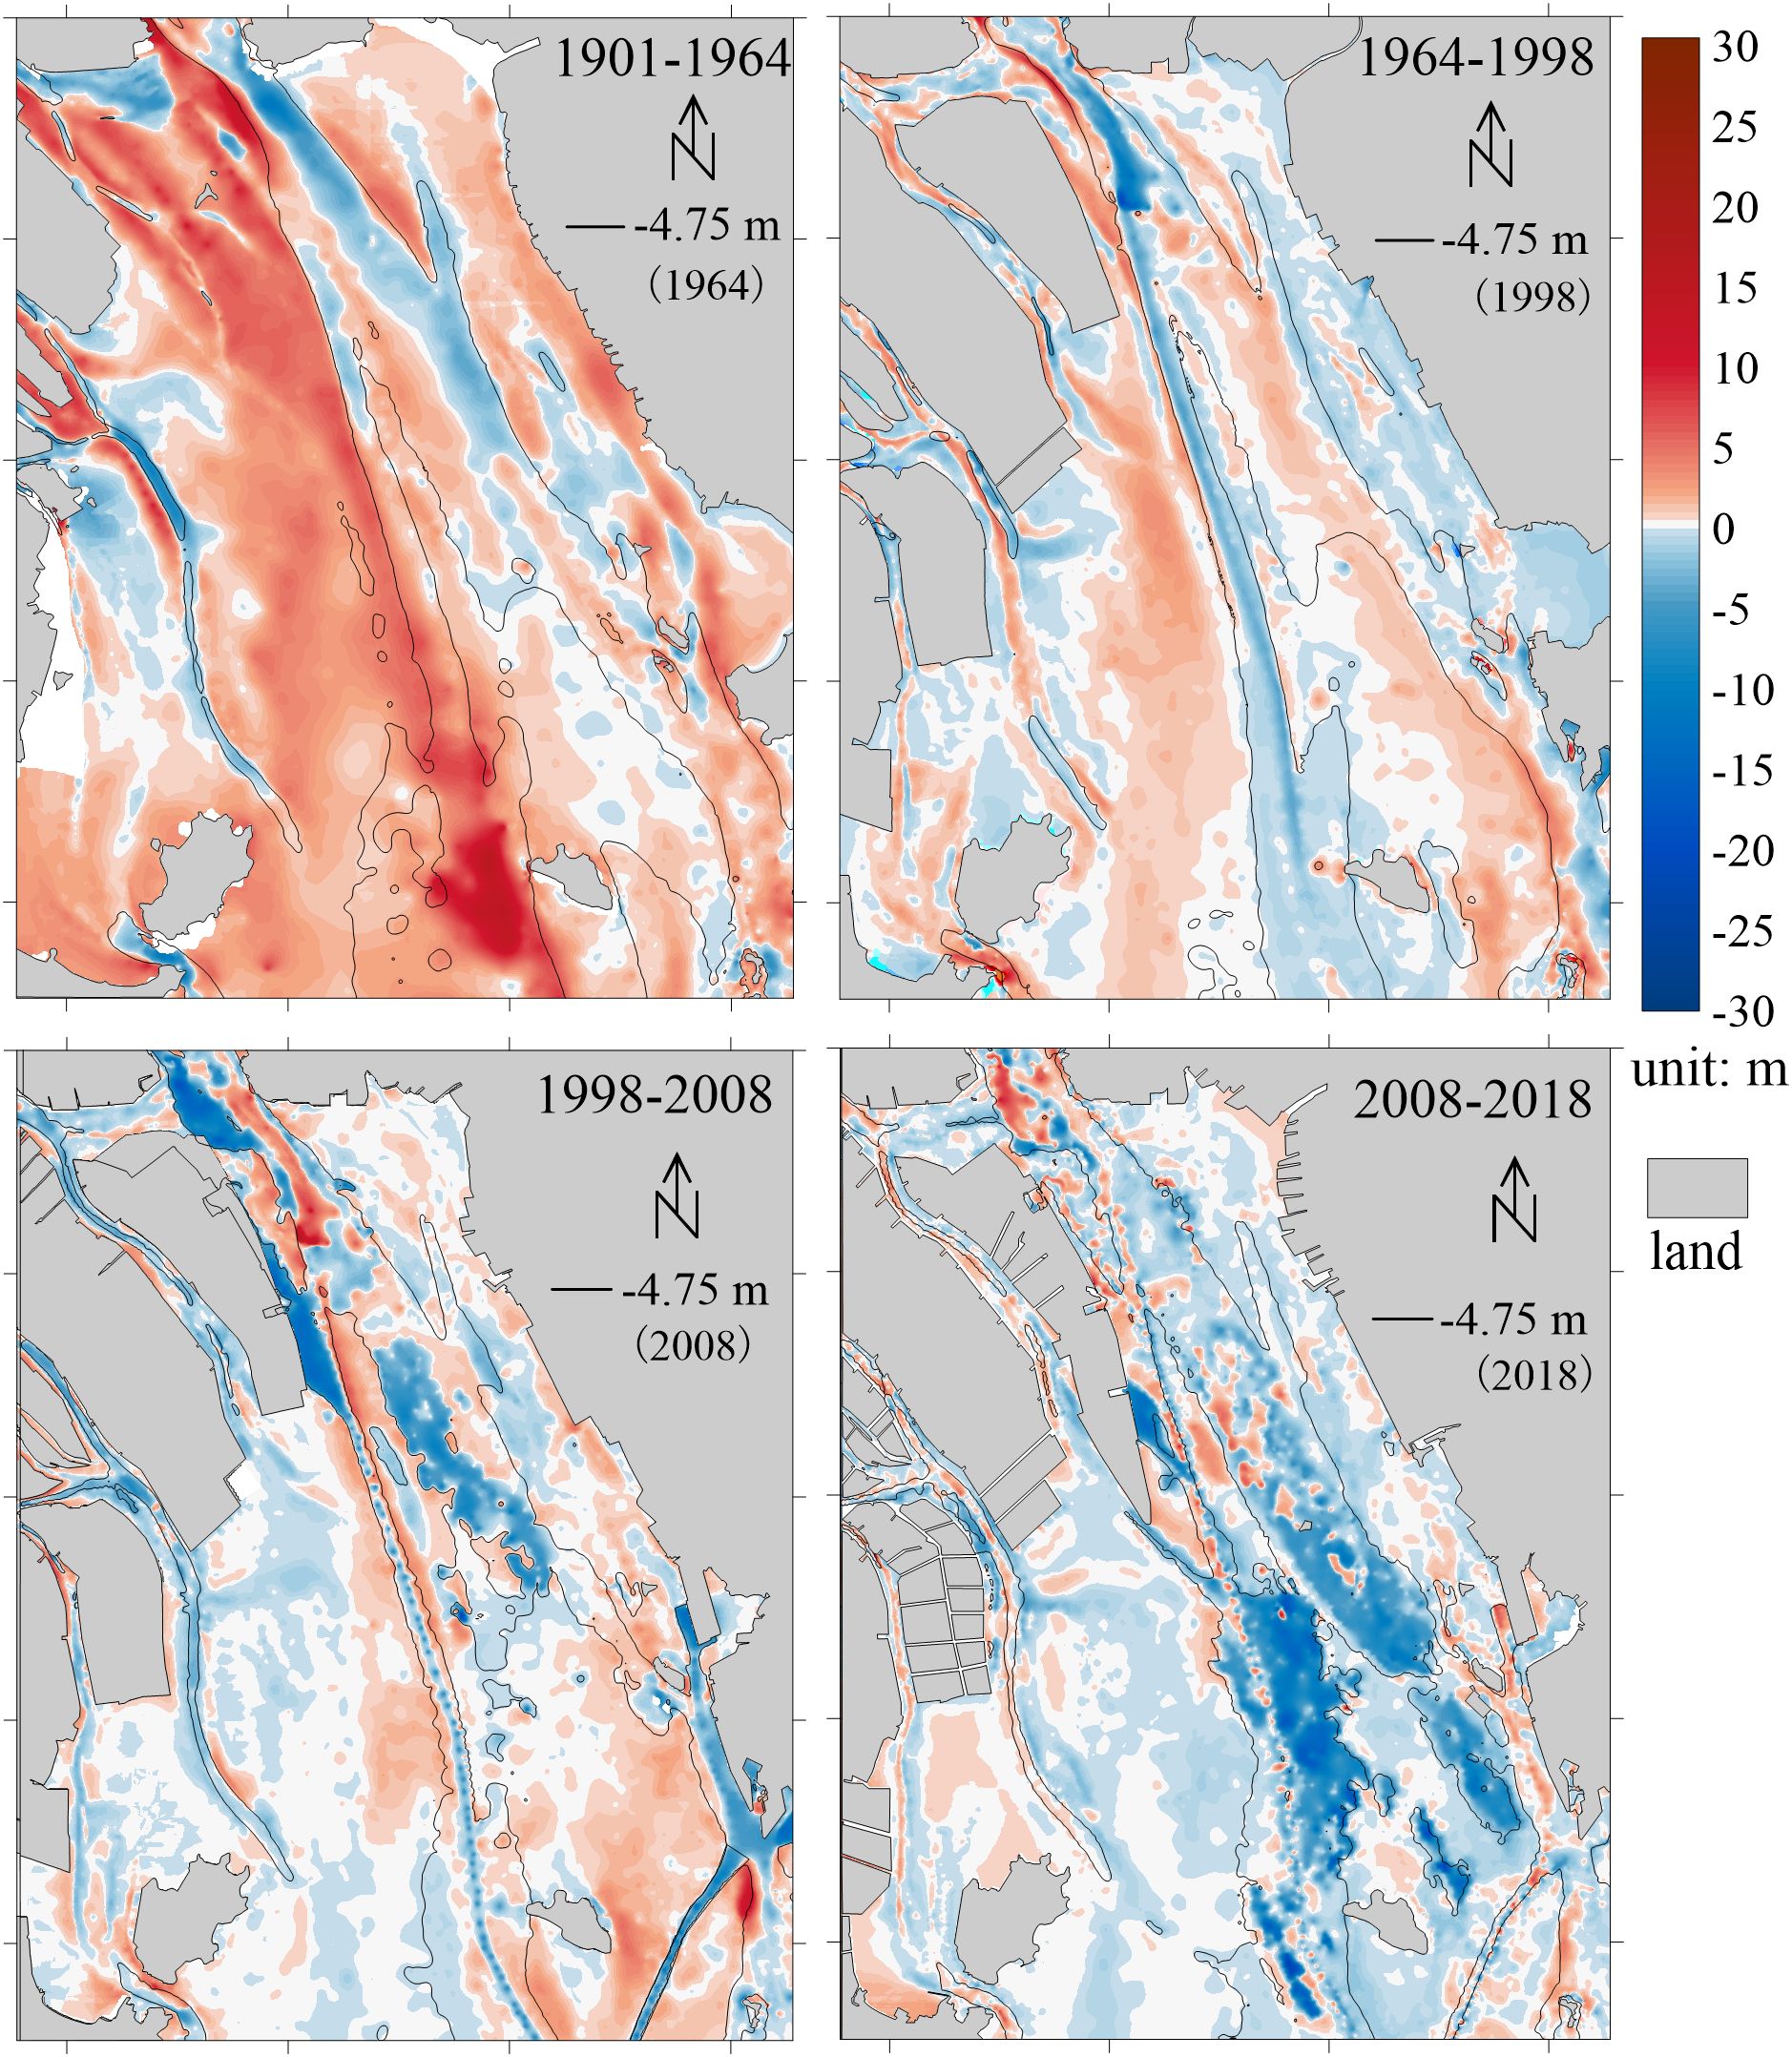
Figure 5. Bathymetric changes in the Lingding Bay in the period 1901-2018 (The solid black line is the isobath of the shoal and trough boundary).
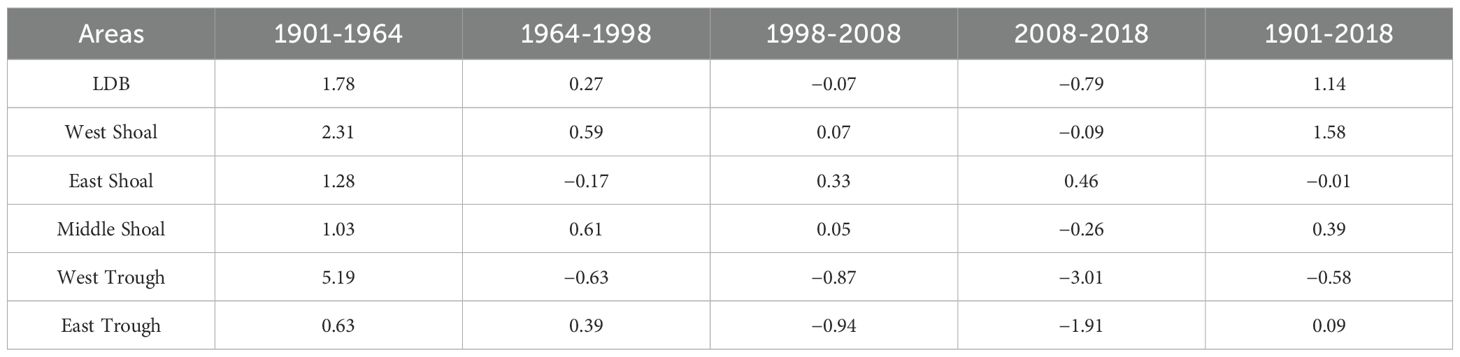
Table 3. The bathymetry change rate of LDB and the units (m).
From 1901 to 1964, the LDB was in a depositional state, interspersed with localized erosion (Figure 5). The average deposition thickness during this period was 1.78 m, resulting in a total deposition volume of approximately 2.08 billion m³. Notably, the deposition rates varied significantly among different shoals and troughs. The West Shoal recorded an average thickness of 2.31 m and a volume totaling 1307 M m3, and the maximum deposition thickness exceeded 4 m. The West Trough saw the highest deposition, with a thickness of 5.19 m and a volume totaling 348 M m3. In contrast, the Middle Shoal had an average deposition thickness of only 1.03 m and a corresponding volume of 145 M m3, while the East Shoal had a slightly greater deposition thickness at 1.28 m, with a deposition volume of 237 M m3. The East Trough had the least deposition (0.63 m, 84 M m3). Significant erosion occurred near Humen with a thickness reaching up to −10 m. Erosion also affected outflow channels within the West Shoal and the northern part of the East Trough, where erosional depths reached up to −6 m.
From 1964 to 1998, the intensity of deposition decreased, with most deposition areas receiving less than 2 m. Concurrently, erosion activity intensified, particularly in regions such as Humen, the West Trough, and the East Shoal. The overall depositional rate slowed, with an average deposition thickness of only 0.27 m and a total deposition volume of 263 M m3. In the West Shoal, there was a marked deposition reduction to just 0.59 m, corresponding to a deposition volume of 246 M m3. The West Trough experienced notable erosion characterized by an erosion thickness of −0.63 m and an erosion volume of 58 M m3. Similarly, the Middle Shoal experienced reduced deposition (0.61 m and 95 Mm3). The East Trough remained in a slight depositional state, with an average thickness decreasing to 0.39 m and a volume of 49 M m3. The East Shoal experienced minor erosion, with an average erosion thickness of −0.17 m. Notably, significant erosion happened along a belt extending from Humen to the outflow channels of the West Trough; here the erosion thickness ranged between −2 m and −10 m.
From 1998 to 2008, the overall patterns of erosion and deposition in the LDB system changed significantly. The shoals continued to accumulate sediment while the troughs experienced erosion, indicating a shift toward an erosional state within the LDB system, characterized by an average erosion thickness of −0.07 m. Most regions of the shoals experienced deposition, except for the outflow channels in the West Shoal, which showed localized erosion. The average deposition thickness of the West Shoal was 0.07 m, while the Middle Shoal experienced slightly less deposition with an average thickness of 0.05 m. A distinct erosion belt appeared near the Tonggu Channel, where the average erosion intensities reached approximately −5.12 m. The East Shoal demonstrated the highest deposition, with an average thickness of 0.33 m. Conversely, the West Trough eroded severely, reaching up to −15 m near the Nansha Port, with an average erosion thickness of −0.87 m. The East Trough also eroded, with an average erosion thickness of −0.94 m. The northern part of the East Trough showed erosion thicknesses of between −4 m and −8 m.
From 2008 to 2018, the LDB predominantly eroded, with an average erosion thickness of −0.79 m. The West Shoal experienced negligible changes (−0.09 m), while the troughs experienced significant deepening and widening, with erosion thicknesses of up to −15 m. The average erosion thickness reached −3.01 m in the West Trough and −1.91 m in the East Trough. The total erosion volume in the troughs was substantial, with the West Trough experiencing a loss of approximately 419 M m3 and the East Trough losing approximately 280 M m3. The Middle Shoal demonstrated an average erosion intensity of −0.26 m, characterized by some localized erosion pits. Only the East Shoal displayed overall deposition, with an average deposition thickness of 0.46 m.
3.4 Shoal–trough structure evolution and local transformation
3.4.1 Evolution of the shoal–trough structures and shifts of dominant geomorphological units
The depth–area distribution curves and cumulative frequency curves for each period (Figure 3) illustrate the dynamic evolution in the shoal–trough structures over time. From 1901 to 1964, the number of peaks in the depth–area curves decreased from five to three (Figure 3A), indicating a simplification of the shoal–trough configuration. The overall depth shallowed, as shown by a leftward shift from 1901 to 1964 in the cumulative frequency curve without deep-water peaks. During this interval, the area occupied by shoals increased while regions deeper than −9 m diminished, reflecting localized transitions in the shoal–trough structures.
From 1964 to 1998, although the depth–area distribution curve remained left-skewed, which means shallow depth peaks contain larger areas. There was an increase in the number of peaks, with two new deep-water peaks emerging. Concurrently, shoal areas contracted while the trough proportion expanded; deeper units experienced erosion leading to enhanced differentiation of depths between shoals and troughs. The cumulative frequency curve for 1998 skewed slightly right at depths deeper than −5 m, indicative of erosion in deep-water areas (troughs), with both high and low tidal flats experiencing sediment loss.
By 2008, the depth–area curve kept a left-skewed distribution; however, the shoal areas corresponding to shallow-water peaks increased compared to 1998. The cumulative frequency curve skewed left for depths ranging from −2 m to −4 m, while it was right-skewed for depths deeper than −5 m. This observation indicates an expansion of low-tidal shoals and the ongoing erosion of deep-water units. By 2018, the depth–area curve had shifted slightly toward a right-skewed distribution, signifying further erosion in both shoals and deep-water units. The cumulative frequency curve became increasingly right-skewed, especially between depths of −4 m and −15 m, highlighting significant erosion in both low-tidal shoals and deep-water units.
Throughout this period, the highest peak underwent two transitions: initially from −5.75 m in 1901 to 0 m in 1964, followed by a shift to −2.25 m in 2018. These transitions underscore the topographical evolution and suggest that relying solely on the highest peak is insufficient to accurately delineate the shoal–trough structures.
3.4.2 Local transformations between shoals and troughs
Erosion and deposition have caused localized transitions between shoals and troughs over various periods. These transitions occurred between each shoal and its adjacent troughs. The areas and volumes of these shoals and troughs were quantified, along with their rates of change (Table 4). The volume of a shoal is defined as the sediment above the critical depth, while the volume of a trough is its capacity for water below this critical threshold.
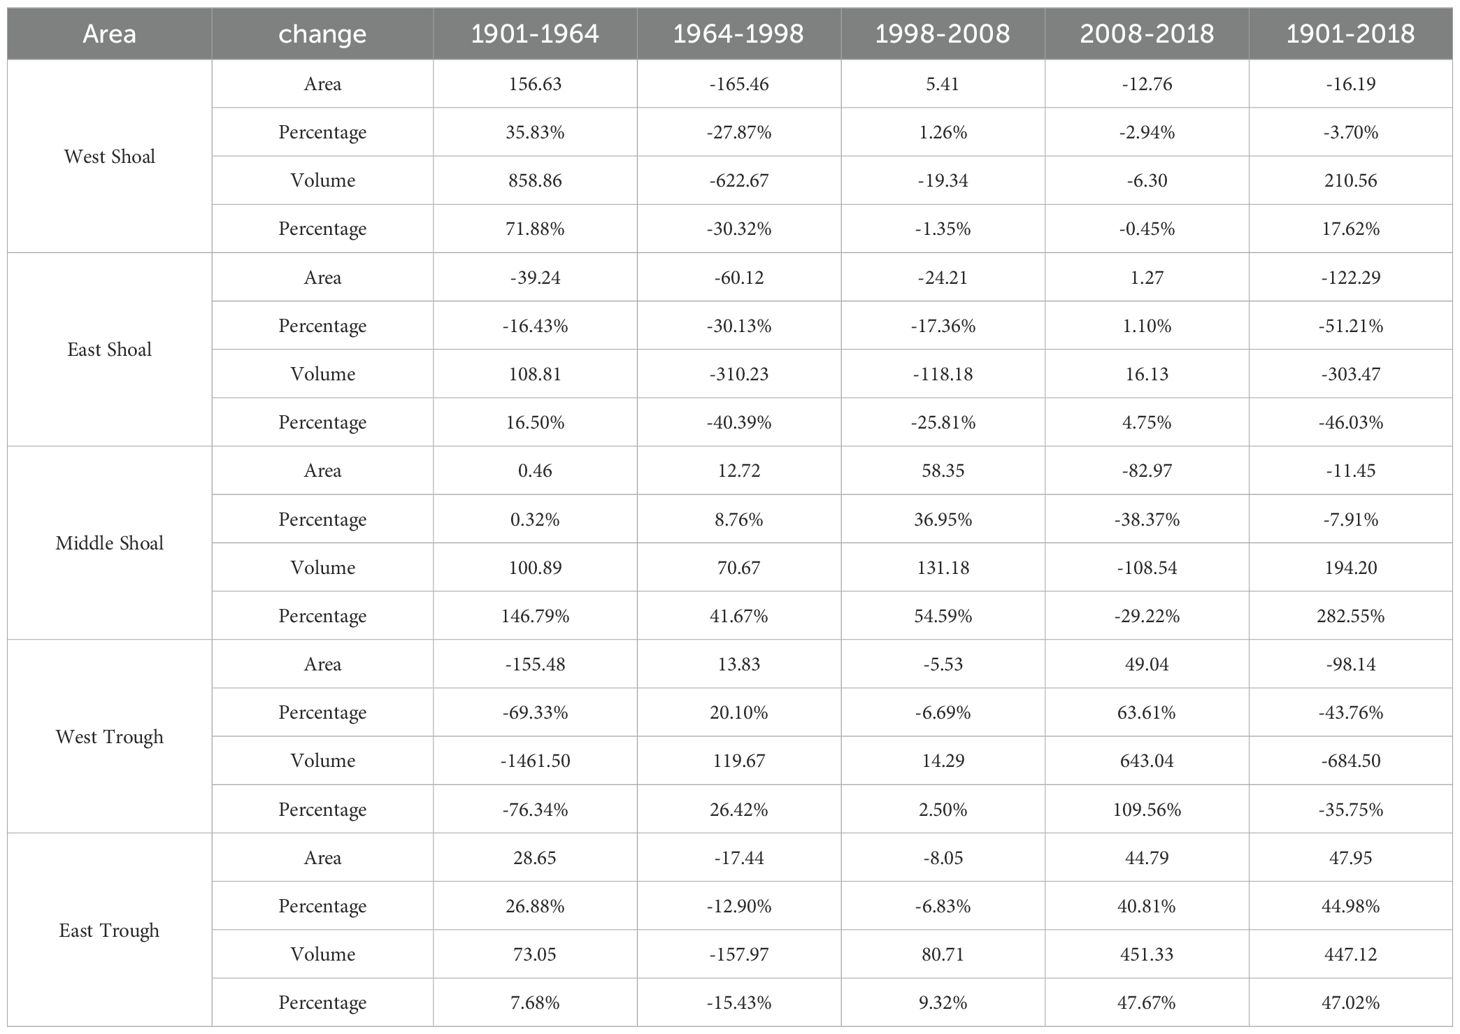
Table 4. Changes in area (in km²) and volume (in Mm³) of the three shoals and two troughs at different periods.
The localized transitions between the West Shoal and the West Trough are detailed as follows: from 1901 to 1964, the area of the West Trough was significantly reduced (by 155.48 km2 or 69.3%), while the West Shoal expanded by 156.63 km² (35.8%) (Figure 6). The width of the West Trough decreased by up to 8 km, leading to large areas in the southeastern part becoming shallower and transitioning locally into shoals. From 1964 to 1998, the boundary between these features remained relatively stable; however, during this period, the West Shoal area diminished by 165.4 km². Between 1998 and 2008, stability persisted at their boundary with changes in area staying less than 6 km2 and volume fluctuations within 2.5%. From 2008 to 2018, the West Shoal’s area was reduced by approximately 12.76 km² alongside an expansion in the West Trough by approximately 49.04 km2, concurrently, slight westward shifts in the boundary led some regions of the West Shoal to transition into troughs.
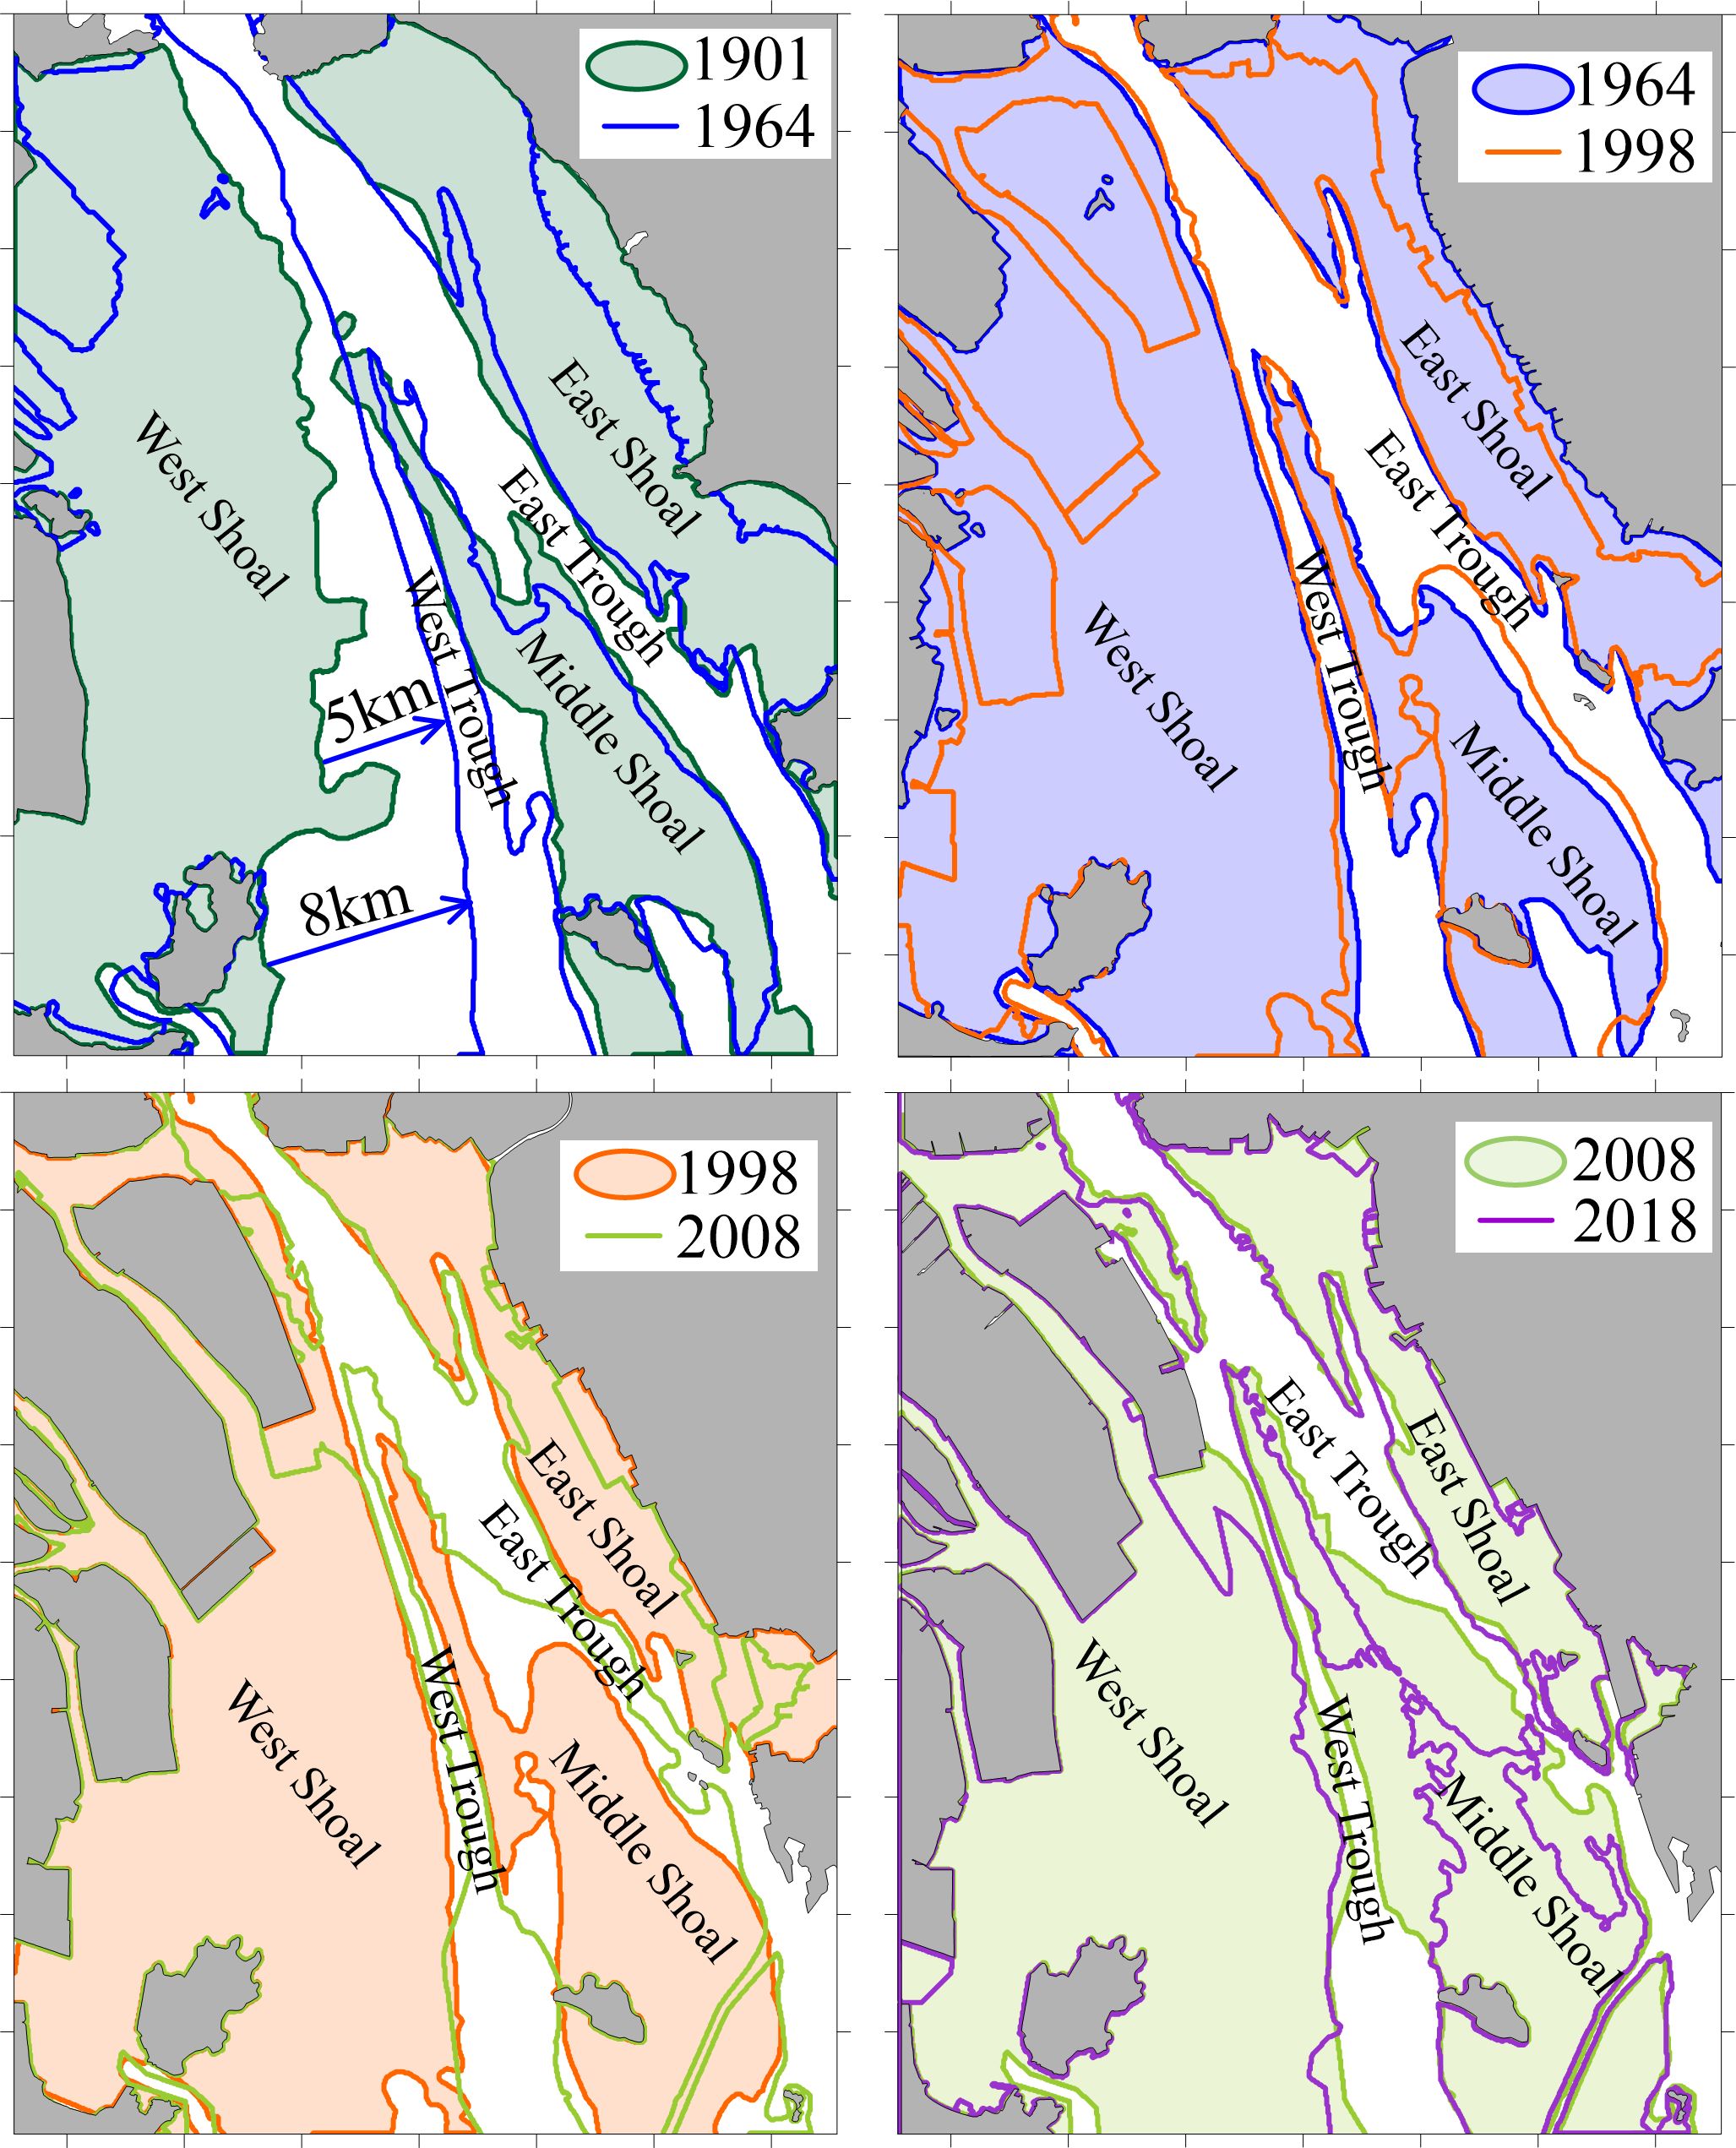
Figure 6. The evolution of three shoals and two troughs.
The localized transitions between the Middle Shoal and the two troughs occurred as follows: from 1901 to 1964, localized deposition in the West Trough expanded the Middle Shoal, while certain sections of the Middle Shoal transitioned into the East Trough. The overall area of the Middle Shoal remained relatively stable, while the East Trough expanded by 28.65 km². From 1964 to 1998, there was a slight expansion of the Middle Shoal, with its area increasing by 8.76%. Between 1998 and 2008, portions of both troughs transitioned into the Middle Shoal, leading to an increase in its area of 58.35 km2. From 2008 to 2018, the deepening of the Middle Shoal facilitated its transition into troughs, resulting in a reduction of its area by 82.97 km². Concurrently, the widths of the West Trough and the East Trough increased, and the central part of the Middle Shoal began to approach connectivity with troughs.
The boundary between the East Shoal and the East Trough had a relatively stable configuration from 1901 to 2018. The area of the East Shoal steadily declined until 2008, at which point it saw a slight increase of 1.27 km2. The most significant reduction in the East Trough occurred between 1964 and 1998, when its area diminished by 17.44 km2, primarily because of reclamation and engineering projects along the eastern coastline.
4 Discussion
4.1 Phenomenological structure of shoals and troughs: geomorphological and dynamic characteristics
4.1.1 Phenomenological structure of shoal and trough
The depth–area spatial function effectively captures the dominant landforms and stable geomorphological structures of the LDB. The areas at each individual peak’s depth correspond to a primary geomorphological unit, with its respective proportion indicating dominance. The overall cumulative frequency curve of depth–area reveals three distinct types of geomorphological structures: two stable units (shoal and trough) and a critical transitional unit (Figure 7).
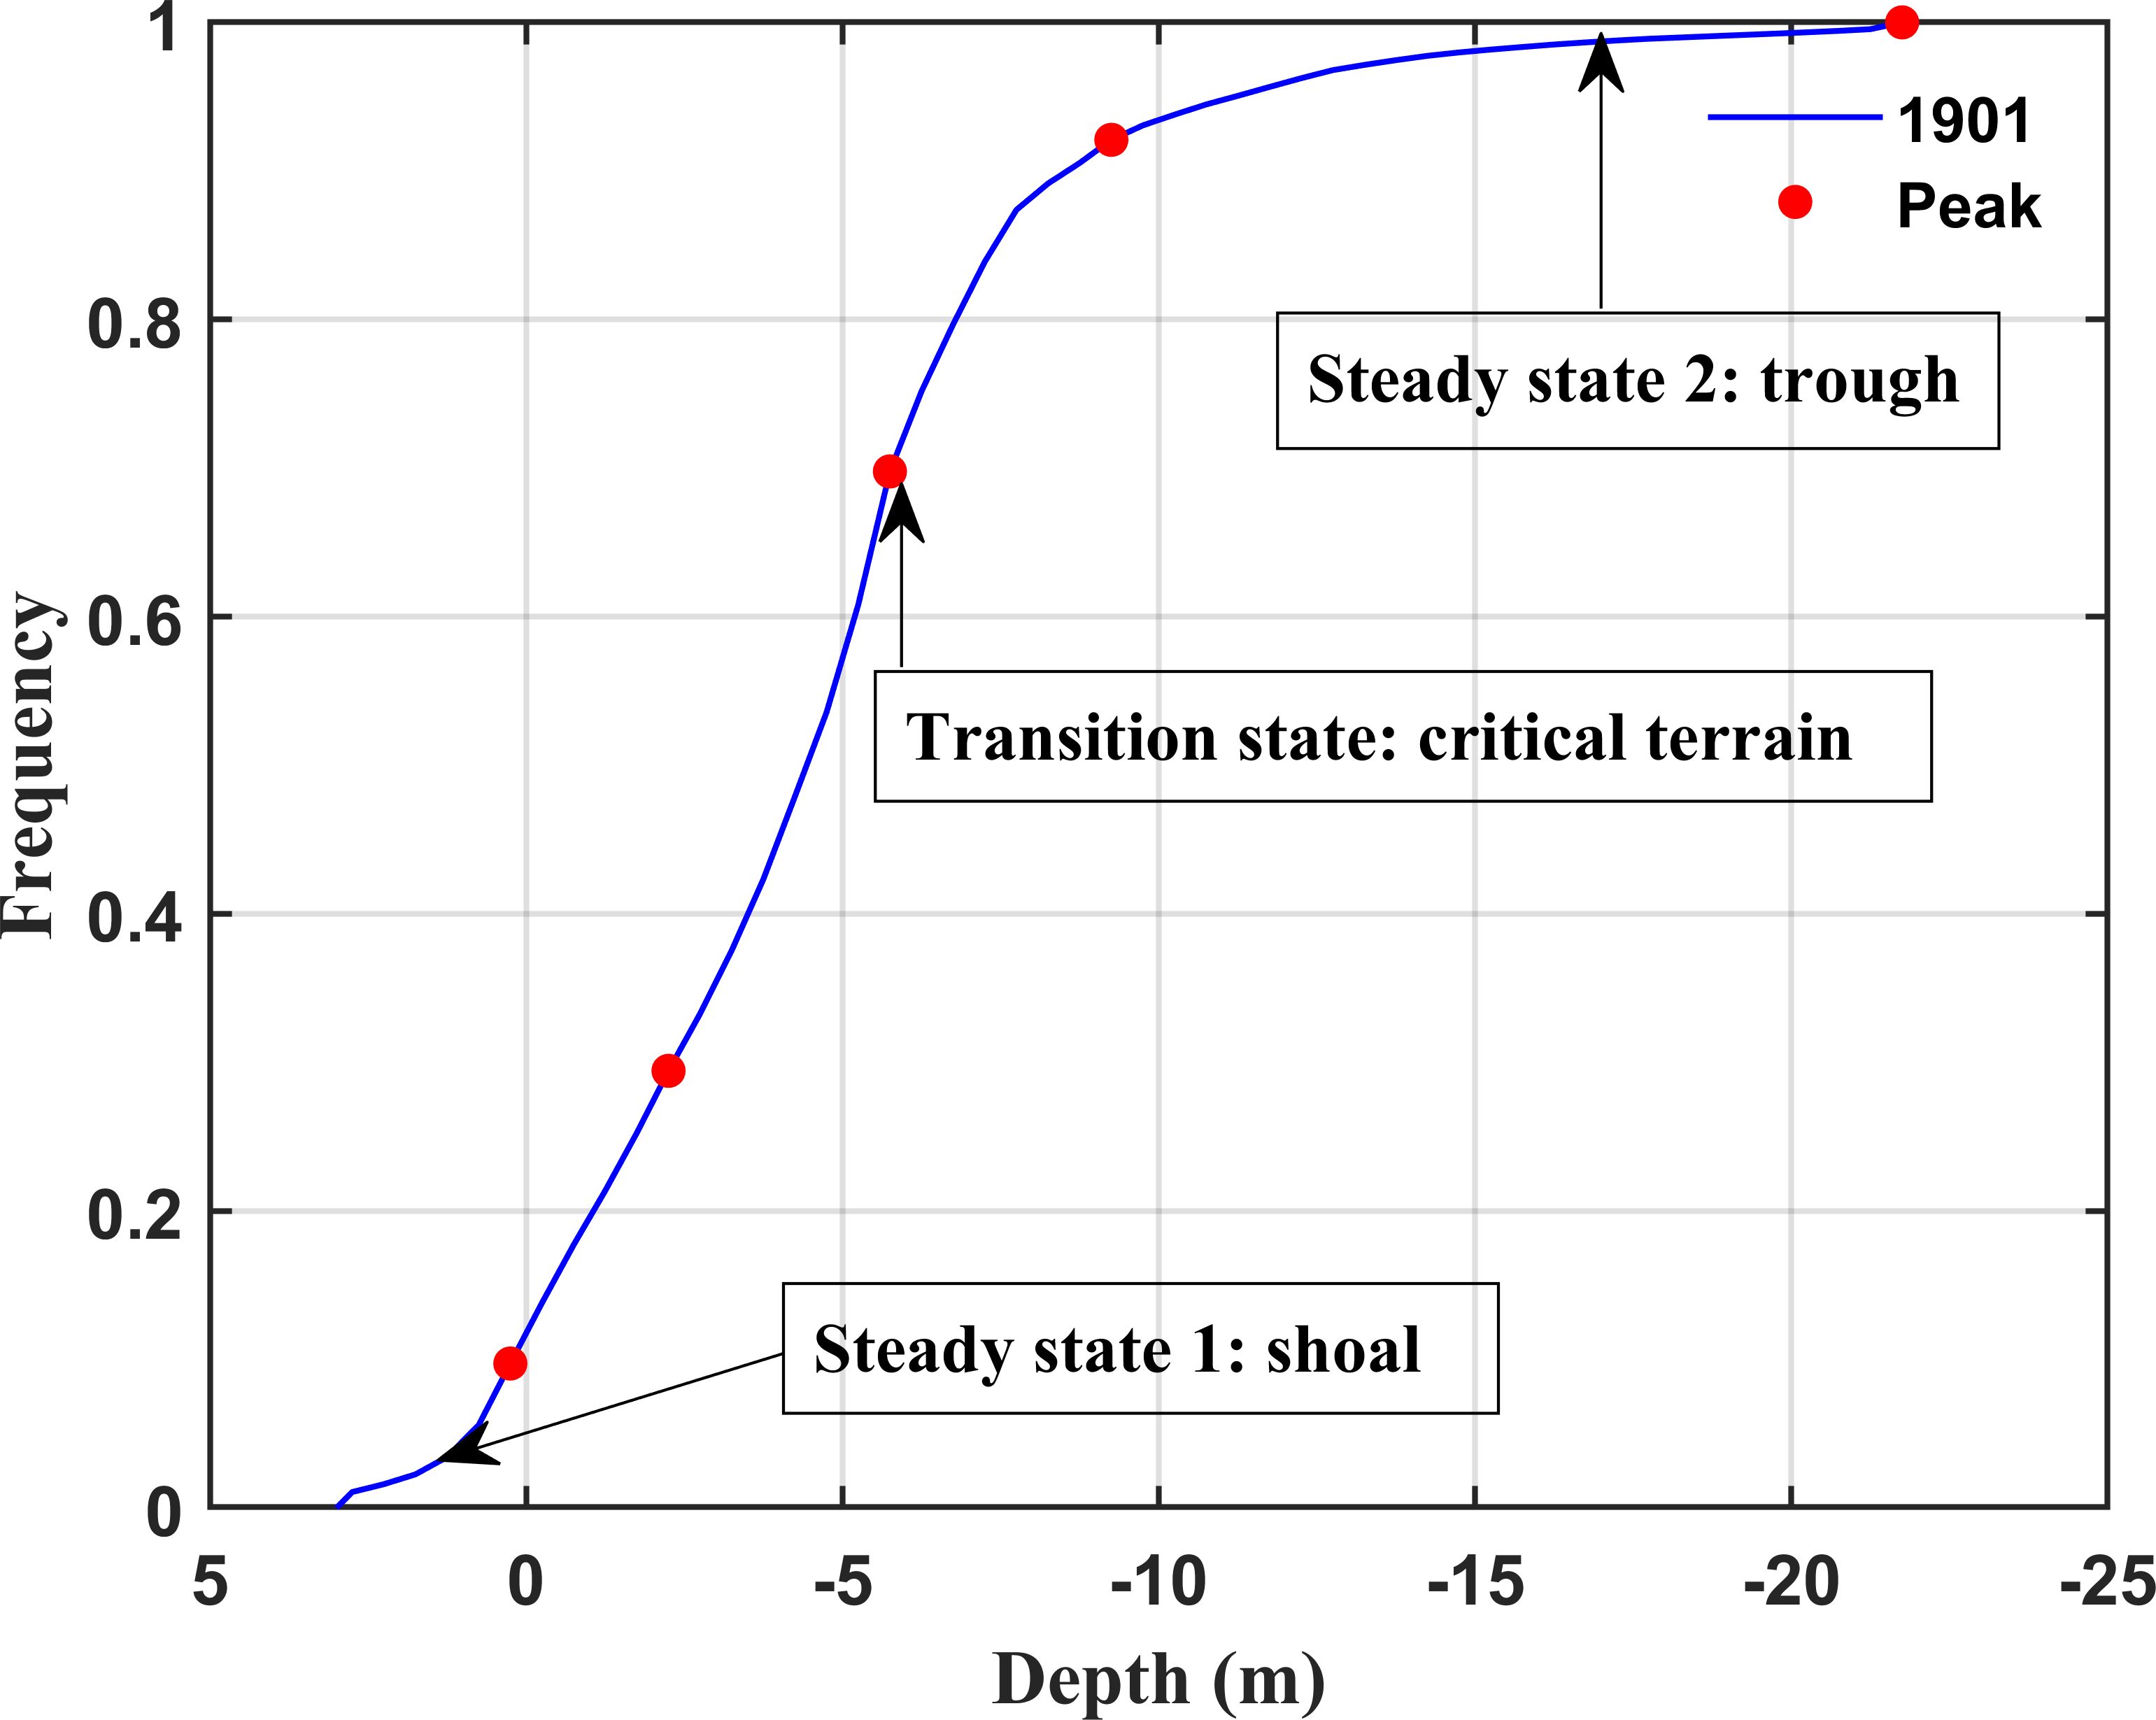
Figure 7. Steady state and transition state (shoal-trough structures) based on the cumulative frequency curve.
The stable shoal unit is situated in the shallow, gently sloping segment of the cumulative frequency curve. Shoals feature broad, shallow geomorphological areas where the cumulative area increases slightly with depth. The stable trough unit is in the deep, gently sloping segment of the curve; it is characterized by narrow, elongated areas that increase minimally with depth. The third unit lies between the shoal and trough stable segments and exhibits abrupt accumulation in cumulative frequency. This transitional unit, influenced by hydrodynamic conditions and sediment distribution, serves as a dynamic interface between shoals and troughs.
The shoal–trough transitional state represents a critical geomorphological form in dynamic equilibrium, occurring under specific hydrodynamic conditions. The threshold depth within this transitional state delineates the boundary between shoals and troughs. For the LDB, the threshold depth is identified as being −4.75 m or −5.75 m (Table 2).
The shoal–trough ratios for the years 1901, 1964, 1998, 2008, and 2018 are recorded at 1.86, 2.45, 2.70, 2.70, and 1.86, respectively, yielding an average shoal–trough ratio of 2.31. The ratio in 1901, minimally affected by human activity, represents the natural equilibrium of the estuary system. These ratios reflect the dynamic interactions between shoals and troughs. This framework underscores both the significance and dynamic roles of shoals and troughs in geomorphological evolution.
4.1.2 Geomorphological and dynamic characteristics of shoal–trough structures
The depth–area distribution curves for the LDB reveal two prominent shallow-water peak depths and one threshold depth, facilitating the vertical categorization of shoals into high, medium, and low tidal flats. The peaks are situated at 0 m, −2 m ± (−1.75 m to −2.25 m), with an additional observation at −3.25 m in 1998), alongside a threshold depth of −5 m ± (−4.75 m to −5.75 m) (Table 2). High tidal flats (corresponding to the depth ranges around 0 m) are shore areas with relatively high elevation, drowning during only high tides. High tidal flats are seen in the East Shoal and West Shoal but absent in the Middle Shoal. Medium tidal flats (−2 m ±) show a similar distribution pattern. Low tidal flats (−5 m ±) dominate in the Middle Shoal. These features underscore the distinct geomorphological and dynamic characteristics of shoals within the LDB.
4.1.2.1 Geomorphological and dynamic characteristics of the West Shoal
From 1901 to 1964, the intensity of human activities in the region was relatively low. The high tidal flat intersects the western shoreline at steep angles (90°–100°), influenced by sediment deposition from the four waterways of the PRD. Sediment transport results in a broad, planar seaward extension that transitions into medium tidal flats along the edge of the high tidal flat. Low tidal flats dominate near the West Trough, exhibiting a transition from broad to elongated forms (Figure 4).
Hydrodynamic differences are pronounced, with the West Shoal primarily shaped by riverine sediment input. Wei et al. (2021) studied the distribution of surface sediment in LDB in 1975, 1994, 2004 and 2017. Positive skewness of the surface sediment within the West Shoal indicates the formation of bifurcated sandbanks from 1975 to 1994 (Wei et al., 2021). The interplay between runoff and tidal dynamics—where runoff dominates—classifies the West Shoal as a river-dominated shoal.
4.1.2.2 Geomorphological and dynamic characteristics of the East Shoal
The East Shoal has parallel bands of tidal flats along the shoreline, with medium and low tidal flats extending toward the East Trough. In contrast to the West Shoal, the East Shoal is predominantly influenced by tidal dynamics. The tidal effects at the bayhead, particularly around Humen (with an average tidal range of 1.63 m), are more pronounced than those seen at Jiao Men, Hong Qi Li, and Heng Men (where tidal ranges vary from 1.13 m to 1.35 m) (Zhang et al., 2021). The positive skewness of the surface sediment in the East Shoal indicated its riverine source from 1975 to 1994, characterized by finer-grained deposits compared to those found in the West Shoal (Wei et al., 2021). Most sediment transported by runoff accumulates in the West Shoal, while only minimal quantities (comprising fine sand and silt) reach the East Shoal. Although marine-based sediment input was limited, it played a substantial role in producing finer grain sizes. Between 1975 and 2003, the sediment skewness of the East Shoal was negative in the southern region but positive in the northern region. The interactions between runoff and tides contribute to distinct shallow deposits (Wei et al., 2021), resulting in peak water depths that align parallel to the shoreline in the East Shoal (Figure 4). Consequently, due to the predominance of tidal dynamics, the East Shoal tide dominated.
4.1.2.3 Geomorphological and dynamic characteristics of the Middle Shoal
The Middle Shoal is between the East Trough and the West Trough, predominantly characterized by low tidal flats. Its geomorphological position corresponds with the maximum turbidity zone, influenced by estuarine plumes, thereby classifying it as an estuarine barrier. The sediment composition results from a combination of terrestrial and marine sources, with fine-grained particles (φ 6–8) being transported from adjacent troughs (Wei et al., 2021). Sand extraction (2008–2018) reached approximately 900 M m3 based on assessments of erosion and deposition processes. This activity has led to sediment diffusion and a shift in skewness from negative to positive, indicating a transition toward predominately land-based inputs. Extraction pits have developed in the northern and northeastern parts of the Middle Shoal (Figure 5), irregularly connected to the boundaries of the East Trough and West Trough. As a result, these activities have diminished the Middle Shoal’s functional capacity. In summary, the Middle Shoal is a runoff–tide coupled barrier flat that has been shaped significantly by estuarine dynamics alongside the impacts of sediment extraction.
4.1.2.4 Geomorphological and dynamic characteristics of the West Trough and the East Trough
The two troughs are elongated channels that serve as the primary pathways for water flow and tidal energy propagation. Strong hydraulic scouring has resulted in finer sediments than in shoals, typically ranging from φ 7 to φ 8 (Wei et al., 2021; Zhang et al., 2022a). In 1975, the skewness coefficients in the southern parts of both the East Trough and the West Trough were negative, although the coefficient was positive near Humen. The southern sections of the troughs primarily received marine-derived sediments, while land-based sediments predominantly influenced their northern counterparts. There was an increase in tidal energy flux within the West Trough from 1989 to 2014, which subsequently enhanced residual flow in this area (Chu et al., 2022). This phenomenon reflects a substantial shift toward the West Trough as the main channel, as shown by changes in skewness seen in the West Trough by 2004 (Wei et al., 2021).
4.2 Evolution of the shoal–trough structures
The three shoals and two troughs of the LDB are products of integrated dynamic sedimentary and morphological processes. The deep West Trough and East Trough are sustained by upstream erosion caused by flood tidal currents. The West Shoal has developed from riverine sediment deposition, with its westward expansion constrained by ebb currents originating from Humen. The Middle Shoal and the East Shoal have evolved over thousands of years, initially forming as sand bodies derived from Late Quaternary sediment at Humen (Li et al., 2002). These sediments were eroded by tidal currents and transported seaward by ebb flows, contributing to the ebb tide delta system. In recent centuries, human activities have strongly influenced the shoal–trough structures, altering their hydrodynamics and sediment transport. For example, dredging operations have increased the propagation speed of tidal waves (Zhang et al., 2020), enhanced wave energy transfer, and intensified tidal dynamics (Chen et al., 2022; Chu et al., 2022). Such changes affect sediment distribution patterns (Chu et al., 2020), resulting in corresponding adjustments to topography.
To investigate the mechanisms of the shoal−trough structure geomorphological evolution, we compared the depth–area distribution curves and cumulative frequency curves from 1901–2018. Table 5 lists representative dredging events.
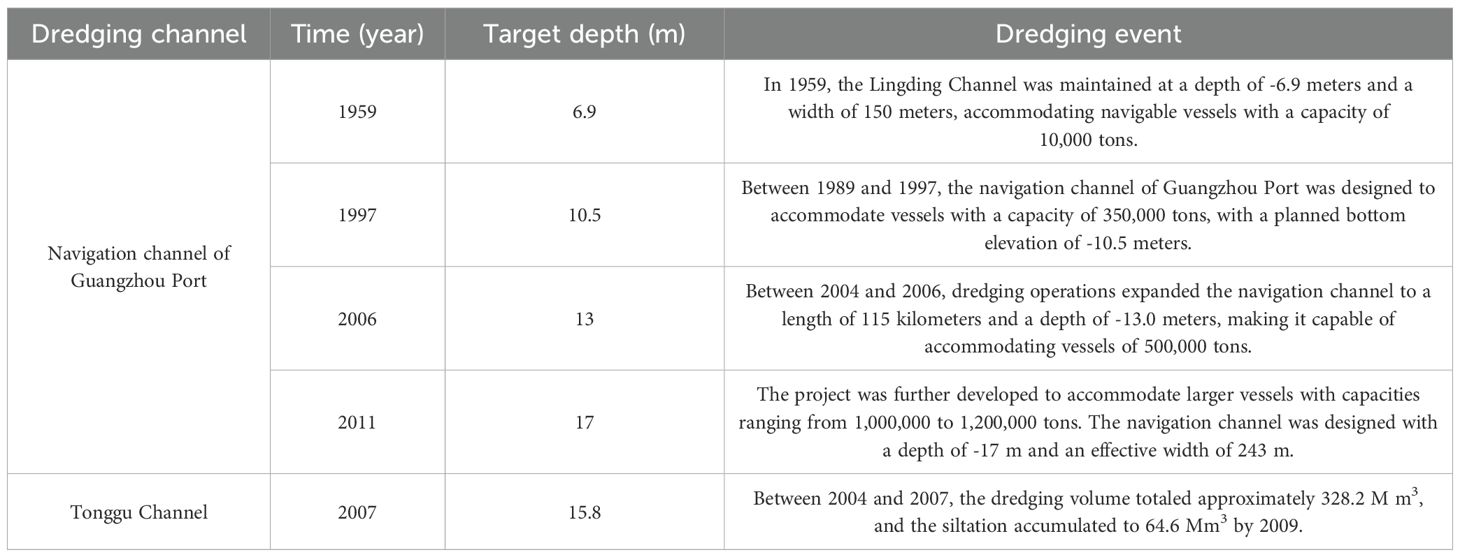
Table 5. The representative dredging event of LDB.
From 1901 to 1964, human activity intensity was relatively low, and this period is regarded as a phase of natural evolution. During this time, the number of peaks in the depth–area frequency curve decreased from five to three, with the threshold depth becoming shallower (from −5.75 m to −4.75 m). The shoal–trough ratio increased from 1.86 to 2.45, indicating shoal expansion. Sediment accumulation from upstream rivers facilitated seaward growth of the West Shoal while narrowing the West Trough due to isobath shifts. Hydraulic dynamics within the troughs were comparatively weaker than those seen after 1964 (Chu et al., 2022), resulting in sedimentation dominance. Consequently, secondary depth peaks in the troughs disappeared, reflecting a reduction in morphological complexity.
From 1964 to 1998, the total number of peaks increased to five, with the emergence of two deep-water peaks. The threshold depth stabilized at −4.75 m, while the shoal–trough ratio experienced a slight increase to 2.70, representing continued shoal expansion. Enhanced scouring reduced the sedimentation rates. Nautical charts reveal that from the 1960s through 1998, land reclamation on both the western and eastern shores resulted in increase of land areas of 201 km2 and 39.2 km2, respectively. This reclamation transformed the LDB into a trumpet-shaped structure, which amplified the tidal dynamics and intensified scouring effects within the troughs (Deng et al., 2020; Wang et al., 2020). Navigation projects have deepened the West Trough to −10.5 m (Table 5), resulting in a prominent peak at −10.25 m. The evolution of the shoal–trough structures during this period was driven by a combination of human activities and natural adjustments.
From 1998 to 2008, the depth–area distribution curve showed five distinct peaks, with the threshold depth at −4.75 m. Overall, deposition dominated in the three shoals, while scouring prevailed in the troughs. The average intensity of scouring in the troughs approached −1 m, resulting in morphological transformations between the Middle Shoal and the adjacent troughs. Consequently, the Middle Shoal expanded. Land reclamation along both shores reduced the areas of the East Shoal and the West Shoal. The West Trough was dredged to an average depth of −7.7 m, with deep channels reaching −10 m to −16 m. The excavation of the Tonggu Channel significantly influenced the morphology by total dredging volume of approximately 328.2 M m³. Additionally, severe illegal sand extraction resulted in deep pits exceeding −20 m, thereby disrupting the boundary of the Middle Shoal (Tang et al., 2011). Sedimentation–erosion calculations estimated that sand extraction volume during this period was approximately 67 M m³.
From 2008 to 2018, the depth–area distribution curve exhibited five peaks; however, the shoal–trough ratio declined to 1.86 due to significant increases in the trough areas. Overall, the LDB is characterized by the scouring thickness in the West Trough exceeding 3 m and an increased number of scouring pits seen in the Middle Shoal. The cumulative frequency curve shifted rightward, indicating intensified scouring in low tidal flats and deep-water zones. Estimates based on sedimentation–erosion calculations suggest that sand extraction volumes exceeded 900 M m3, while the reclamation area reached approximately 21.76 km2. Certain sections of the Middle Shoal have transformed into troughs because of sand extraction activities, leading to expansions in the width of troughs. By 2018, the shoal–trough ratio reverted to its level in 1901, indicating a potential new equilibrium state for the estuary.
The depth–area distribution curve of the LDB exhibited notable shifts from 1901 to 1998; however, it stabilized between 2008 and 2018. This stabilization suggests that the estuary’s adaptive adjustment mechanisms are gradually reaching a new equilibrium. It is likely that this new equilibrium is associated with the restrictions on sand excavation within the river network of the PRD implemented after 2008. The adaptive evolution of the LDB is intricately linked to the collaborative interactions between the river networks and bays within the PRD. The dynamic interplay among these elements significantly influences both the shoal–trough structural evolution and their overall stability within the PRD.
4.3 Application of the depth–area spatial function in another estuary
To evaluate the effectiveness of the depth–area spatial function for identifying shoal–trough structures in various estuaries, this study selects the Huangmaohai Estuary (HMH) as an application scenario. The HMH is a funnel-shaped estuary situated on the western side of the PRD, characterized by an irregular semi-diurnal tidal regime (illustrated in Figure 1A). Figure 8 shows the depth–area spatial function curves for the HMH in both 1940 and 2015.
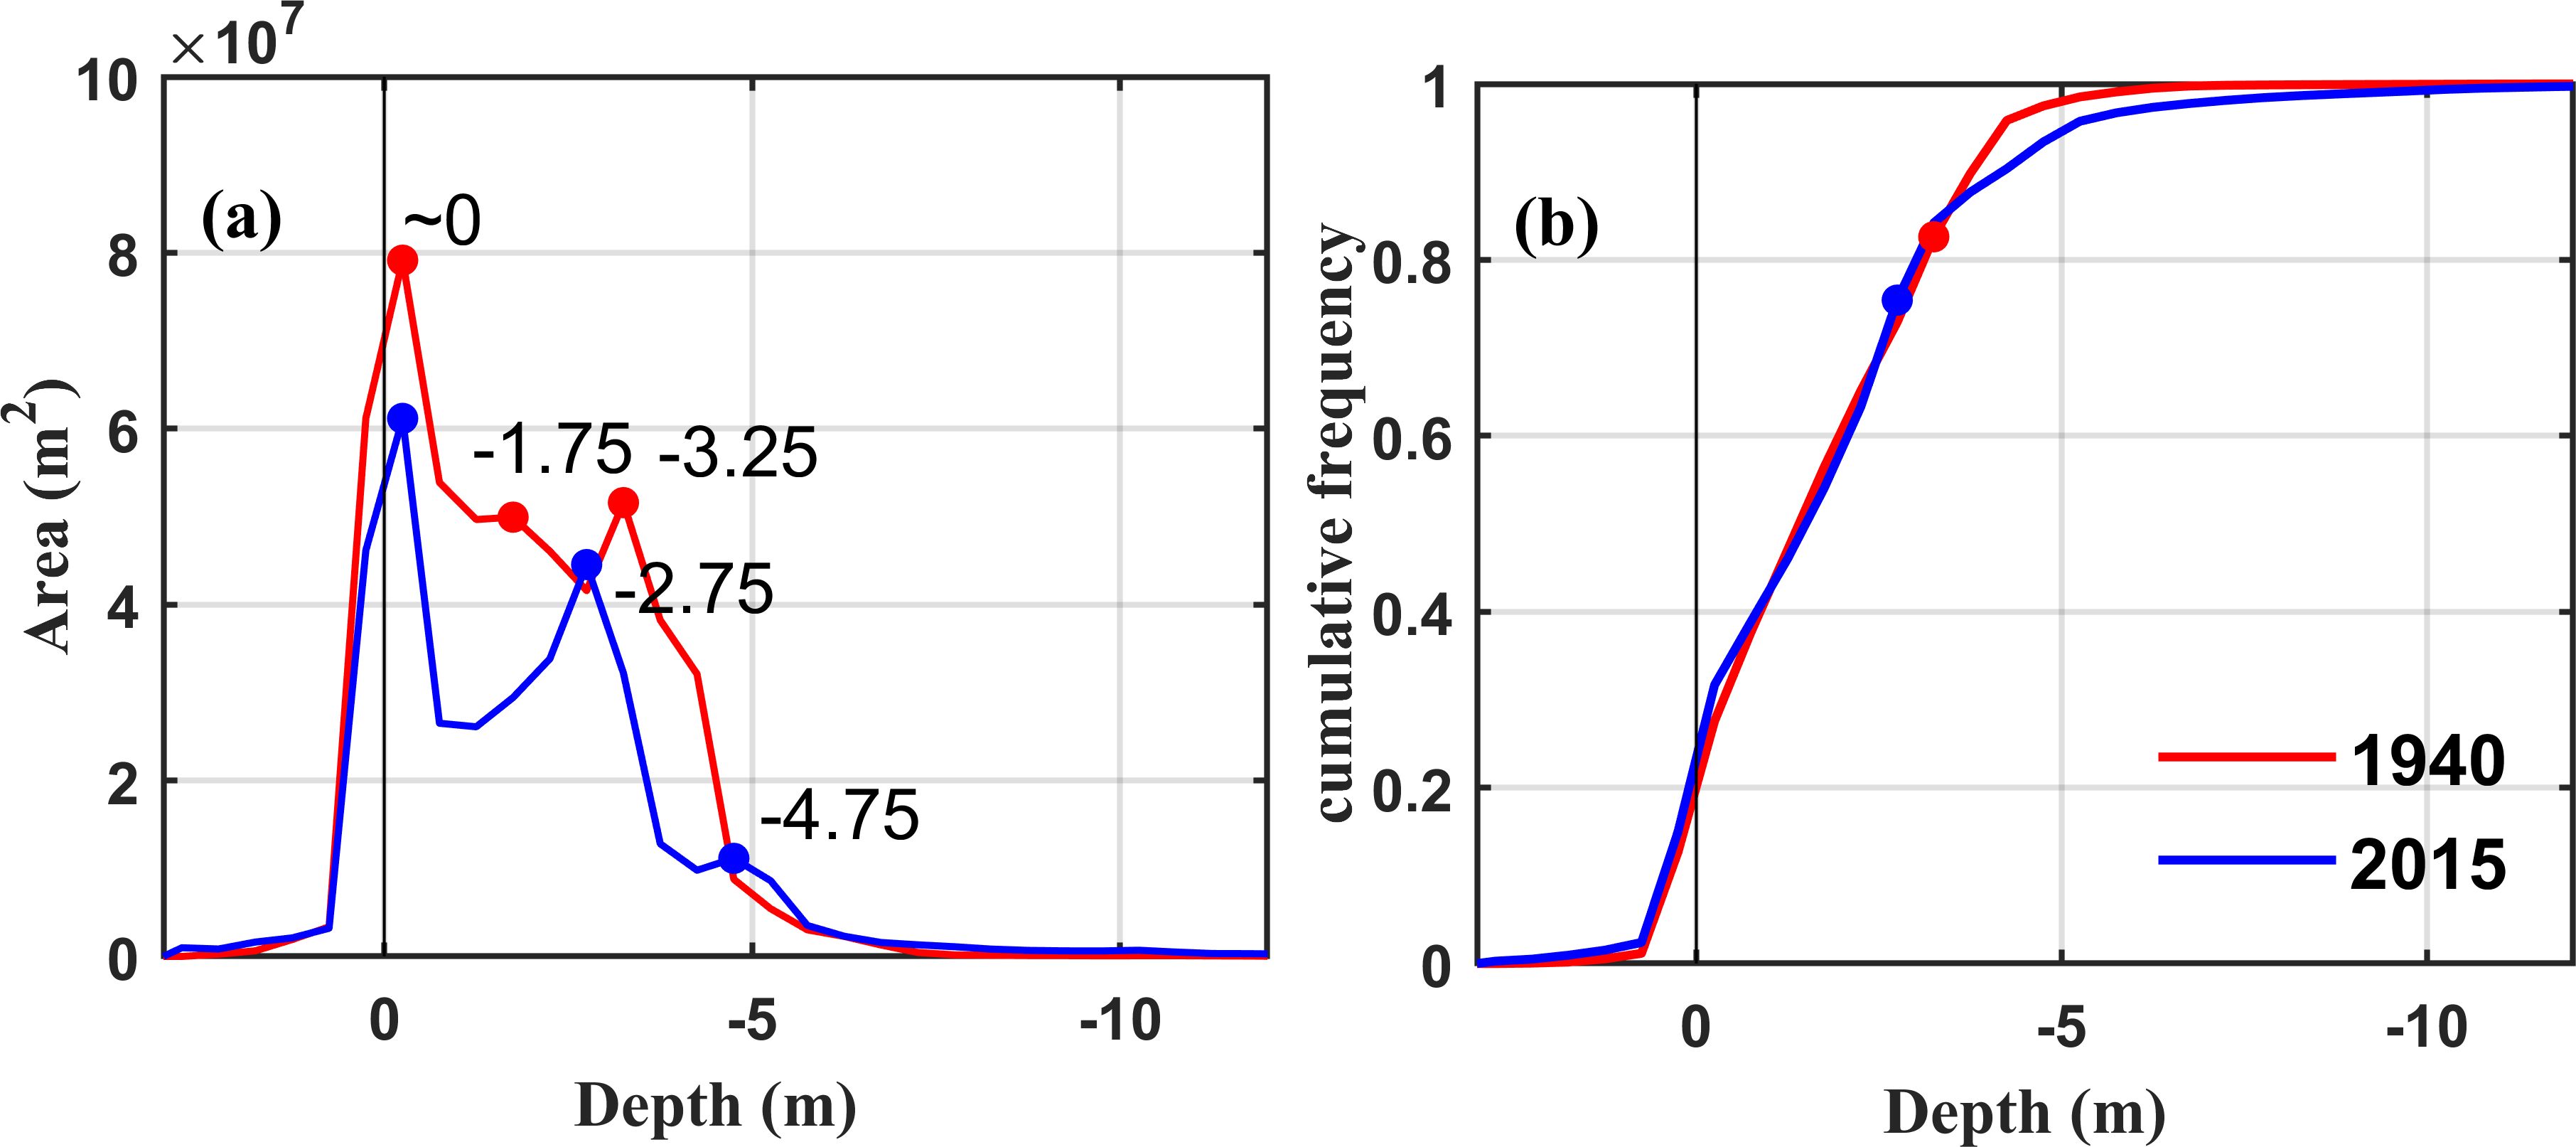
Figure 8. The depth-area distribution curve (A) and cumulative frequency curve (B) of HMH in 1940 and 2015.
The depth–area distribution curve of the HMH in 1940 had three distinct peaks at 0 m, −1.75 m, and −3.25 m. The peak at 0 m corresponds to shallow shoals along both banks of the estuary, which are high tidal flats. The depth of −3.25 m falls within the transitional state of the shoal–trough structures as indicated by the cumulative frequency curve, suggesting that this depth is a threshold.
In 2015, the depth–area distribution curve similarly displayed three peaks at depths of 0 m, −2.75 m, and −4.75 m. The depth range of 0 m to −2.75 m corresponds to medium and low tidal flats, while the depth of −4.75 m lies within the steady-state range on the cumulative frequency curve. Notably, the peak at −2.75 m also represents a transitional state in this context and functions as another threshold depth.
Consequently, based on the analysis using the depth–area spatial function, thresholds for identifying shoal–trough structures are established at depths of −3.25 m in 1940 and −4.75 m in 2015. This demonstrates the method’ general applicability to HMH studies; further research could enhance understanding given that both the LDB and HMH are tide-dominant estuaries.
5 Conclusions
The depth–area spatial function method offers a robust criterion for classifying shoal–trough structures. The cumulative frequency curves of all depth–area relations reveal three geomorphological states: the shoal stable state, characterized by a shallow and gently sloping segment of the curve; the trough stable state, found in the deeper and gently sloping segment; and the shoal–trough transitional state, which is marked by a steeper curve. The representative water depth associated with this transitional state is a threshold depth, acting as a critical indicator for delineating the shoal–trough structures within estuaries.
The depth–area distribution curve of the LDB exhibits two dominant peak depths within the shoal stable state. When combined with the identified threshold depth, this enables vertical classification of the LDB’s shallow areas into high, medium, and low tidal flats. Specifically, the high tidal flat corresponds to the peak depth of 0 m, while the medium tidal flat aligns with −2 m. The low tidal flat extends from −2 m down to the threshold water depth (−5 m). Analyses of morphological characteristics and sediment dynamics reveal significant differences among the various shoals. The West Shoal is dominated by river dynamics, the East Shoal is governed by tidal forces, and the Middle Shoal reflects an integrated river–tide system. Furthermore, two troughs, shaped by runoff from four inlets, serve as narrow elongated channels facilitating wave energy propagation under tidal influences.
From 1901 to 1964, the LDB underwent natural geomorphological evolution with overall deposition. However, post-1964, human activities emerged as the primary driving force behind alterations in the depth–area distribution curves. Notably, between 2008 and 2018 the curve shape stabilized accompanied by a decline in the shoal–trough ratio— indicating that adaptive adjustment mechanisms within this estuary are progressively achieving new equilibrium states.
Data availability statement
The original contributions presented in the study are included in the article/Supplementary Material. Further inquiries can be directed to the corresponding author.
Author contributions
LF: Writing – original draft, Writing – review & editing. YZ: Validation, Writing – review & editing. PZ: Data curation, Methodology, Resources, Software, Writing – review & editing. LN: Funding acquisition, Supervision, Writing – review & editing. XZ: Supervision, Writing – review & editing. JL: Supervision, Writing – review & editing. HC: Supervision, Writing – review & editing. QY: Formal analysis, Funding acquisition, Resources, Supervision, Writing – review & editing.
Funding
The author(s) declare financial support was received for the research, authorship, and/or publication of this article. This research was supported by projects granted by the National Key R&D of China (Grant No. 2016YFC0402600), Marine Economy Development Project of Guangdong Province (GDNRC[2024]36), and Natural Science Foundation of Guangdong Province (2022A1515011992).
Acknowledgments
We were sincerely grateful for the support provided by Enmao Huang, Xianzhao He for the data acquisition. We also appreciate the reviewers for their constructive suggestions.
Conflict of interest
The authors declare that the research was conducted in the absence of any commercial or financial relationships that could be construed as a potential conflict of interest.
The author(s) declared that they were an editorial board member of Frontiers, at the time of submission. This had no impact on the peer review process and the final decision.
Generative AI statement
The author(s) declare that Generative AI was used in the creation of this manuscript. It was used to assist in polishing the language of academic papers.
Publisher’s note
All claims expressed in this article are solely those of the authors and do not necessarily represent those of their affiliated organizations, or those of the publisher, the editors and the reviewers. Any product that may be evaluated in this article, or claim that may be made by its manufacturer, is not guaranteed or endorsed by the publisher.
Supplementary material
The Supplementary Material for this article can be found online at: https://www.frontiersin.org/articles/10.3389/fmars.2025.1525805/full#supplementary-material
References
Chen K., Dong H., Jia L., He Z. (2020). Depocentre transfer in the Lingdingyang estuary: Interferences from natural and anthropogenic forcings. Ocean Coast. Manage. 185, 105064. doi: 10.1016/j.ocecoaman.2019.105064
Chen K., He Z., Liu J., Lin Y., Jia L. (2022). Long-term morphological evolution and its mechanism of Lingdingyang Estuary: Interferences from anthropogenic forcings. Mar. Geo. 450, 106856. doi: 10.1016/j.margeo.2022.106856
Chen X., Chen Y. (2002). Hydrological change and its causes in the river network of the Pearl River delta. Acta Geograph. Sin. 57, 429–436. doi: 10.3321/j.issn:0375-5444.2002.04.007
Chu N., Yang Q., Liu F., Luo X., Cai H., Yuan L., et al. (2020). Distribution of magnetic properties of surface sediment and its implications on sediment provenance and transport in Pearl River Estuary. Mar. Geo. 424, 106162. doi: 10.1016/j.margeo.2020.106162
Chu N., Yao P., Ou S., Wang H., Yang H., Yang Q. (2022). Response of tidal dynamics to successive land reclamation in the Lingding Bay over the last century. Coast. Eng. 173, 104095. doi: 10.1016/j.coastaleng.2022.104095
Deng J., Yao Q., Wu J. (2020). Estuarine morphology and depositional processes in front of lateral river-dominated outlets in a tide-dominated estuary: A case study of the Lingding Bay, South China Sea. J. Asian Earth Sci. 196, 104382. doi: 10.1016/j.jseaes.2020.104382
de Swart H. E., Zimmerman J. T. F. (2009). Morphodynamics of tidal inlet systems. Annu. Rev. Fluid Mech. 41, 203–229. doi: 10.1146/annurev.fluid.010908.165159
Gerald H., Markus B., Anna Z., Christian W. (2017). Drivers of channel-shoal morphodynamics at the outer Weser estuary. Proc. 8th Int. Conf. Coast. Dynamics 261, 333–345.
Green M. O., Coco G. (2014). Review of wave-driven sediment resuspension and transport in estuaries. Rev. Geophysics 52, 77–117. doi: 10.1002/2013RG000437
Ha A. Y., Wu T., Chen G. (2012). Quantitative division method for floodplain and main channel of alluvial river and its application. J. Hydraul Eng-Asce 43 (1), 10–14.
Laignel B., Vignudelli S., Almar R., Becker M., Bentamy A., Benveniste J., et al. (2023). Observation of the coastal areas, estuaries and deltas from space. Surv Geophys. 44, 1309–1356. doi: 10.1007/s10712-022-09757-6
Li Y. (2018). The equilibrium status: a cross scale linkage for hydrodynamics, sedimentology, and geomorphology. Haiyang Xuebao 40, 38–42. doi: 10.3969/j.issn.0253-4193.2018.07.003
Li C., Lei Y., He W., Dai Z. (2002). Evolutional processes of the Pearl River Estuary and its protective regulation and exploitation. J. Sediment Res. 2022, 44–51. doi: 10.16239/j.cnki.0468-155x.2002.03.008
Li M., Yan Y., Han X., Li W. (2019). Physical model study for effects of the Hong Kong–Zhuhai–Macao Bridge on harbors and channels in Lingdingyang Bay of the Pearl River Estuary. Ocean Coast. Manage. 177, 76–86. doi: 10.1016/j.ocecoaman.2019.04.010
Lou Y., Dai Z., He Y., Mei X., Wei W. (2020). Morphodynamic couplings between the Biandan shoal and Xinqiao channel, Changjiang (Yangtze). Ocean Coast. Manage 183, 105036.1–105036.13. doi: 10.1016/j.ocecoaman.2019.105036
Luo X., Zeng E., Ji R., Wang C. (2007). Effects of in-channel sand excavation on the hydrology of the Pearl River Delta, China. J. Hydrol. 343, 230–239. doi: 10.1016/j.jhydrol.2007.06.019
Ministry of Water Resources of China (2020). China River Sediments Bulletin (Beijing: China Water Resources and Hydropower Press).
Richards K. (1976). The morphology of riffle-pool sequences. Earth Surf Proc. Land. 1, 71–88. doi: 10.1002/esp.3290010108
Sørensen R., Seibert J. (2007). Effects of DEM resolution on the calculation of topographical indices: TWI and its components. J. Hydrol. 347, 79–89. doi: 10.1016/j.jhydrol.2007.09.001
Talke S. A., Jay D. A. (2020). Changing tides: the role of natural and anthropogenic factors. Annu. Rev. Mar. Sci. 12, 121–151. doi: 10.1146/annurev-marine-010419-010727
Tang M., Zhang Z., Xing Y. (2011). Environment monitoring of offshore sand mining in pearl river estuary. Proc. EST. 10, 1410–1415. doi: 10.1016/j.proenv.2011.09.225
Van d., Gascoigne J. C., Theraulaz G., Rietkerk M., Mooij W. M., Herman P. M. J. (2008). Experimental evidence for spatial self-organization and its emergent effects in mussel bed ecosystems. Science 322, 739–742. doi: 10.1126/science.1163952
Wang H., Bi N., Yoshiki S., Wang Y., Sun X., Zhang J., et al. (2010). Recent changes in sediment delivery by the Huanghe (Yellow river) to the sea: causes and environmental implications in its estuary. J. Hydrol. 391, 302–313. doi: 10.1016/j.jhydrol.2010.07.030
Wang J., Dai Z., Fagherazzi S., Lou Y., Mei X., Ma B. (2024). Large-scale sedimentary shift induced by a mega-dam in deltaic flats. Sedimentology 71, 1084–1112. doi: 10.1111/sed.13168
Wang H., Zhang P., Hu S., Cai H., Fu L., Liu F., et al. (2020). Tidal regime shift in Lingdingyang Bay, the Pearl River Delta: An identification and assessment of driving factors. Hydrological Processes. 34 (13), 2878–2894. doi: 10.1002/hyp.13773
Wei X., Cai S., Zhan W., Li Y. (2021). Changes in the distribution of surface sediment in Pearl River Estuary 1975–2017, largely due to human activity - ScienceDirect. Cont Shelf Res. 228, 104538. doi: 10.1016/j.csr.2021.104538
Wei W., Dai Z., Mei X., Liu J., Gao S., Li S. (2017). Shoal morphodynamics of the Changjiang (Yangtze) estuary: Influences from river damming, estuarine hydraulic engineering and reclamation projects. Mar. Geol. 386, 32–43. doi: 10.1016/j.margeo.2017.02.013
Wu Z. Y., Milliman J. D., Zhao D. N., Cao Z. Y., Zhou J. Q., Zhou C. Y. (2018). Geomorphologic changes in the lower Pearl River Delta 1850–2015, largely due to human activity. Geomorphology 314, 42–54. doi: 10.1016/j.geomorph.2018.05.001
Wu Z., Milliman J. D., Zhao D., Zhou J., Yao C. (2014). Recent geomorphic change in Lingding Bay, China, in response to economic and urban growth on the Pearl River Delta, Southern China. Global Planet Change. 123, 1–12. doi: 10.1016/j.gloplacha.2014.10.009
Wu Z. Y., Saito Y., Zhao D. N., Zhou J. Q., Cao Z. Y., Li S. J., et al. (2016a). Impact of human activities on subaqueous topographic change in Lingding Bay of the Pearl River Estuary, China, during 1955–2013. Sci. Rep-UK. 6, 37742. doi: 10.1038/srep37742
Wu C. S., Yang S., Huang S., Mu J. (2016b). Delta changes in the Pearl River estuary and its response to human activities, (1954–2008). Quatern Int. 392, 147–154. doi: 10.1016/j.quaint.2015.04.009
Zhang G., Cheng W., Chen L., Zhang H., Gong W. (2019). Transport of riverine sediment from different outlets in the Pearl River Estuary during the wet season. Mar. Geol 415, 105957. doi: 10.1016/j.margeo.2019.06.002
Zhang M., Yang H., Tang Q., Cai H., Zhu Z., Feng A., et al. (2020). Impacts of secondary and quarter-diurnal tidal species on backwater hydrodynamics in tidal rivers. Adv. Water Resour. 143, 103660. doi: 10.1016/j.advwatres.2020.103660
Zhang W., Wei X., Jinhai Z., Yuliang Z., Zhang Y. (2012). Estimating suspended sediment loads in the Pearl River Delta region using sediment rating curves. Continental Shelf Res. 38, 35–46.
Zhang T., Niu L., He F., Liu F., Luo X., Yang Q. (2022a). Anthropogenic impact on evolution of lingding bay sedimentary framework. Acta Sedimentologica Sinica. 40, 753–764. doi: 10.14027/j.issn.1000-0550.2021.007
Zhang W., Xu Y. J., Guo L., S.-N. Lam N., Xu K., Yang S., et al. (2022b). Comparing the Yangtze and Mississippi river deltas in the light of coupled natural-human dynamics: lessons learned and implications for management. Geomorphology 399, 108075. doi: 10.1016/j.geomorph.2021.108075
Zhang W., Xu Y., Hoitink A. J. F., Sassi M. G., Zheng J., Chen X., et al. (2015). Morphological change in the Pearl River delta, China. Mar. Geol. 363, 202–219. doi: 10.1016/j.margeo.2015.02.012
Keywords: shoal-trough division, estuarine bay, human activities, evolution, Lingdingyang
Citation: Fu L, Zhong Y, Zhang P, Niu L, Zhang X, Lin J, Cai H and Yang Q (2025) The evolution and morphodynamic characteristics of shoals and troughs in Lingdingyang Bay of the Pearl River Estuary. Front. Mar. Sci. 12:1525805. doi: 10.3389/fmars.2025.1525805
Received: 10 November 2024; Accepted: 08 January 2025;
Published: 24 January 2025.
Edited by:
Haosheng Huang, Louisiana State University, United StatesReviewed by:
Junliang Gao, Jiangsu University of Science and Technology, ChinaQinghua Ye, Deltares, Netherlands
Copyright © 2025 Fu, Zhong, Zhang, Niu, Zhang, Lin, Cai and Yang. This is an open-access article distributed under the terms of the Creative Commons Attribution License (CC BY). The use, distribution or reproduction in other forums is permitted, provided the original author(s) and the copyright owner(s) are credited and that the original publication in this journal is cited, in accordance with accepted academic practice. No use, distribution or reproduction is permitted which does not comply with these terms.
*Correspondence: Qingshu Yang, eWFuZ3FzaEBtYWlsLnN5c3UuZWR1LmNu