- 1Department of Coastal Management, Geosystem Research Corp., Gunpo, Republic of Korea
- 2School of Civil Engineering, Kookmin University, Seoul, Republic of Korea
Detecting and responding appropriately to temporal changes in the shoreline is an important task for protecting coasts. Video monitoring has been utilized as a powerful tool for detecting shoreline changes. Existing shoreline-tracking methods include the threshold methods, colour intensity gradient methods, and neural networks, which involve ad-hoc assignment of the threshold values, drawing shore-normal transects, and heavy preliminary training for each coast with many data, respectively. The study applies a new boundary tracking method using Minimum Convolution of Gaussian Weight and Squared Differences (MCGWSD). The new method is fast and effective in a sense that it does not need ad-hoc threshold, drawing of transects, or pre-training. This method tracks boundary lines between two zones with no thickness by inversely tracking every pixel of the late image. The MCGWSD method is first examined for various image distortions, i.e. translation, linear deformation, angular deformation, and rotation of images. Images of a part of orange peel are chosen for the test, where a boundary line is artificially drawn, not necessarily following clear object boundary, but crosses over small patterns. The new method satisfactorily tracks the movement of boundary line at the tests. Then field video images of Jangsa Beach between 1 September 2020 and 15 September 2020, when typhoons Maysak and Haishen hit the coast, are examined to track the shoreline movement. Ground truth shoreline information at the coast during the time is not available, and results of existing colour intensity gradient method PIMACS are assumed true. According to PIMACS results on the beach width along two transects during the period, the shoreline underwent a movement up to 6 m. The new MCGWSD method tracks the shoreline position, and its results show good agreement with PIMACS results along two transects. The merits of the present method are that it produces shoreline change over the whole domain, and shore-normal transects are not needed. The present method effectively tracks the shoreline retreat or advance of as small as 1 pixel of image. The new method could be used for tracking shoreline change at arbitrary geometry even with sharp corners.
1 Introduction
Shoreline changes have significant implications for coastal communities, including alterations to habitat, infrastructure damage, and increased vulnerability to coastal hazards. Monitoring these changes is critical for sustainable development and disaster risk reduction. Coastal changes are driven by both natural processes, such as wave action and sea level rise, reduced river sand supply, and anthropogenic factors, such as urbanization and resource extraction. Effective monitoring of shoreline changes is essential for informed decision-making in coastal management, helping to mitigate the impacts of climate change and safeguard coastal populations (Luijendijk et al., 2018; Vousdoukas et al., 2020; and Ribas et al., 2020). Various methods, including remote sensing, ground surveys, and GIS-based modeling, are employed to track shoreline changes. However, each method has its limitations in terms of accuracy, cost, and temporal resolution.
The shoreline is the transition between land and water. It is often taken as the intersection of mean high water and the shore. The position of the shoreline continuously shifts over time due to cross-shore and alongshore sediment transport within the littoral zone. It influenced by factors such as waves, tides, groundwater, storm surges, setup, and runup (Boak and Turner, 2005). The traditional method of monitoring the shoreline is to use GPS (Morton et al., 1993). This method is relatively fast and accurate but requires manpower and time costs. With the development of remote equipment such as satellites, video systems, and drones, numerous methods for shoreline monitoring have been developed. COASTSAT (Vos et al., 2019), a shoreline analysis tool utilizing free satellites like Landsat and Sentinel-2, provided long-term shoreline change data spanning approximately 40 years, but it is limitation to detection shoreline change at short-term changes such as typhoons. Shoreline monitoring using drones provides high-resolution (< 0.1 m) three-dimensional beach elevation data and shoreline locations (Young et al., 2021), but this requires user time costs for monitoring operations.
Beach monitoring using video cameras began in 1980 with major research beginning at the Coastal Imaging Laboratory (CIL) at Oregon State University and the development of the ARGUS system (Lippmann and Holman, 1989; Holman and Stanley, 2007). Research on coastal wave dynamics, wave runup, beach dynamics, etc., using images has helped to understand coastal morphodynamics, and has led to rapid developments in video systems, such as improving the quality of video systems and introducing fixed platforms (Lippmann and Holman, 1990). With advancements of computer vision, video analysis systems have also made rapid progress. High-quality video resolution has further increased the value of research. Examples of advanced analytical studies on video monitoring include, sandbar tracking (Lippmann and Holman, 1989; van Enckevort et al., 2004), beach slope (Damiani and Molfetta, 2008; Plant and Holman, 1997), rip current and longshore current (Chickadel et al., 2003; Almar et al., 2016; Turner et al., 2007), and wave energy (Stockdon and Holman, 2000; Shand et al., 2012; Aarninkhof and Ruessink, 2004). In addition, shoreline extraction techniques using fixed video monitoring have been gradually improved (Widyantara et al., 2019; Ribas et al., 2020; Arriaga et al., 2022; Ronneberger et al., 2015; Ciresan et al., 2012; Ronneberger et al., 2015) and precise analysis (Kim, 2014; Chang et al., 2019; Joia Santos et al., 2020) has been achieved with high-resolution monitoring.
Widyantara et al. (2019) extracted shoreline from snapshot video images at Cucukan beach, Indonesia using multi thresholding method. Their results are limited in instantaneous shorelines and are not directly linked to meaningful medium-term shoreline positions. Ribas et al. (2020) used space-time filters and a combination of four methods, including thresholding method with weights for each method, and assessed their results with human manual digitization results of shorelines at beaches near Barcelona, Spain. The validity of this method remains uncertain because the definition has not been examined in their work. Also, an algorithm for handling discontinuities of each signal has not been proposed in their work. Arriaga et al. (2022) detected shoreline from video images at Sisal Beach, Mexico using a thresholding method. They extracted the run-up limit, compared them with the true shoreline, and added some correction width to the detected shoreline positions. Their study results still show quite high RMSE values, possibly influenced by temporal wave weather variation, and unstable run-up limit. Recently, researchers have been working to identify uncertain shoreline positions using Convolutional Neural Network (CNN). Ciresan et al. (2012) built a CNN which makes use of many training data sets, each derived from a sliding window for each image pixel. Training of their network was expensive due to excessive number of training data sets, despite artificially reducing the panel size to limit computational load. Ronneberger et al. (2015) proposed a deep unsupervised CNN called “U-net” for segmentation. Their network is composed of two paths: a contracting path and an expansive path. The expansive path is executing expansion of the feature map size and reduction of the number of feature maps. Their intent to introduce the expansive path was to partially recover the characteristics of the original image. However, during the expansive path, the most adequate depth of the network and the up-sampling method should be chosen depending on the given task and images, see Table 1.
While several techniques have been used to monitor shoreline change, existing approaches have some weak points on either accuracy or operational burden. This study introduces a new method using local dissimilarity by modifying similarity index, which overcomes these limitations by providing accuracy and easy operation.
Segmentation is a typical procedure to track objects in images. A simple method of image segmentation is the thresholding method (Otsu, 1979; Jardim et al., 2023). This method has often been used for gray-scale images. A drawback of this method is that it cannot separate out meaningless patterns in images, if there are any. Assigning adequate single or multiple thresholds is an important step for the success of this method. This method seems not adequate for tracking shoreline movement from images that include bright gray bubble zones composed of RGB elements. Mean-shift clustering method has been used to track movement of objects in images (Zhao et al., 2020). Clustering is the key to identifying the object to track including instant segmentation which often involves deep learning algorithms. Shoreline lies in a zone be-tween the run-up limit and the offshore end of the surf zone. The clustering method could separate out the bright gray bubble zone from onshore and offshore zones. It is important to note that the position of the shoreline is not the centre of the zone, especially when the shoreline is a long curve, rather than an object encircled by a curve. Thus, two-dimensional mean-shift concept does not seem adequate for tracking lengthy and thin shoreline.
Similarity between two images has been measured by several indices (Wu et al., 2021; Park et al., 2023). The similarity indices could be used for tracking objects in images. Similarity indices include Sum of Squared Differences (SSD), Mean Squared Error (MSE), Structural Similarity Index (SSIM), and Spatial Correlation Coefficient (SCC). SSD is considered a dissimilarity index. SSD and SSIM have been used for assessment of similarity between two images. It is meaningful to examine whether they can be used for tracking objects in images. To use SSD or SSIM for tracking a moving object or a pixel, it could think of comparing local pieces of images, not the whole images. This study confines the interest on situations in which partial images of objects or background suffer translation, and distortion like elastic modification in shape, which is similar to reshaping of flexible material. In other words, a small piece of image or a patch undergoes deformations, such as linear deformation, angular deformation, rotation, and translation, but only in a small scale.
The shoreline evolves like an elastic material, or an elastic curve, without abrupt cracking-like deformation SSD is known as a dissimilarity index rather than a similarity index because it is inversely proportional to similarity. The smaller the SSD, the more similar the images are. SSD can be easily modified to a similarity index by changing its sign and adding a large number, called Modified SSD (MSSD). Kim et al. (2020) has used a similarity feature map computed by negative sum of squared difference added by a bias. Then, the larger the MSSD, the more similar the images are. MSE describes the averaged SSD over the number of pixels within a zone and is considered as a normalized value of SSD. It becomes meaningful if only normalized SSD is needed. After normalizing pixel values to have a zero mean and variance, the resulting MSE is called SSIM, which ranges between -1 and 1. SSIM has often been used to measure similarity between two images. It is known that the SSD and SSIM values demonstrate different trends depending on the images to be compared (Wang and Bovik, 2009).
The methodology employed in this study includes Minimum Convolution of Gaussian Weight and Squared Differences (MCWSD) method, which were selected due to their applicability, accuracy, and easy operation in tracking shoreline changes.
There are two options to track the movement of a pixel: forward tracking and reverse tracking. It has two images in the time-series. Reverse tracking assigns a pixel in the second image and finds the position in the first image. The segmentation map of the first image, which can be filled in by reverse tracking with no omission, whereas forward tracking generates holes in the segmentation map. The reverse tracking repeats for all pixels in the zone of interest. Segmentation is simply dividing zones into multiple pieces and assigning class numbers onto them. Strictly speaking, the segmentation expresses a zero-thickness line or curve that separates a wide zone into two or more. Some previous studies have used rectangular boxes for tracking objects. A semantic segmentation map uses two zones, and instant segmentation uses many zones with many boundary curves. The simplest boundary is a curve with zero thickness. For tracking shoreline movement, tracking one boundary line and encircling an object for tracking is adequate, because a shoreline is a curve rather than an area.
The new method for shoreline changes detection is applied to images of a field. Analysis data of Jangsa Beach video monitoring system are part of the Coastal Erosion Survey Project commissioned by the Ministry of Oceans and Fisheries (MOF), and are used in this study. Recent high-quality footage of Jangsa Beach in Korea is available, and this paper discusses the applicability of the new method to those video images. If a methodology can trace shoreline change two-dimensionally without defining transects, it would be more operational. Then, the methodology could be used for arbitrary shorelines, even with sharp corners.
2 Materials and methods
2.1 Study site
The study site was Jangsa Beach, located on the east coast of Korea (129°22’ 32”E, 36°17’ 06”N) (Figure 1). Jangsa Beach is a typical pocket beach, and the beach face slope is around 7°, and the bed material on the beach is mostly sandy. The median grain size of the sediments was found to be 540μm, consistent with findings from Ministry of SMEs and Startups (2023). As waves approach the shoreline, waves break as spilling type in the surf zone, and run-up over the swash zone above the mean water level, as shown in Figure 2. The wave breaking produces bubbles of bright gray colour, which is distinctive in video images. Instantaneous video images (exposure of 0.02 s) show dynamic wave propagation over the beach plane. Focus on the semi-steady shoreline and its evolution, the position of which should be obtained from complex post-processing techniques like averaging or filtering.
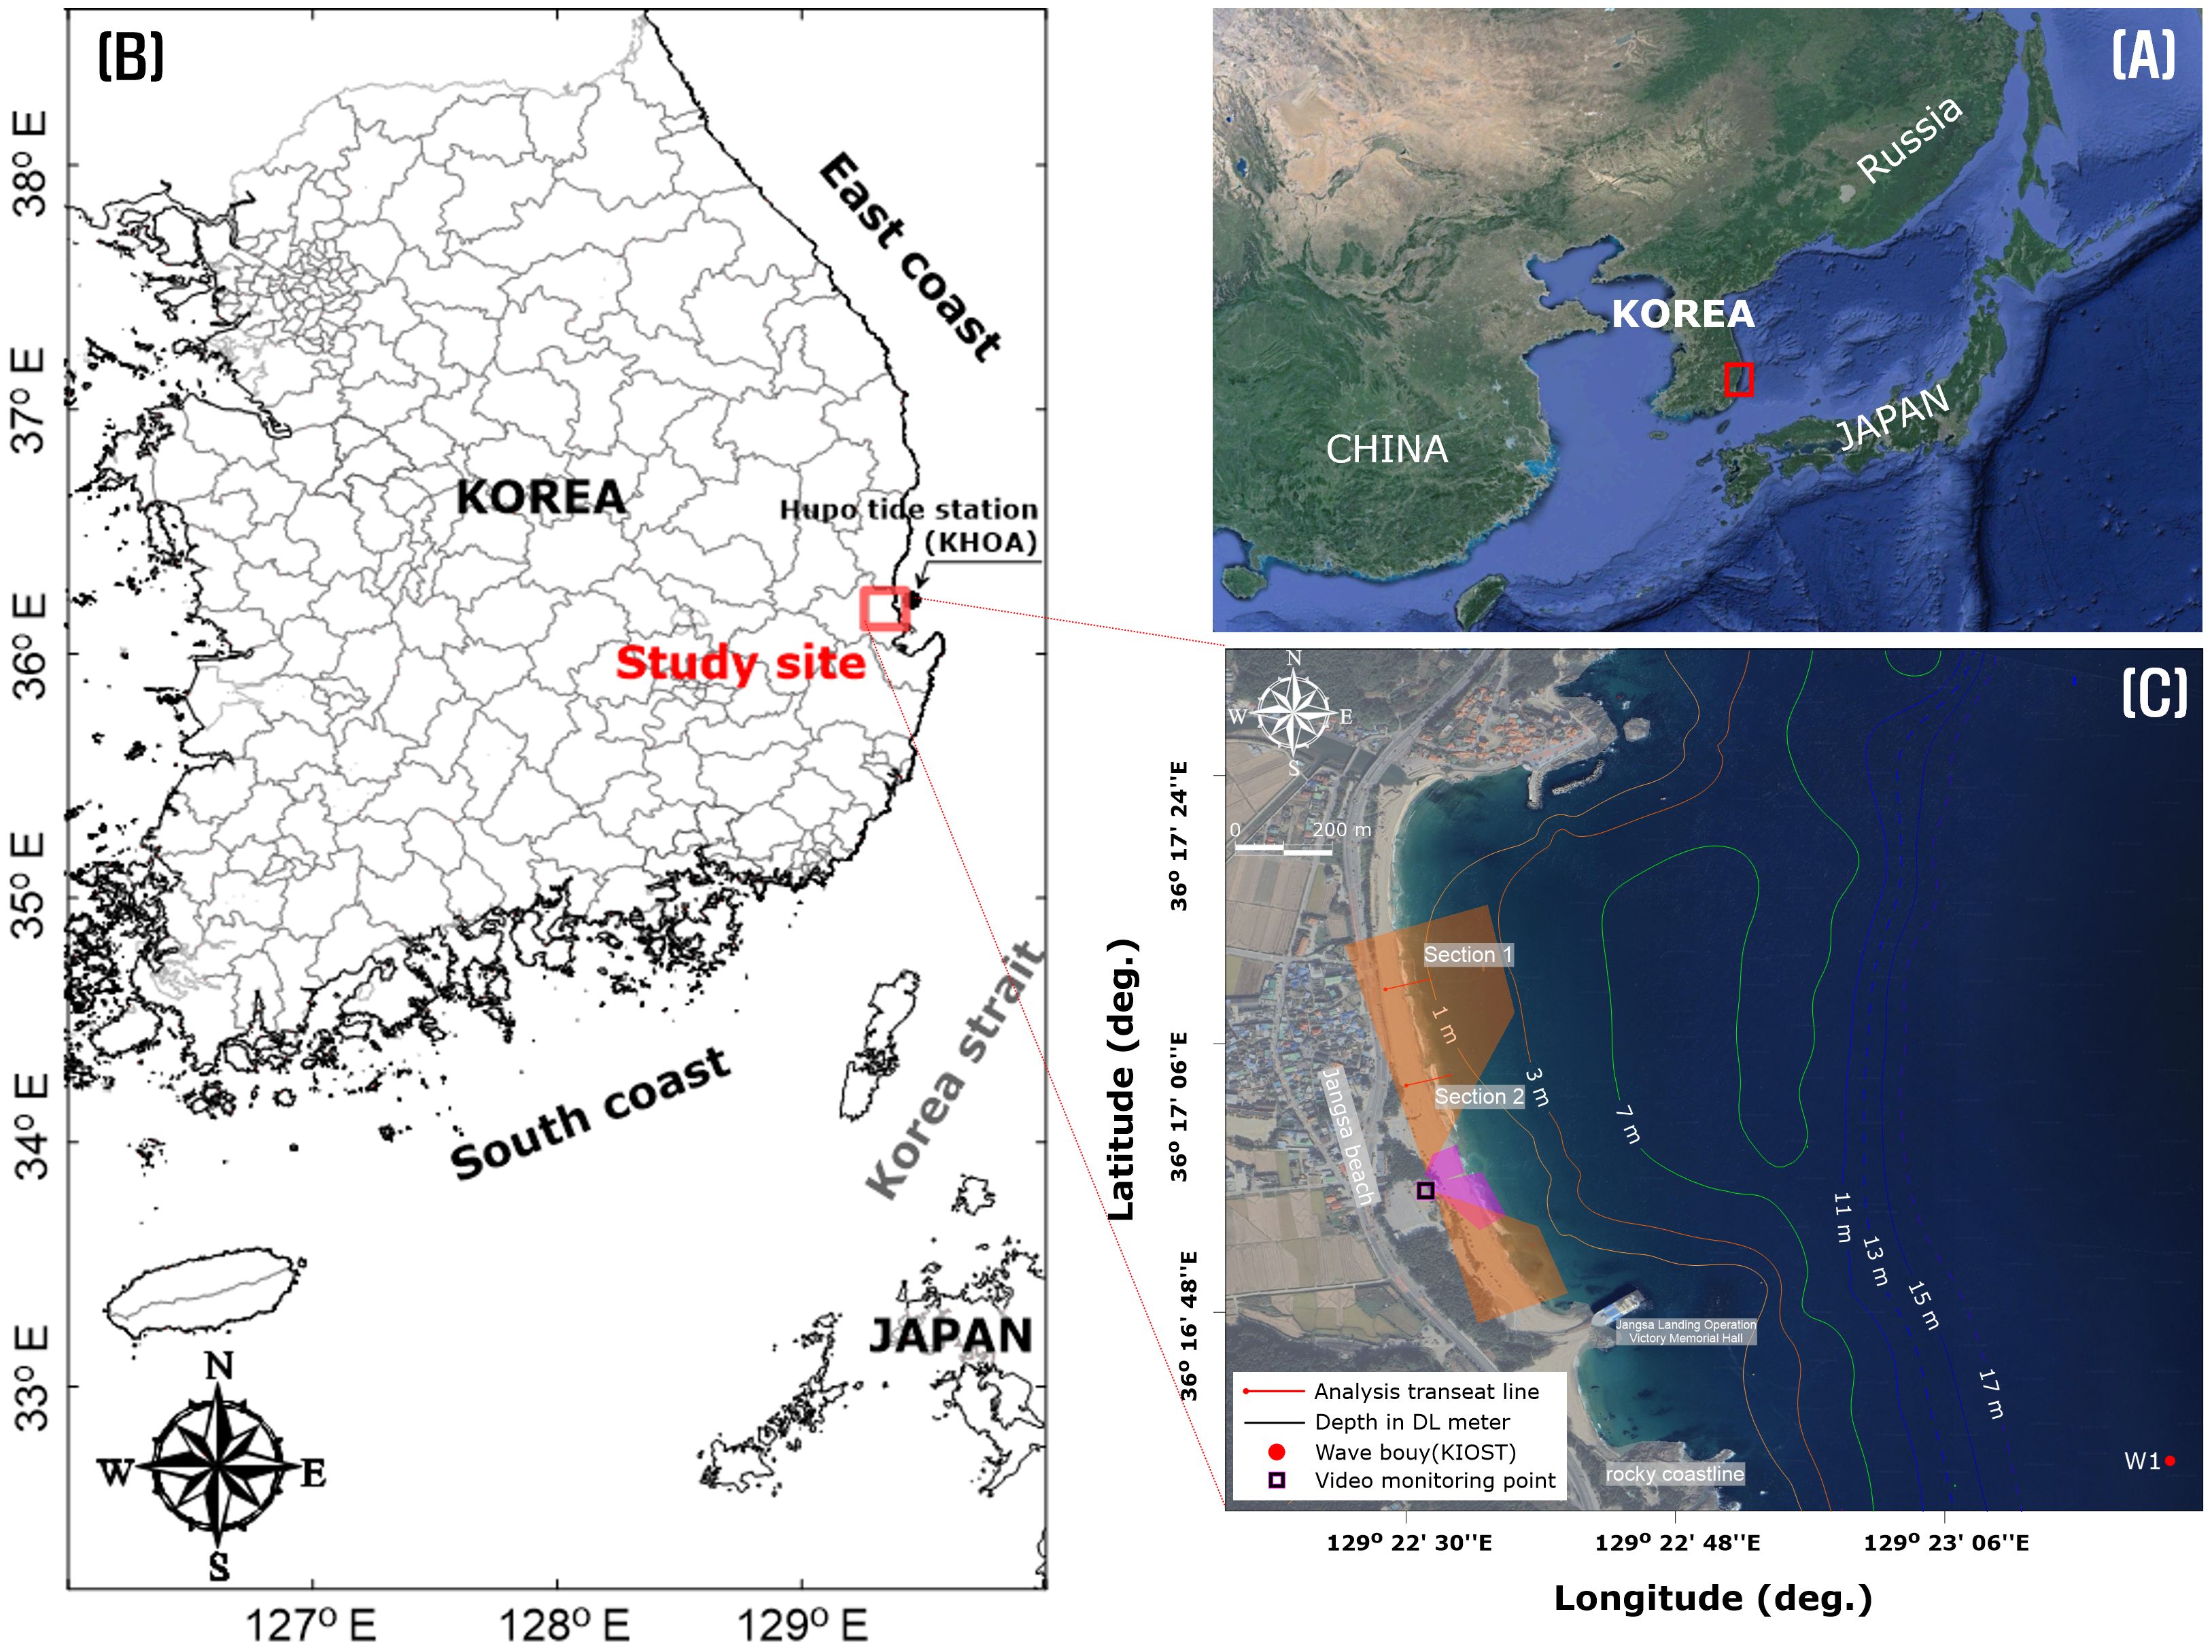
Figure 1. Geographical location of Korea (A); location of Jangsa, the area subject to in-site verification and Hupo tide station (KHOA) (B); W1 wave station (KIOST), transact line, topography, and video monitoring area in Jangsa (C).
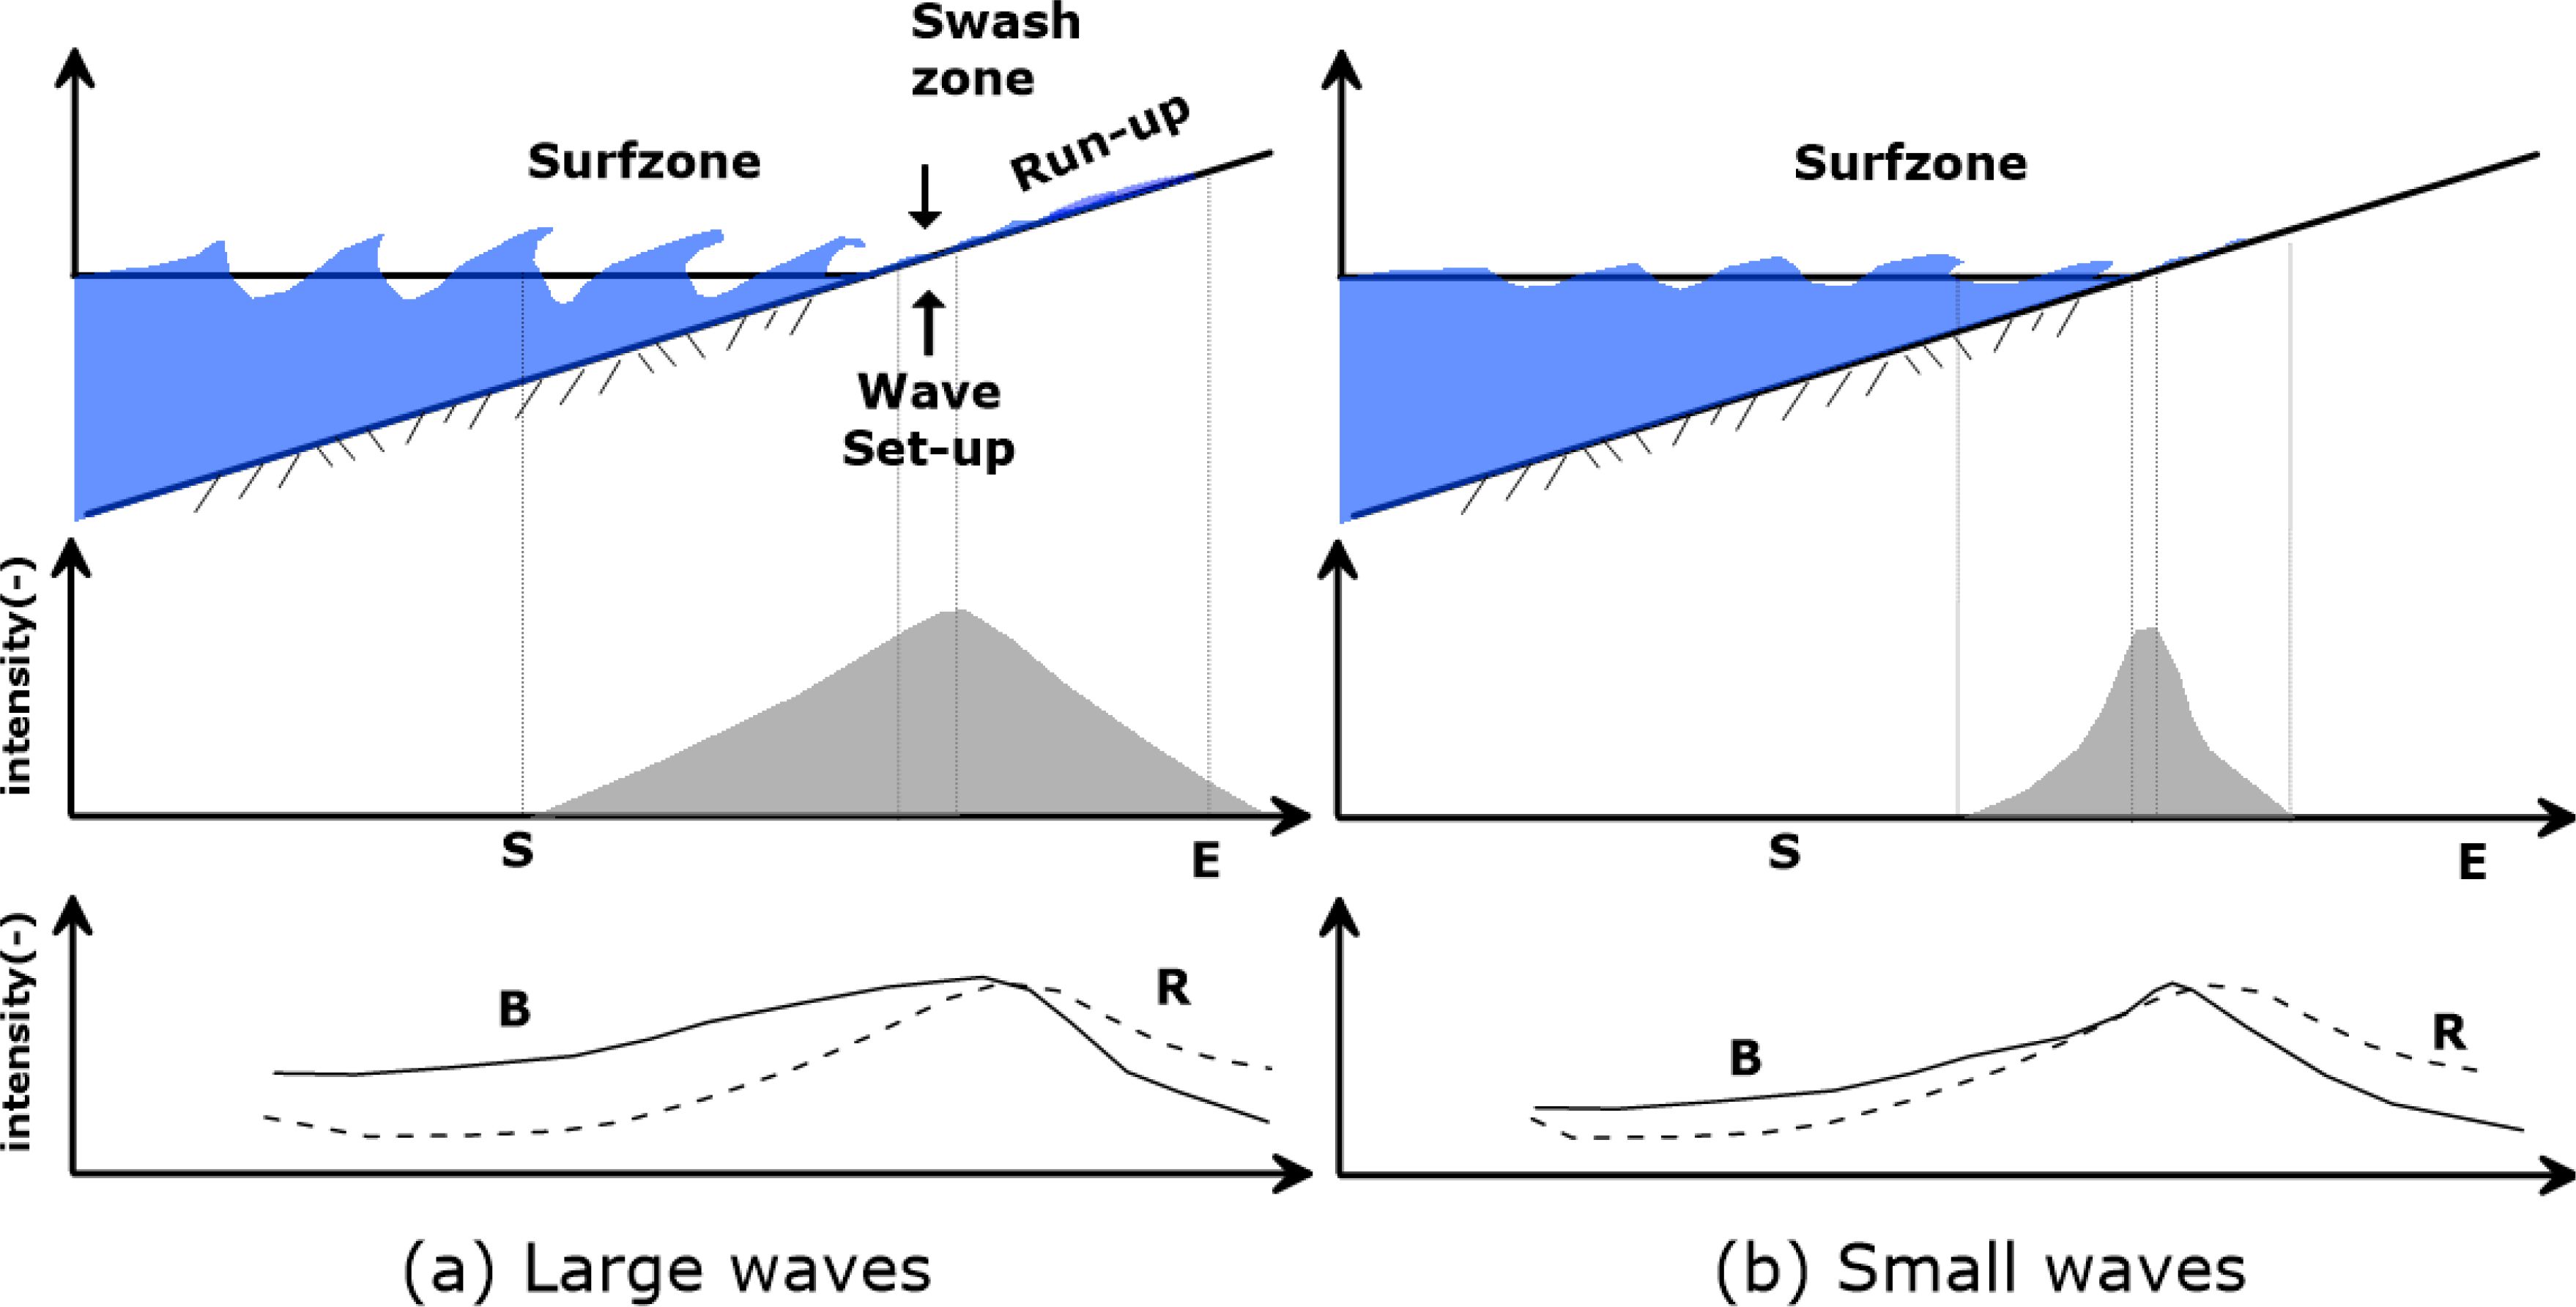
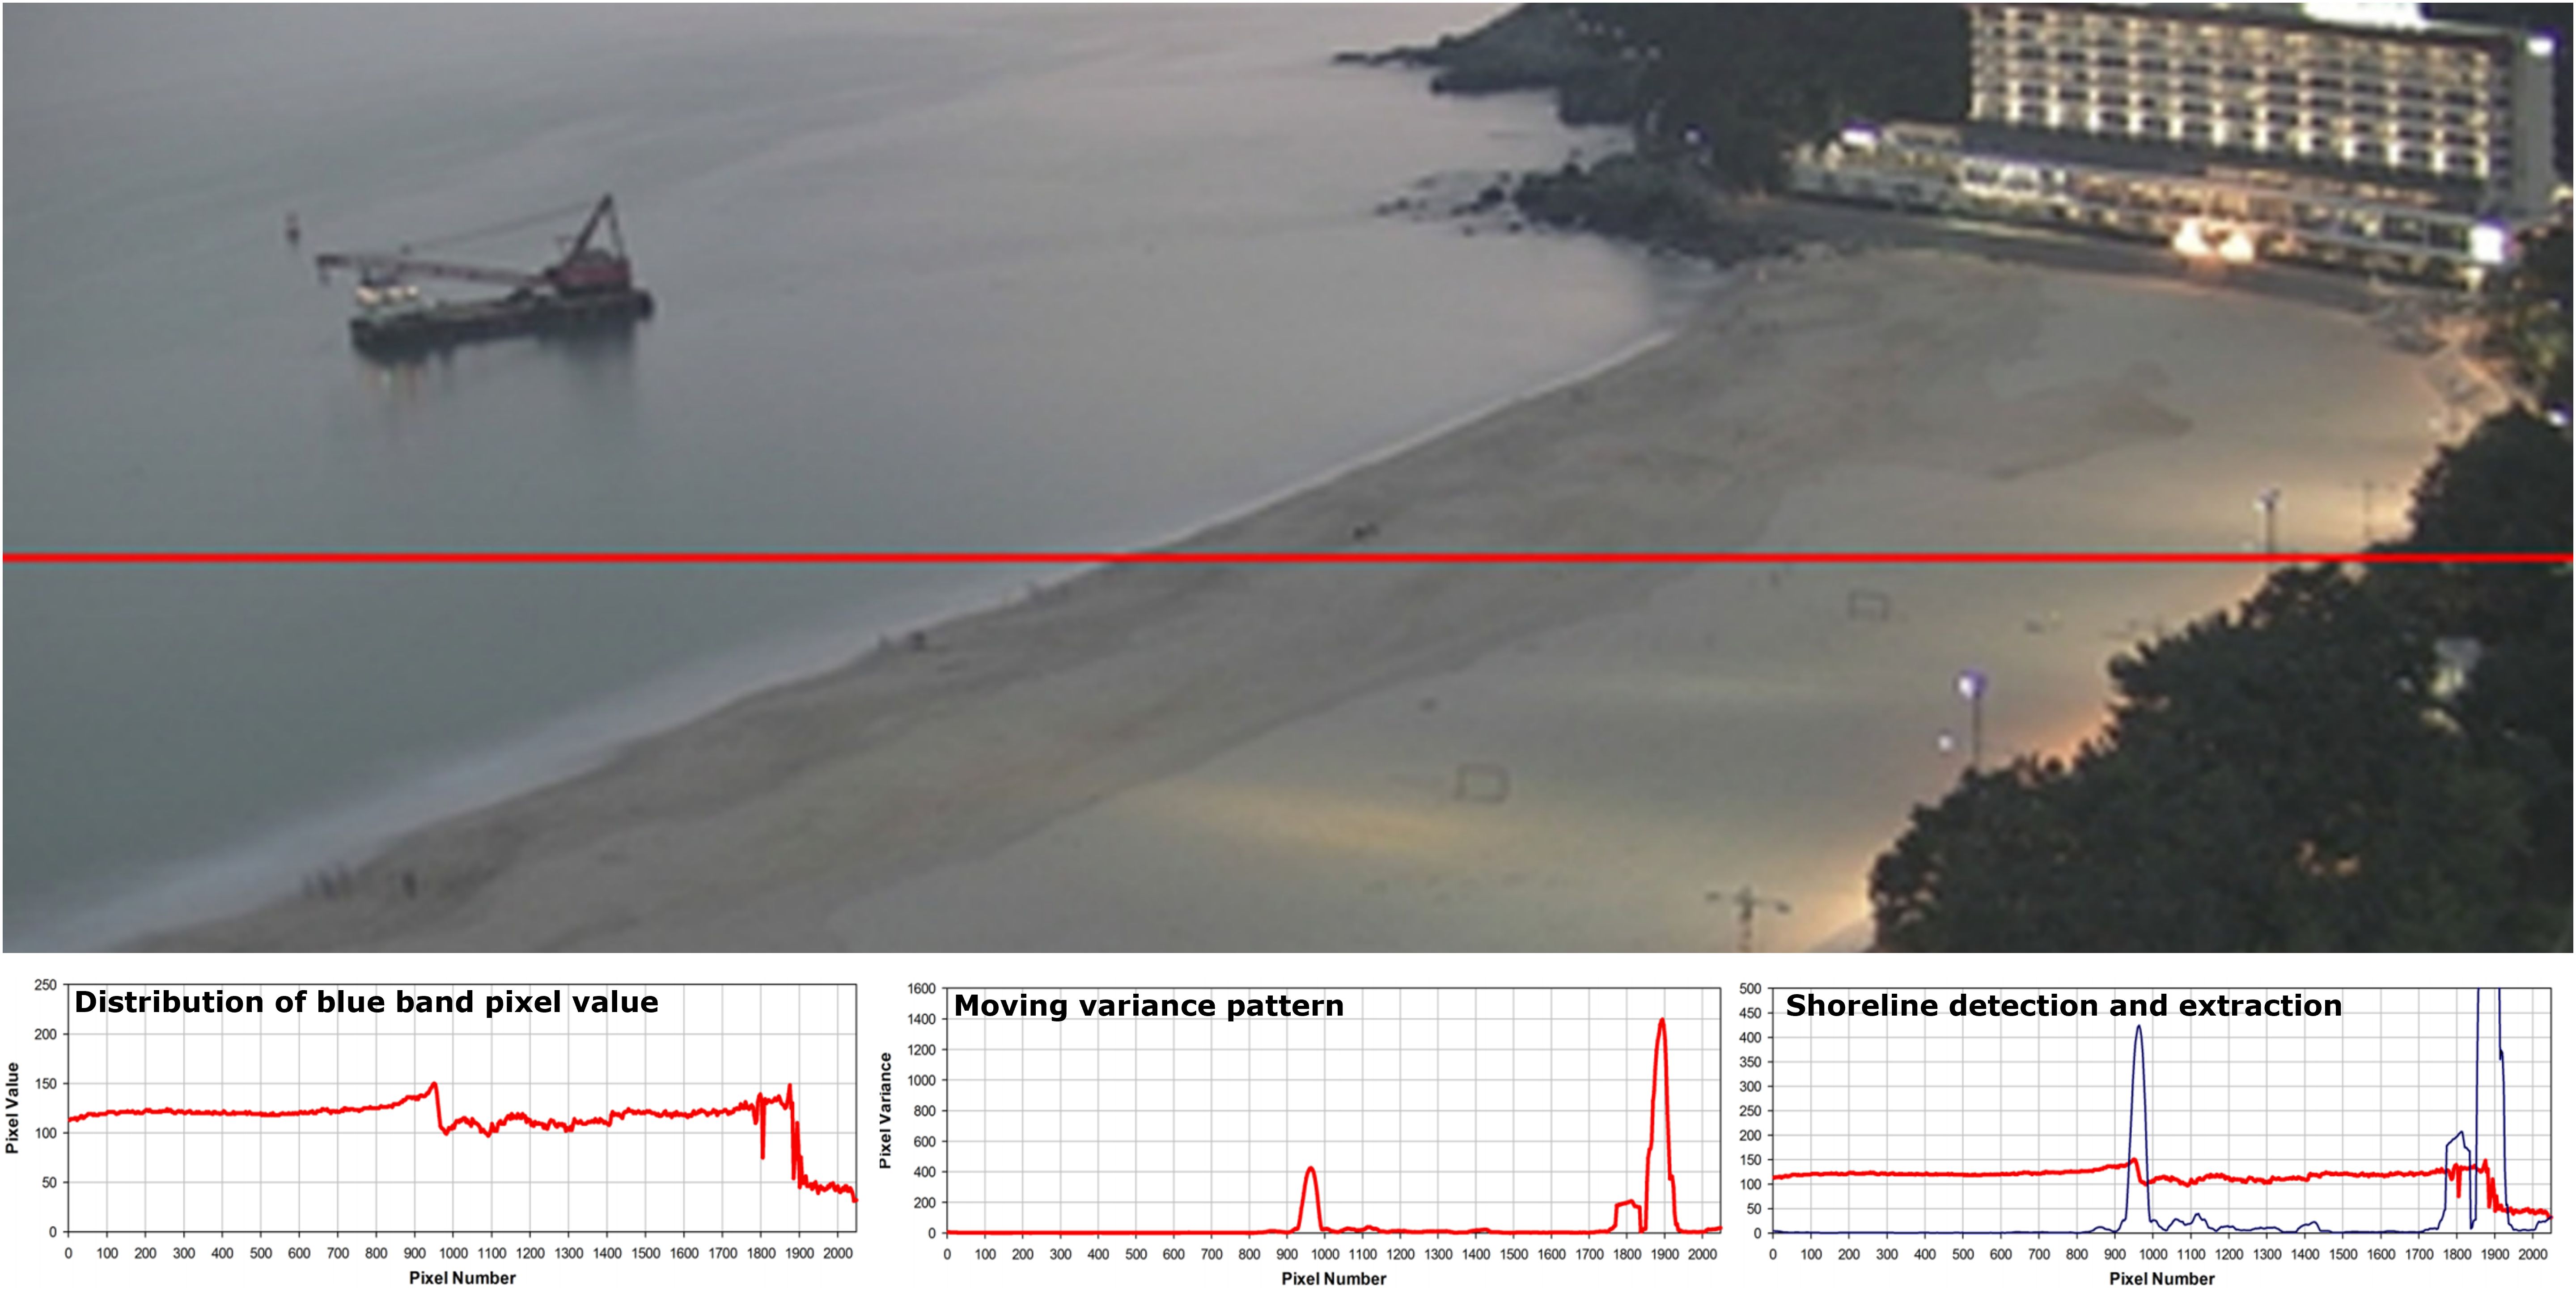
Figure 2. Spatial colour distribution in on-offshore direction on case of large waves (A); case of small wave (B) (S: Surf zone, E: Edge of shoreline).
Unlike the waves entering the offshore, the waves in the surf zone lose their inherent waveforms and react sensitively to the bathymetry, and wave energy is continuously dispersed in the swash zone. Therefore, when the images taken over a certain period are synthesized (averaged image), the swash zone area becomes darker white than other areas. To fully account for the influence of wave action, automatically saved 180 seconds (3 minutes) of average images from continuous video data (jpg) every second and analyzed the coastline using them.
2.2 Colour variation around shoreline
The dissimilarity index (DI) and the sum of squared differences (SSD) have been used to assess similarity between two images, as follows:
where D is the dissimilarity index, x is the light gray value of the original image, y is the light gray value of the test image, and i and j are two-pixel indices in the x and y direction, respectively. The grid image is converted into an orthoimage, and changes in actual positions are confirmed with a detailed grid. The mean of DI, or mean dissimilarity index (MDI), has also been used for the same purpose and could be considered as a generalized DI against image size. MDI is an index to express the clarity of the second image with respect to the original image, or to examine level of damage of the second image.
DI or MDI could also be used for tracking objects in images. However, because the equation for DI contains constant weight for the squared difference at each point, it may become inadequately influenced by far field points in the comparison window. Another problem is that a small translation of the image produces significant errors, if the image contains pixel-sized patterns. A small linear deformation in one direction will produce large errors as the distance between the comparison pixel and the reference pixel grows. Angular deformation or rotation by a small angle will also produce large errors as the distance between two pixels grows. Therefore, a reasonable damping function to reduce the influence of distant points from the point of interest on the dissimilarity would be ideal.
Sharp edges are important information for tracking objects. Edges mean big jumps in pixel values from the mathematical point of view and should be regarded with heavy weights if they are near the boundary line of interest. RGB values are included in the tracking procedure. Assigning equal weights for R, G, and B would be acceptable.
Designed new dissimilarity index to include previous dissimilarity matrix, and the damping effect matrix based on the distance between the position of interest and that of reference. The damping effect is incorporated as a two-dimensional Gaussian function which retains a finite value at the centre and the decaying property as the distance from the centre increases, as shown in Figure 3.

Figure 3. Two radius (Radius R1 for sweeping, and radius R2 for Gaussian summation). (A); Segmentation and target area (B).
The dissimilarity matrix is convoluted with the damping effect matrix to produce the new dissimilarity index. The present method is applicable to the case when only small elastic deformations take place including linear deformation, angular deformation, and rotation. In other words, the present method has no limit on translation of local images or object, which go through another algorithm of zone-screening, shown in Figure 4.
where D is the dissimilarity index; are the red, green and blue value of the original image pixel; are the red, green and blue value of the test image pixel; x and y are the two axes of the images; i, and j are the pixel indices in the x, y directions of the original image; k and l are the pixel indices in the directions of the test image; and are the mean position of assuming isotropic weight function; and w is the Gaussian weight function.
The domain of the Gaussian function for a given () position is infinite, so that there should be a limit for practical computation. Define a radius R2 for the limit of computation in Equations 2–5. Then, it is finding the minimum D value by screening the pixels within the circle of radius R1, and the position () with the minimum D becomes the position found, reversely tracked from the position () in the second image. Then, the new class of the reference pixel () inherits that of the position () in original image. Because every pixel in the second image is examined, the new segmentation map has no omission of class, except the boundary band of the second image of width of R1+R2 due to the logics above. It should be noted that the radius R1 should be large enough to account for possible translations of the local image or an object. The computational algorithm for discrimination of erosion and deposition from changes between images is summarized in Figure 5.
2.3 Orthoimage conversion of video monitoring and PIMACS coastline analysis method
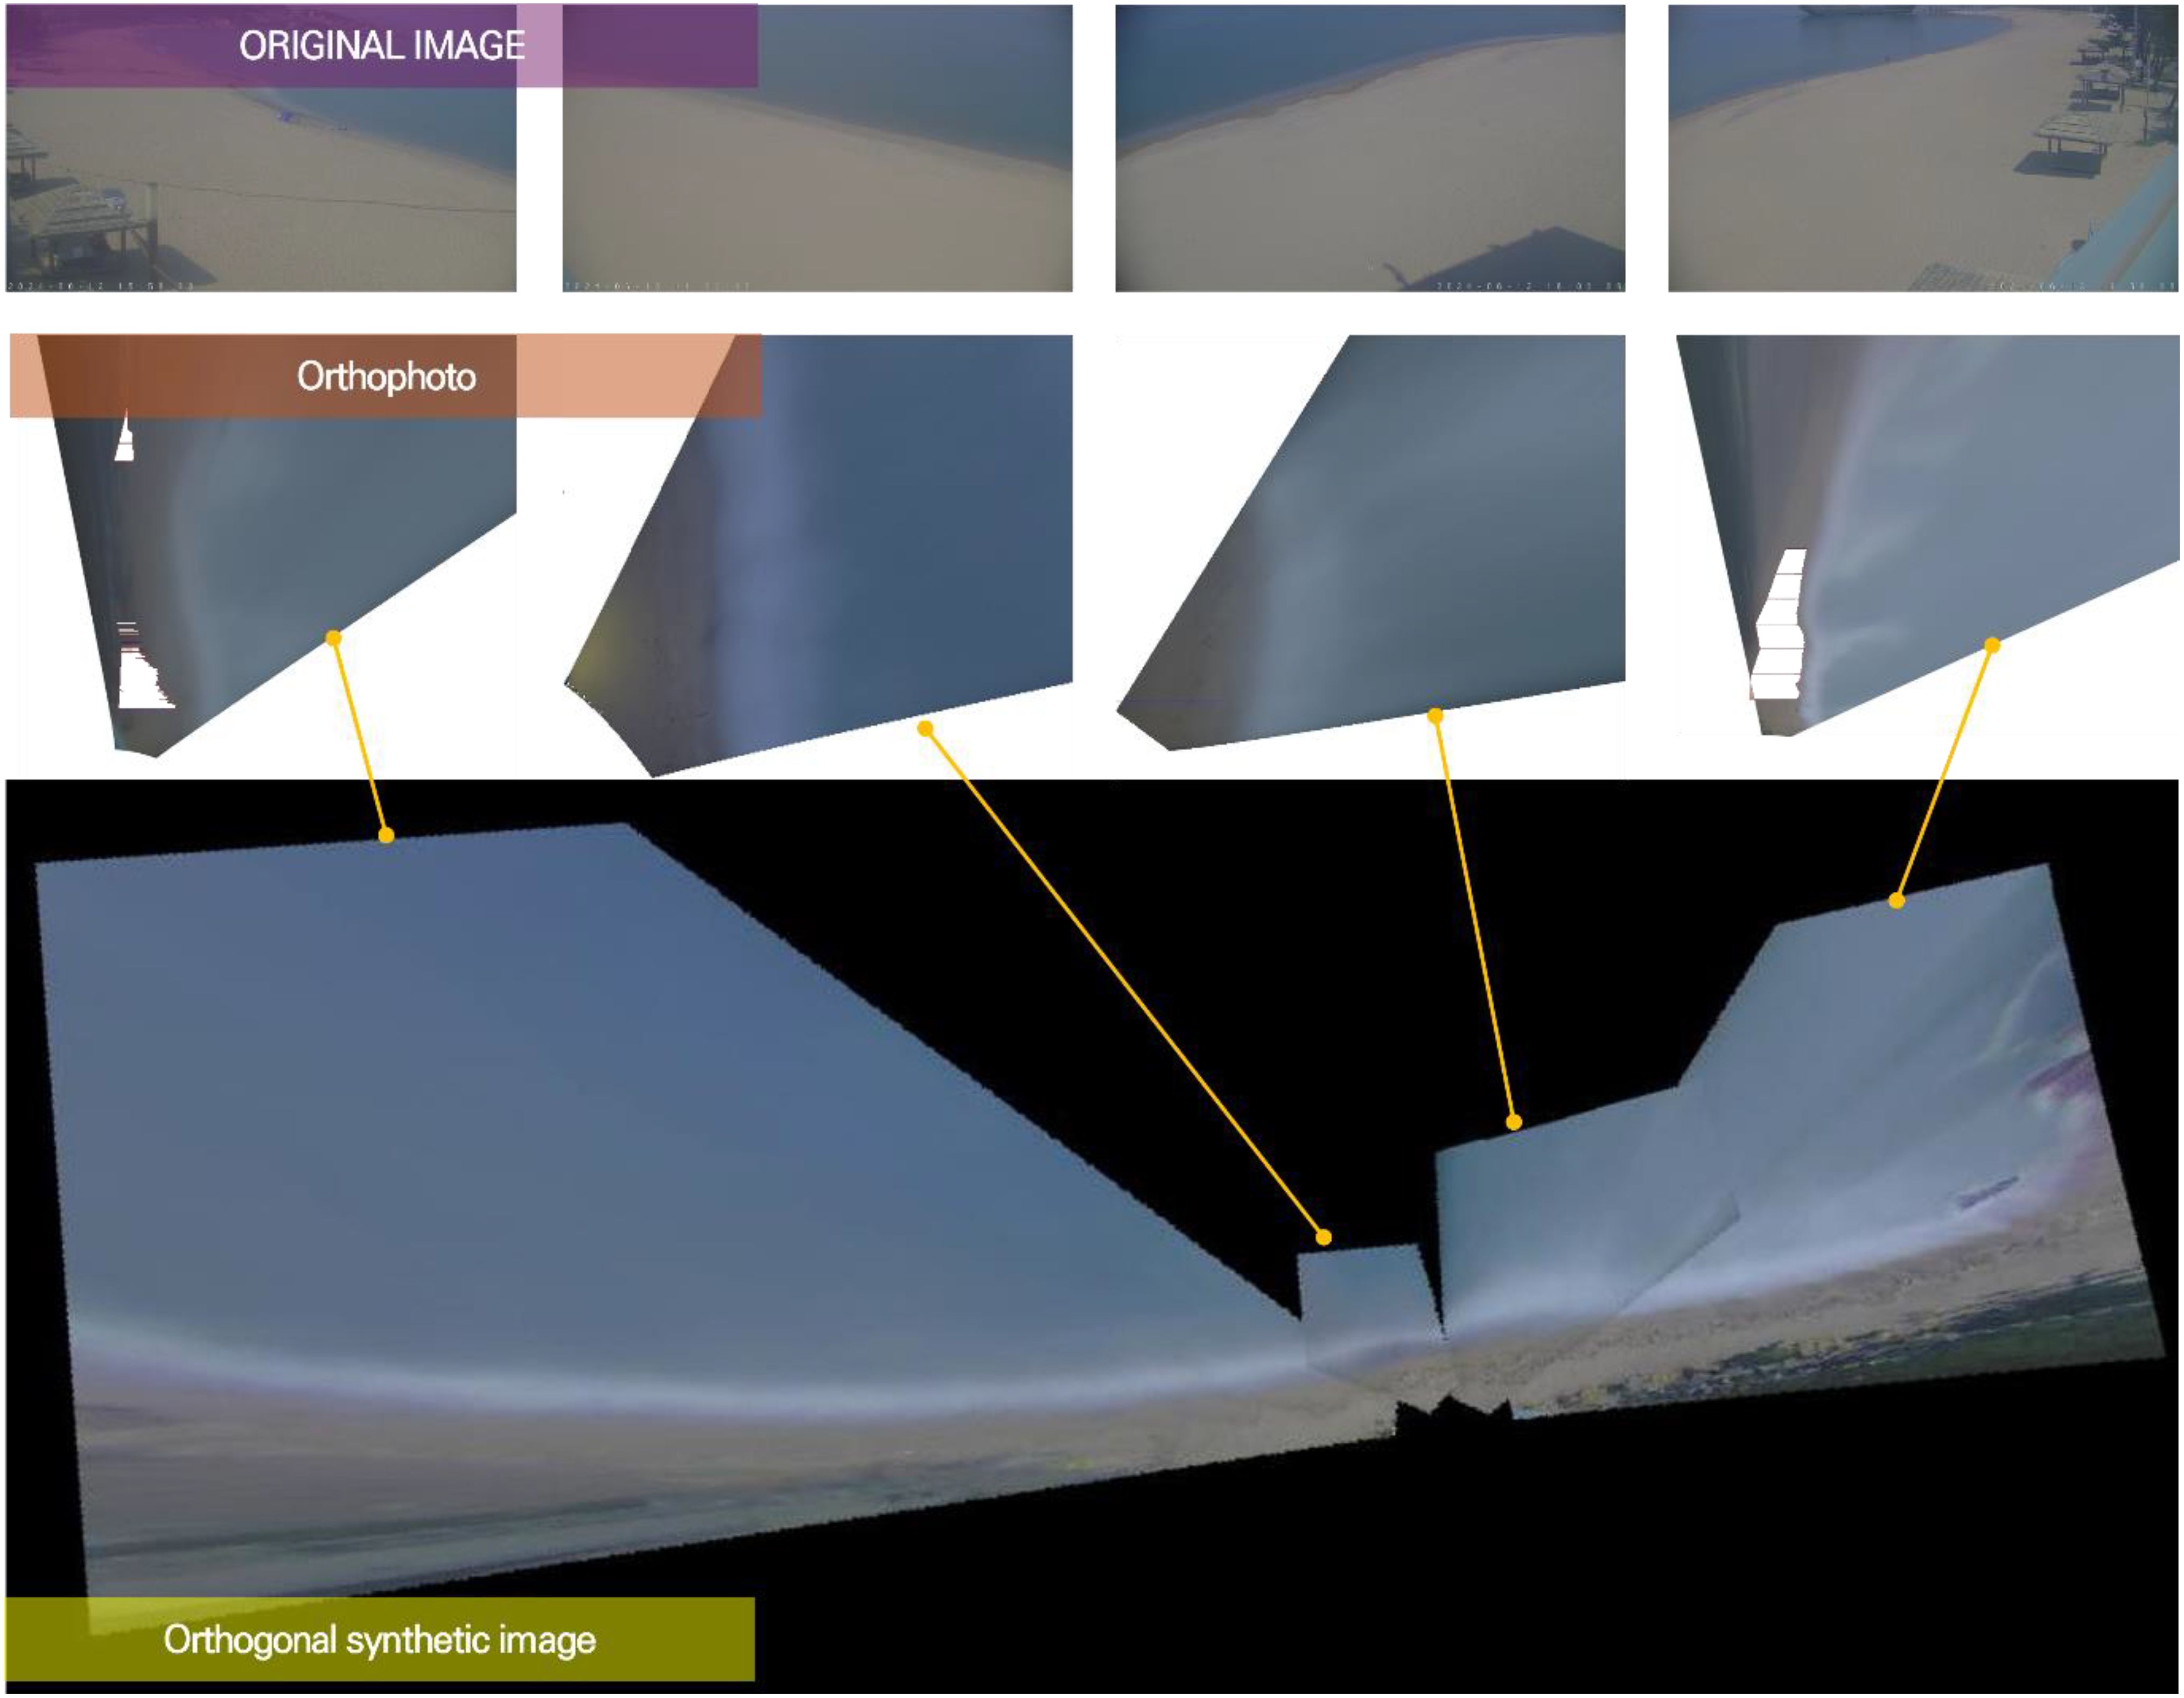
A total of four cameras were installed and operated at location on land at Jangsa Beach since in 2018. As shown in Figure 1, it is utilized for image transformation, coastline extraction, and analysis. Rectification was performed using the direct linear transform method with reference to the research of Holland et al. (1997), and geometric transformation was performed using the focal length (focal length, azimuth, and camera elevation) based on the basic principles of photogrammetry. The schematic diagram of Jangsa video monitoring ortho correction and orthoimage synthesis created through this process is shown in Figure 6.
To extract beach width from image information, Kim (2014) Pixel Intensity Moving Average Coastal Shoreline (PIMACS) method was applied as shown in Figure 7. Based on the coastline in the image, the difference in pixel color characteristics between the maritime and land areas was used as a specific band to determine the first point where the color characteristics changed rapidly as the coastline. Patterns were extracted using the PIMACS method along the monitoring baseline and were relatively effectively extracted from images with backlight due to sunrise and sunset, fog, cloudy weather, water pooling, and changes in color due to changes in solar altitude. The shoreline for each transect was extracted from the projected orthoimage, and the beach width was calculated.
3 Analysis results
3.1 Test of minimum convolution of Gaussian weight and squared differences
On the original image shown in Figure 8A, a new tracking method, Minimum Convolution of Gaussian Weight and Squared Differences (MCGWSD), was tested. Its size is 115×340 pixel, and it shows a piece of orange peel on a wooden floor. Natural boundary curve is visible around the peel with sharp edges on colour. However, it draws a straight conceptual reference line piercing through the peel, similar to a centre line of the peel. The intentionally drawn line could also be considered a boundary line which does not express a sharp colour edge. The boundary line does not have a closed shape, but a straight line, and is simpler than a box or band. 0 to 255 values are across the artificial boundary line, and get an annotation map, see Figure 8B.
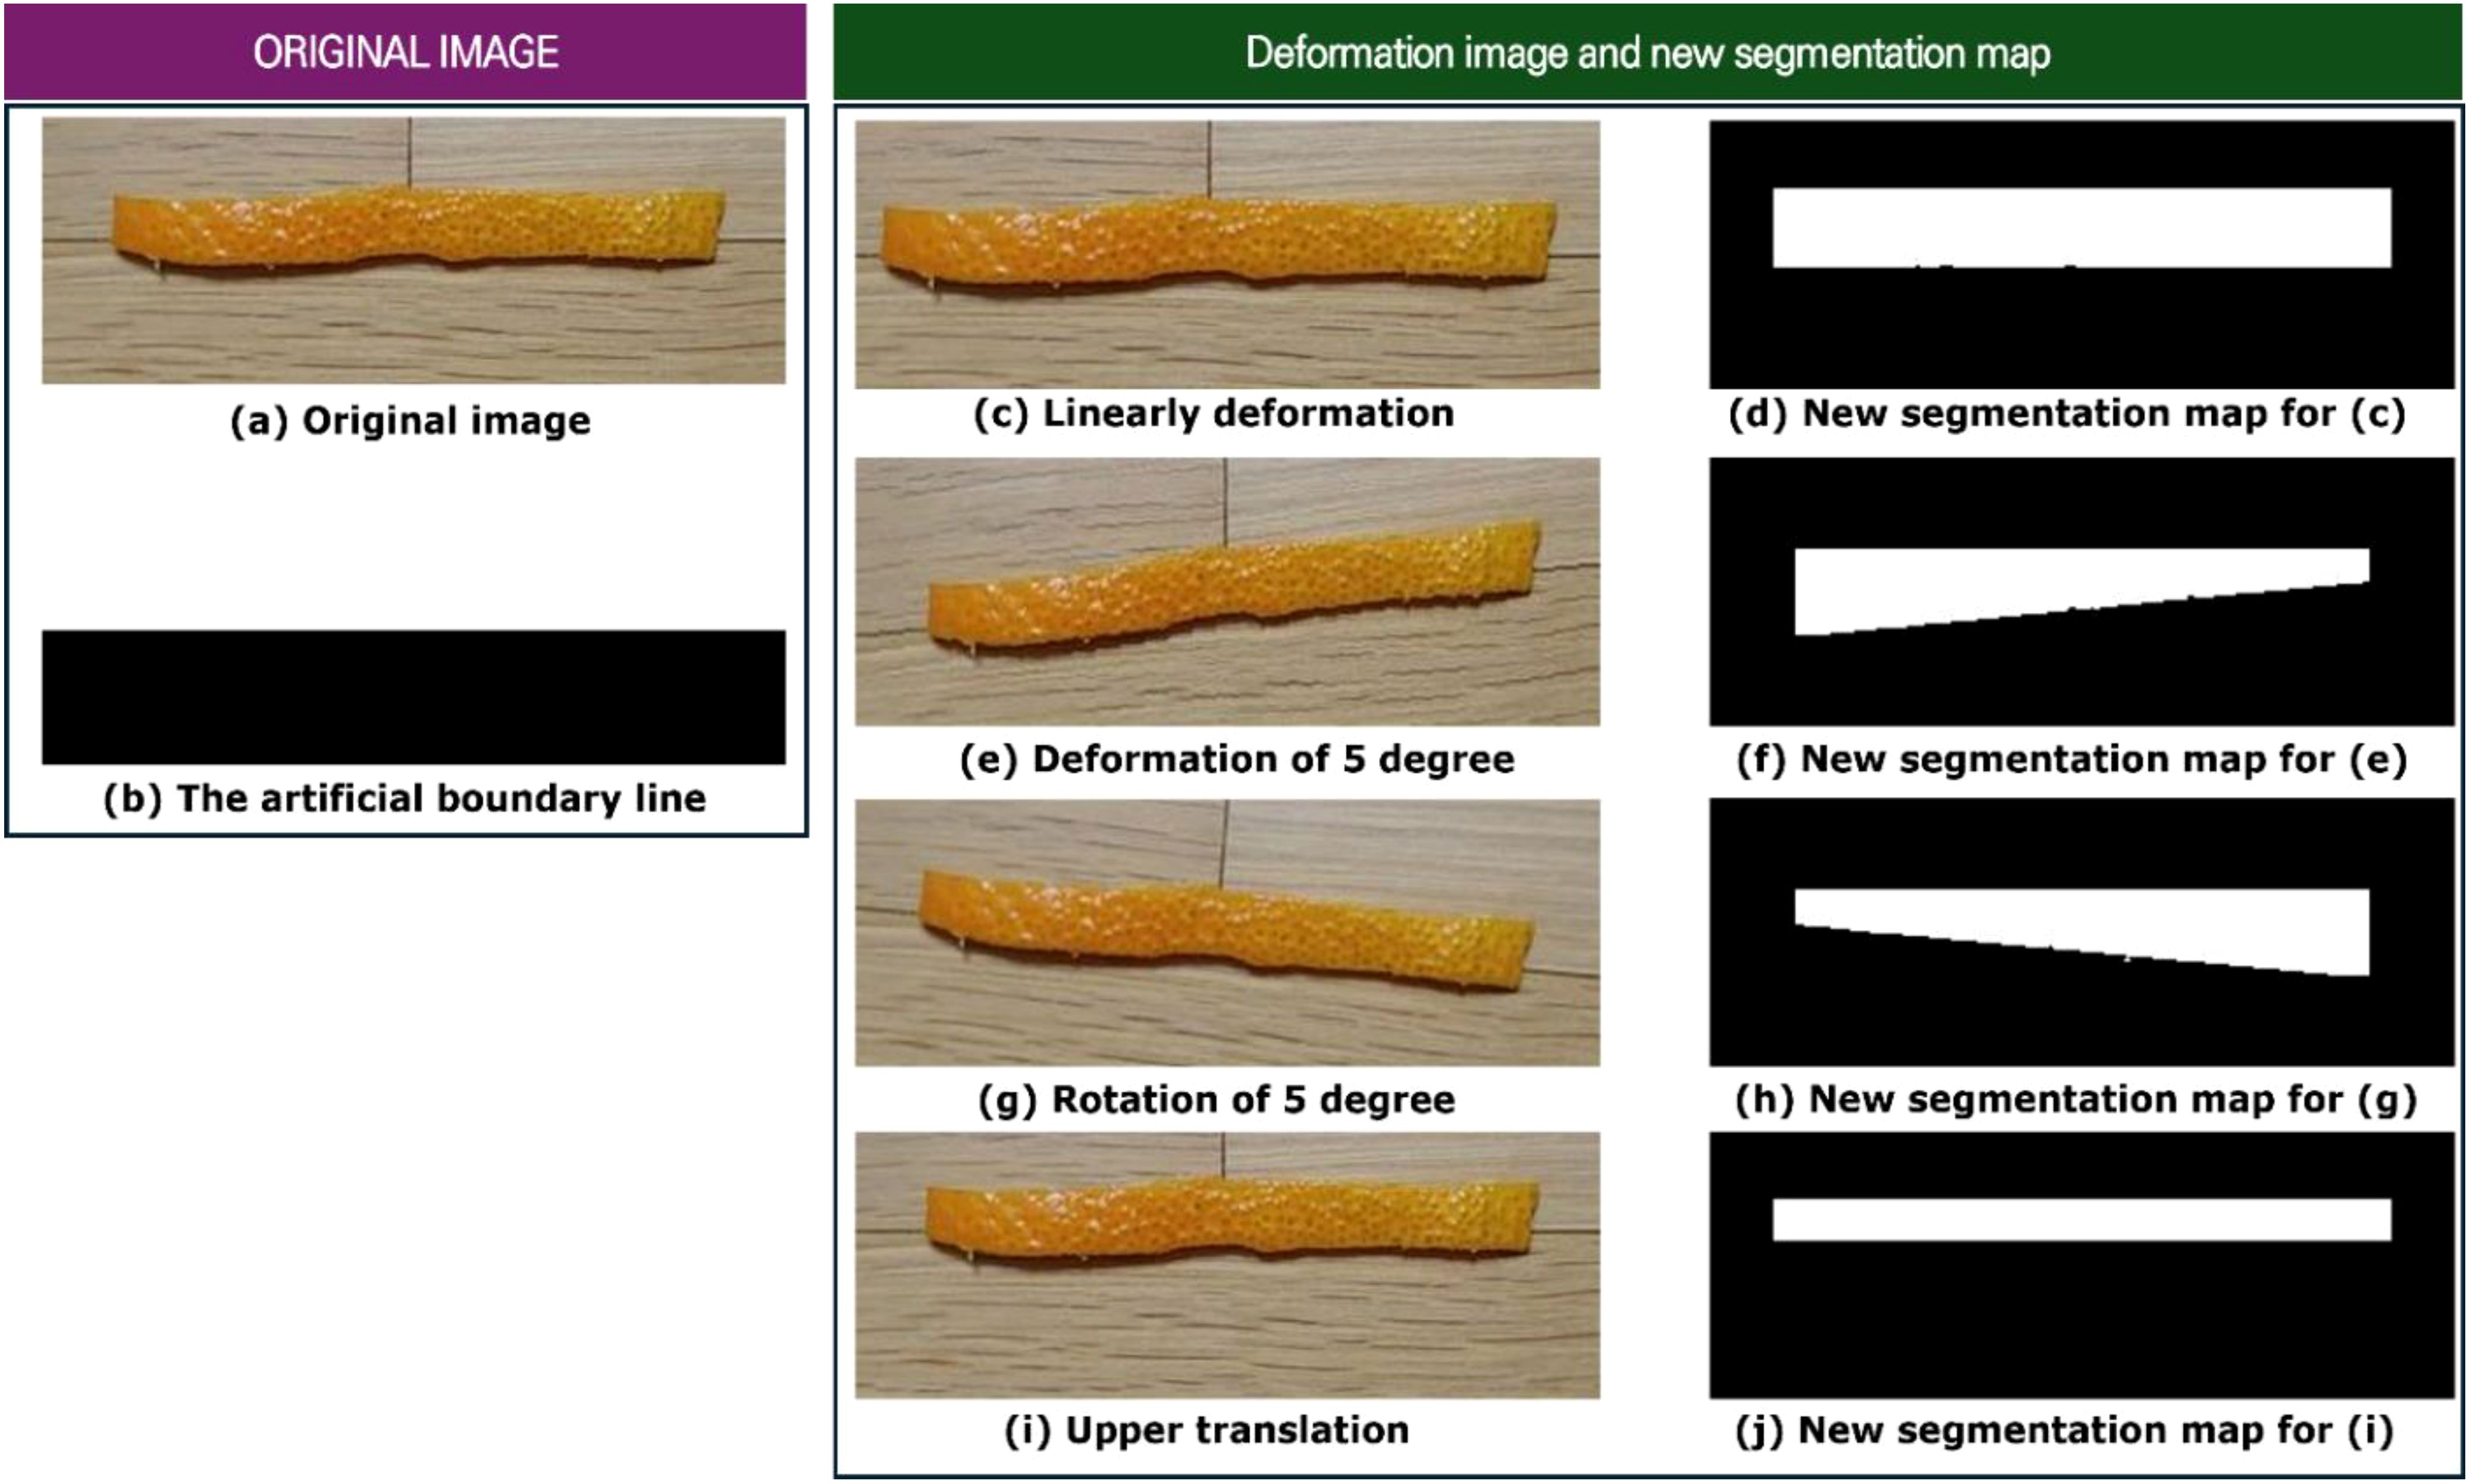
Figure 8. Testing result of minimum sum of Gaussian squared differences [Original image (A); The artificial boundary layer (B); Linearly deformation (C); New segmentation map (D); Deformation of 5 degree (E); New segmentation map (F); Rotation of 5 degree (G); New segmentation map (H); Upper translation (I); New segmentation (J)].
First, a case with linear deformation is examined. The original image is linearly deformed in the x direction by 7%. The deformed image is shown in Figure 8C. The convolution of Gaussian weight and the squared differences is produced at every point of the deformed image. The new segmentation map for Figure 8C is shown in Figure 8D, displaying an almost straight boundary line similar to the original image. Small, rough disturbances are observed along the boundary line, but the roughness does not exceed 2 pixels. The new method works well for small linear deformations such as 7%.
Second, a case of angular deformation is examined. The original image is deformed with an angular deformation of 5 degrees, as seen in Figure 8E. Even though the deformation angle is not large, the squared difference increases sharply with the distance between the pixel of interest and the reference pixel. The new segmentation map obtained by the new Gaussian weight method is shown in Figure 8F. The boundary line represented by the segmentation map reflects an almost accurate deformation angle of 5 degrees, which is satisfactory.
Third, a case of rotation is examined. The original image rotates by 5 degrees, as illustrated in Figure 8G. A new segmentation map is obtained by the new method, shown in Figure 8H. The new map displays a rotated boundary line nearly 5 degrees from the original image with minimal disturbance, which is satisfactory.
Lastly, a case of translation is examined. The original image translates by 10 pixels in the y direction, degrees, as seen in Figure 8I. It should be noted that both the object and the background of the image translate simultaneously to examine the effect of pure translation. R1 is assigned sufficiently large as 30. The newly computed segmentation map from the second image using the present method is shown in Figure 8J. The new boundary line demonstrates an almost exact translation from the original position, which is satisfactory.
The new method proposed here operates well for linear deformation, angular deformation, and rotation with the help of convolution of the image pixel values matrix with Gaussian weights matrix, and translation with the help of finding MDIs while screening over a circular zone of radius R1.
3.2 Application of MCGWSD method to Jangsa Beach
Video monitoring at Jangsa Beach started in 2018, which was part of the Coastal Erosion Survey Project commissioned by the Ministry of Oceans and Fisheries (MOF). Images from 1 September 2020 to 15 September 2020 have been observed. During the period strong typhoons Maysak and Haishen impacted Jangsa Beach. The time-series of the significant wave height, the significant wave period, the wave direction measured at St. W1 at 20 m depth around the mid-south of the beach, and the tidal level during the above period are shown in Figure 9. The largest significant wave height during the period was 6.8 m, and the significant wave period for the largest significant wave height was 10.0 s. Dominant wave direction during the typhoon was NE, and the PIMACS method was used to analyze the beach widths along two sections during the period.
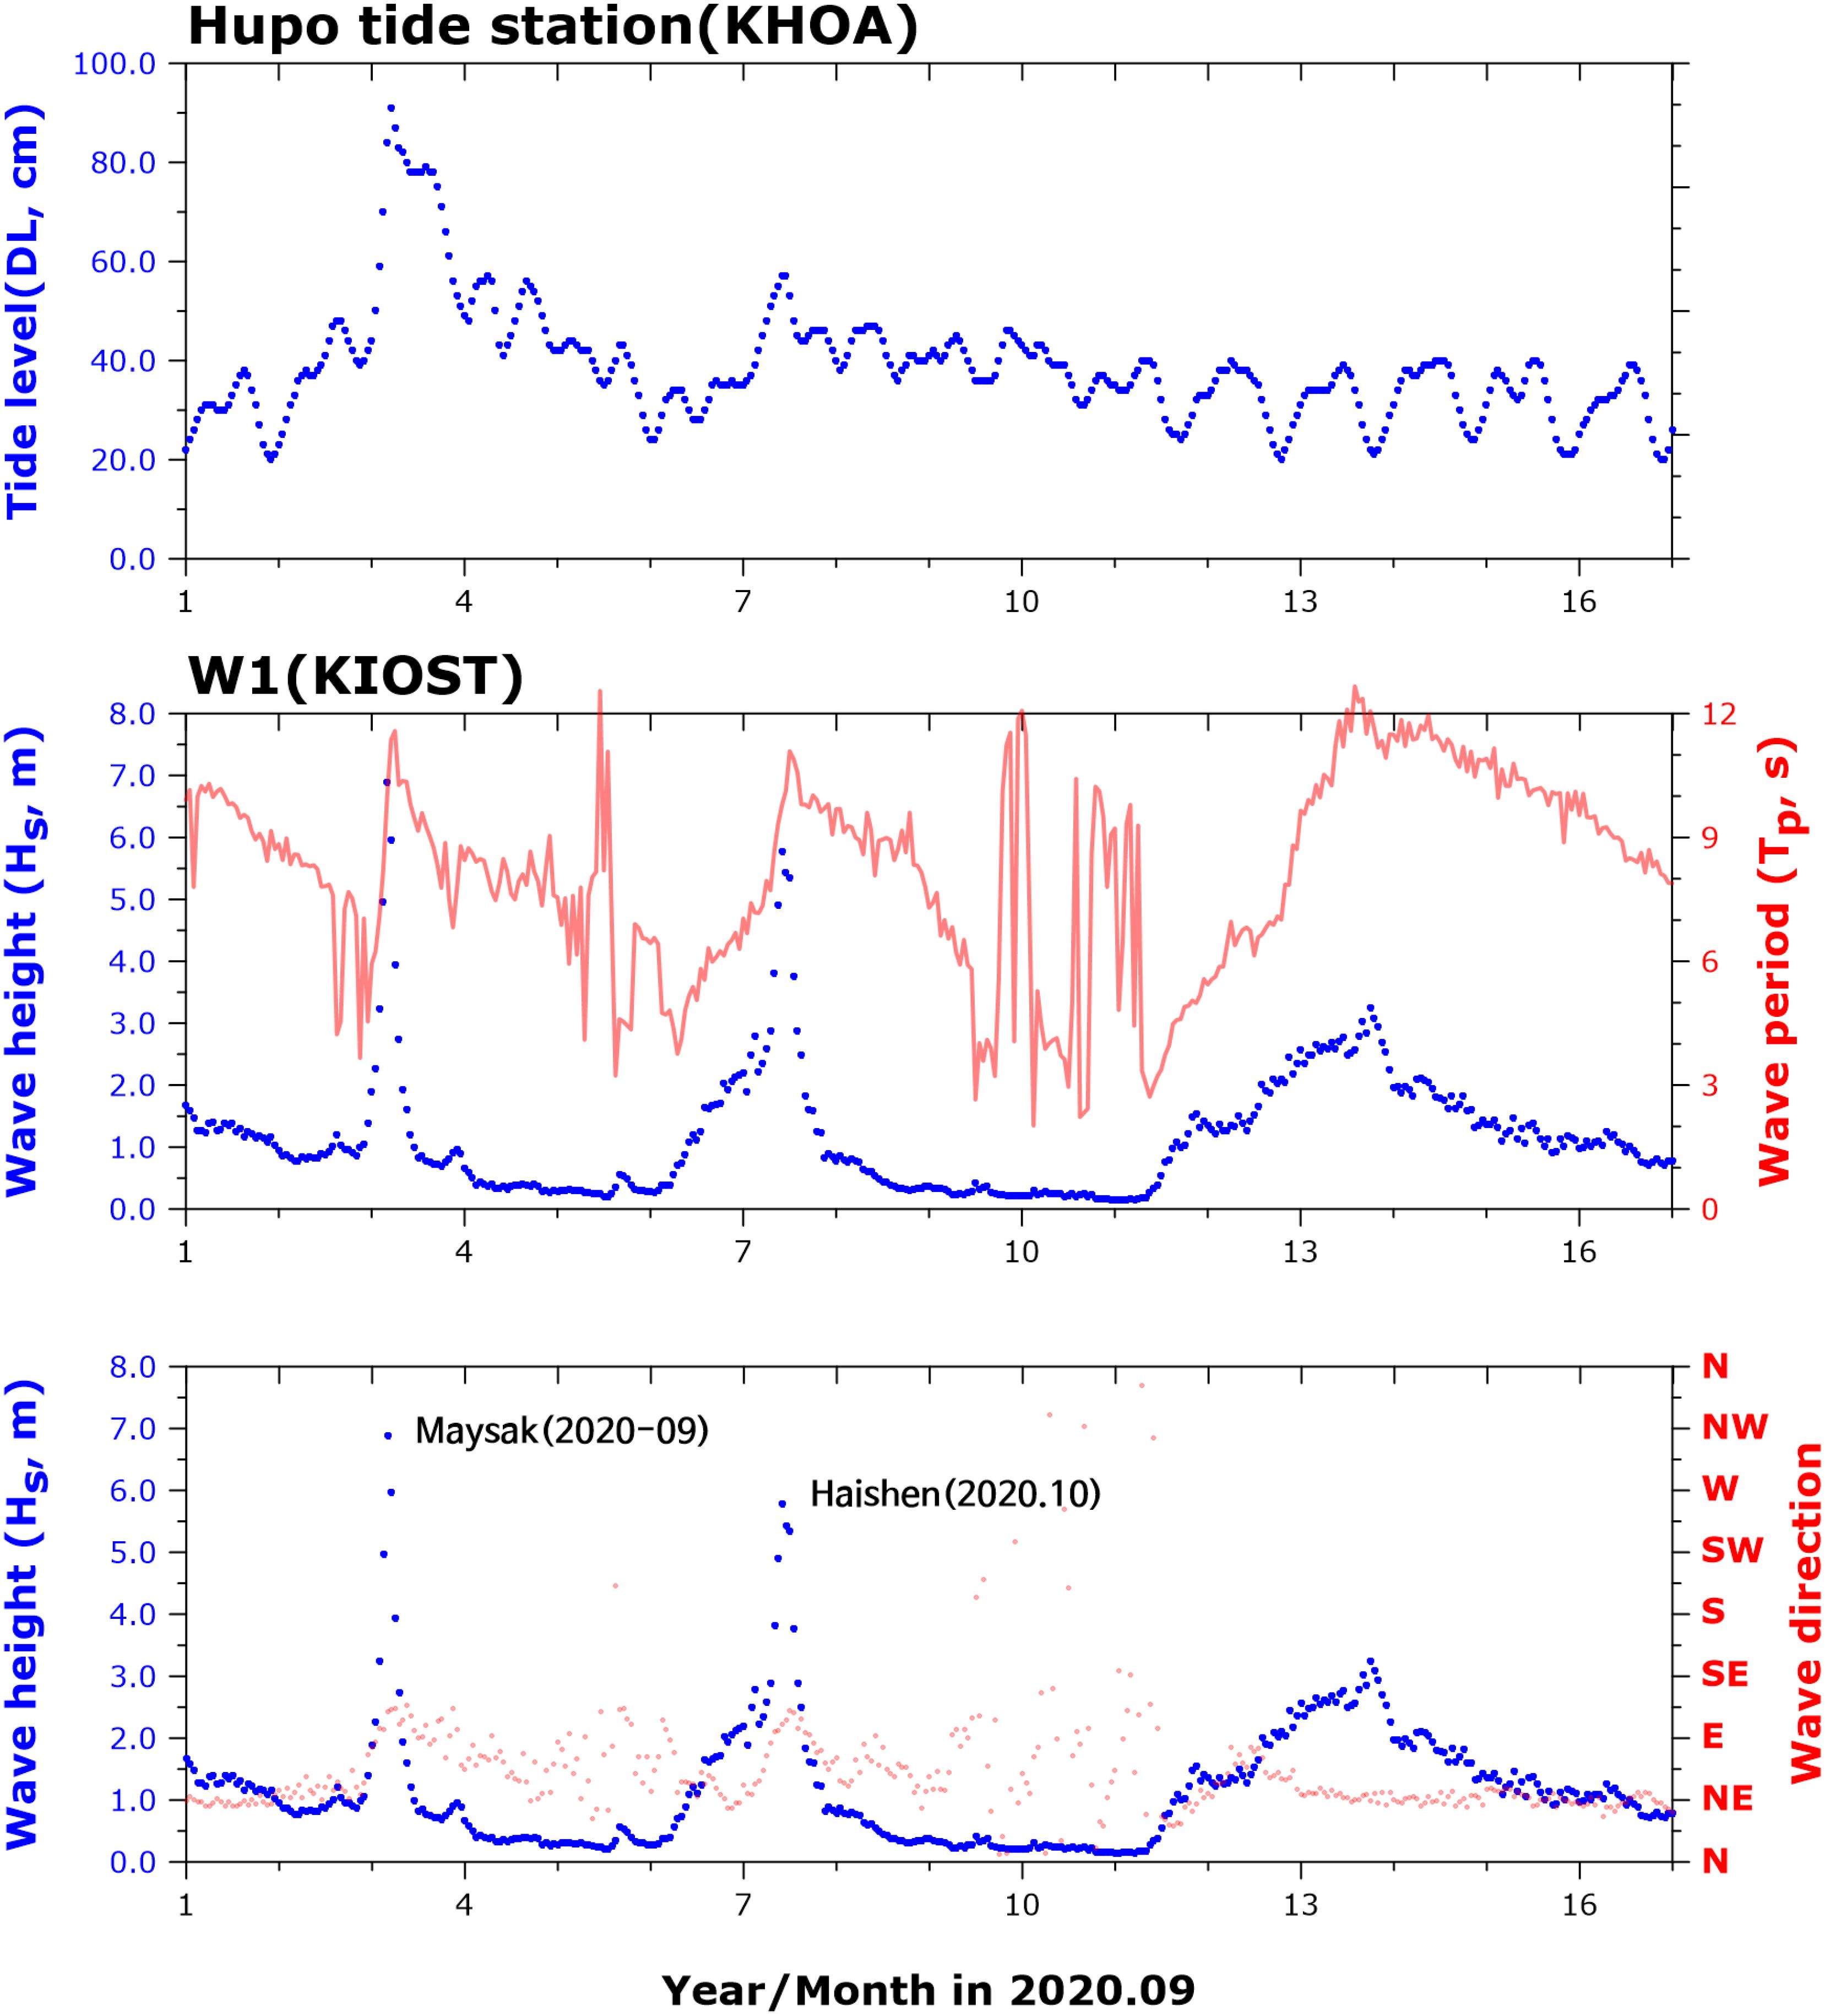
Figure 9. Tide level (KHOA), wave height, period, direction (W1) during typhoons Maysak (2020-No. 09) and Haishen (2020-No.10).
Video images at three times, time 1: 1 September 2020 13:30, time 2: 12 September 2020 07:00, and time 3: 15 September 2020 10:00 are shown from Figures 10A–C. The bird-eye images are transformed or geo-rectified to plan map images. The plan map images needed to undergo normalization process, as the averages and the variances RGB pixel numbers for the 3 images were above tolerance. In this case the 3 images show small differences in the averages, and the variances’ relative error are smaller than 5%, respectively. Only the Jangsa Beach part of plan images was used for the following study, while the Jangsa Harbors area in the southern part of images was deleted, as shown in Figure 10. This is because if areas containing light reflection and dispersion in the image are excessively used for analysis, analysis errors and distortions will worsen. Tidal levels at the time were 31cm, 38cm, and 32cm, respectively. The typical beach face slope at the beach is known about 1/8, tidal level differences between 7cm, and 6 cm, can cause 0.5m less than difference in shoreline position, which is a very small value.
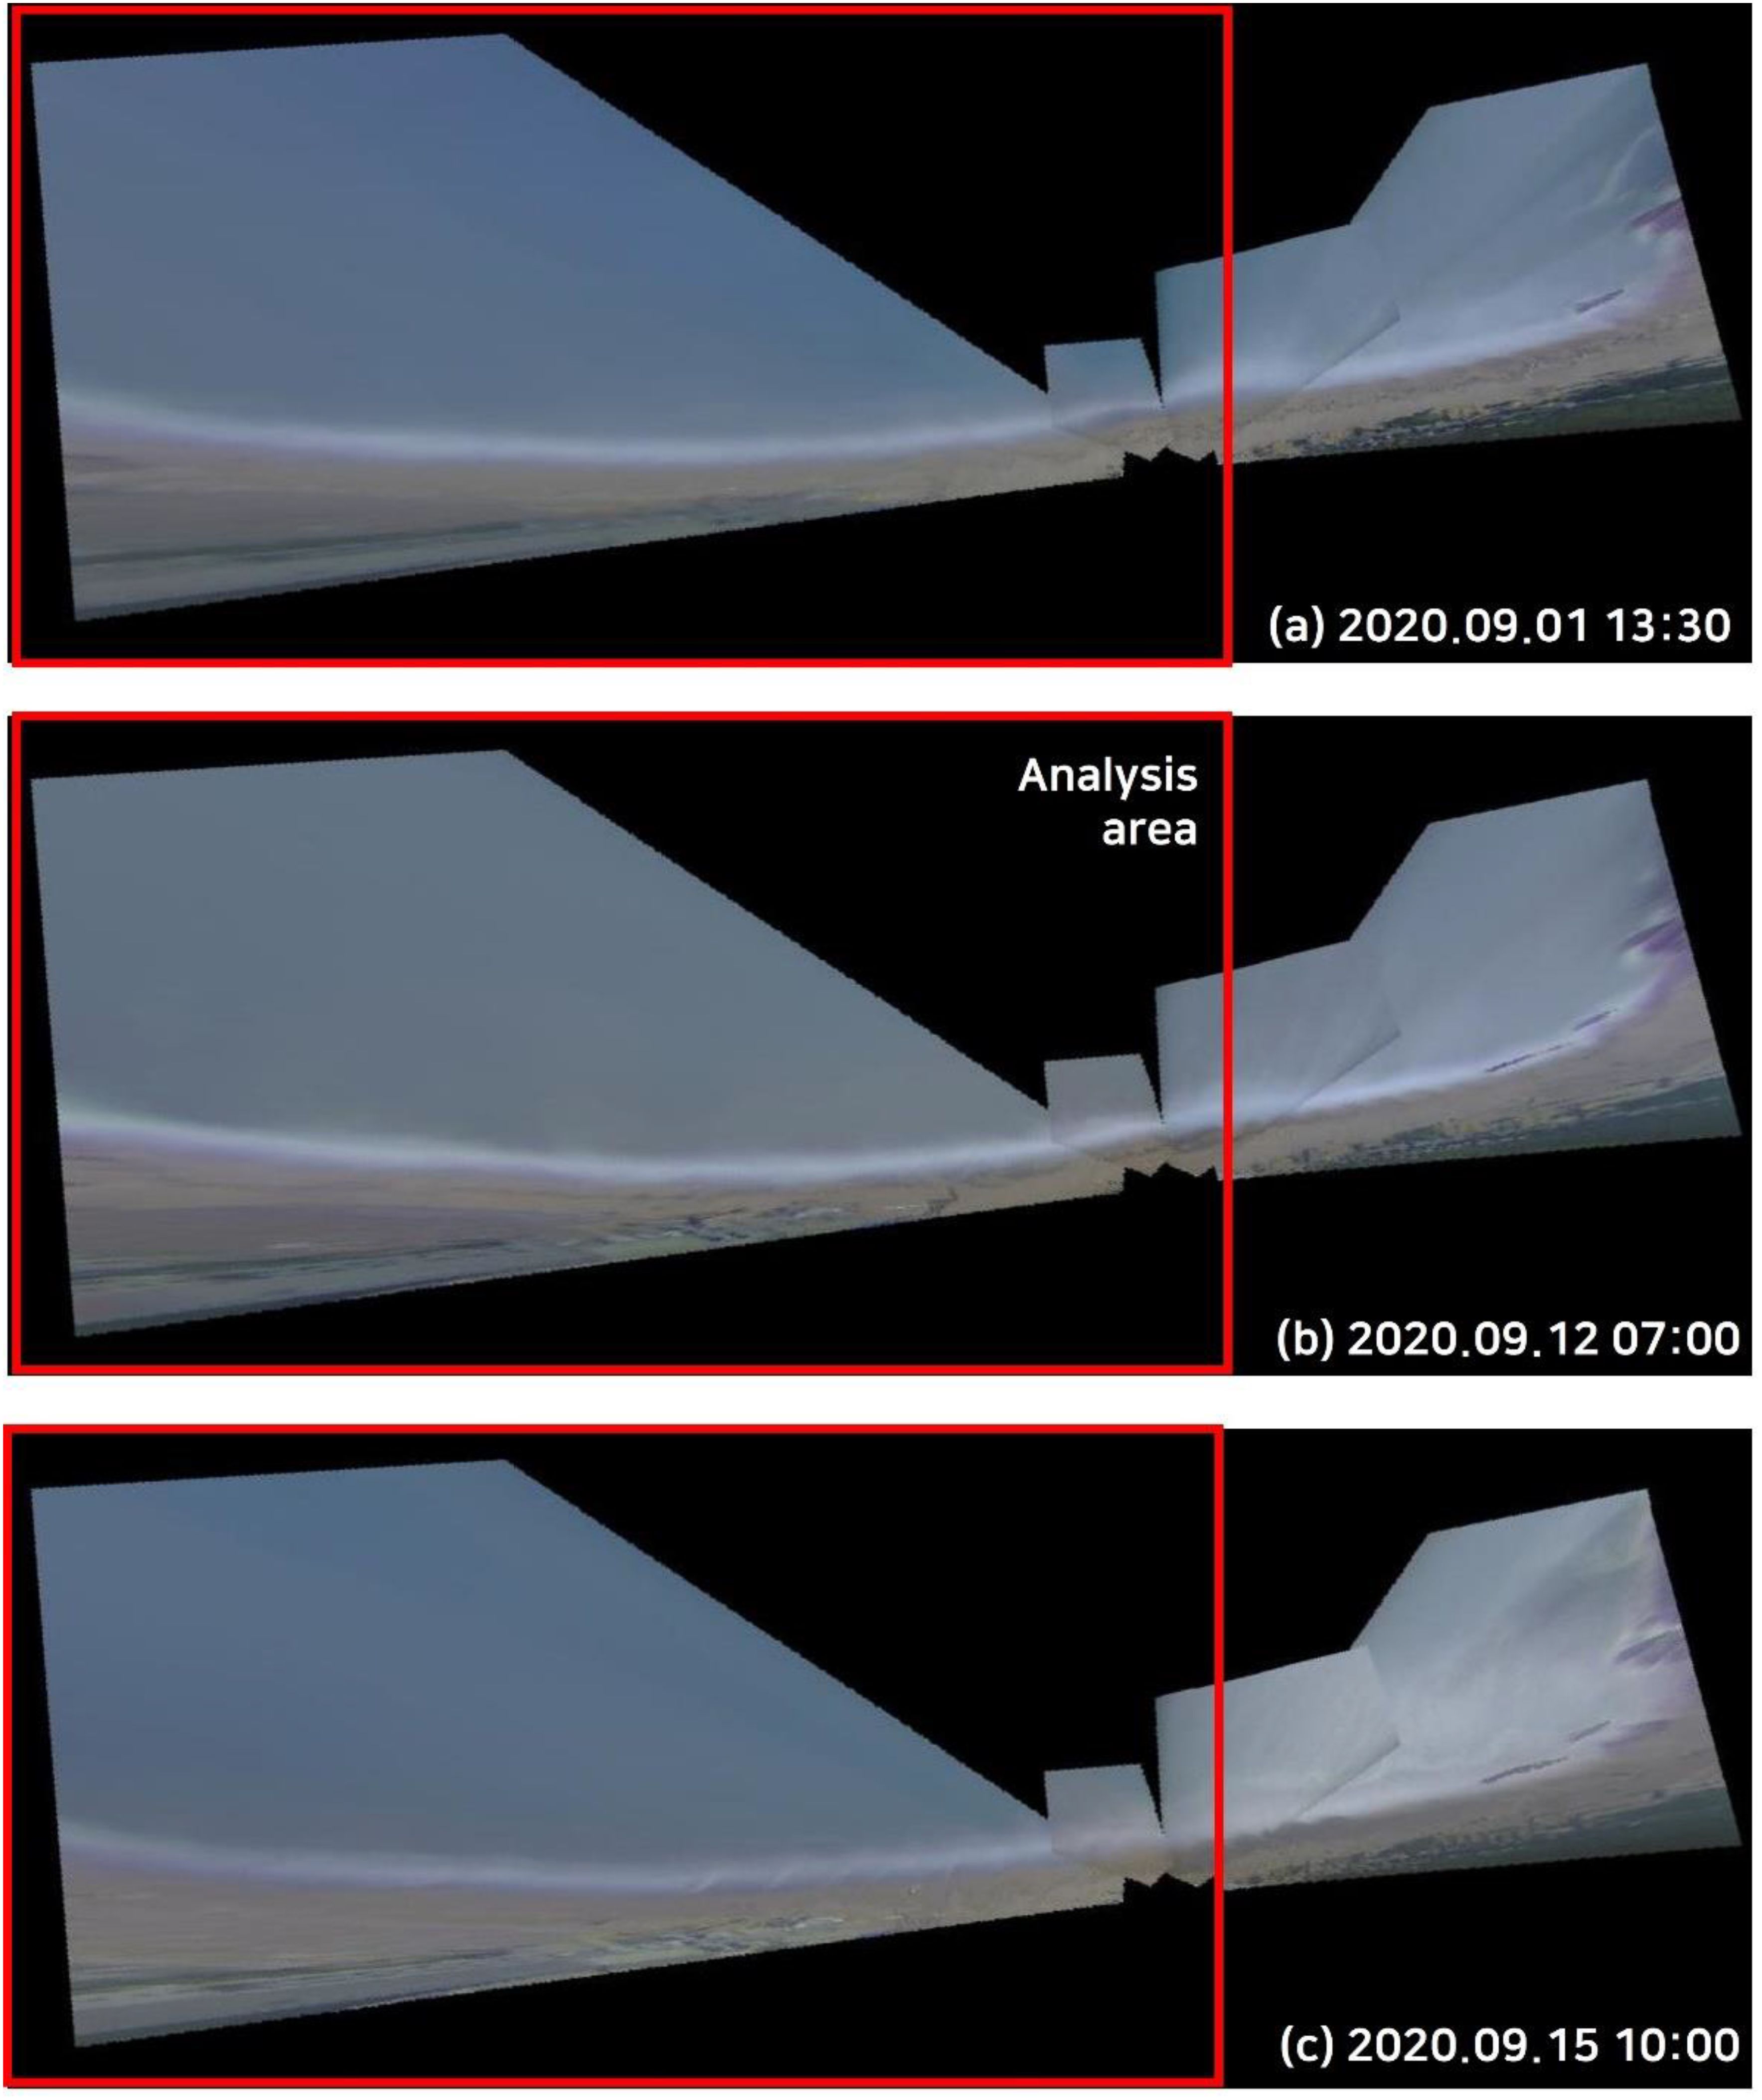
Figure 10. Ortho converted three-minute average video snap image of Jangsa Beach. [2020.09.01 13:30 (A); 2020.09.12 07:00 (B); 2020.09.15 10:00 (C)].
Assigning Figure 10A as the original image at time 1, the roughly estimated shoreline boundary is drawn within the light gray surf and swash zone using the first momentum method, which finds the centre of white colour in one-direction, as shown in Figure 11A. It is noted that the x direction is almost perpendicular to the shoreline in this specific case and could be used to estimate the rough shoreline position along y coordinate. Next, Figure 10B) as the evolved image at time 2. The new shoreline is tracked by using the new method MCGWSD, generating the new annotation map at time 2, as shown in Figure 11B. By comparing Figures 11A, B, shoreline movement, i.e. advancement or retreat from time 1 to time 2, as shown in Figure 11C.
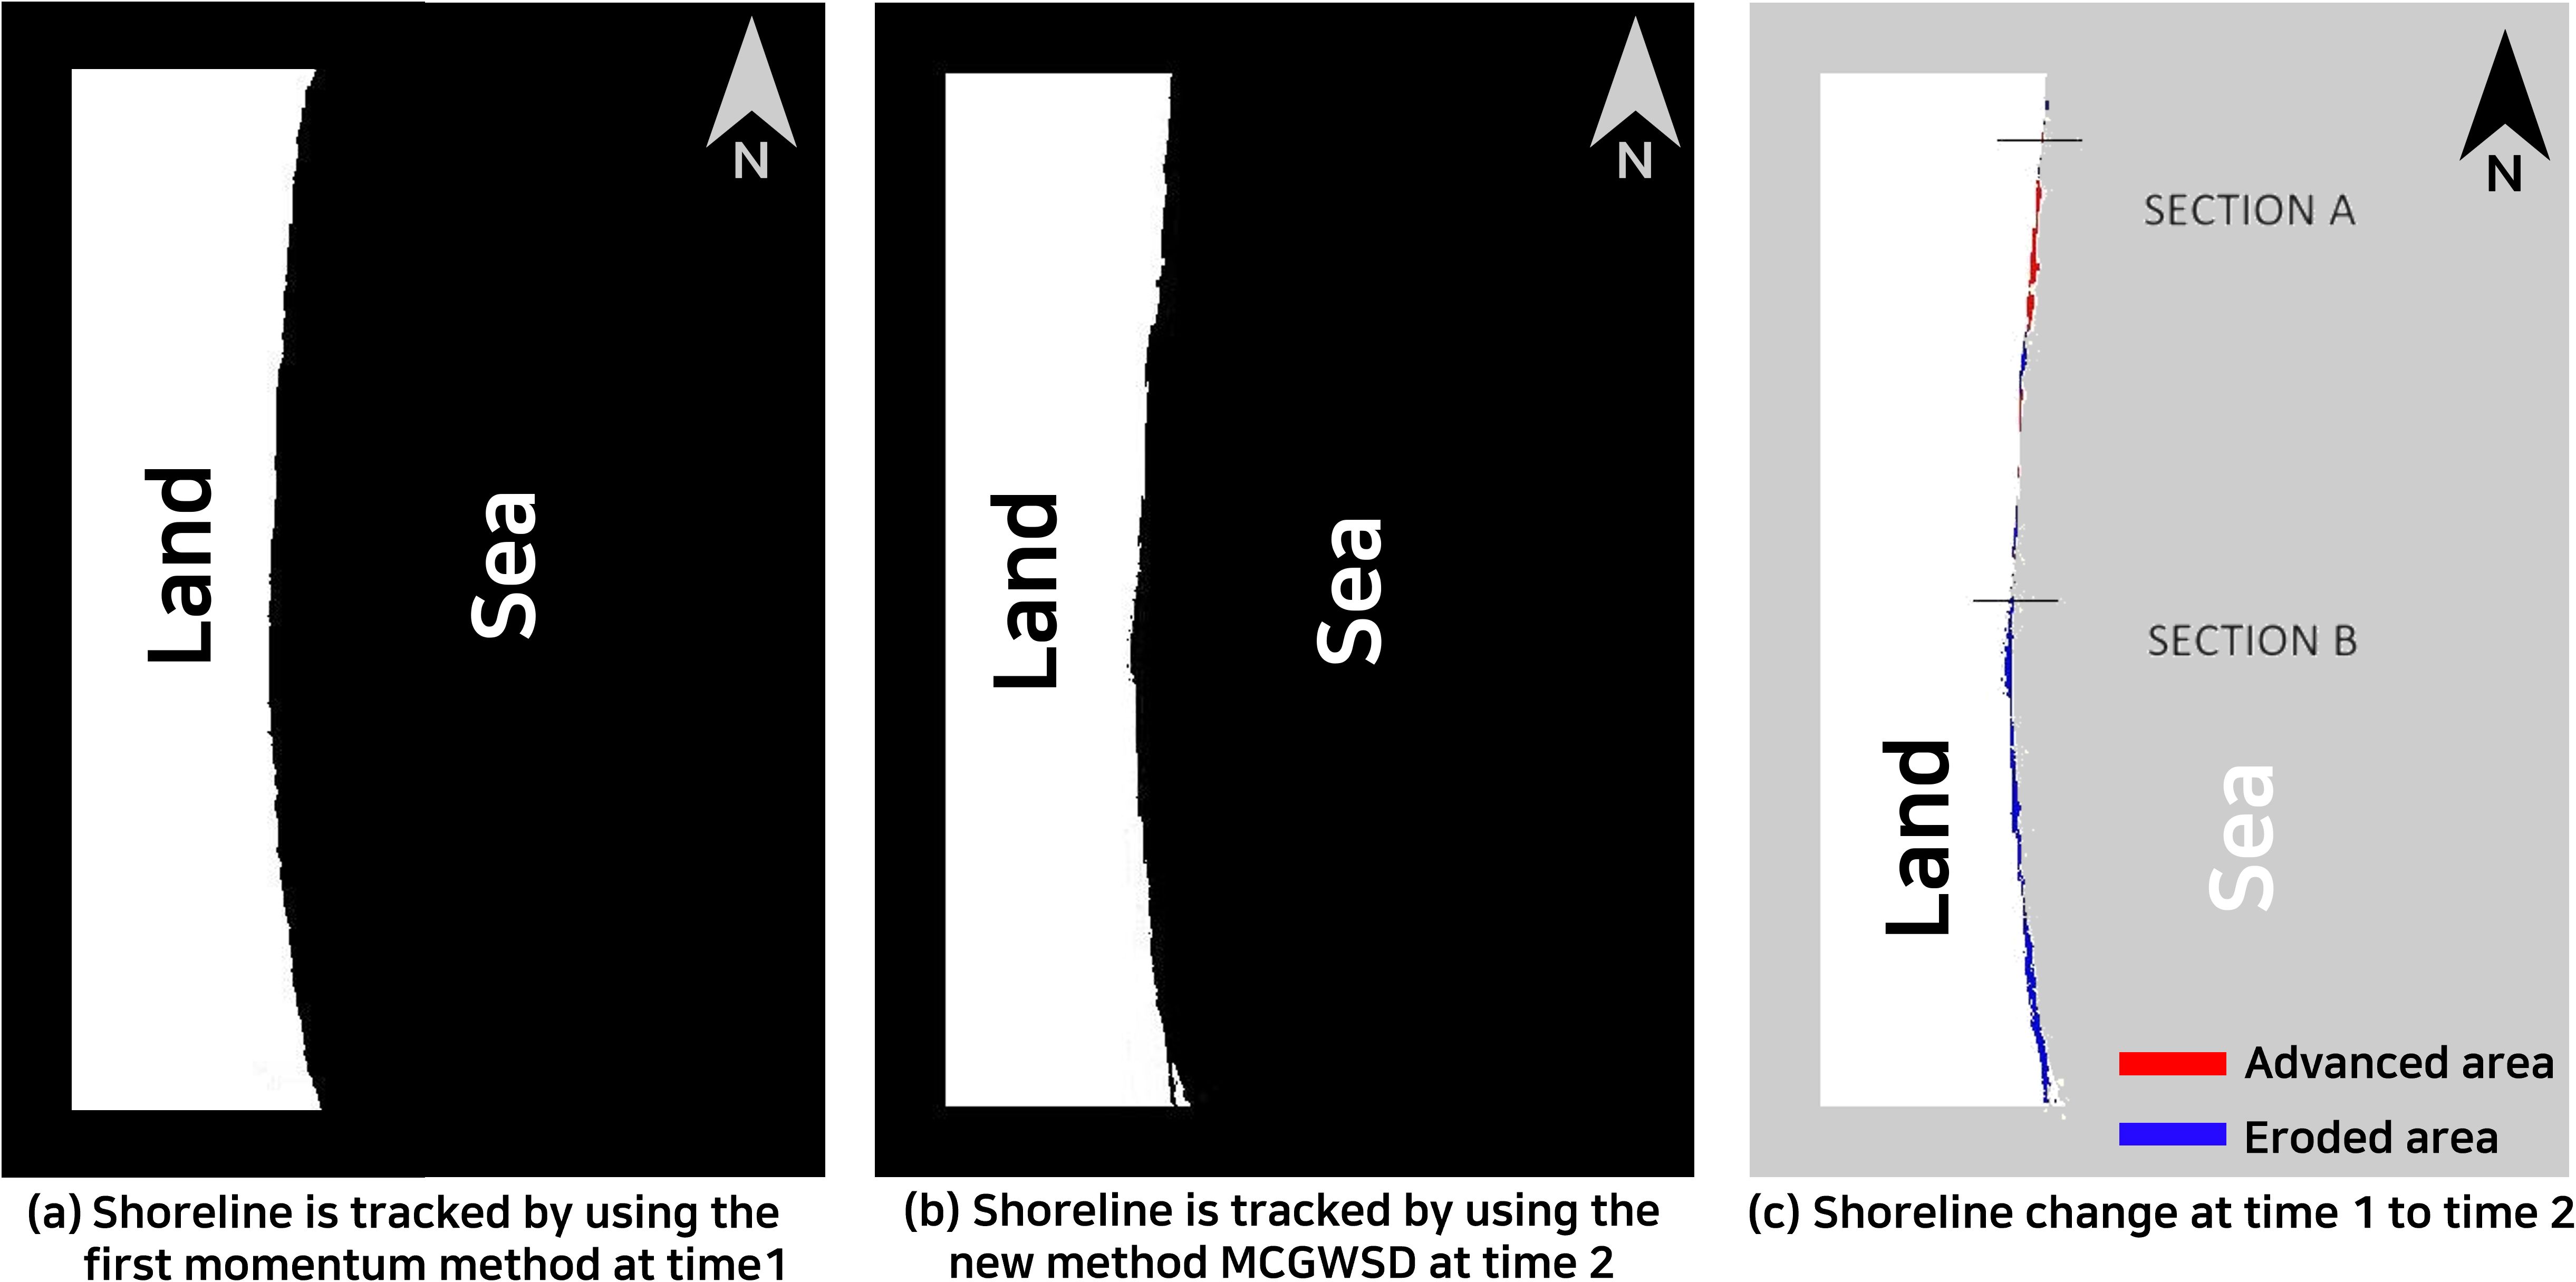
Figure 11. Extraction of shoreline from the application of the First-momentum method (A), MCGWSD new method (B) and its changes at time 1 to time 2 (C).
Next, Figure 10C as the evolved image at Time 3. The new shoreline is tracked using the new method MCGWSD, generating the new annotation map at time 3, Figure 12. By comparing Figures 12A and B, shoreline movement, i.e. advancement or retreat from time 1 to time 3, as shown in Figure 12C. The new tracking method MCGWSD is applied to two intervals, i.e. from time 1 to time 2, and from time 1 to time 3. Ideally, assessing of the present method require a verification with ground truth answers or a comparison with solutions produced by other established methods. The existing shoreline extraction method, PIMACS (Kim, 2014), is adopted to produce shorelines, for times 1, 2 and 3, and shoreline evolutions for the two times intervals (time 1-time 2; time 1-time 3).
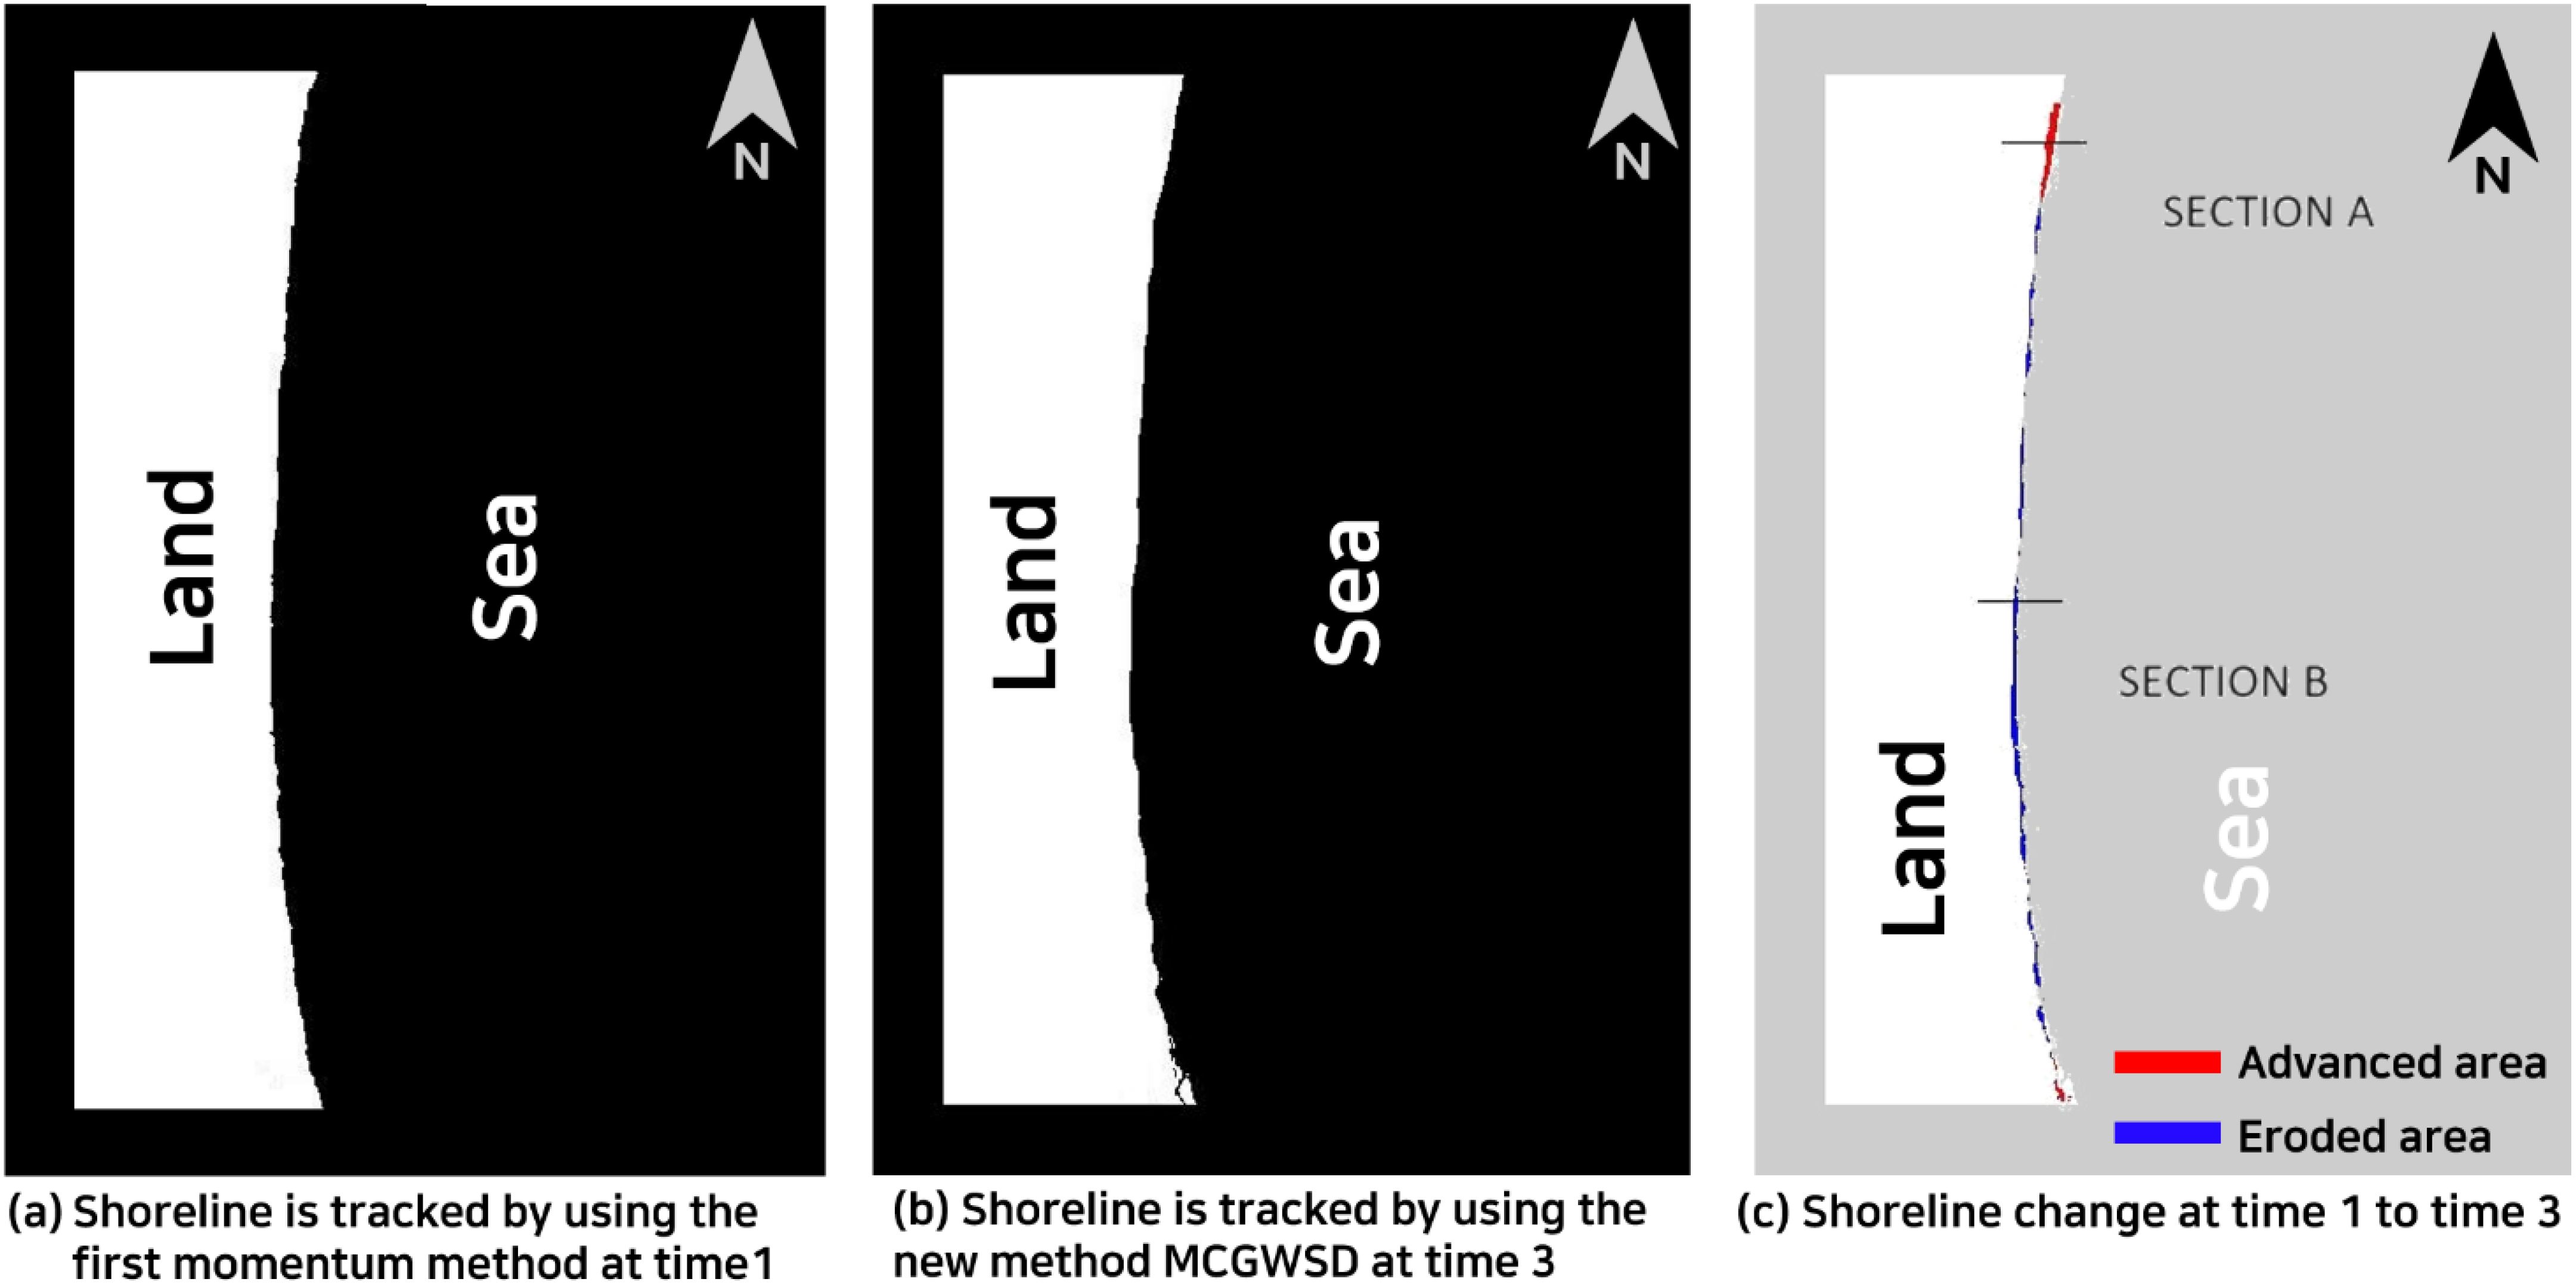
Figure 12. Extraction of shoreline from the application of the First-momentum method (A), MCGWSD new method (B) and its changes at time 1 to time 3 (C).
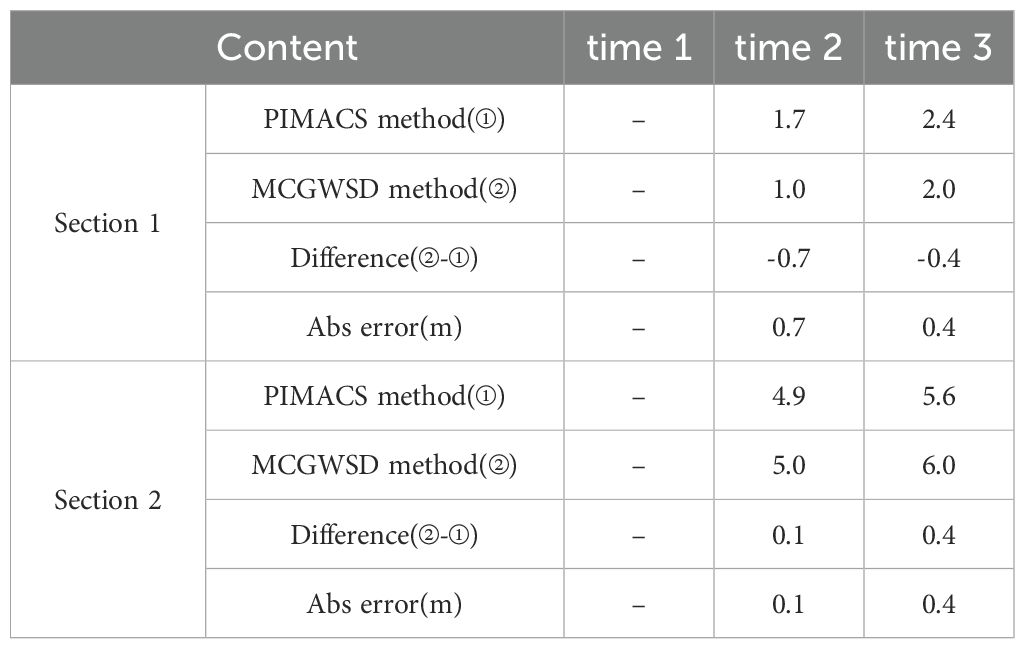
The new shoreline tracking method is applied to the period between time 1 and time 2. The resulting shoreline advancement and retreat map is shown in Figure 11C, and the resulting shoreline advancement and retreat map between time 1 and time 3 is shown in Figure 12C. At Section A in the northern part of the beach, a mild shoreline advance of about 1-2 m is observed according to the PIMACS method, while the present MCGWSD tracking method shows 2 m advancement, which agrees well with the PIMACS results (see Table 2). At Section B in the north-central part of the beach, a significant shoreline retreat of about 4-5 m is observed according to the PIMACS method, while the present MCGWSD tracking method shows 5 m retreat, which agrees well with the PIMACS results (see Table 2 and Figure 13). The analysis sections are located in the northern part of Jangsa Beach (section 1) and the north-central part (section 2). The relatively insignificant shoreline change of section 1 during the direct typhoon impact period is likely due to the topographical effect, as the area was less affected by wave energy due to the port structures located in the north. After the high wave period, from the 12th to the 15th day, the sediments eroded in the central part gradually moved north due to wave energy, and this change trend was well shown by the results of the two methods applied through image analysis. The area where erosion was strong seems to be the central part of the beach. Section 2 shows a clear erosion trend due to continuous wave energy, and erosion was particularly strong in early September during the high wave impact period, and the size gradually decreases thereafter. These change trend linked to the actual topography were also clearly shown in both analysis methods.
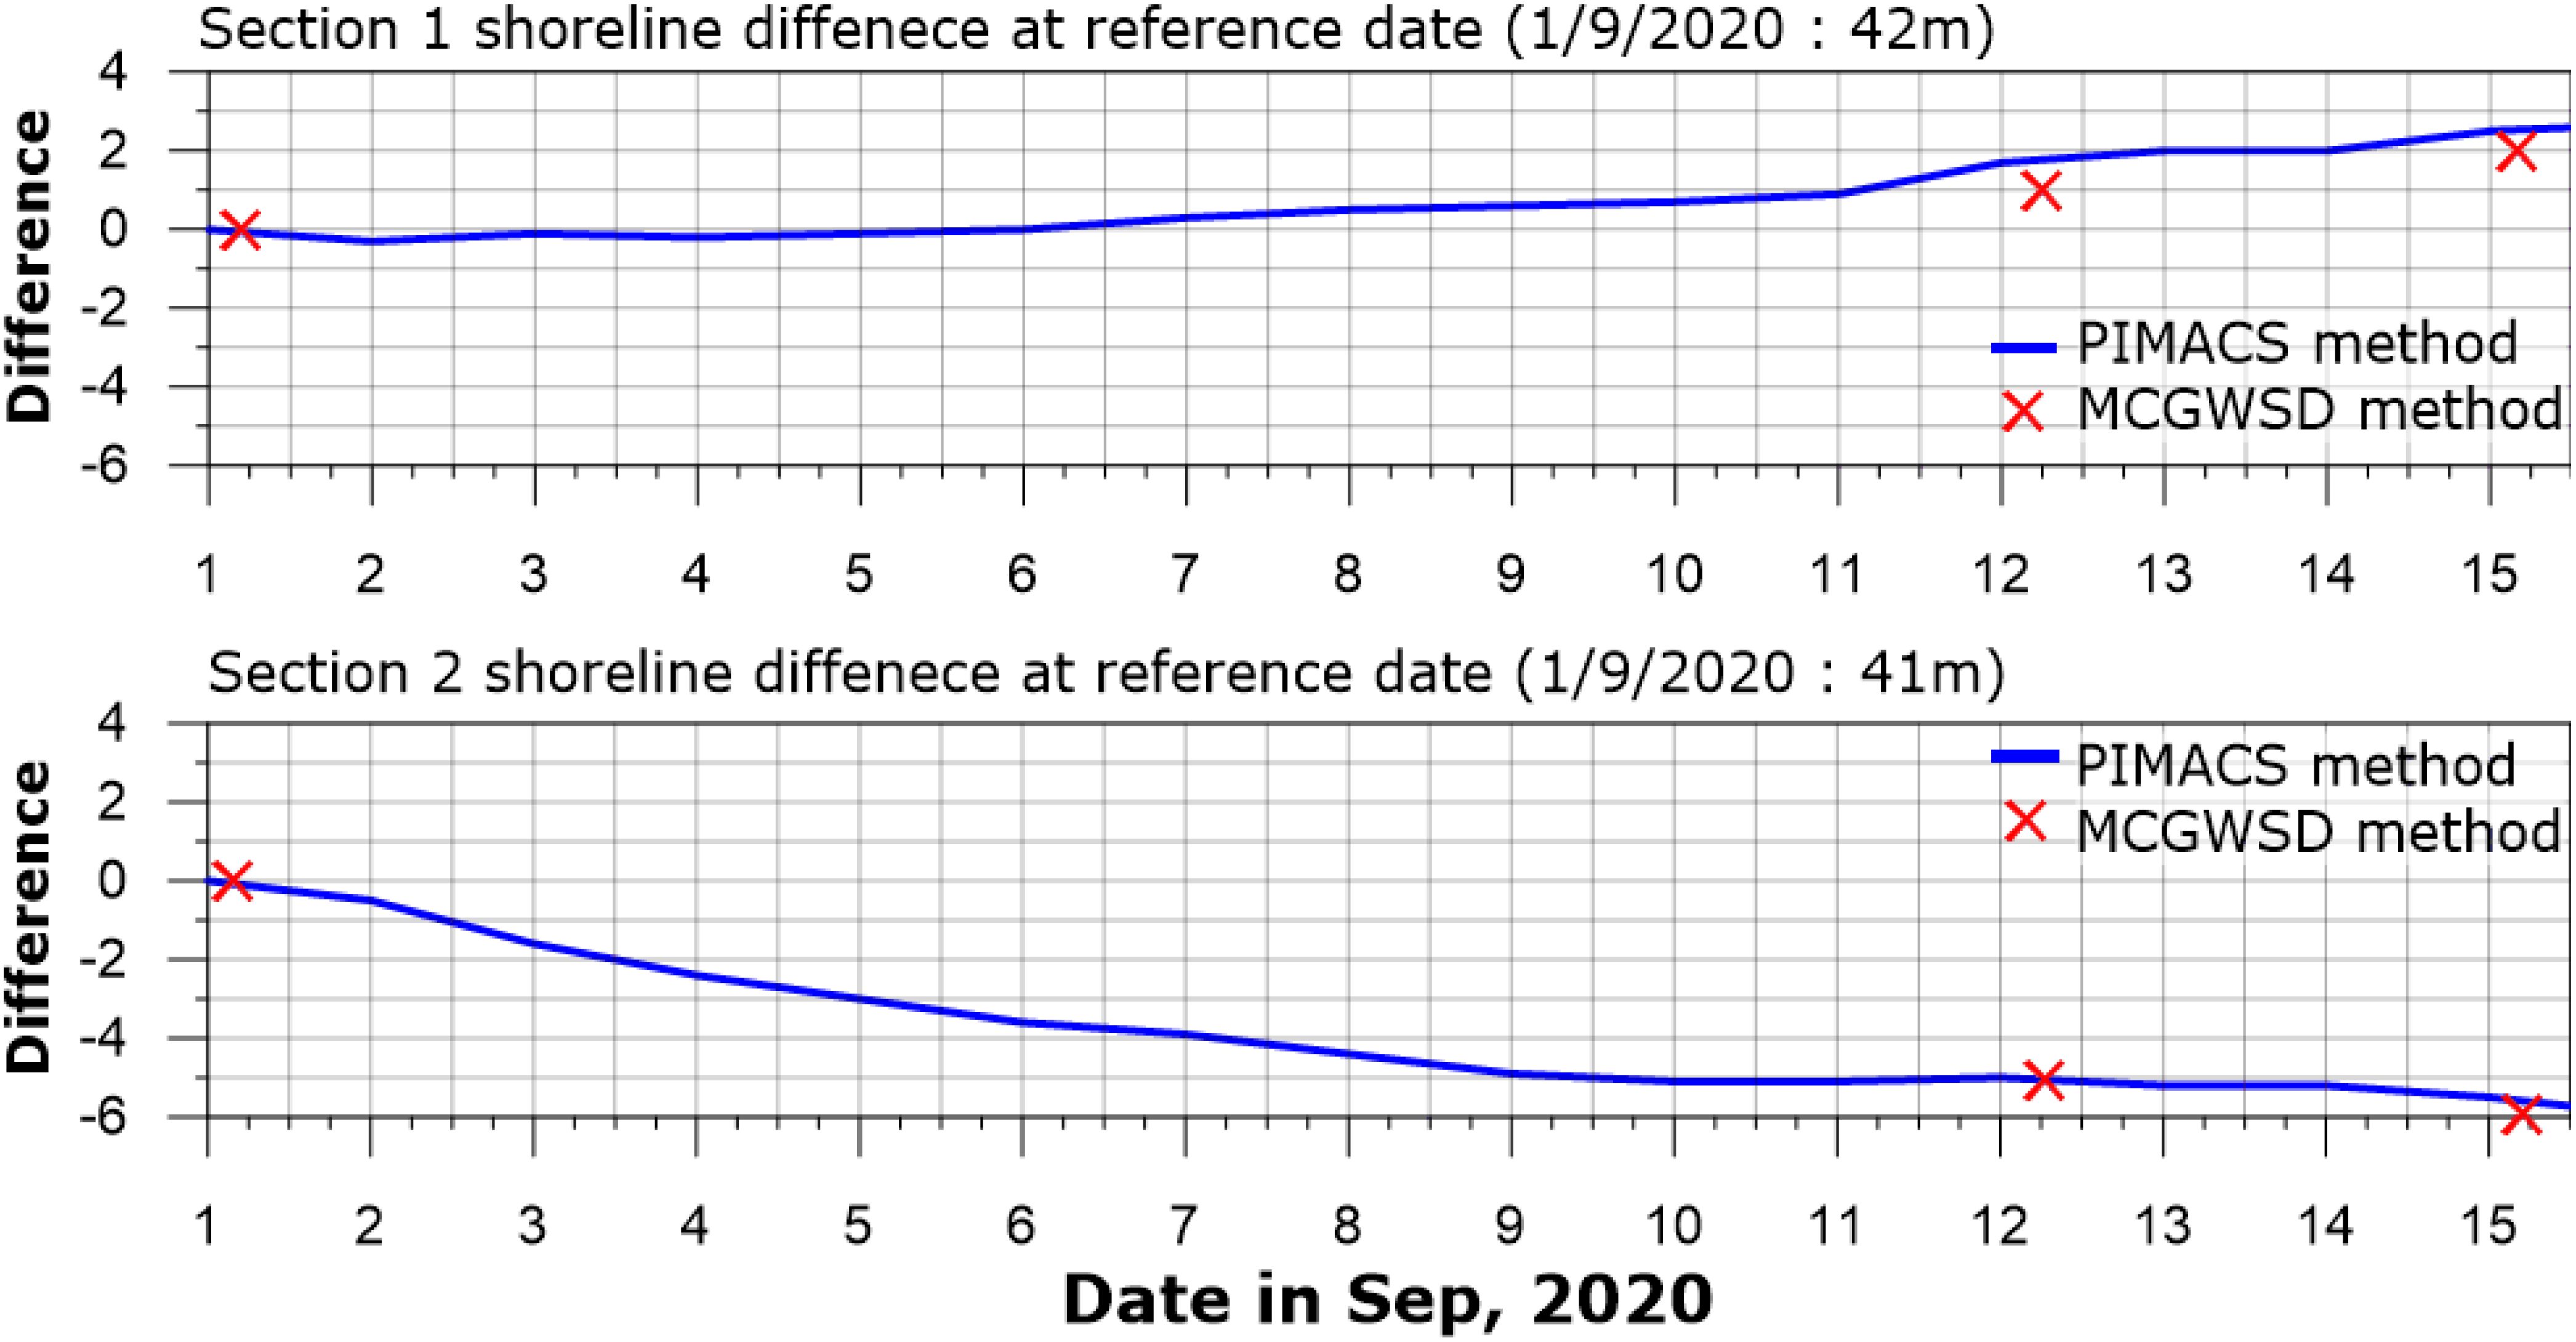
Figure 13. Extraction of shoreline position and comparison of the application of the PIMACS method and MCGWSD new method result.
In total, the absolute errors for shoreline advance and retreat are within 2 m, and the relative errors with respect to the largest displacement are within 20%. It is concluded that the new MCGWSD method can track the shoreline movement from the video images by considering RGB values around the boundary line reasonably well, as demonstrated by the present comparisons. The tests assume that the local colour characteristics around the shoreline at this site are preserved with time, and the geometry including shoreline undergoes small-scale elastic deformation and translation. Even though the present tests at Jangsa Beach in September 2020 were satisfactory, many future tests at various sites and times would further validate the present method.
The results indicate that the new method MCGWSD provides almost same shoreline advance or retreat during given period compared to previous PIMACS results. However, it should be noted that The comparison between PIMACS and MCGWSD reveals that [the present method provides overall shoreline change with no shore-normal transects, while PIMACS require shore-normal transects, which require additional processing. When ground truth shoreline information becomes available in the future research, the accuracy of the methods could further be examined.
4 Conclusions
Object or boundary curve tracking has previously been carried out by various methods, including simple thresholding methods using bright gray intensity, colour intensity gradient methods along transect, and neural networks involving. The thresholding methods are sensitive to the threshold values, and therefore image-dependent. Colour intensity gradient methods along transect require assignment of shore-normal transects which is not straightforward on arbitrary coastal shapes. Neural networks involve costly annotation and training. Furthermore, adequate architecture of neural networks should be chosen site-specifically.
There has been a concept of similarity index which often represents the similarity between two images, especially to see the contamination level of the second image compared to the first original image. The similarity index has a uniform weight over the whole image, and thus it could not be used to track a point or an object in a wide image.
Gaussian weight matrix is introduced here, and convoluted to squared difference matrix so that it represents the dissimilarity between two small zones of two images. This index is computed at a pixel point of reference in the second image to be compared to the original image. The convolutions are obtained within a finite zone, a circle with radius R2 from the point of reference. Then, find the position of the minimum convolution by screening a zone, a circle with radius R1. The position found becomes the reverse tracking position for the position of reference in the second image. The above procedure is repeated for all pixels so that the segmentation map for the second image is completed without any gaps. This concept is natural, and based on rational reasoning.
The new MCGWSD method was tested on simple situations involving various deformation of image, and showed good results. The new MCGWSD method was applied to field images, and shows very close results compared to an existing colour intensity gradient method, PIMACS along two transects. However, the new MCGWSD method provides overall shoreline change on the whole area, which is a strong point of the new method.
The application field of the new MCGWSD method Jansa Beach has a relatively small tidal range. If the new method is to be applied to high tidal range site, additional algorithm may be needed. If the deformation of images is beyond elastic one, e.g. partly folded or cut off, the applicability of the new MCGWSD should be tested further.
The new method can be confidently adopted for coastal management and policy, because the new method computes shoreline change directly by image to image, rather than finds shorelines first and compares the two. The computed shoreline change should be reliable, even if the true shoreline positions are not sure.
Additional application of the new method to other coasts at other times in the future could further refine the new method through additional sensitivity test on model parameters and verification to ground truth shoreline change.
Data availability statement
The original contributions presented in the study are included in the article/supplementary material. Further inquiries can be directed to the corresponding author.
Author contributions
HY: Supervision, Validation, Visualization, Writing – original draft, Writing – review & editing. HK: Supervision, Visualization, Writing – original draft, Writing – review & editing. TK: Visualization, Writing – review & editing. JP: Data curation, Investigation, Visualization, Writing – review & editing. JK: Data curation, Investigation, Visualization, Writing – review & editing.
Funding
The author(s) declare financial support was received for the research, authorship, and/or publication of this article. This research was supported by the Korea Institute of Marine Science and Technology Promotion (KIMST) funded by the Ministry of Oceans and Fisheries, Korea (RS-2023-00256687).
Acknowledgments
The authors gratefully appreciate the Korea Institute of Marine Science and Technology Promotion (KIMST) funded by the Ministry of Oceans and Fisheries (RS-2023-00256687).
Conflict of interest
Authors HY, TK, JP, JK were employed by the company Geosystem Research Corp. The remaining author declares that the research was conducted in the absence of any commercial or financial relationships that could be construed as a potential conflict of interest.
Publisher’s note
All claims expressed in this article are solely those of the authors and do not necessarily represent those of their affiliated organizations, or those of the publisher, the editors and the reviewers. Any product that may be evaluated in this article, or claim that may be made by its manufacturer, is not guaranteed or endorsed by the publisher.
References
Aarninkhof S. G. J., Ruessink B. G. (2004). Video observations and model predictions of depth-induced wave dissipation. IEEE Trans. Geosci. Remote Sens 42, 2612–2622. doi: 10.1109/TGRS.2004.835349
Almar R., Larnier S., Castelle B., Scott T., Floc’h F. (2016). On the use of the Radon transform to estimate longshore currents from video imagery. Coast. Eng. 114, 301–308. doi: 10.1016/j.coastaleng.2016.04.016
Arriaga J., Medellin G., Ojeda E., Salles P. (2022). Shoreline detection accuracy from video monitoring systems. J. Mar. Sci. Eng. 10, 95. doi: 10.3390/jmse10010095
Boak E. H., Turner I. L. (2005). Shoreline definition and detection-A review: Coconut Creek, FL, Coastal Education & Research Foundation. J. Coast. Res. 21(4) pp, 688–703. doi: 10.2112/03-0071.1
Chang Y. S., Jin J. Y., Jeong W. M., Kim C. H., Do J. D. (2019). Video monitoring of shoreline positions in hujeong beach, korea. Appl. Sci. 9, 4984. doi: 10.3390/app9234984
Chickadel C. C., Holman R. A., Freilich M. H. (2003). An optical technique for the measurement of longshore currents. J. Geophys. Res. Ocean 108, 1–17. doi: 10.1029/2003JC001774
Ciresan D. C., Giusti A., Gambardella L. M., Schmidhuber J. (2012). Deep neural networks segment neuronal membranes in electron microscopy images. Advances in Neural Information Processing Systems 25, 2852–2800. doi: 10.5555/2999325.2999452
Damiani L., Molfetta M. G. (2008). A video based technique for shoreline monitoring in Alimini(LE). In Coastlab08 8, 153–156.
Holland K. T., Holman R. A., Lippmann T. C. (1997). Practical use of video imagery in nearshore oceanographic field studies. IEEE J. Oceanic Eng. 22, 81–92. doi: 10.1109/JOE.48
Holman R. A., Stanley J. (2007). The history and technical capabilities of Argus. Coast. Eng. 54, 477–491. doi: 10.1016/j.coastaleng.2007.01.003
Jardim S., Valente J., Almeida A., Mora C. (2023). Comparing artifcial intelligence classifcation models to improve an image comparison system with user inputs. SN Comput. Sci. 5, 1–9. doi: 10.1007/s42979-023-02375-y
Joia Santos C., Andriolo U., Ferreira J. C. (2020). Shoreline response to a sandy nourishment in a wave-dominated coast using video monitoring. Water 12, 1632. doi: 10.3390/w12061632
Kim J. B. (2014). Apparatus for extracting coastline automatically using image pixel information and image pixel information change pattern by moving variance and the method thereof (Patent No. 10-1480173) (Korea: The Korean Intellectual Property Office).
Kim H., Yoo H., Lee J. L., Lee S. (2020). Convolution layer with nonlinear kernel of square of subtraction for dark-direction-free recognition of images. Journal of Mathematical Models in Engineering 6, 147–159. doi: 10.21595/mme.2020.21552
Lippmann T. C., Holman R. A. (1989). Quantification of sand bar morphology: A video technique based on wave dissipation. J. Geophys. Res. Ocean. 94, 995–1011. doi: 10.1029/JC094iC01p00995
Lippmann T. C., Holman R. A. (1990). The spatial and temporal variability of sand bar morphology. J. Geophysical Res. 95, 575–590. doi: 10.1029/JC095iC07p11575
Luijendijk A., Hagenaars G., Ranasinghe R., Baart F., Donchyts G., Aarninkhof S. (2018). The state of the world’s beaches. Sci. Rep. 8, 1–11. doi: 10.1038/s41598-018-24630-6
Ministry of SMEs and Startups (2023). Development of beach monitoring and diagnosis technology based on drone video AI recognition technology. S3251997, 1–131.
Morton R. A., Leach M. P., Paine J. G., Cardoza M. A. (1993). Monitoring beach changes using GPS surveying techniques. J. Coast. Res. 9, 702–720.
Otsu N. (1979). A threshold selection method from gray-level histograms. IEEE Trans.Syst.Man Cybern 9, 62–66.
Park J. A., Park K. A., Kim. T. S., Oh S., Lee M. (2023). Aerial hyperspectral remote sensing detection for maritime search and surveillance of floating small objects. Adv. Space Res. 72, 2118–2136. doi: 10.1016/j.asr.2023.06.055
Plant N. G., Holman R. A. (1997). Intertidal beach profile estimation using video images. Mar. Geology 140, 1–24. doi: 10.1016/S0025-3227(97)00019-4
Ribas F., Simarro G., Arriaga J., Luque P. (2020). Automatic shoreline detection from video images by combining information from different methods. Remote Sens. 12, 3717. doi: 10.3390/rs12223717
Ronneberger O., Fischer P., Brox T. (2015). U-Net: Convolutional Networks for Biomedical Image Segmentation (Medical Image Computing and Computer-Assisted Intervention (MICCAI), 9351, 234–241. doi: 10.1007/978-3-319-24574-4_28
Shand T. D., Bailey D. G., Shand R. D. (2012). Automated detection of breaking wave height using an optical technique. J. Coast. Res. 28, 671–682. doi: 10.2112/JCOASTRES-D-11-00105.1
Stockdon H. F., Holman R. A. (2000). Estimation of wave phase speed and nearshore bathymetry from video imagery. J. Geophys Res 105, 22015–22033. doi: 10.1029/1999JC000124
Turner I. L., Whyte D., Ruessink B. G., Ranasinghe R. (2007). Observations of rip spacing, persistence and mobility at a long, straight coastline. Mar. Geol 236, 209–221. doi: 10.1016/j.margeo.2006.10.029
van Enckevort I. M. J., Ruessink B. G., Coco G., Suzuki K., Turner I. L., Plant N. G., et al. (2004). Observations of nearshore crescentic sandbars. J. Geophys. Res. Ocean. 109, 1–17. doi: 10.1029/2003JC002214
Vos K., Splinter K. D., Harley M. D., Simmons J. A., Turner I. L. (2019). CoastSat: A Google Earth Engine-enabled Python toolkit to extract shorelines from publicly available satellite imagery. Environ. Model Softw. 122, 104528.
Vousdoukas M. I., Ranasinghe R., Mentaschi L., Plomaritis T. A., Athanasiou P., Luijendijk A., et al. (2020). Sandy coastlines under threat of erosion. Nat. Clim. Change 10, 260–263. doi: 10.1038/s41558-020-0697-0
Wang Z., Bovik A. (2009). Mean squared Error: Love It or Leave It (IEEE Signal Processing Magazine) 26, 98–117. doi: 10.1109/MSP.2008.930649
Widyantara M. O., Armawan N., Asana M. D. P., Adnyana B. P. (2019). Automated shoreline detection derived from video imagery using multi thresholding techniques. J. Theor. Appl. Inf. Technol. 97, 1–12.
Wu J., Cao C., Zhou Y., Zeng X., Feng Z., Wu Q., et al. (2021). Multiple ship tracking in remote sensing images using deep learning. Remote Sens. 13, 3601. doi: 10.3390/rs13183601
Young S. S., Rao S., Dorey K. (2021). Monitoring the erosion and accretion of a human-built living shoreline with drone technology. Environ. Chall. 5, 100383. doi: 10.1016/j.envc.2021.100383
Keywords: minimum convolution of Gaussian weight and squared differences (MCGWSD), shoreline detection method, shoreline movement, local dissimilarity index, video monitoring
Citation: Yoo H, Kim H, Kang TS, Park JY and Kim JB (2025) Tracking shoreline change using minimum convolution of Gaussian weight and squared differences. Front. Mar. Sci. 11:1480699. doi: 10.3389/fmars.2024.1480699
Received: 14 August 2024; Accepted: 13 December 2024;
Published: 16 January 2025.
Edited by:
Dilip Kumar Jha, National Institute of Ocean Technology, IndiaReviewed by:
Gopalakrishnan Singaram, krishkash Envirotech Private Limited, IndiaPankaj Verma, National Institute of Ocean Technology, India
Copyright © 2025 Yoo, Kim, Kang, Park and Kim. This is an open-access article distributed under the terms of the Creative Commons Attribution License (CC BY). The use, distribution or reproduction in other forums is permitted, provided the original author(s) and the copyright owner(s) are credited and that the original publication in this journal is cited, in accordance with accepted academic practice. No use, distribution or reproduction is permitted which does not comply with these terms.
*Correspondence: Hojun Yoo, eW9vaGpAZ2Vvc3IuY29t
 Hojun Yoo
 Hyoseob Kim2


