 Qiu-Pan Chen
- 1State Key Laboratory of Coastal and Offshore Engineering, Dalian University of Technology, Dalian, China
- 2Key Laboratory of Mariculture, Ministry of Education, Ocean University of China, Qingdao, China
- 3Ningbo Institute of Dalian University of Technology, Ningbo, China
Under the strong nonlinear wave environment, accurate simulation of wave force for aquaculture netting is an effective guarantee for cage design and safety. In this paper, the horizontal wave forces of a nylon square-mesh netting panel were obtained through a series of strong nonlinear regular wave tests, and their nonlinearity was analyzed by amplitude spectrum. Moreover, the Morison equation based on fifth-order Stokes wave theory was used to reasonably predict the wave force on the netting. The results showed that both wave and wave force have strong nonlinearity, especially the latter. The frequency domain characteristics of the test wave and wave force are similar, while the higher frequency components of the test force are more apparent. The predicted wave forces are in good agreement with the test values in time and frequency domain, and zero or higher frequency components of predicted force are more prominent with the increase of wave steepness. When the range of the Keulegan-Carpenter number is 35-120, the average drag and inertia coefficient of the predicted force are 2.4 and 2.1, respectively. The results can provide a more accurate assessment of the nonlinear wave force on aquaculture facilities.
1 Introduction
As a flexible structure with strong water permeability, netting plays an important role in aquaculture activities and is an important part of marine aquaculture facilities. Under the action of complex marine environmental, the load on the netting usually accounts for a large proportion in the aquaculture facilities (e.g., Martin et al., 2020; Endresen and Moe-Føre, 2022; Ma et al., 2022; Wang et al., 2022; Zhao et al., 2022). The reasonable prediction of the hydrodynamic on netting is related to the structural safety of aquaculture facilities.
Many scholars believed that the drag force on netting represent the large contribution to hydrodynamic forces on traditional fish farms, so there were many researches on hydrodynamic of netting in steady flows. Zhan et al. (2006) conducted analytical and experimental investigation of drag on netting of fish cages, and the proposed new formulae was verified experimentally. Zhou et al. (2015) studied the drag effect of netting with various solidity ratios in their angle of incline to free stream, and found a dual effect of solidity on drag coefficient for inclined netting. The dual effect was described as a positive correlation in upper attack angle and a negative correlation in lower angle of attack. Moe-Føre et al. (2021) investigated the drag and lift coefficients for Raschel knitted netting considering high solidity netting and high towing velocities, and found that drag forces were close to proportional with the netting solidity for netting solidities ranging from 0.15 to 0.32. Tang et al. (2018) studied the hydrodynamic characteristics of nylon as well as polyethylene netting of different knot types and solidity ratios under varied attack angles and flow velocities. The drag coefficients of knotless nylon netting were dominant compared with knotless polyethylene netting when Reynolds number greater than 2200. Santo (2022) proposed a hydrodynamic model, based on the current blockage model commonly used in offshore engineering, to characterize steady drag force as well as velocity reduction factor on netting. In numerical terms, Zhao et al. (2013) simulated netting using the porous media model, and present the flow field around netting panel with different variable (such as inclination angles, spacing distances between two netting panel and netting panel numbers). Wang et al. (2022) proposed a new screen force model based on numerical simulations of a portion of knotless netting panels, and believed that the new model was superior to previously used screen force models for the simulation of the drag forces on and the velocity reduction downstream of netting panel. For biofouling problem in marine aquaculture activities, some researchers have also investigated the drag effect on netting with biofouling (e.g., Swift et al., 2006; Gansel et al., 2015; Lader et al., 2015; Bi et al., 2018).
For some aquaculture facilities, the netting must be exceeded the still water level. Hydrodynamics would be more dominated by waves than flows. Balash et al. (2009) measured the hydrodynamic forces on netting in waves that can be assumed as linear wave theory, and also simulated the forces with a proposed numerical model. They found that the drag and added mass coefficients were not well quantified by conventional nondimensional parameters (such as Keulegan-Carpenter and Reynolds numbers). Wang et al. (2022) investigated the hydrodynamic and deformation of a prototype pile-net configuration based on the lumped mass model, they found the force was mainly from the top half of the netting. Through the analysis of the above related researches, there would be a lack of in-depth research on the force and force prediction of netting under waves, especially strong nonlinear waves.
In this paper, a series of wave experiments of square-meshed nylon netting was conducted, and the horizontal wave force under strong nonlinear waves was studied. Meanwhile, Morison equation is used to reasonably predict the wave force in experience. The relevant research was helpful to make a more accurate assessment of the nonlinear wave force of marine aquaculture facilities.
2 Material and methods
2.1 Experimental setup
The wave experiments of the netting panel were carried out in a wave-current tank at the State Key Laboratory of Coastal and Offshore Engineering, Dalian University of Technology, China. The tank was 22 m long, 0.45 m wide, and 0.6 m deep. Both the side and bottom walls of the tank were made of smooth glass plates with minimal frictional drag. The effective length of the experiments was 16.5 m from the wave paddle to the wave absorber. A 40 × 51.5 cm clean netting panel with a solidity of 0.194 was placed in the flume 6.3 m downstream of the wave paddle (see Figure 1), and the water depth was 40 cm. The characteristic length of the twine in the plane of the netting was 4.5 mm and the mesh bar length was 5 cm. The nylon netting was fastened in a steel frame welded together with 6 mm steel bars, to form the netting panel.
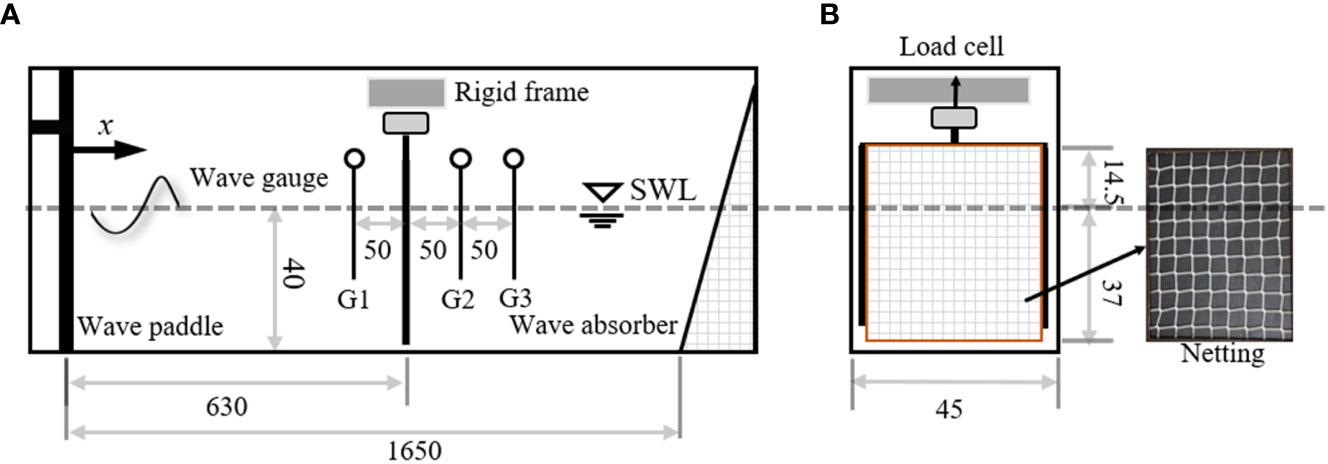
Figure 1 Sketch of the facility (unit: cm). (A) side elevation view; (B) Front elevation view.
The top edge of the netting was 14.5 cm above the still water level. The netting panel was tied to a 4 mm thick and 10 mm wide steel plate, which was attached to the force transducer with a connecting bracket. The details of netting panel in the flume are shown in Figure 2. Three wave gauges were used to measure wave elevation time series: G1 was placed 0.5 m upstream of the netting, G2 and G3 were placed 0.5 m and 1.0 m downstream of the netting, respectively. The three gauges were for verifying the stability of the wave surface near the netting and also studying the effect of netting on wave. The force transducer was capable of recording forces of up to 50 N with an accuracy of 0.005 N. The sampling rate for both wave force and wave elevation was set at 50 Hz.
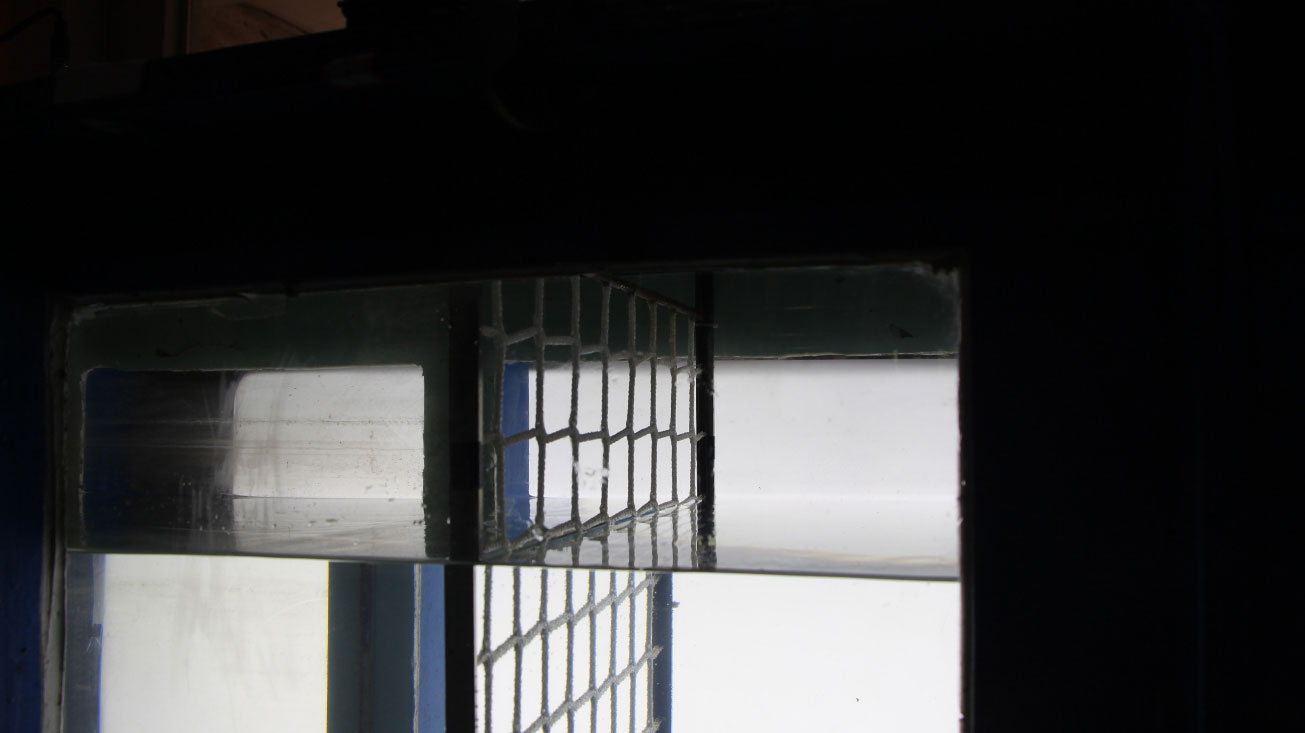
Figure 2 Details of the netting panel in water.
2.2 Wave conditions
Netting is an important part of aquaculture cage exposed to ocean environment, and its hydrodynamic under strong nonlinear wave action is relatively complex. A total of five wave conditions were designed for this experiment (see Table 1). The wave height ranged from 3.95 to 11.62 cm, the wave period was 1.18 s, and the wave length was 1.89 m. Therefore, the wave steepness ranged from 0.021 to 0.061. Then, a common square-meshed nylon netting was taken as the research object, and its nonlinear wave force was analyzed under the five wave conditions.
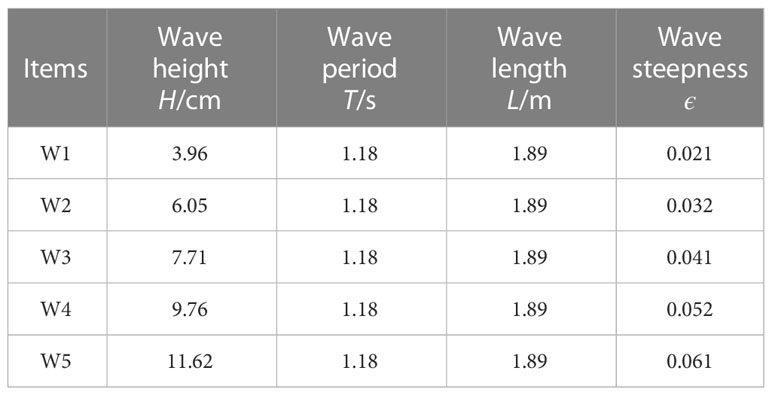
Table 1 Wave parameters in the experiment.
2.3 Analysis methods
2.3.1 Low pass filter
For test data, the duration curve often has poor smoothness due to its complex high frequency components. When these high-frequency components are introduced unintentionally by the test, their existence will interfere with the further analysis of the experimental data. For these interferences, we consider using a low pass filter to remove them, so as to conduct more targeted research.
Low pass filter is of great significance for data analysis. Its principle is as follow:
where F(f) is the fast Fourier transform of the original data containing high-order vibration signals, G(f) is the fast Fourier transform of the data after low pass filtering, and H is the transfer function shown below.
where fcut was the cut-off frequency.
After the fast Fourier transform of the test data is processed by low pass filtering, the desired data of this study can be obtained by using the inverse fast Fourier transform method.
2.3.2 Hydrodynamic force model for netting in waves
The netting can be considered as a combination of many slender twines, and the hydrodynamic force on each twine can be calculated according to the Morison equation. Then the total hydrodynamic force of the netting can be calculated by summing the force of each twine. According to Morison equation, the wave force Fc of each twine included the drag force Fd and inertia force Fi, as follows:
Where ρ was the water density, D and A were the dimension of the twine normal to the wave and cross-sectional area of the twine, CD and CM were the drag and inertial coefficient, u and ˙uwere horizontal velocity and acceleration of the water particles.
For describing the strong nonlinearity of the regular waves, the fifth-order Stokes wave theory was used for calculating the quasi-static wave force. In this way, the horizontal water particle velocity of wave action at twine was given as follow:
u=c5∑n=1nλncosh[nk(z+d)]cos[n(kx−ωt)]
Where ω, d, and k were angular frequency, water depth, and wave number, other parameters referred to Skjelbreia and Hendrickson (1960) and Nishimura et al. (1977).
The total force FC of the netting can be predicted by summing the force of every twine calculated by Equation 3. The difference between measured force FM and predicted force FC of the netting according to Morison equation was as follow:
Then, the least square method was used to solve the hydrodynamic coefficients CD and CM of the netting by following equation:
3 Results and discussion
3.1 Wave forces on netting
3.1.1 Low pass filtering for wave forces in the experiment
In order to obtain more stable wave forces of netting, the original signals of force collected from the experiment was processed by low pass filtering introduced in Section 2.3.1. Low pass filtering was a commonly used signal processing method, which aimed to remove irrelevant interference signals of high frequency. In this study, the netting was fixed on the steel frame. The high frequency response was not the performance of wave force, but the high frequency resonance signal of the frame. Considering the nonlinear property of the test wave, the cut-off frequency (5 Hz) was set to about 6 times the wave frequency.
Comparing the wave force processed by low pass filtering with the original force curve in Figure 3, the force was total wave force of frame and netting under W1 shown in Table 1. Compared with the original data, the data after low pass filtering had better smoothness, and the high-frequency vibration signal was filtered out. In addition, low pass filtering will also affect the amplitude of wave force. The amplitude of filtered data was significantly smaller than that of original data, although the impact was relatively limited.
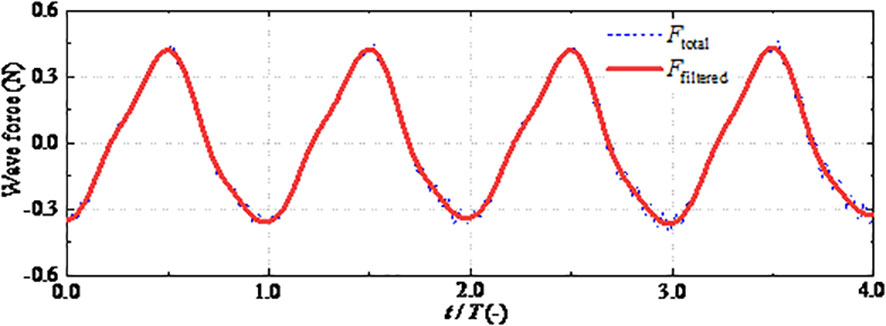
Figure 3 Details of the original and its filtered force for W1. Both the original and filtered force correspond to the netting with frame.
The wave force after low pass filtering will better reflect the relationship between wave and the wave force caused by it. The frame force and the total force including the frame and the netting were filtered respectively. Finally, the wave force of the netting itself can be obtained by making a difference between the two.
3.1.2 Wave surface and wave force in time domain
The wave forces on the structure were directly caused by the directional propagation of water waves. To intuitively analyze the relationship between wave surface and wave force on netting, they were placed in a figure together. The wave surface curve at the target position were shown in Figure 4A, and the wave force curve of netting at the same position were shown in Figure 4B. The wave surface and force curves included all five wave conditions as shown in Table 1. The curves showed the data of two consecutive wave periods that start from the peak value.
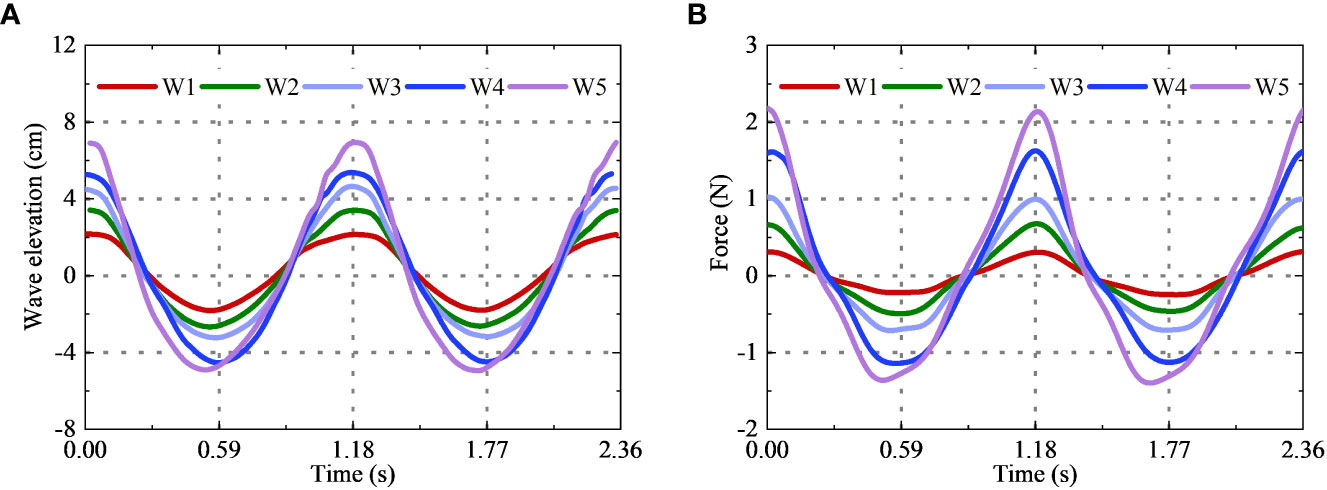
Figure 4 Time series of wave elevation and wave force for netting only. (A) wave elevation; (B) wave force.
The wave force curve continued the periodic and nonlinear characteristics of wave curve. The recurrence period of the force curve was wave period. The force curve had a relatively consistent phase change rules with the wave curve. In terms of nonlinear characteristics, the peak-valley ratio of wave surface was 1.19-1.47, while that of wave force was 1.41-1.63. The ratios showed that wave force had more significant horizontal asymmetry. Furthermore, there was little difference between the front and rear slope of the wave surface, while the front slope of the wave force was obviously lower than the rear slope, that is, the wave force had obvious vertical asymmetry.
The peak value of wave force and the corresponding wave height were taken as two-dimensional scattered data, and the change rule was shown in the figure. The limited scattered point data in Figure 5 can basically depict the function type of the relationship between wave force and wave height. Here, the scattered point data was fitted by using a quadratic polynomial, and the fitting curve was shown by the red dashed line in Figure 5. The fitting curve and scatter point data basically coincided, which was consistent with the assumption of Morison equation in Equation 3 because of the drag force played a leading role in wave force of the netting.
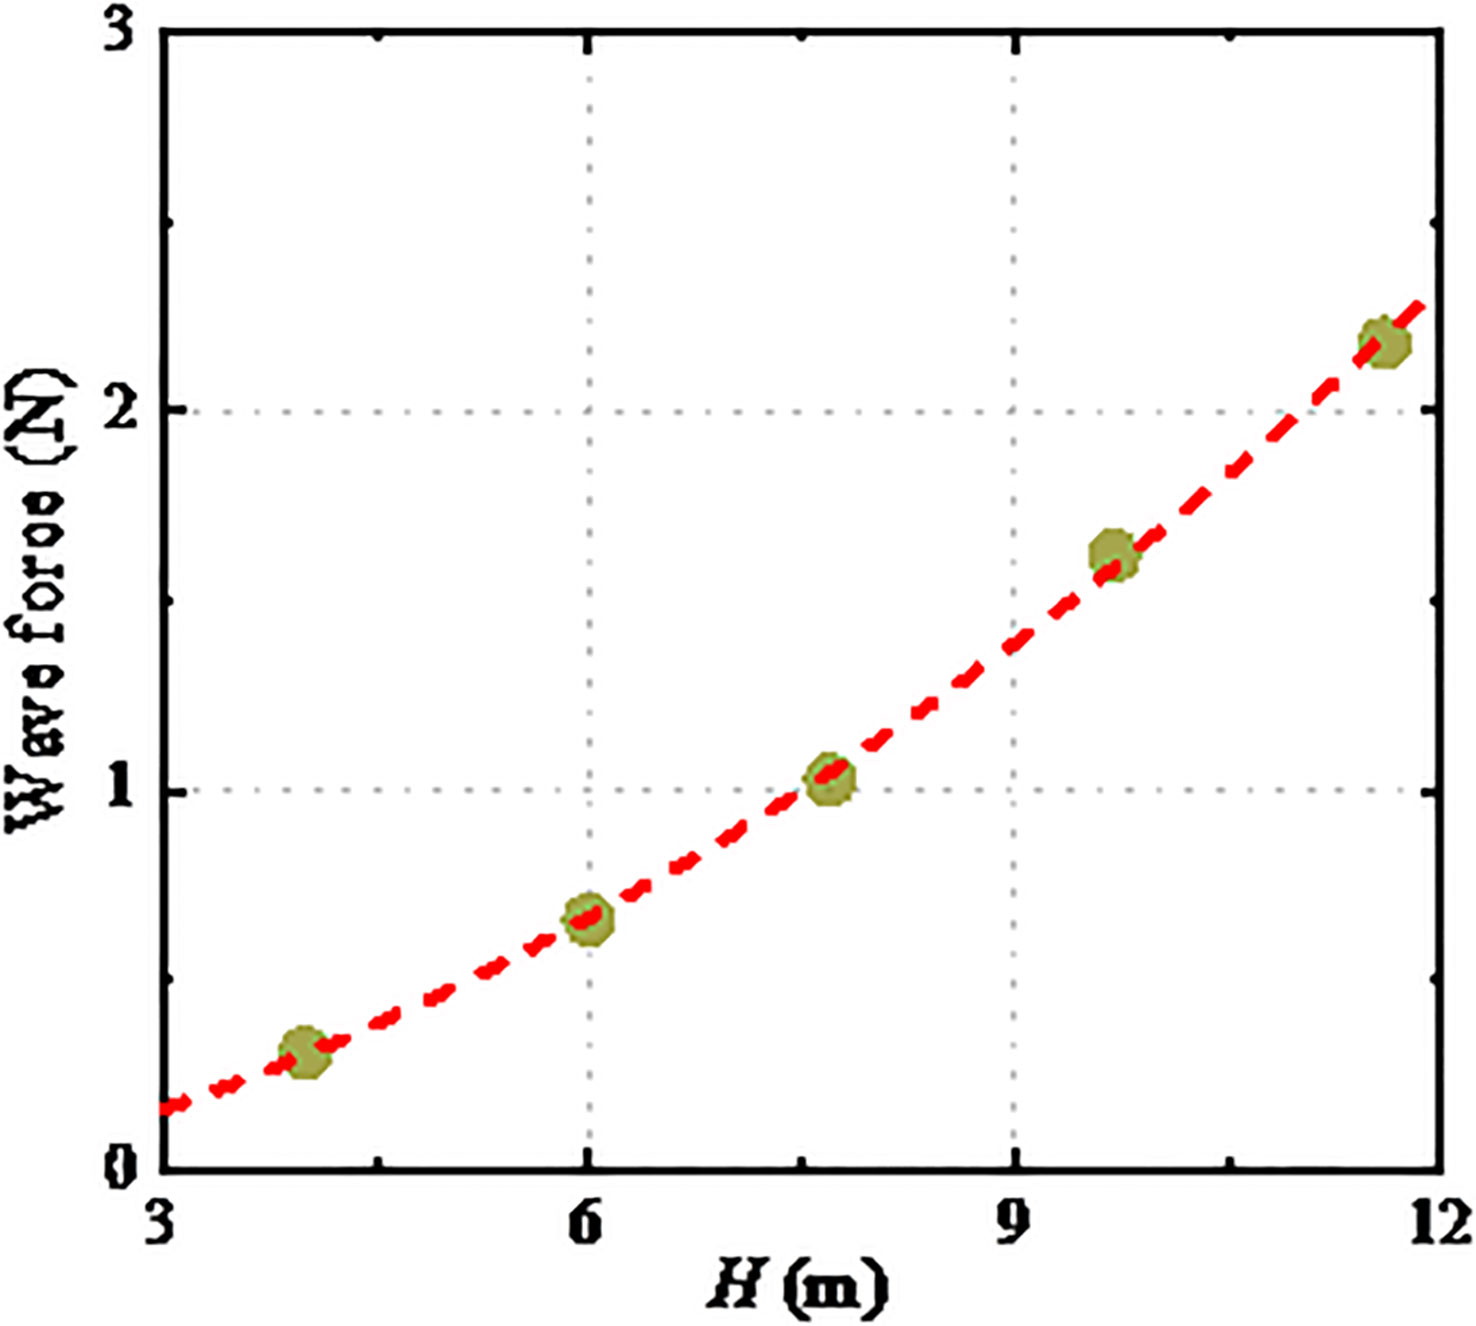
Figure 5 The positive amplitude of wave force as a function of wave height. The red dashed line is quadratic polynomial curve to fit the scatter data.
3.2 Frequency spectrum characteristic
3.2.1 Frequency spectrum characteristic for wave surface
The ocean waves can be affected by many complex factors, and often have strong nonlinearity. The amplitude spectrum (as shown in Figure 6) of the wave surface data under the test conditions can be obtained by a fast Fourier transformation. It can be used to characterize the nonlinear degree of the wave surface data. In order to study the characteristics of amplitude spectrum, its frequency coordinates were transformed to non-dimensional form, which showed the multiples of wave frequencies.
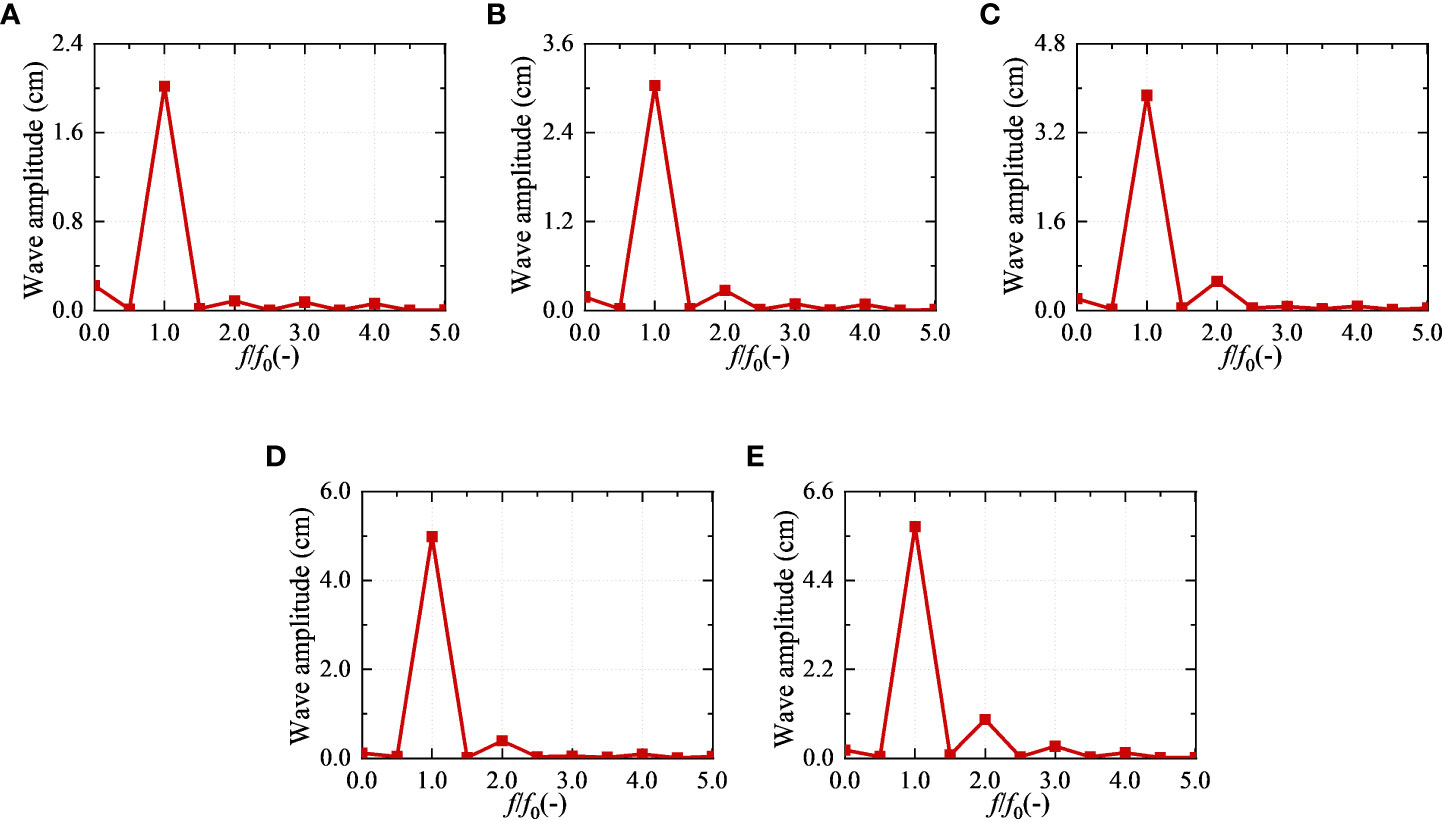
Figure 6 The amplitude spectrum of wave surface in the experiment. (A) W1, ϵ = 0.021; (B) W2, ϵ = 0.032; (C) W3, ϵ = 0.041; (D) W4, ϵ = 0.052; (E) W5, ϵ = 0.061.
Amplitude spectrum analysis can separate the linear and nonlinear component of wave surface. It can be seen from the amplitude spectrum of each wave surface that the amplitude of wave surface was mainly dominated by wave frequency. The proportion of nonlinear components would increase with the increasing wave steepness, and the second-order component contributes the most. The frequency of nonlinear component was mainly the multiple frequency based on the wave frequency. The multiple frequency had a positive contribution to the horizontal asymmetry of the wave surface, which would distort the sinusoidal wave shape: the crest becomes steeper and the troughs become flatter. These were consistent with the characteristics of the wave surface curve shown in Figure 5. In addition, it was worth noting that the amplitude spectrum of wave surface has an obvious amplitude at the zero frequency. The component was mainly generated by the rise of the second-order wave surface, and was shown as the sinking of the mean water level. The sinking of the mean water level was related to the conservation of energy. The nonlinear term increased the kinetic energy of the water, which was bound to reduce the potential energy. The sinking was the amplitude at the zero frequency.
3.2.2 Frequency spectrum characteristic for wave force
According to Section 3.1, the wave force also had obvious nonlinear characteristics such as the wave surface. The wave forces were analyzed by using fast Fourier transform as in Section 3.2.1. The amplitude spectrum of wave force on the netting was obtained under various wave conditions (see Figure 7).
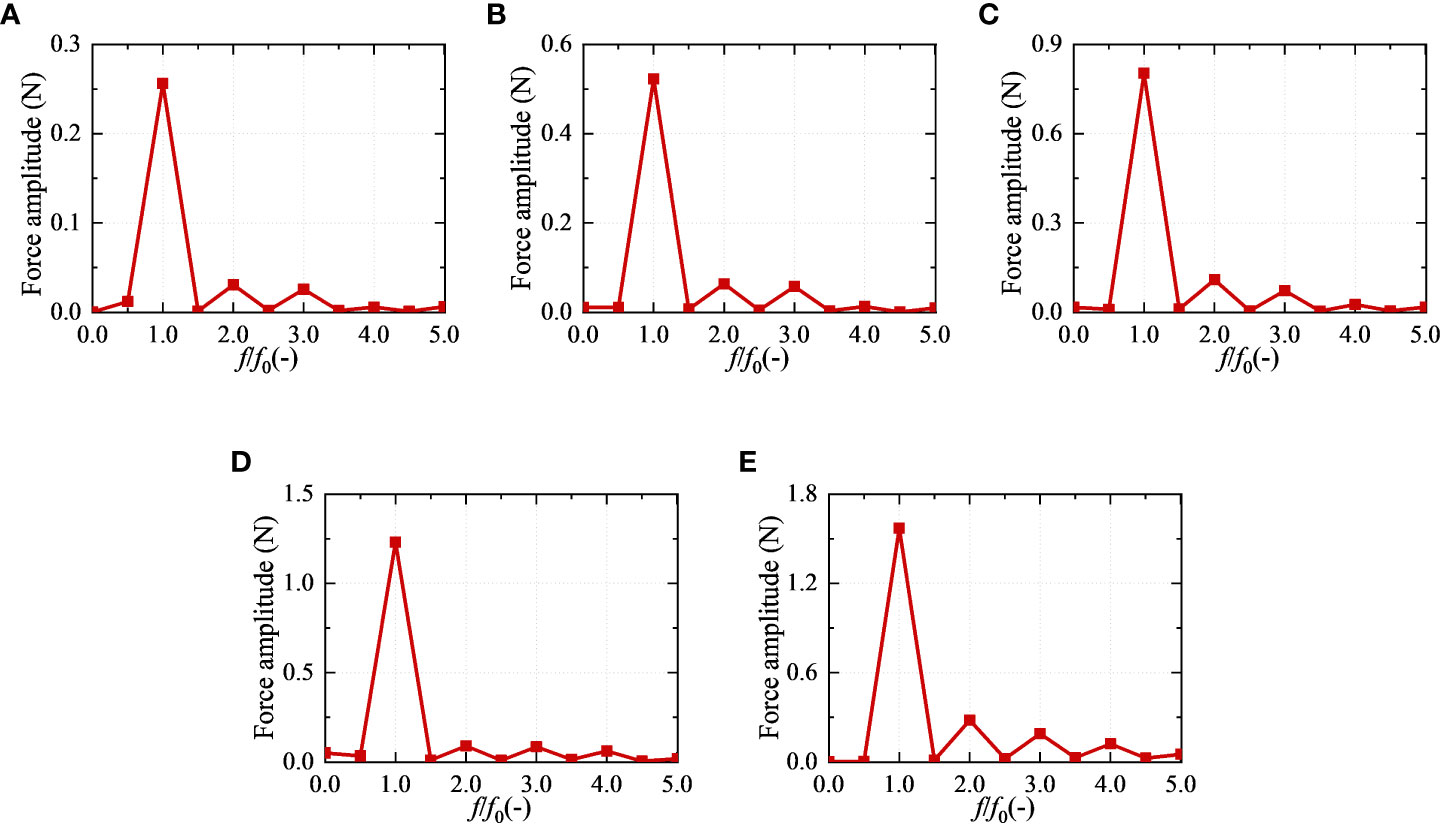
Figure 7 The amplitude spectrum of wave force in the experiment. (A) W1, ϵ = 0.021; (B) W2, ϵ = 0.032; (C) W3, ϵ = 0.041; (D) W4, ϵ = 0.052; (E) W5, ϵ = 0.061.
Compared with the amplitude spectrum of wave surface, the wave frequency component of wave force on netting still played an important role. There was also an obvious second-order component. However, the difference was that the third or higher-order components had an amplitude similar to that of the second-order components. These meant that compared to the wave surface, the wave force had a greater horizontal asymmetry. The difference between wave surface and wave force in amplitude spectrum was consistent with their performance in curve feature.
In addition, the wave force also had a certain amplitude at the zero frequency, which was essentially different from the zero frequency of the wave surface. The zero frequency of wave surface was the change of the mean water level and did not contribute to the wave force. The amplitude at the zero frequency of wave force was mainly the second-order mean force (drift force) caused by the second-order problem. Both the multiple frequency component and zero frequency component of wave force would cause the increase of its horizontal asymmetry. However, the drift forces of the wave force measured in the test were smaller than those of the multiple frequency component.
3.3 The prediction of wave force
3.3.1 The predicted force in time domain
The time and frequency domain of the force of the netting have been described in detail above. On this basis, this section attempts to use Morison equation to predict the force of the netting. The dimension of the twine normal to the wave was much smaller than the wave length, and each twine of the netting can be assumed as a small-scale component satisfying the Morison equation. Thus, the wave force of the whole netting can be simplified as the sum of Morison force of all twines. The least squares method can be used to fit the appropriate hydrodynamic coefficients for each wave condition (see Section 3.4), and then compare the predicted wave force with the test force, as shown in Figure 8.
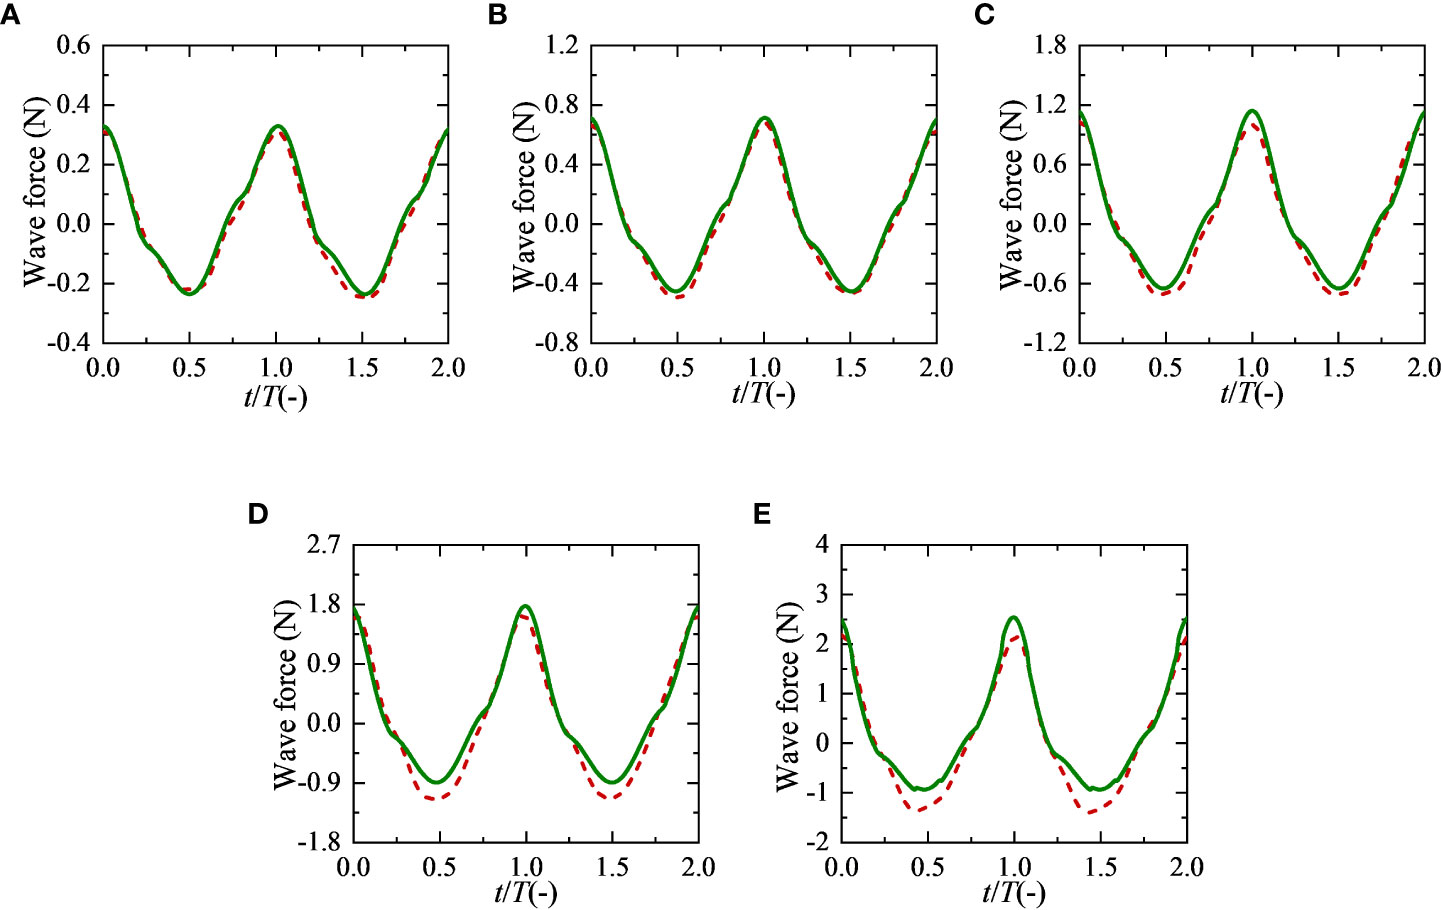
Figure 8 Comparison of the predicted wave force and the test force of netting in time domain. The green solid lines represent the predicted wave force and the red dashed lines represent the test force. (A) W1, ϵ = 0.021; (B) W2, ϵ = 0.032; (C) W3, ϵ = 0.041; (D) W4, ϵ = 0.052; (E) W5, ϵ = 0.061.
When the wave steepness was small, the wave force predicted by Morison equation was in good agreement with the wave force measured in the test. With the increase of wave steepness, the predicted wave force deviated from the test value to varying degrees, mainly showing that the predicted wave force had higher horizontal asymmetry than the test value. In addition, their phases are basically the same, and both have obvious protrusions in front slope, while there were obvious depressions in rear slope. For this netting, the twines were not standard circular in cross-section, but nearly rectangular in shape. The inertia force corresponding to the effective volume of the netting cannot be ignored relative to the drag force corresponding to the effective projected area, which made a huge difference in the symmetry about front and rear slope.
3.3.2 The predicted force in frequency domain
Both the wave surface and wave force of the netting had strong nonlinearity, which greatly increased the difficulty of prediction. To study the nonlinear difference between the test and prediction values, the fast Fourier transform was performed on the corresponding wave surface and wave force in time domain to obtain their amplitude spectra. The comparison of the wave surface amplitude spectrum was shown in Figure 9A, and that of the wave force was shown in Figure 9B.
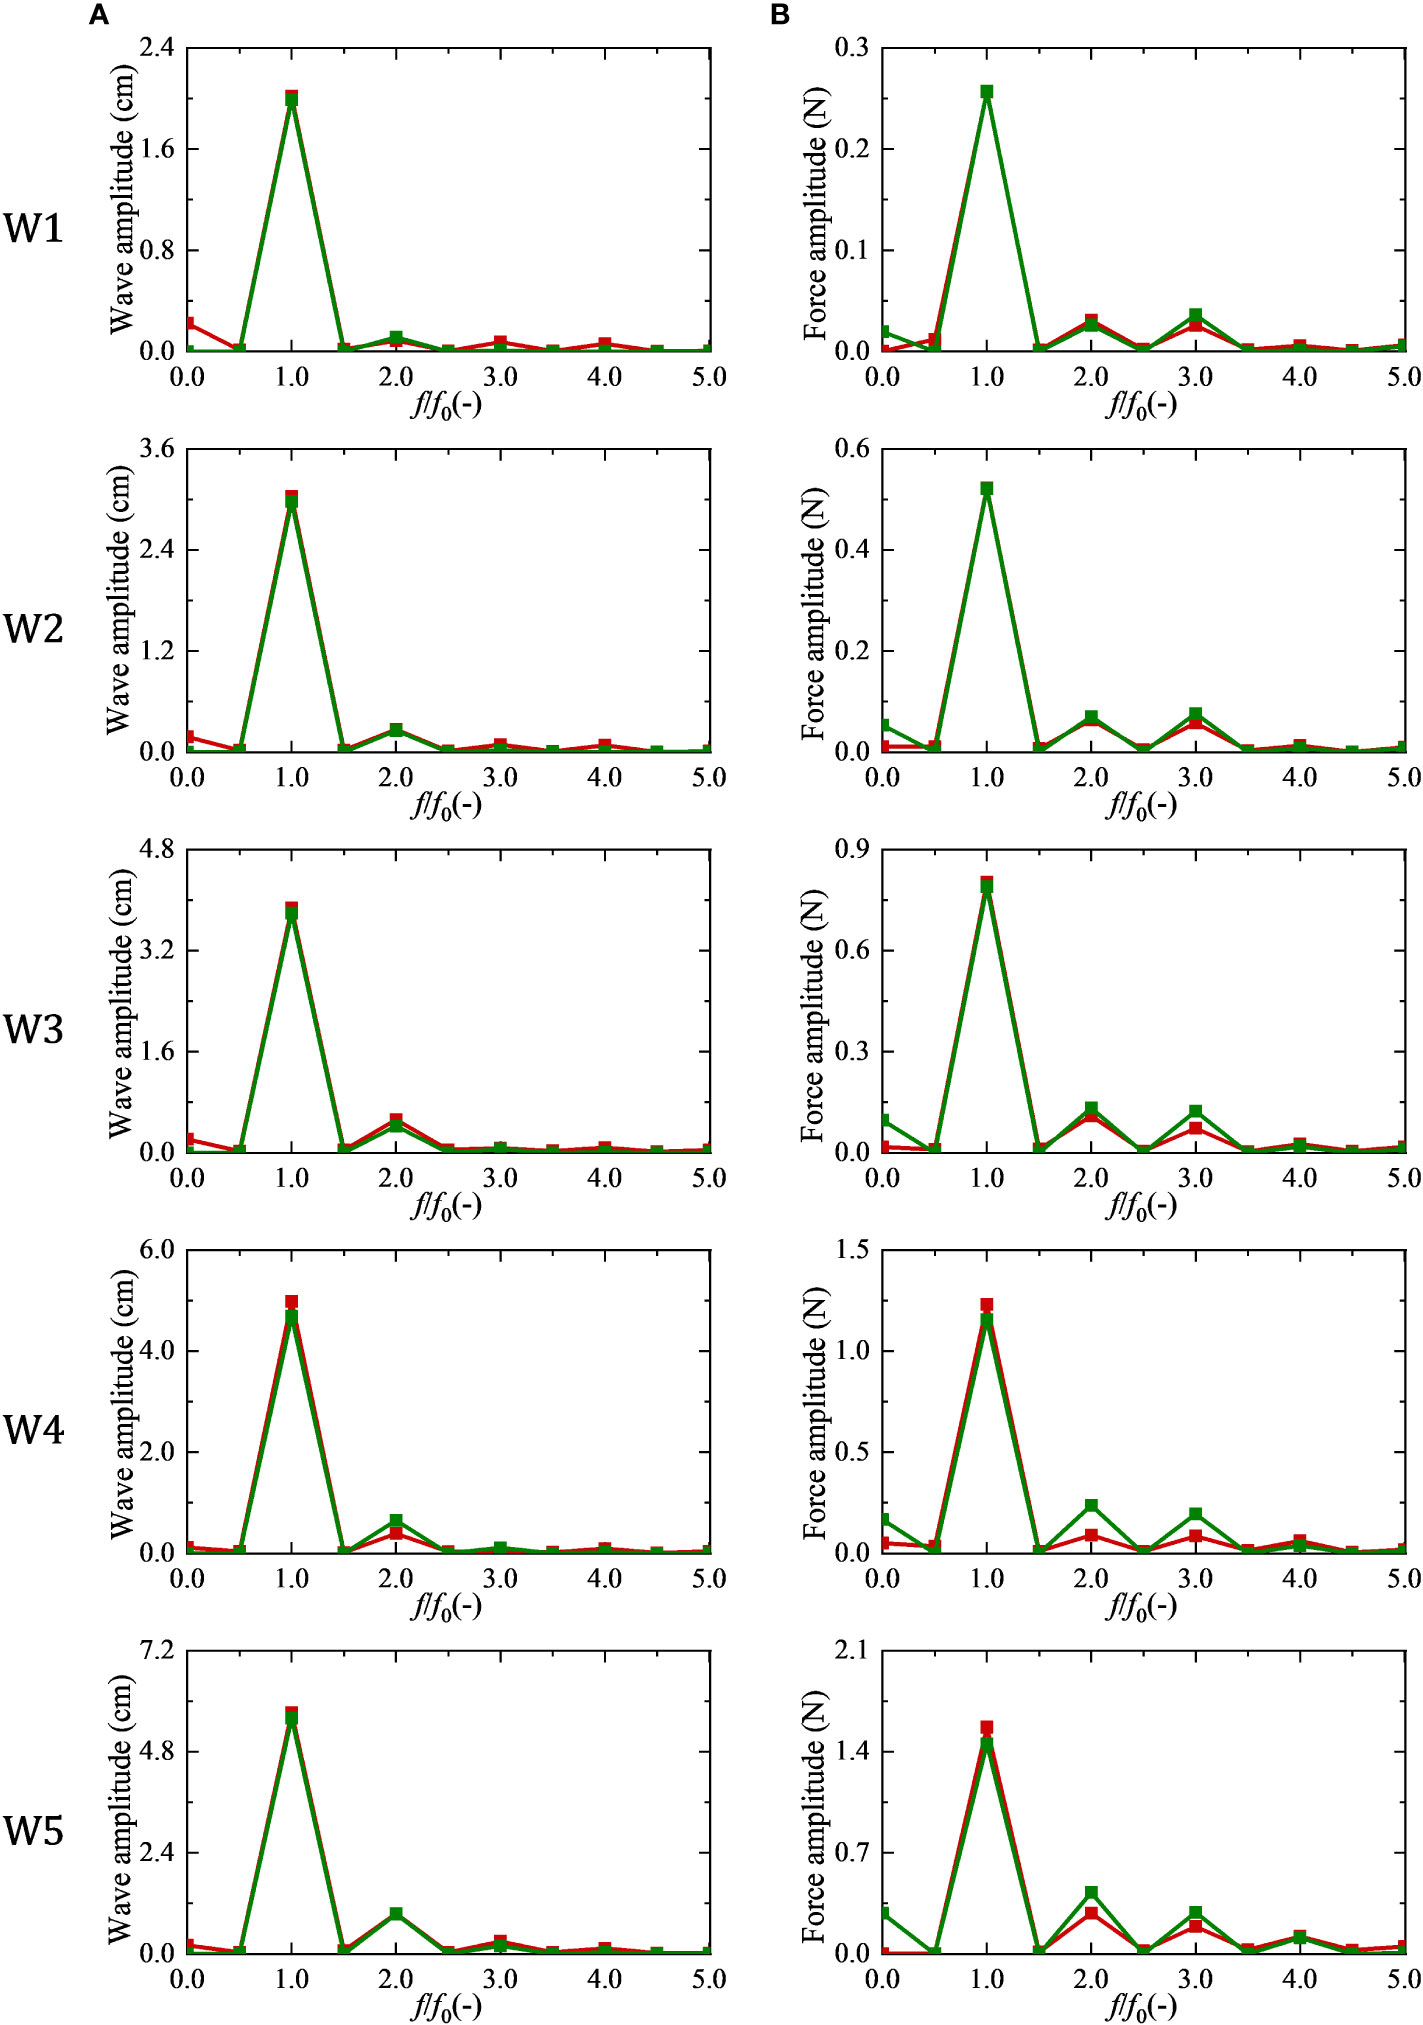
Figure 9 Comparison of the predicted wave force and the test force of netting in frequency domain. The green symbol with green line represents the amplitude spectrum of predicted wave force and the red symbol with red line represents the amplitude spectrum of the test force. (A) wave surface; (B) wave force.
By comparing the test and prediction values of wave surface, it can be found that they were in good agreement, which was the basis for accurate prediction of wave force. The amplitudes of both were dominated by wave frequency, and the second-order frequency components accounted for the largest proportion of multiple frequency components. In addition, at the zero frequency, the sinking of the mean water level obtained from the test was always greater than that of the theoretical fifth-order wave surface. With the increase of wave steepness, the predicted amplitudes of wave force at multiple frequency and zero frequency were significantly greater than the corresponding test amplitude. These differences directly determined that the wave force predicted in time domain had more obvious nonlinear characteristics than the force tested (as shown in Figure 8).
3.4 Hydrodynamic coefficients
The hydrodynamic coefficients fitted by the predicted wave force were sorted and their variation rules with Keulegan-Carpenter number (KC number, KC = umaxT/D, where umax is the maximum horizontal velocity of the water particles) were shown in Figure 10. There, CD was the drag coefficient, CM was the inertial coefficient, and D was the dimension of the twine normal to the wave. In this study, the variation range of KC number is 35-120.
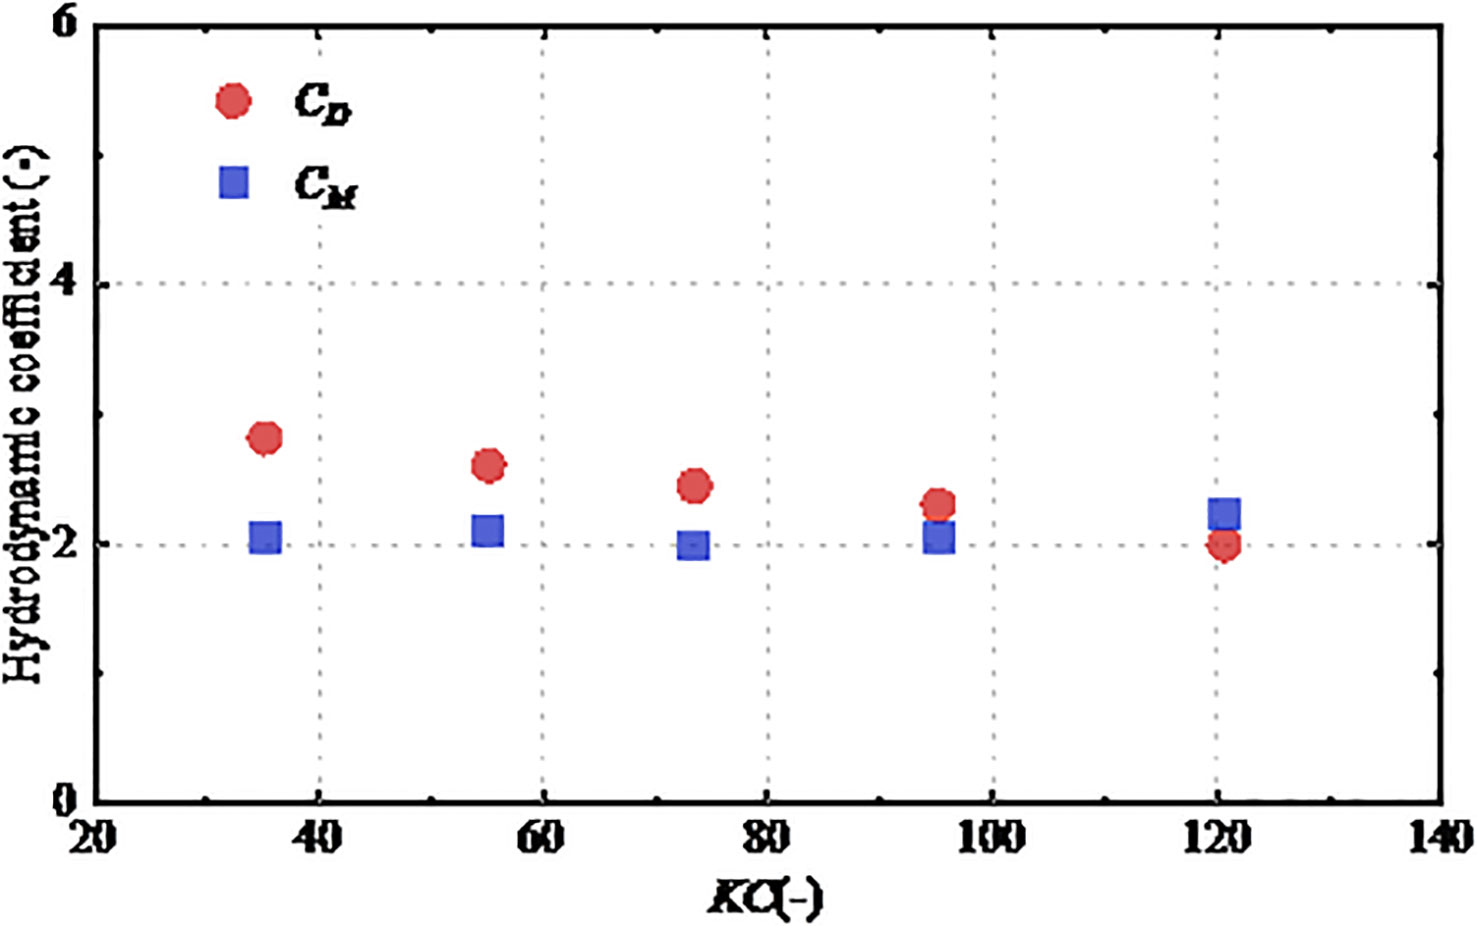
Figure 10 Hydrodynamic coefficients of the netting.
It can be seen from the figure that CD decreased with the increasing KC number, while CM remained basically unchanged. The variation range of CD value was 2-2.82, with an average value of 2.4. The variation range of CM was 1.99-2.23, with an average value of 2.1. Considering that the effective cross-section of the twine was nearly rectangular, its CD value will be significantly greater than the empirical CD value of slender rods with cylindrical section. In addition, due to the problems of the netting knitting process, its surface roughness was large, which would also increase its drag coefficient. Therefore, the value range of drag coefficient obtained in this study had important practical significance and can provide reference for the design of anti-wave cage.
4 Conclusions
In this study, the horizontal wave force of a nylon netting was performed in a series of wave tests. The wave in the experiment had strong nonlinearity. The nonlinear characteristics of wave surface and wave force were analyzed by means of the fast Fourier transform method. Moreover, the wave forces of the netting were predicted based on Morison equation, and the accuracy of the predicted value was analyzed in time domain and frequency domain. The main results are as follows:
i. In the nonlinear wave test, wave force of the netting is more nonlinear than the wave surface. The positive amplitude of wave force is basically proportional to the square of wave height.
ii. The wave surface and wave force are both dominated by wave frequency component. The second-order component contributes the most to the nonlinearity of the wave surface, while the third or higher-order components of the wave force have similar contribution as the second-order component.
iii. The wave forces predicted by the Morison equation agree well with the test values in time and frequency domain. As the wave steepness increases, the amplitude spectrum of predicted force at zero and multiple frequencies show obvious differences with the corresponding test values.
iv. The hydrodynamic coefficients of the test netting are quite different with single smooth cylinder mainly due to the cross-section and surface roughness of twine. The average CD of the netting is about 2.4, and the average CM is about 2.1.
Data availability statement
The datasets presented in this article are not readily available. Requests to access the datasets should be directed to Q-PC,chenqiupan@mail.dlut.edu.cn.
Author contributions
Q-PC experiment design, Data curation, Wave force prediction, Writing - original draft. C-WB: Supervision, Reviewing and Editing. Y-PZ: Conceptualization and Methodology. All authors contributed to the article and approved the submitted version.
Funding
This work was financially supported by the National Key R&D Program of China (no. 2019YFD0900902); National Natural Science Foundation of China (nos. 51822901, 31972843 and 31872610); LiaoNing Revitalization Talents Program (no. XLYC1907139); Dalian Technology Talents Program, project no. 2020RJ02.
Conflict of interest
The authors declare that the research was conducted in the absence of any commercial or financial relationships that could be construed as a potential conflict of interest.
Publisher’s note
All claims expressed in this article are solely those of the authors and do not necessarily represent those of their affiliated organizations, or those of the publisher, the editors and the reviewers. Any product that may be evaluated in this article, or claim that may be made by its manufacturer, is not guaranteed or endorsed by the publisher.
References
Balash C., Colbourne B., Bose N., Raman-Nair W. (2009). Aquaculture net drag force and added mass. Aquacult. Eng. 41, 14–21. doi: 10.1016/j.aquaeng.2009.04.003
Bi C.-W., Zhao Y.-P., Dong G.-H., Wu Z.-M., Zhang Y., Xu T.-J. (2018). Drag on and flow through the hydroid-fouled nets in currents. Ocean Eng. 161, 195–204. doi: 10.1016/j.oceaneng.2018.05.005
Endresen P. C., Moe-Føre H. (2022). “Numerical modelling of drag and lift forces on aquaculture nets: Comparing new numerical load model with physical model test results,” in Proceedings of the ASME 2022 (Hamburg, Germany: 41st International Conference on Ocean, Offshore and Arctic Engineering).
Føre H.M., Endresen P.C., Norvik C., Lader P.F. (2021). Hydrodynamic loads on net panels with different solidities. J. Offshore Mech. Arc. 143, 1–17. doi: 10.1115/1.4049723
Gansel L. C., Plew D. R., Endresen P. C., Olsen A. I., Misimi E., Guenther J., et al. (2015). Drag of clean and fouled net panels – measurements and parameterization of fouling. PloS One 10, 0131051. doi: 10.1371/journal.pone.0131051
Lader P.F., Fredriksson D.W., Guenther J., Volent Z., Blocher N., Kristiansen D., et al (2015). Drag on hydroid-fouled nets – An experimental approach. China Ocean Eng. 29, 369–389. doi: 10.1007/s13344-015-0026-y
Ma C., Bi C.-W., Xu Z.-J., Zhao Y.-P. (2022). Dynamic behaviors of a hinged multi-body floating aquaculture platform under regular waves. Ocean Eng. 243, 110278. doi: 10.1016/j.oceaneng.2021.110278
Martin T., Tsarau A., Bihs H. (2020). A numerical framework for modelling the dynamics of open ocean aquaculture structures in viscous fluids. Appl. Ocean Res. 106, 102410. doi: 10.1016/j.apor.2020.102410
Nishimura H., Isobe M., Horikawa K. (1977). Higher order solutions of the stokes and cnoidal waves. J. Fac. Eng. Univ. Tokyo Ser. B. 34, 267–293.
Santo H. (2022). On the application of current blockage model to steady drag force on fish net. Aquacult. Eng. 97, 102226. doi: 10.1016/j.aquaeng.2022.102226
Skjelbreia L., Hendrickson J. (1960). Fifth order gravity wave theory. Coast. Eng. Proc. 1 (7), 184–196. doi: 10.9753/icce.v7.10
Swift M. R., Fredriksson D. W., Unrein A., Fullerton B., Patursson O., Baldwin K. (2006). Drag force acting on biofouled net panels. Aquacult. Eng. 35, 292–299. doi: 10.1016/j.aquaeng.2006.03.002
Tang H., Xu L.-X., Hu F.-X. (2018). Hydrodynamic characteristics of knotted and knotless purse seine netting panels as determined in a flume tank. PloS One 13, 0192206. doi: 10.1371/journal.pone.0192206
Wang S., Feng D.-J., Gui F.-K., Xu Z.-J. (2022). Dynamic behavior of the net of a pile-net-gapped enclosure aquaculture facility. J. Mar. Sci. Eng. 10, 1166. doi: 10.3390/jmse10091166
Wang Y.-H., Fu S.-X., Xu Y.-W., Li S., Moan T. (2022). Loads on a vessel-shaped fish cage steel structures, nets and connectors considering the effects of diffraction and radiation waves. Mar. Struct. 86, 103301. doi: 10.1016/j.marstruc.2022.103301
Wang G., Martin T., Huang L.-Y., Bihs H. (2022). An improved screen force model based on CFD simulations of the hydrodynamic loads on knotless net panels. Appl. Ocean Res. 118, 102965. doi: 10.1016/j.apor.2021.102965
Zhan J.-M., Jia X.-P., Li Y., Sun M.-G., Guo G.-X., Hu Y.-Z. (2006). Analytical and experimental investigation of drag on nets of fish cages. Aquacult. Eng. 35, 91–101. doi: 10.1016/j.aquaeng.2005.08.013
Zhao Y.-P., Bi C.-W., Dong G.-H., Gui F.-K., Cui Y., Guan C.-T., et al. (2013). Numerical simulation of the flow around fishing plane nets using the porous media model. Ocean Eng. 62, 25–37. doi: 10.1016/j.oceaneng.2013.01.009
Zhao Y.-P., Chen Q.-P., Bi C.-W. (2022). Numerical investigation of nonlinear wave loads on a trestle-netting enclosure aquaculture facility. Ocean Eng. 257, 111610. doi: 10.1016/j.oceaneng.2022.111610
Keywords: netting panel, nonlinear wave, wave force, amplitude spectrum, hydrodynamic coefficient
Citation: Chen Q-P, Bi C-W and Zhao Y-P (2023) Prediction of wave force on netting under strong nonlinear wave action. Front. Mar. Sci. 10:1132629. doi: 10.3389/fmars.2023.1132629
Received: 27 December 2022; Accepted: 06 March 2023;
Published: 27 March 2023.
Edited by:
Yang Jin, Carnegie Institution for Science, United StatesReviewed by:
Hung-Jie Tang, National Cheng Kung University, TaiwanRay-Yeng Yang, National Cheng Kung University, Taiwan
Copyright © 2023 Chen, Bi and Zhao. This is an open-access article distributed under the terms of the Creative Commons Attribution License (CC BY). The use, distribution or reproduction in other forums is permitted, provided the original author(s) and the copyright owner(s) are credited and that the original publication in this journal is cited, in accordance with accepted academic practice. No use, distribution or reproduction is permitted which does not comply with these terms.
*Correspondence: Yun-Peng Zhao, ypzhao@dlut.edu.cn