 Songchen Yu1,2
 Peng Li
- 1Science and Technology on Underwater Vehicle Laboratory, Harbin Engineering University, Harbin, China
- 2College of Shipbuilding Engineering, Harbin Engineering University, Harbin, China
- 3Yantai Research Institute and Graduate School of Harbin Engineering University, Yantai, China
The net structure of a cage is an important component to ensure the survival environment of aquaculture. In order to ensure the safety of the net, an experimental study on practical rigid nets is conducted in this paper. The drag force characteristics of the nets with different mesh sizes and different twine thicknesses are analyzed, and the impact of 90° and 45° attack angles on the drag force characteristics of the net are further studied. The empirical formulae for calculating the drag force of the net under different attack angles are given. The calculated drag forces are compared with the literature, and the results are in good agreement. Particularly, the current velocity is taken as one of the variables in the formulae to include the influence of nonlinear factors caused by the extreme current velocity in the drag force calculation.
Highlights
● The relationship between the drag force of the net and the current velocity is quadratic polynomial.
● Under a similar mesh size, the thicker the net twine, the greater the drag force, especially at 90° attack angle.
● The drag force of net at attack angle of 90° is basically ("" ) times that at 45°.
● The empirical formulae of the average drag force including the influence of nonlinear factors on the net are given.
1 Introduction
The aquaculture industry has been developing vigorously over the past five decades (Xu and Qin, 2020). Due to limited space in coastal areas and the aggravation of environmental pollution, transformation to pelagic aquaculture has become a new goal (Costa-Pierce and Bridger, 2002; Fredriksson et al., 2003; Klebert et al., 2015). New types of fish farms, such as a semi-submersible offshore fish farm (Yu et al., 2021), deep-sea aquaculture vessel (Li et al., 2019), have been put into use in recent years. In order to ensure the safety of large-scale aquaculture fishery, the strength of the rigid fish nets fixed by the frames cannot be ignored. There is a need to focus on the hydrodynamic responses of the net under extreme sea conditions to guide the design and application of offshore cages.
Improving the understanding of the interaction between currents and net in aquaculture cages is crucial for the development of efficient and sustainable aquaculture in the future (Klebert et al., 2013). Different modeling methods have been developed, such as lumped mass method (Li et al., 2006), four-sided super-elements (Lader et al., 2003), consistent finite net elements (Tsukrov et al., 2003), current blockage model (Santo, 2022), and Kriging metamodel (Wang et al., 2022a) to better simulate the deformation and tension distribution of the net as well as the volume reductions of the net cages (Lader et al., 2008). Moreover, Cheng et al. (2020) have reviewed 11 commonly used hydrodynamic models comprehensively. However, a growing number of scholars pay attention to the study of hydrodynamic responses, including the flow field variations and drag force characteristics of the net.
For normal and tangential drag coefficients, Zhan et al. (2006) and Niño et al. (2020) carried out an experiment study. Endresen and Føre (2022) carried out a numerical simulation on the new formulae. Empirical values for normal drag coefficients are proposed by Tsukrov et al. (2011) for various types of copper netting, and Cha et al. (2013) compared the drag coefficients of copper alloy nets with knotless fabric nets. In addition, the drag coefficients of nylon nets (Zhou et al., 2015) and knotless polyethylene nets (Tang et al., 2017; Tang et al., 2019) under different attack angles were studied. It is concluded that the normal drag coefficient is determined by the synergistic control of Reynolds number (Re) and solidity ratio, and the solidity ratio has a dual influence on the drag coefficient of inclined netting panels. To compare with the numerical results, Balash et al. (2009) conducted an experiment to measure the hydrodynamic loads, including drag force and added mass on plane nets with differing mesh geometry under steady and oscillating flows. Taking the effects of the net solidity, the net material, and the knot pattern into account, Dong et al. (2019) investigated the hydrodynamic force on net panels in waves by experiments, and a wave force model for the net panel was proposed. Considering the offshore cages with fine-mesh nettings used for young sardine culture, Shimizu et al. (2018) studied the drag coefficient on fine-mesh nettings, tending to avoid the effects of blocking. The open-source hydrodynamic toolbox REEF3D is adopted to investigate the hydrodynamic drag on the net, and the simulation accuracy is in good agreement with flume experiments and previous research (Wang et al., 2022b).
According to the linear free-wake equations in conjunction with an eddy viscosity formulation, the relationship between the drag coefficient and the wake velocity was derived by Løland (1993), and the behavior of the near- and far-field wake was investigated. To investigate the reduction of flow velocity downstream from a fishing net, a series of laboratory experiments was conducted by Bi et al. (2013). They found that the reduction in flow velocity tended to increase with the increasing attack angle, that is, the angle between the plane net and the vertical direction, and the reduction factors under different numbers of nets were given. Porous media models were used for simulating the fishing nets in order to obtain the flow field variation around the net panel efficiently (Patursson et al., 2010; Zhao et al., 2013; Bi et al., 2014). Based on one-way coupling combining the shear stress turbulent k-omega model and the large deformation nonlinear structural finite element model, a fluid–structure interaction model was carried out to evaluate the flow field distribution through the net (Zou et al., 2020). Wang et al. (2021) proposed computational meshing strategies which are suitable for smooth and fabric twines, and the fluid flow through a fixed net panel is qualitatively analyzed.
Although relevant experimental or numerical studies on the plane net have been conducted by scholars, there are few experimental research considering the extreme current velocity. In this paper, an experimental study on the drag force characteristics of the practical rigid plane net is carried out, and the influence of the twine thickness and mesh size on the drag force characteristics of the net is analyzed. At the same time, the relationship of the drag force between two attack angles is obtained. The empirical formulae of the drag force on the plane net at different attack angles with the variables of current velocity and solidity are given.
In what follows, we first introduce the parameters of the physical models and experimental set up in Section 2; this part also includes test conditions and data processing. Section 3 gives the numerical calculation method and the numerical model. The comparative results of drag force at different attack angles and current velocities are exhibited in Section 3; the empirical formulae and a thorough explanation of the results and errors are also discussed. This is followed by the conclusions of this paper in Section 4.
2 Experiments
2.1 Physical model
The rigid nets used in the experiment are the practical size used in offshore cages. The size of the nets varies according to the size of different aquaculture products. Table 1 illustrates the parameters of the nets used for the experiment, where d is the diameter of the net twine and l1 l2 are the side lengths of the mesh. The side length of the mesh is the distance between the axes of two adjacent twines Ensuring that the mesh area is consistent, the equivalence mesh side length is in order to calculate the net solidity Sn, and here the net solidity can be written as follows (Kristiansen and Faltinsen, 2012):
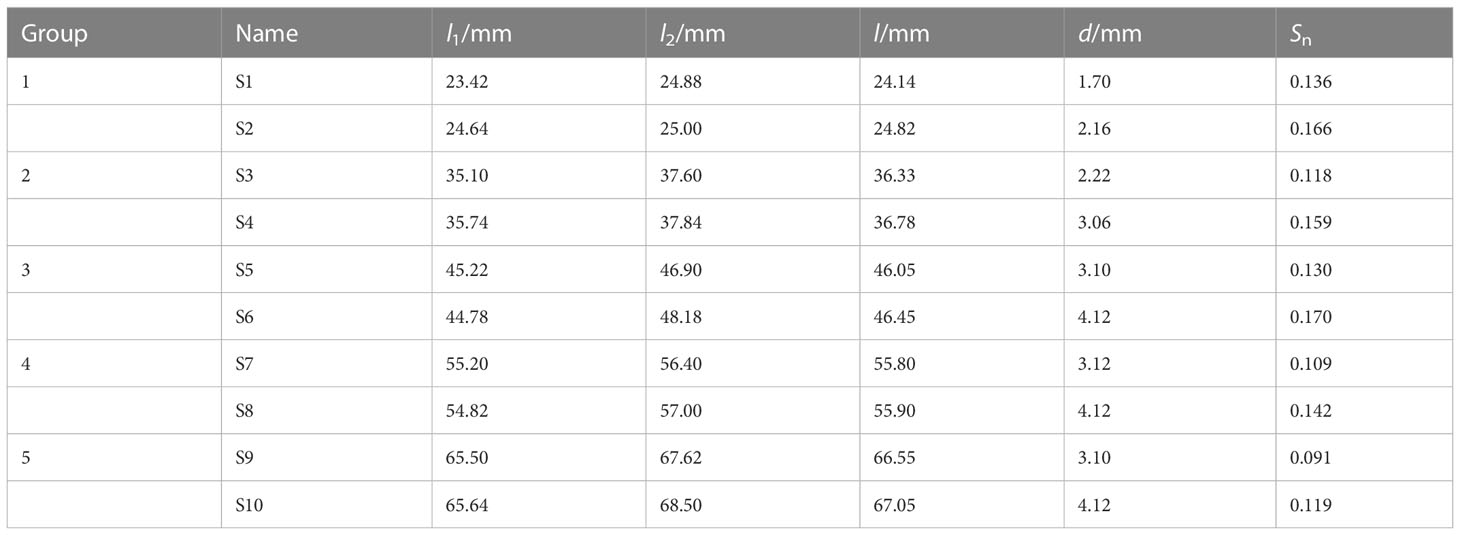
Table 1 Parameters of stainless steel nets.
As described in Table 1, the nets in groups 1–5 have a similar mesh size but different twine diameters, respectively. Figure 1 shows some of the nets used for the experiment, where Figures 1A–D correspond to S3, S4, S5, and S6.
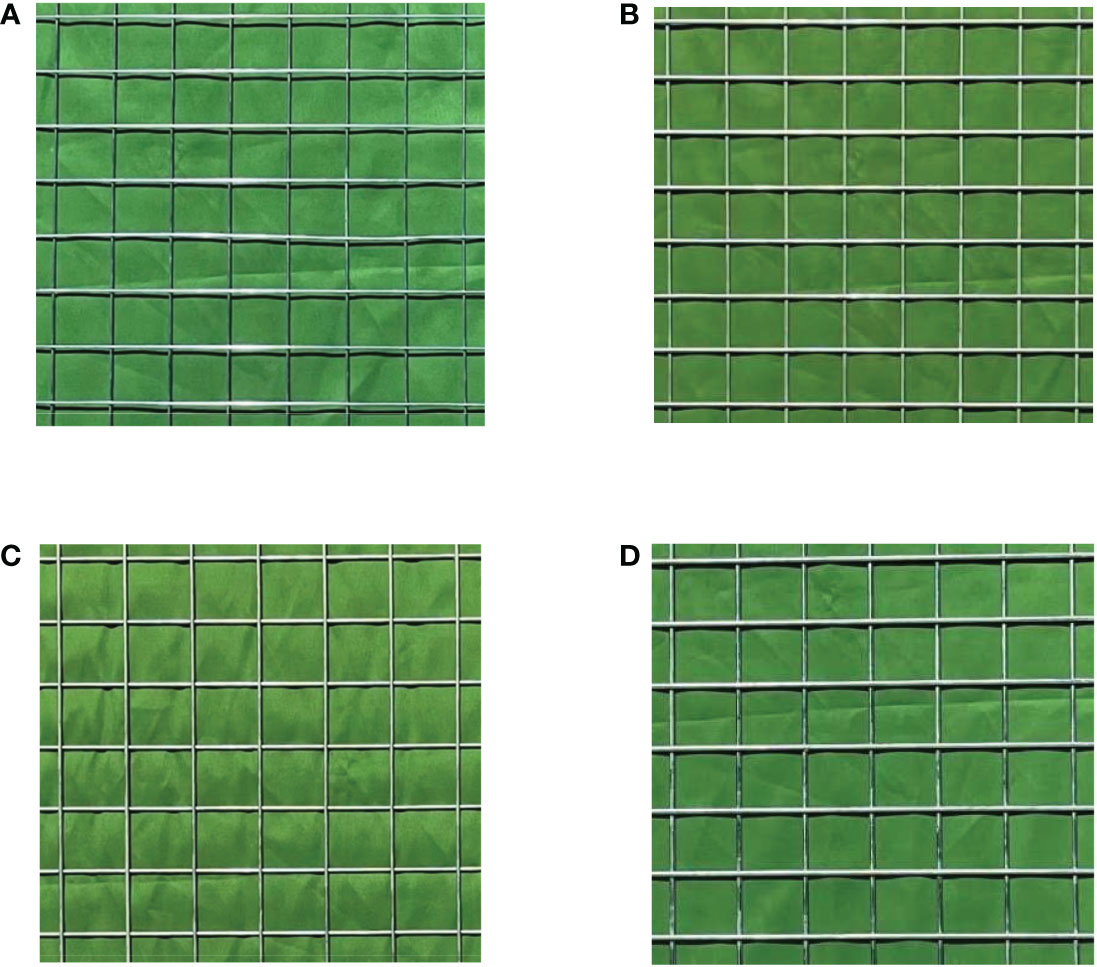
Figure 1 Nets with different twine diameters, where (A) S3 and (B) S4 are two nets corresponding to group 2 and (C) S5 and (D) S6 are two nets corresponding to group 3.
2.2 Experimental setup
Laboratory tests of practical rigid nets under extreme current conditions were conducted at a horizontal circulating water channel in Harbin Engineering University, Heilongjiang, China. The dimensions of the circulating water channel are 7 m (length) × 1.7 m (width) × 1.8 m (deep) with a constant water depth of 1.5 m. The range of flow velocity that can be created by the circulating water channel is 0.3–2.0 m/s, and the equipment is shown in Figure 2.
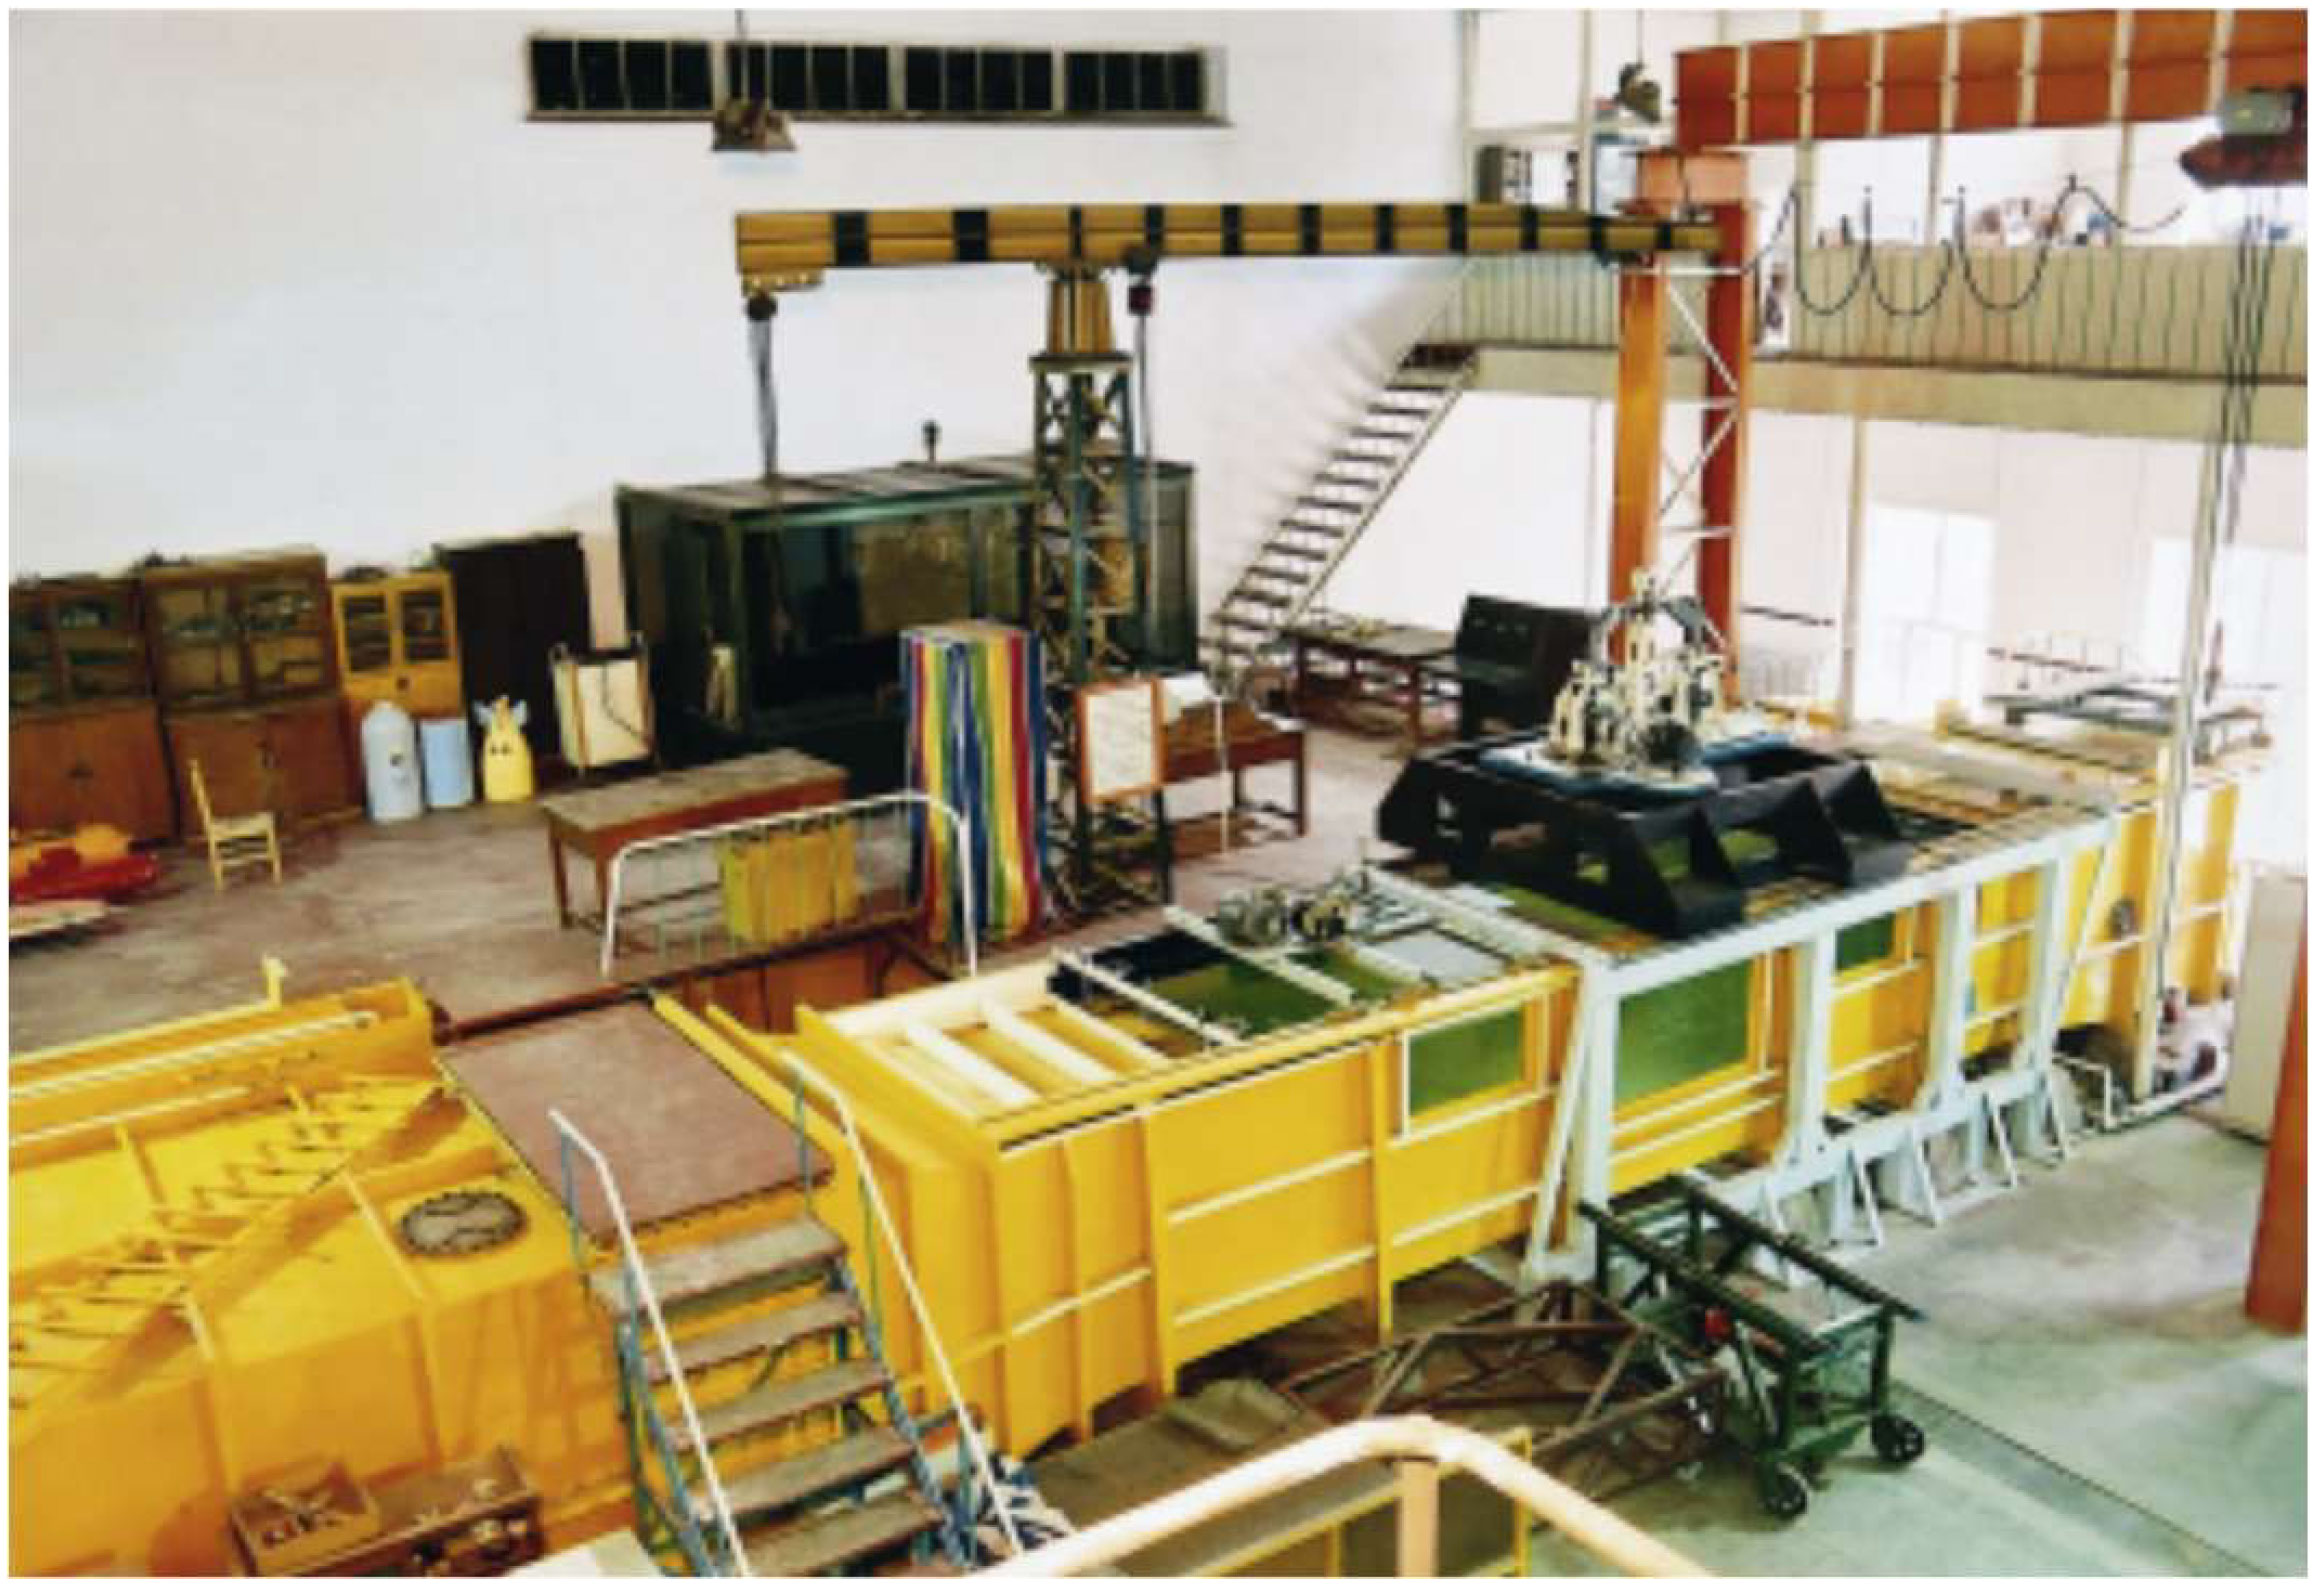
Figure 2 Circulating water channel used for the experiment.
In order to ensure the stability of the net under extreme current conditions, a frame structure is designed in this paper. The position of the net is fixed by the frame, and the net is connected with the frame by self-locking plastic ribbons. The upstream of the frame is designed as streamline to reduce interference to the flow. The top of the frame is connected with a connector, which can adjust the attack angle. The top end of the connector is connected with a single component force measuring balance, and the data interaction with the dynamic signal testing system is realized through cables to complete the transformation of electrical signals and force signals. The measuring range of the balance in this paper is 100 kgf, and the precision is ± 0.001 kgf, which can effectively ensure the accuracy of the balance reading under extreme current conditions. The top of the balance is connected with a ship-like structure, which can effectively reduce the interference to the water flow. The top of the ship-like structure is fixed on two rigid brackets, which can span over the circulating water channel. The schematic of the experimental setup is shown in Figure 3.
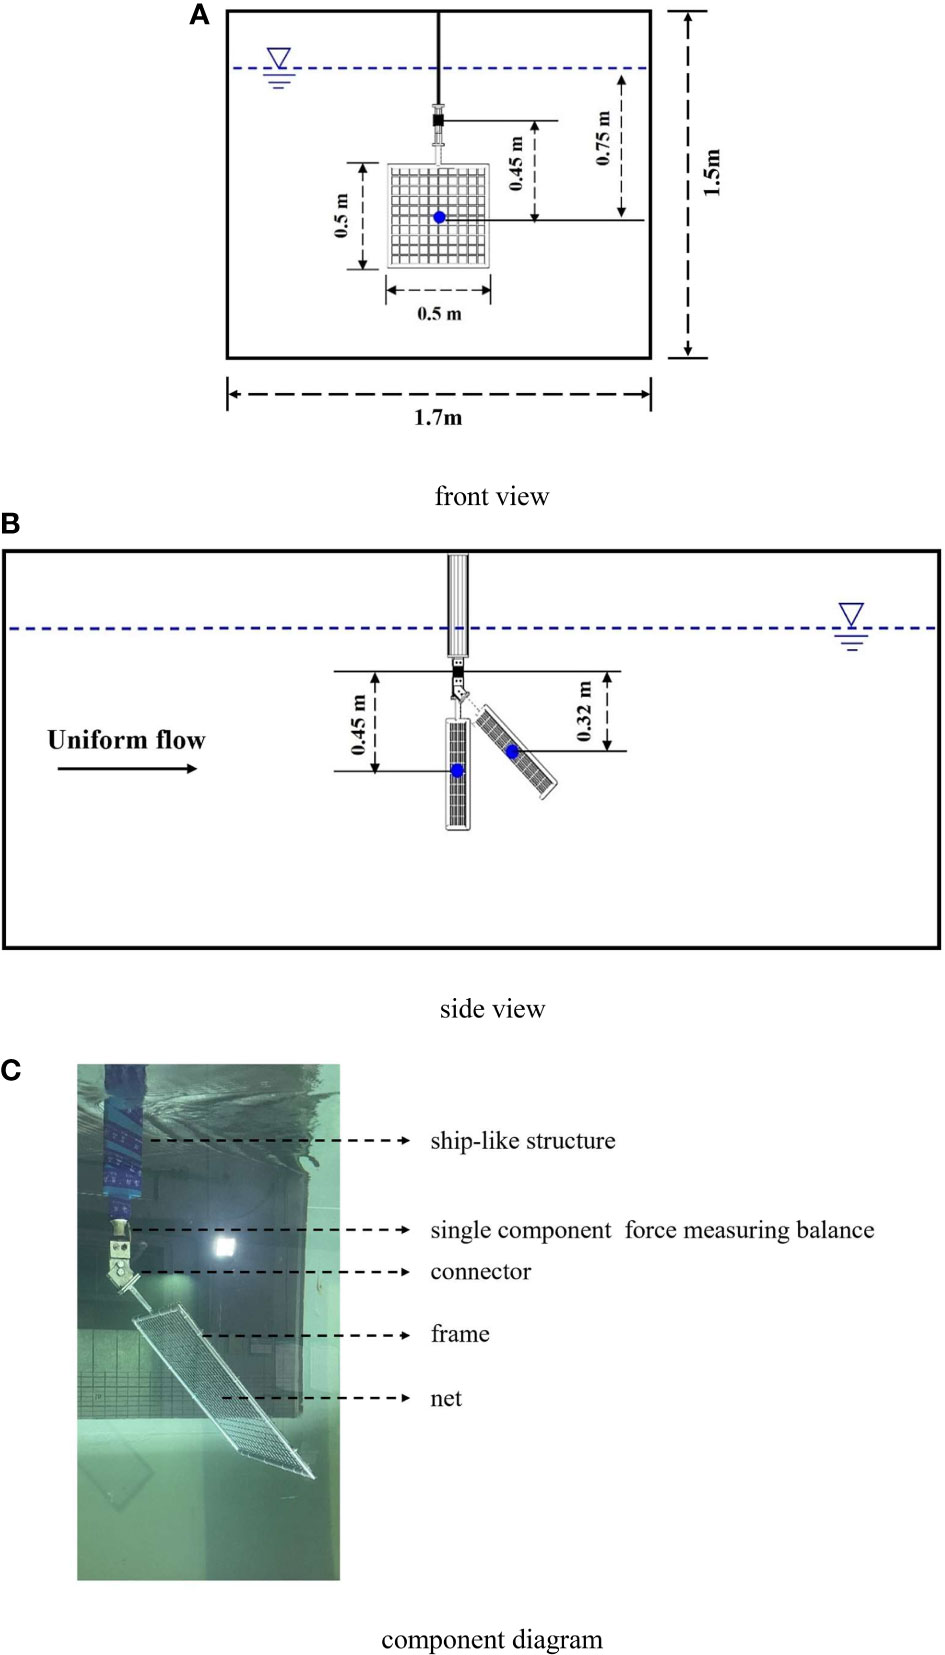
Figure 3 Schematic of the experimental setup.
2.3 Test conditions
Large-scale fish farms like the semi-submersible offshore fish farms are likely to suffer from severe environment in the ocean. Since the hydrodynamic characteristics of the net structure on the fish farm are greatly affected by current, a series of extreme current conditions is tested in this study. According to the geographical characteristics of the sea area where the semi-submersible offshore fish farm is put into use, namely, the Arctic Ocean nearby Norway, which is characterized by the frequent occurrence of the Norwegian warm current, the normal current velocity is 0.25–0.53 m/s. The velocity range given in this paper is V = 0.3–1.3 m/s, with an interval of 0.1 m/s. There is a certain error between the actual current velocity and the designed current velocity, as shown in Table 2. V is the designed current velocity, and VP is the actual current velocity with the largest difference from the designed current velocity in all working conditions. The error range E is ± 2.667%.
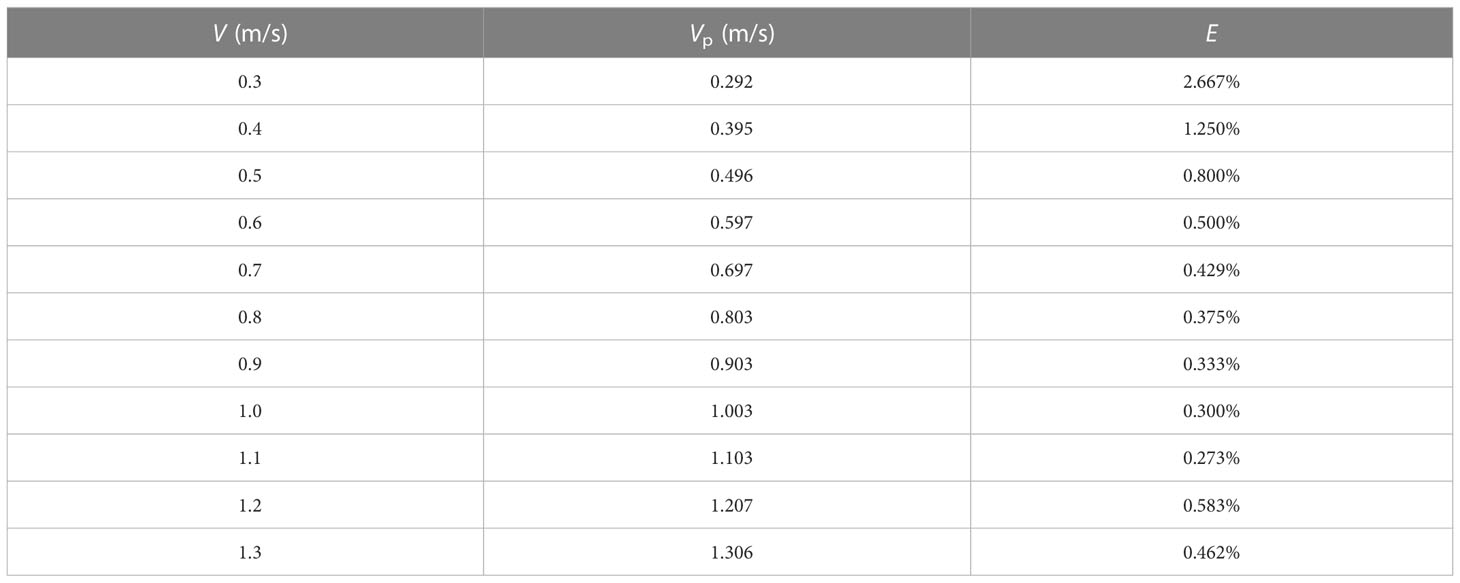
Table 2 Error between the designed current velocity and actual current velocity.
2.4 Data processing
Before the experiment under each working condition, it is necessary to carry out balance reset in the data acquisition system. Acquiring of data should be started before the designed current velocity is given. In order to eliminate the effects of noises, the average value of 10 s force data should be read and recorded after stabilization. Moreover, the experiment interval of each case is 5–8 min to avoid water surface interference. Each case is suggested to be repeated two to three times to ensure reproducibility. The procedure of data processing is as follows:
(1) Obtain the raw data from the single component force measuring balance.
(2) Read and record the average value of 10-s force data after each current velocity reaches a steady state.
(3) Repeat the case for two to three times after a 5–8-min experiment interval.
3 Results
According to the Morrison formula, the drag force of rigid net in this paper is calculated numerically, namely:
where CD is the drag coefficient—according to the empirical value, CD is taken as 1.2, ρ is the density of water, V is the current velocity, and Ap is the projection area of the net. Ap can be calculated by the solidity Sn, with data given in Table 1. Under the attack angle of 90°, Ap–90 can be written as follows:
where A is the area of the net panel, and li is the inner length of the frame. In this paper, li=0.486m. Under the attack angle of 45°, Ap–45 can be written as follows:
3.1 Drag force under different current velocities
Figure 4 shows the drag force comparisons of the rigid nets between the experiments and numerical results in groups 1–5 under the current velocities of 0.3–1.3 m/s, with an interval of 0.1 m/s and attack angle of 90°. It can be seen that the relationship between the drag force of the net and the current velocity is quadratic polynomial, regardless of the numerical results or the experimental results. By comparing the drag force of each group in Figure 4, it can be indicated that, under a similar mesh size, the thicker the net twine, the greater the drag force, and the numerical values are basically consistent with the experimental results. In addition, by comparing the numerical and experimental results of the nets in each group, the error is relatively large under the condition of large current velocity, and the error comes from three probable aspects. First of all, as mentioned in Section 2.2, a frame structure is used in the experiments to fix the net model, then the drag force of the net is the total measured force minus the empty frame force, in the condition of the same current velocity and attack angle, which can result in errors on the results during the experiments. Moreover, the existence of the mesh hinders the flow of water, as the moment that the water flows through the net mesh the flow region of the water suddenly becomes narrow. According to the continuity equation, when the overall volume of flow is unchanged, the current velocity will increase when the flow region is getting narrow. Therefore, when passing through the net mesh, an acceleration in the velocity direction will be produced by the current, that is, a force will be generated in the current direction. According to Newton’s Third Law this time, a force opposite to the current direction but with the same value will be generated on the net, which will be different from the numerical results. Finally, there is a certain error between the practical current velocity generated by the propeller and the designed current velocity. As mentioned in Section 2.3, the practical current velocity may be slightly greater or less than the designed current velocity, which will affect the drag force of the net in the experiment. The combined influence of three factors leads to the difference between the experimental results and the numerical results. Figure 5 illustrates the drag force comparisons of the rigid nets between the experiments and numerical results in groups 1–5 under the current velocities of 0.3–1.3 m/s, with an interval of 0.1 m/s and attack angle of 45°. From Figure 5, it can be observed that the drag force variation trend is similar, and the drag force of the net in each group under 45° and 90° attack angles seems to have a quadratic polynomial relationship with the increase of current velocity. As the projected area of the net under the attack angle of 45° is obviously less than that under 90°, the drag force of the net is obviously small. At the same time, compared with the numerical results, the experimental results under the attack angle of 45° are also smaller. In addition to the probable errors mentioned, another influencing factor existed. When the strain gauge in the force measuring balance is subjected to force or moment, electric charges will be generated at its two ends, which will be transmitted to the data acquisition system through the data line for the force value to be read. When the attack angle is 90°, the force measuring balance is not affected by the net. However, when the attack angle is 45°, the center of the net deviates from the vertical direction of the force measuring balance, and a force moment will be generated by the weight coming from the stainless steel net. It should be noted that, before measuring the drag force of the net, a balancing and zeroing step was taken to eliminate the impact of anthropic factor, namely, the process of net replacement. The impact of the force moment acting on the force measuring balance is also eliminated by this step, which will result in errors.
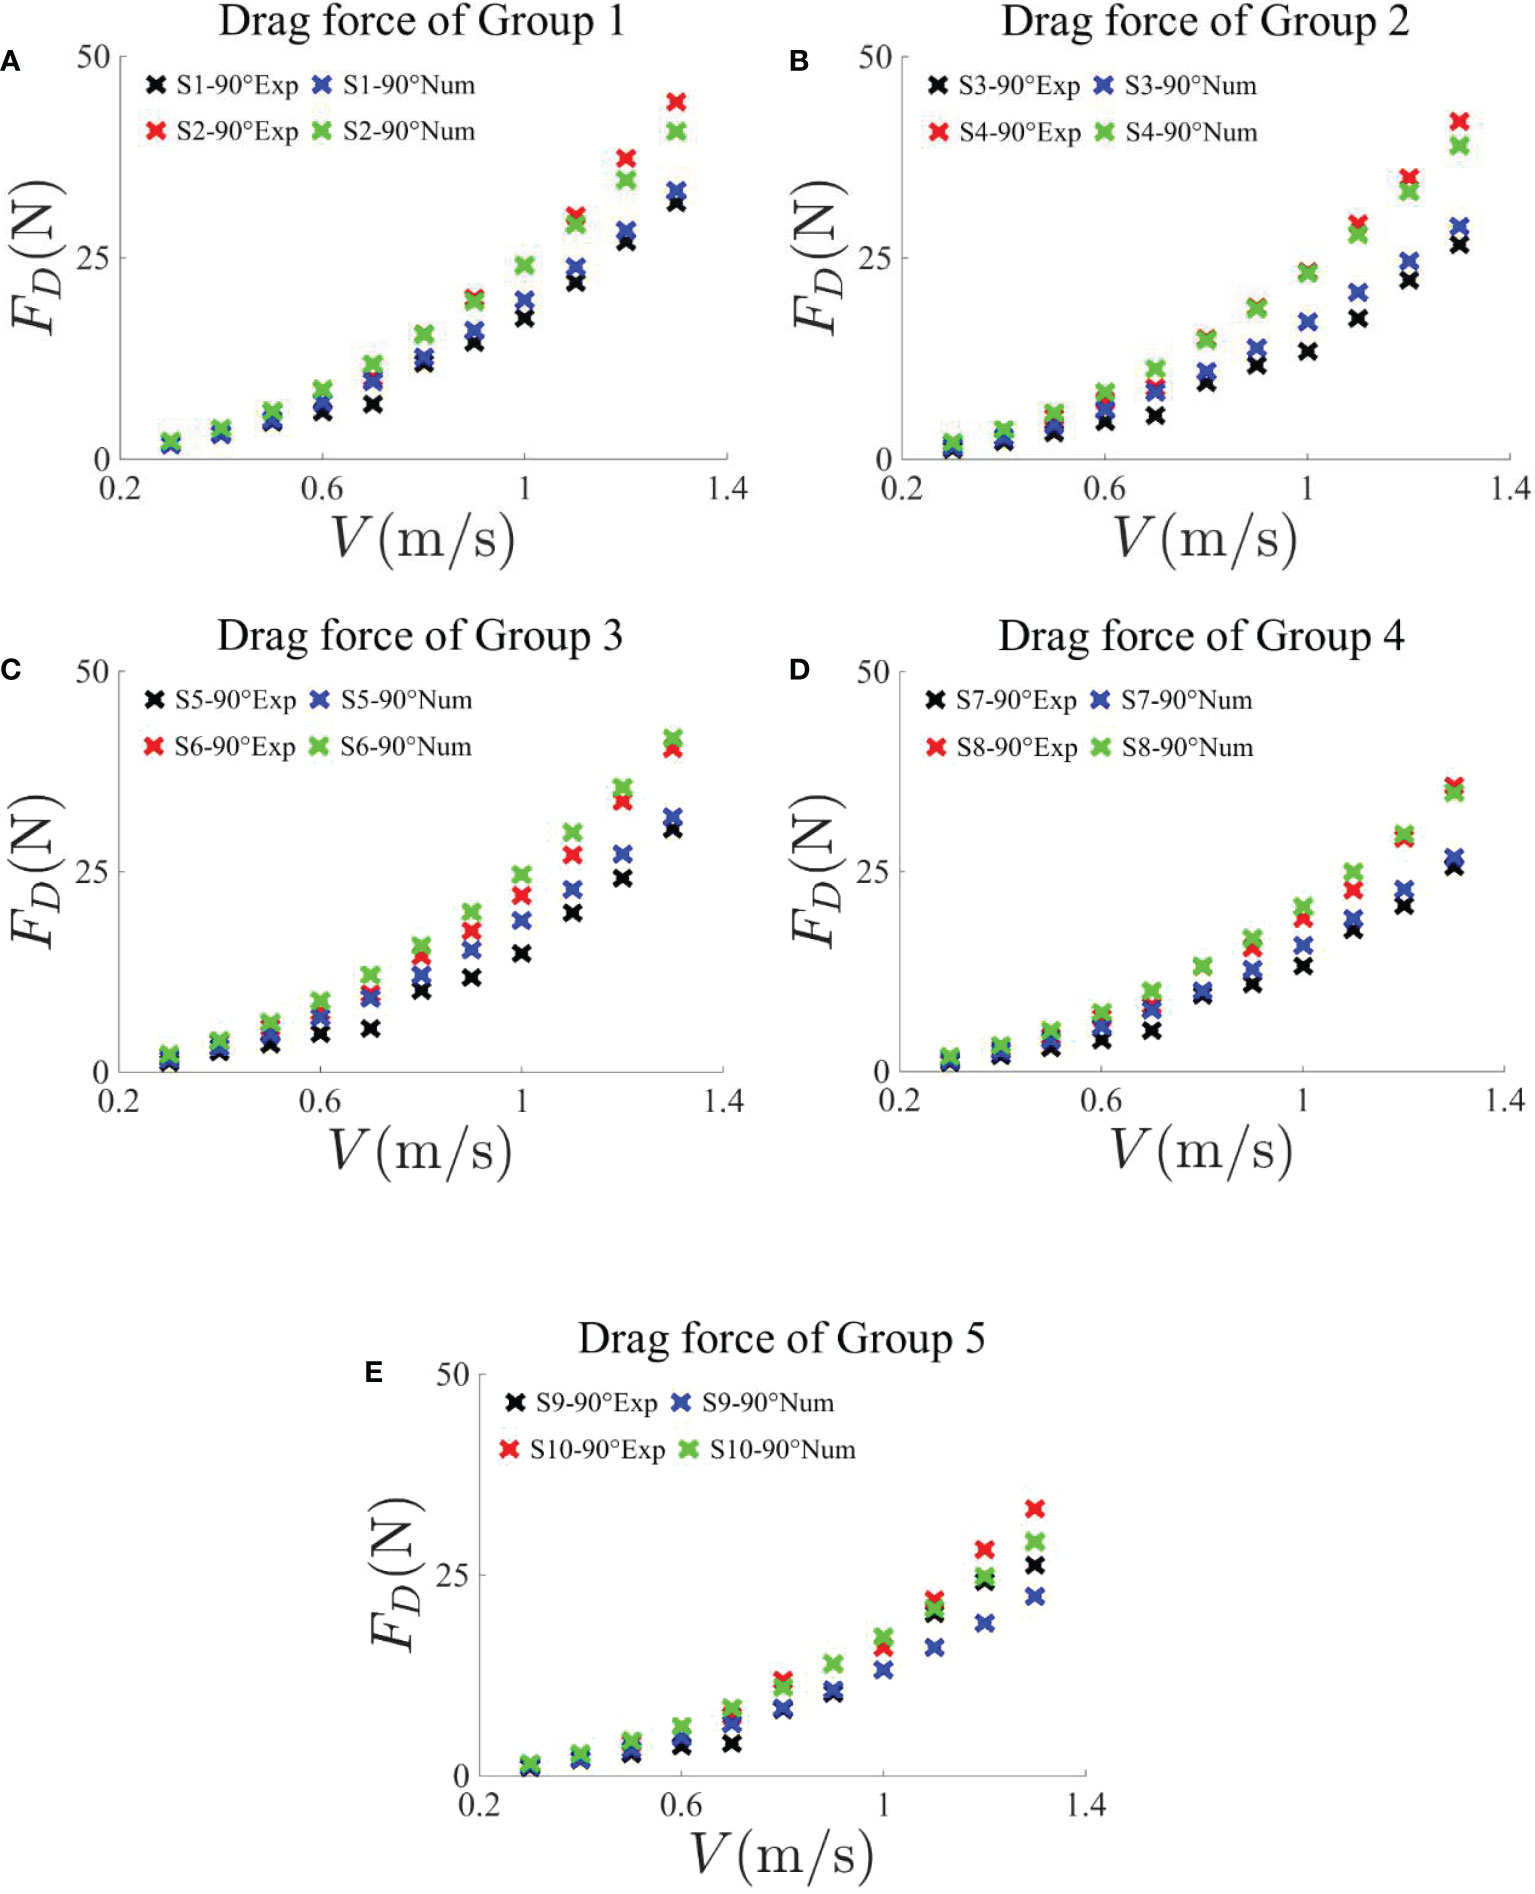
Figure 4 Comparisons of average drag force on net panels in groups 1–5 obtained by experiments and numerical simulations under an attack angle of 90°. The current velocities are in the range 0.3–1.3 m/s, with an interval of 0.1 m/s.
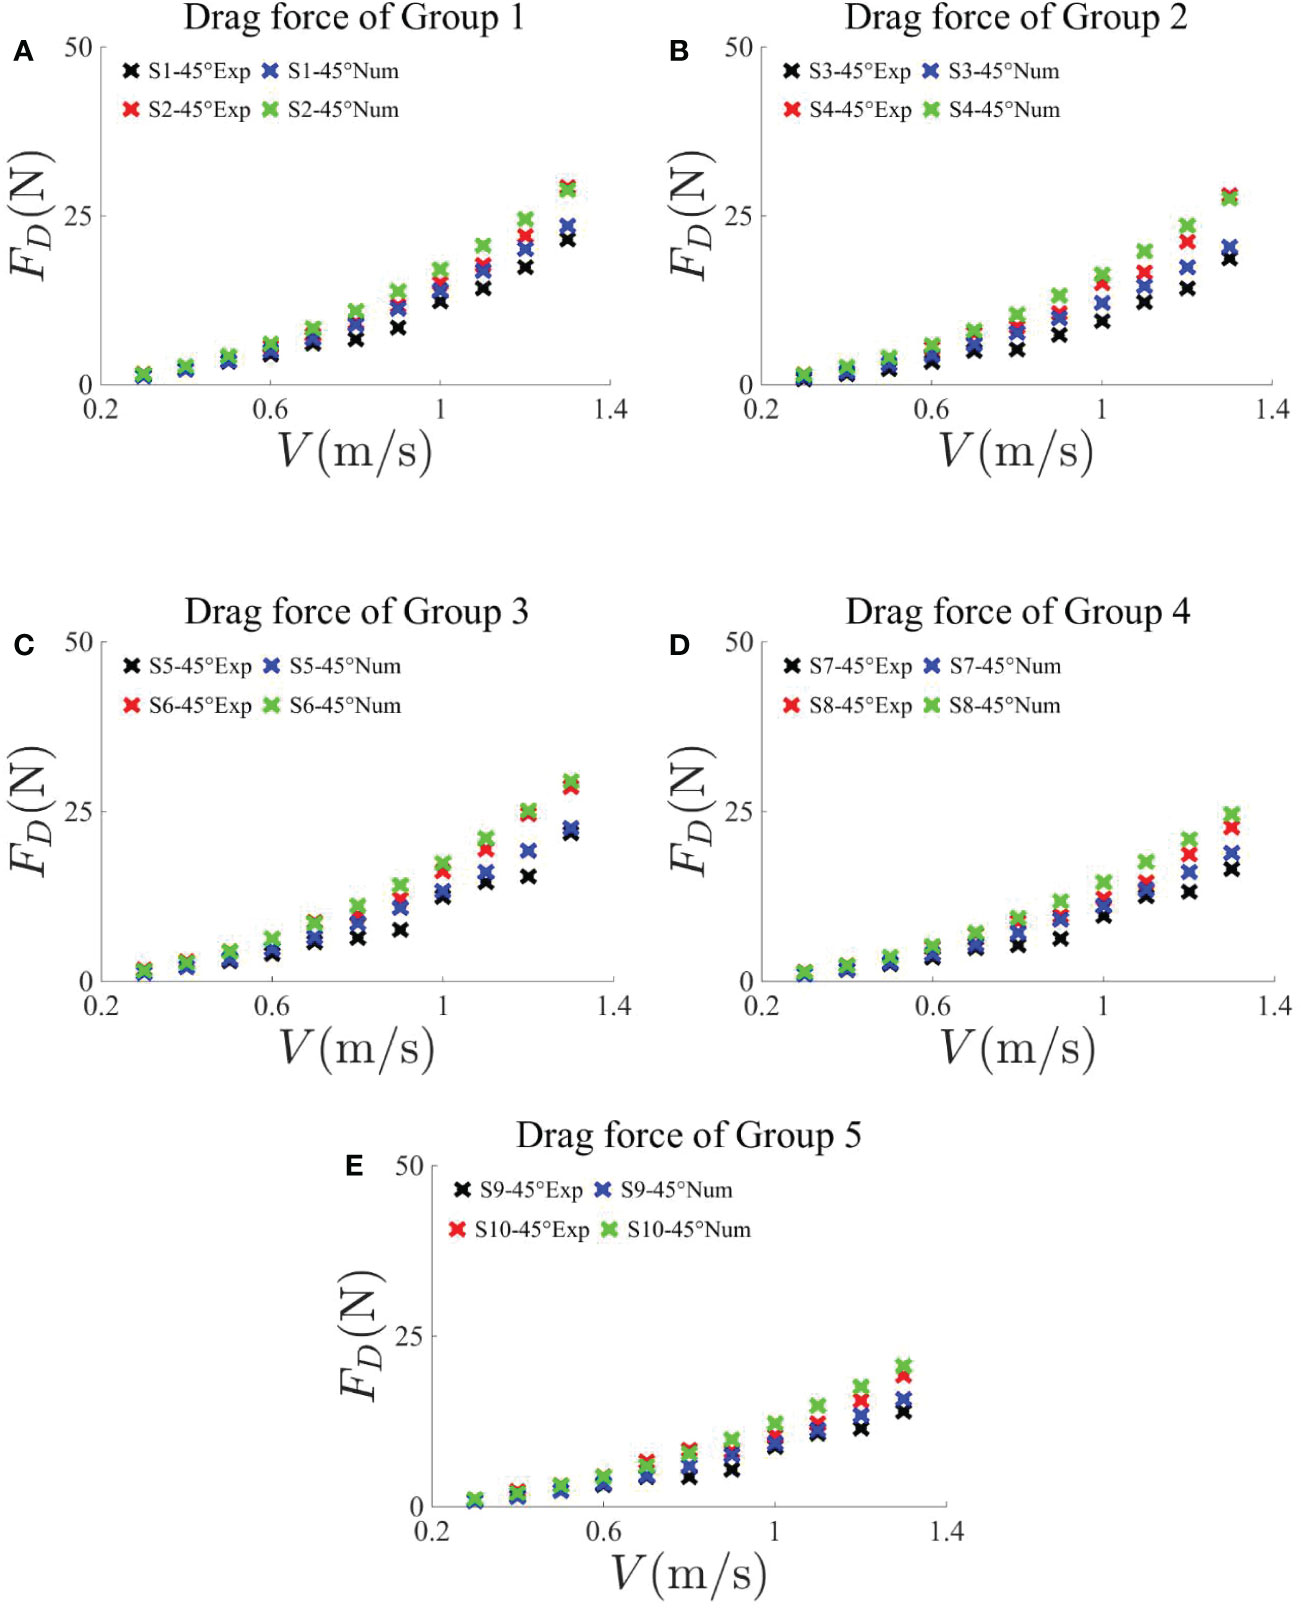
Figure 5 Comparisons of average drag force on net panels in Groups 1–5 obtained by experiments and numerical simulations under an attack angle of 45°. The current velocities are in the range 0.3–1.3 m/s, with an interval of 0.1 m/s.
3.2 Drag force under different attack angles
Figures 6A–J are the drag force comparisons of each net obtained by experiments and numerical simulations under 90° and 45° attack angles. The velocity is 0.3–1.3 m/s, and the interval is 0.1 m/s. It can be observed that the experimental average drag forces are in good agreement with the numerical results. By comparing the drag force in each group, it can be seen that, under the same attack angle and similar mesh size, the thicker the net twine, the greater the drag force, and it is more obvious under the attack angle of 90°. At the same time, with the increase of the current velocity, in terms of the degree of increase of the drag force from a thin twine net to a thick twine net, 90° attack angle is larger than 45° attack angle. In addition, since the projected area under 90° attack angle is larger than that at 45° attack angle, the drag values obtained by experiments and numerical simulations under 90° are both larger than that under 45°. At the same time, by comparing the values of drag force in Figure 6, it can be found through calculation that the drag force at 90° is basically times that at 45° because the projected area of the upstream at 90° is times that at 45°.
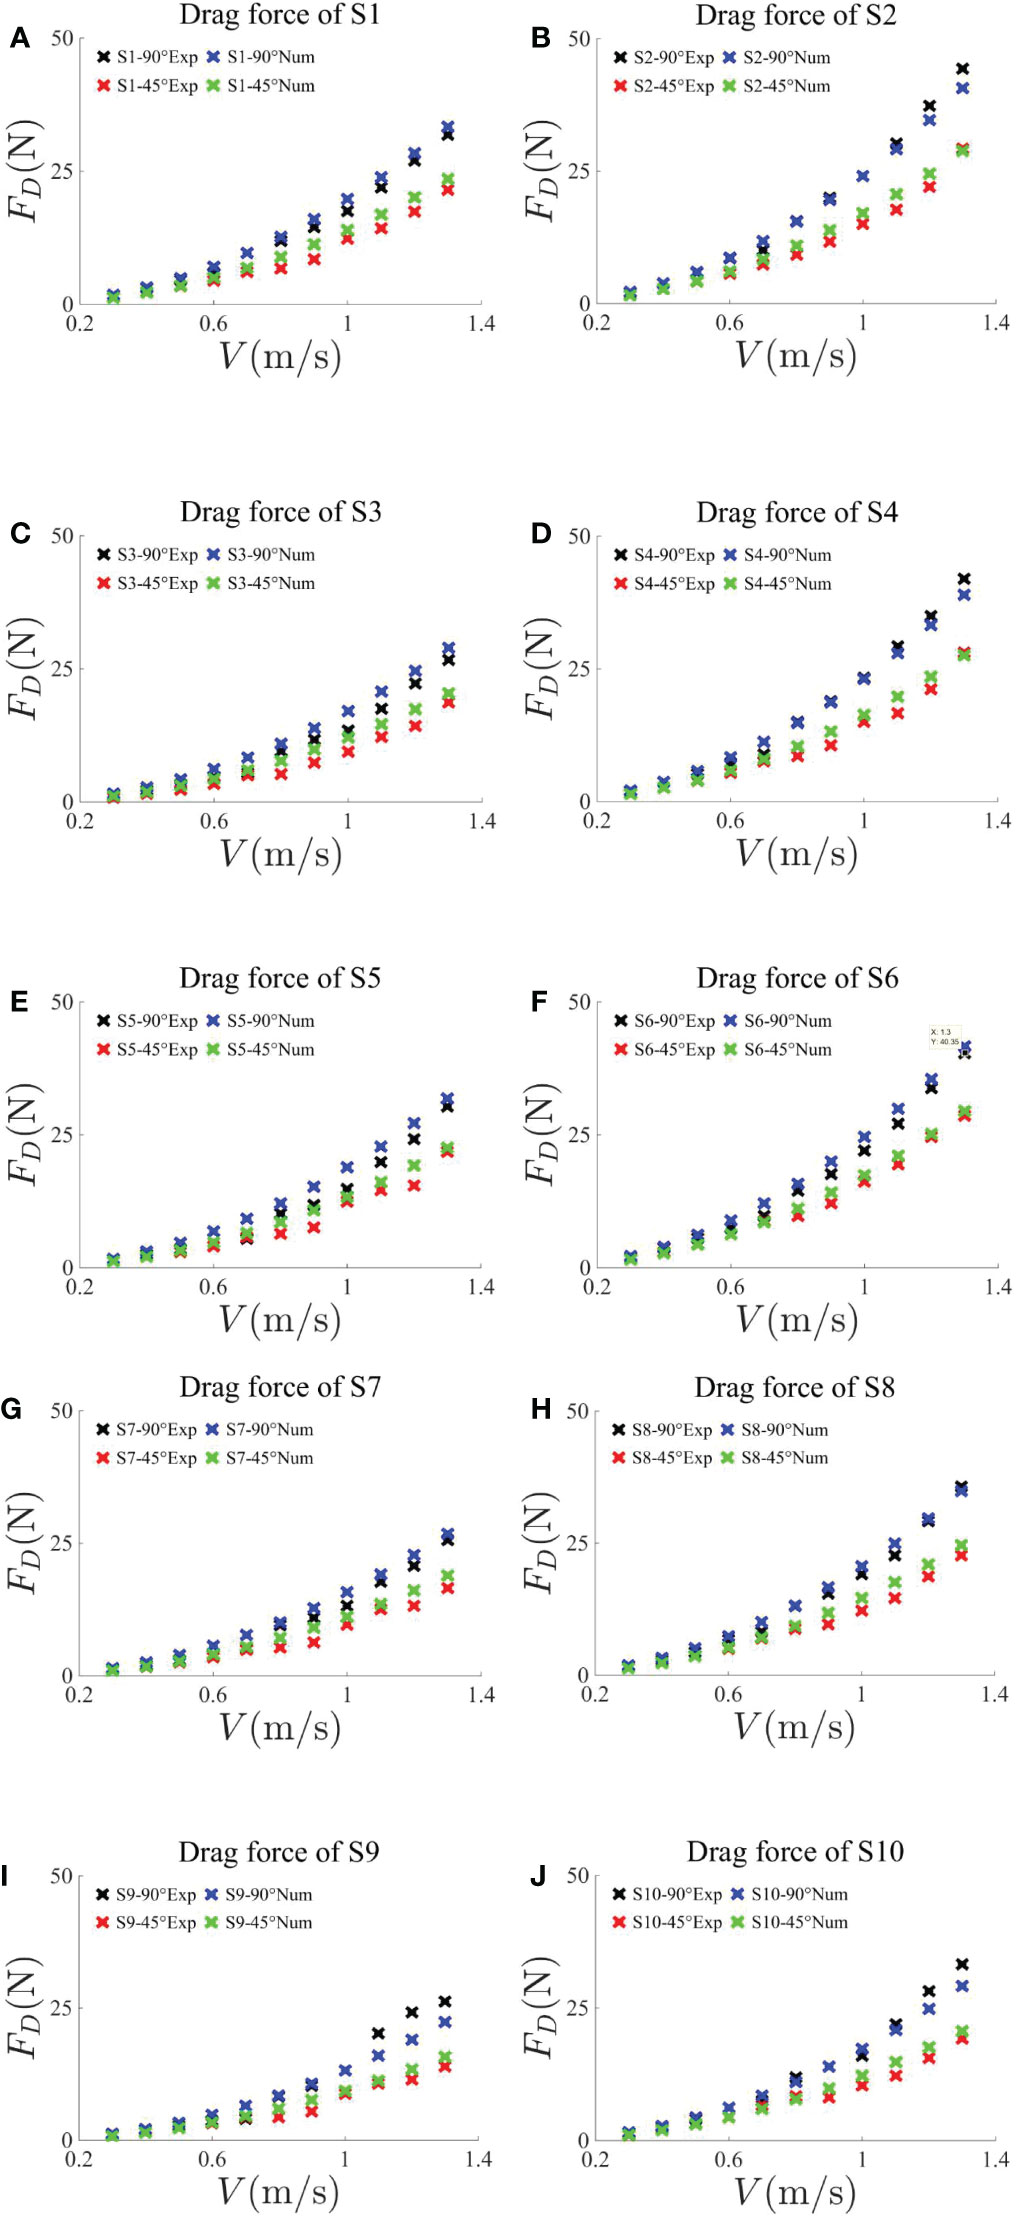
Figure 6 Comparisons of average drag force on net panels of group 1 (A) S1 and (B) S2, group 2 (C) S3 and (D) S4, group 3 (E) S5 and (F) S6, group 4 (G) S7 and (H) S8, and group 5 (I) S9 and (J) S10 with a similar mesh size obtained by experiments and numerical simulations under an attack angle of 90° and 45°, respectively. The current velocities are in the range 0.3–1.3 m/s, with an interval of 0.1 m/s.
3.3 Fitting formulae of the drag force
Figure 7 shows the fitting curve of experimental drag force with different solidity under different current velocities, where Figure 7A is attack angle of 90° and Figure 7B is attack angle of 45°. Comparing Figures 7A, B, we can see a similar trend of the fitting curve variations. Under the same current velocity, the drag force increases linearly with the increase of solidity, and this linear relationship is more stable when the current velocity is low. At the same time, when the current velocity increases, the slope of the fitting line increases. Under the attack angle of 90°, when the current velocity reaches above 1.1 m/s, the linear relationship starts to be unstable. This is due to the influence of nonlinear factors caused by large flow velocity. Compared with the condition at an attack angle of 90°, the linear relationship between drag force and solidity at an attack angle of 45° under the same current velocity is more stable. It can be speculated that the projection area of the net under the attack angle of 45° is smaller, and it is less affected by the nonlinear factors of extreme current velocity. The fitting formulas of drag force and solidity corresponding to different current velocities at 90° and 45° can be obtained from Figure 7, and the slope k is taken, as shown in Table 3.
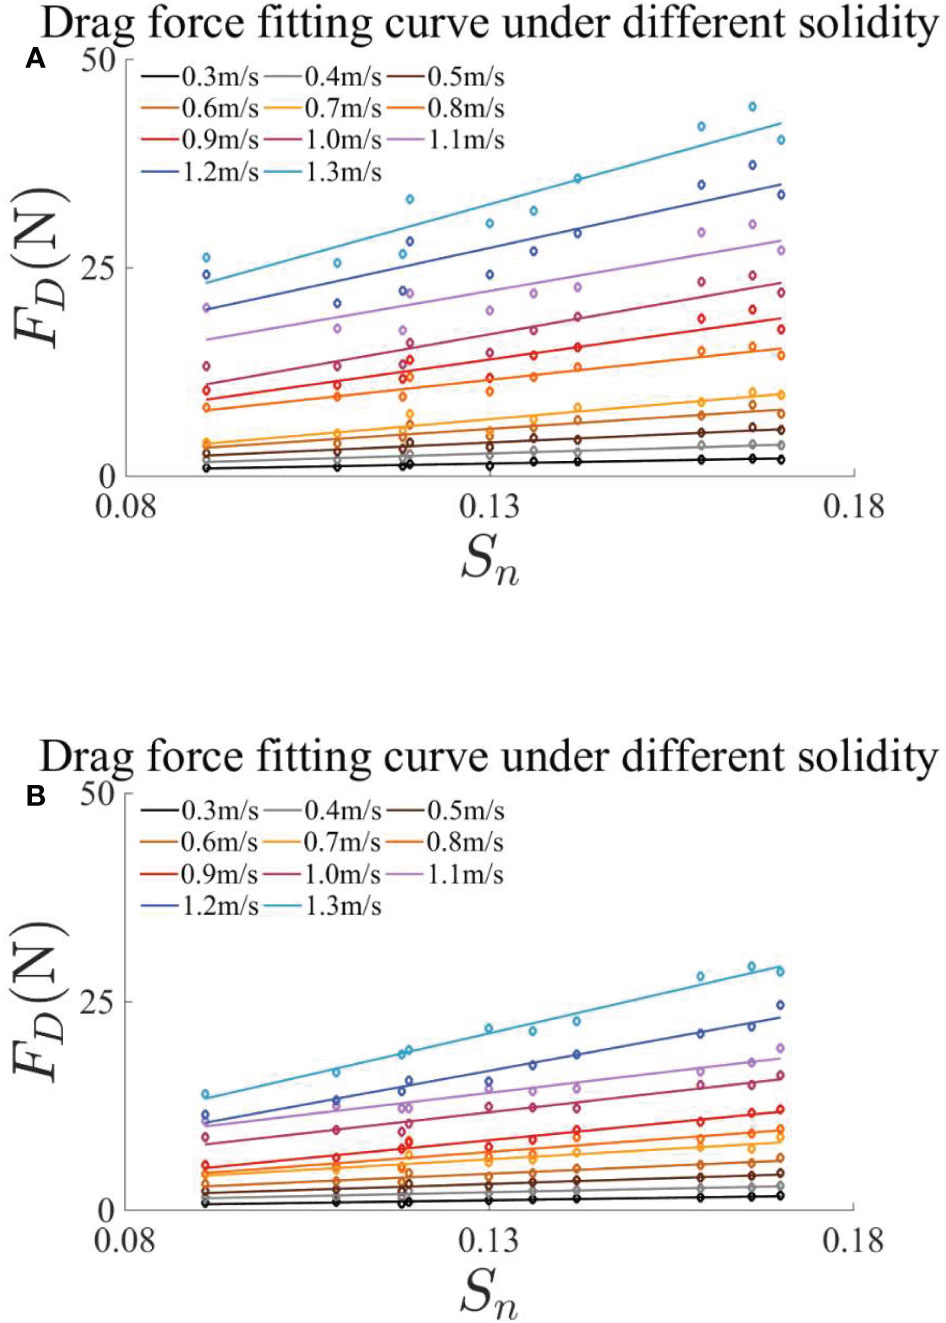
Figure 7 Fitting curves of drag force with different solidity values under an attack angle of (A) 90° and (B) 45°, respectively.
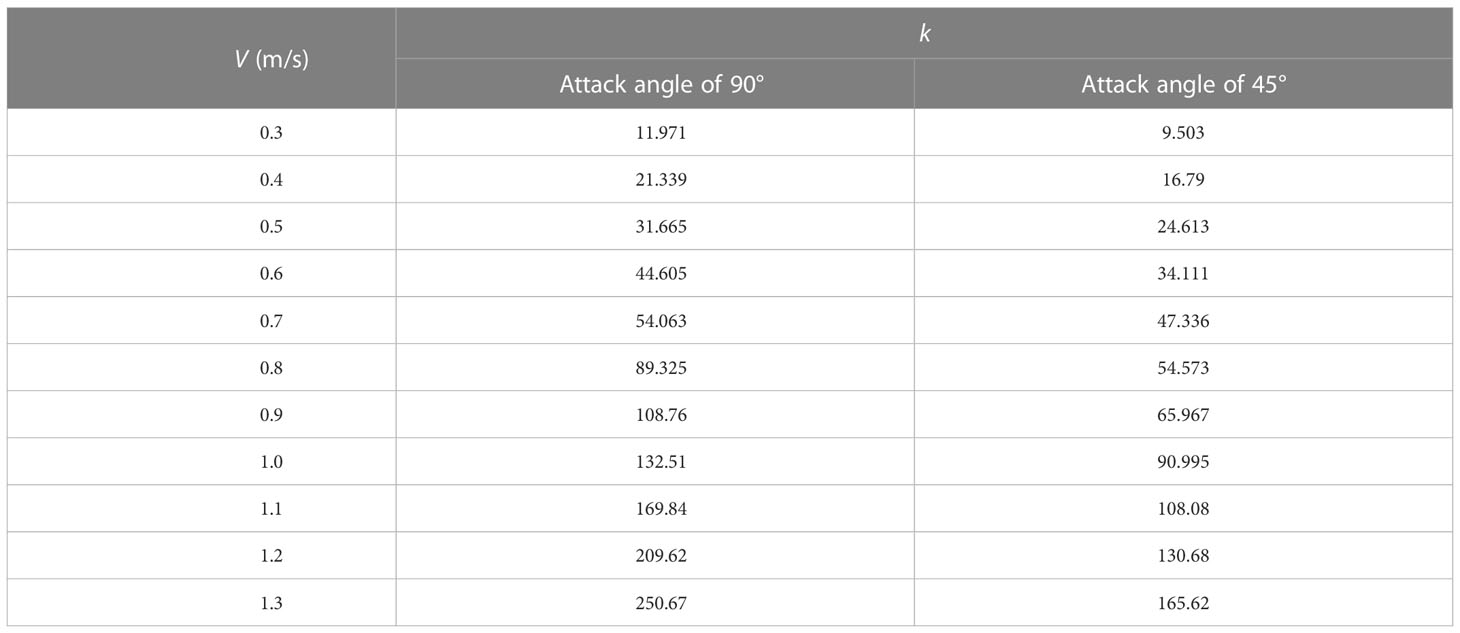
Table 3 Slope k of linear fitting formula corresponding to different current velocities at attack angles of 90° and 45°.
Figure 8 is the fitting curve of slope k under different current velocities in Table 3, where (A) is 90° attack angle and (B) is 45° attack angle. The relationship between the slope k and the current velocity is quadratic polynomial, and the increase of k at 90° attack angle is obviously greater than that at 45° attack angle, and under the same current velocity, the slope k at 90° is about times of 45°. The fitting curve formula of slope k and current velocity V can be obtained from Figure 8, namely:
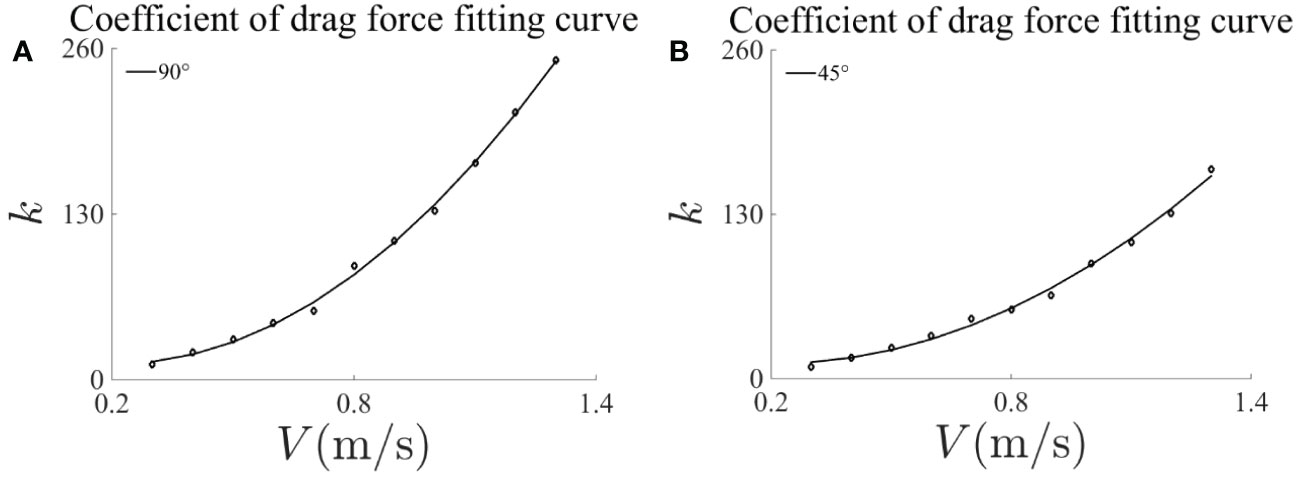
Figure 8 Coefficient of drag force fitting curve with different current velocities under an attack angle of (A) 90° and (B) 45°, respectively.
By combining Table 3 and Formula (5), we can get the relationship between the drag force of the net and current velocity, that is:
According to the empirical formulae for the drag coefficient of plane nets in a steady current established by Milne (1972) [Formula (7)] and Fridman and Danilov (1967) [formula (8)], the drag force of the rigid nets at the attack angle of 90° in this paper can be obtained.
Figures 9 and 10 illustrate the comparison of the drag force of S5, S6, S7, and S8 obtained by the empirical formula in this paper and by Milne (1972) as well as by Fridman and Danilov (1967) under different current velocities. The attack angle is 90° and 45°, respectively. Comparing Figures 9 and 10, it can be found that the drag force variation caused by the attack angle is consistent with the previous analysis. Moreover, it can be seen in Figures 9 and 10 that the drag force value calculated by the empirical formula in this paper is in good agreement with that calculated according to the drag force coefficient of previous scholars. The difference between the drag force of this paper and that of previous scholars is relatively large when the current velocity is large. On the one hand, this paper may focus on the nonlinear effect caused by the extreme current velocity. The current velocity and solidity are taken as the main variables of the empirical formula in this paper. On the other hand, there is a certain error between the practical current velocity and the designed current velocity mentioned previously, which leads to a certain error in the calculated drag force.
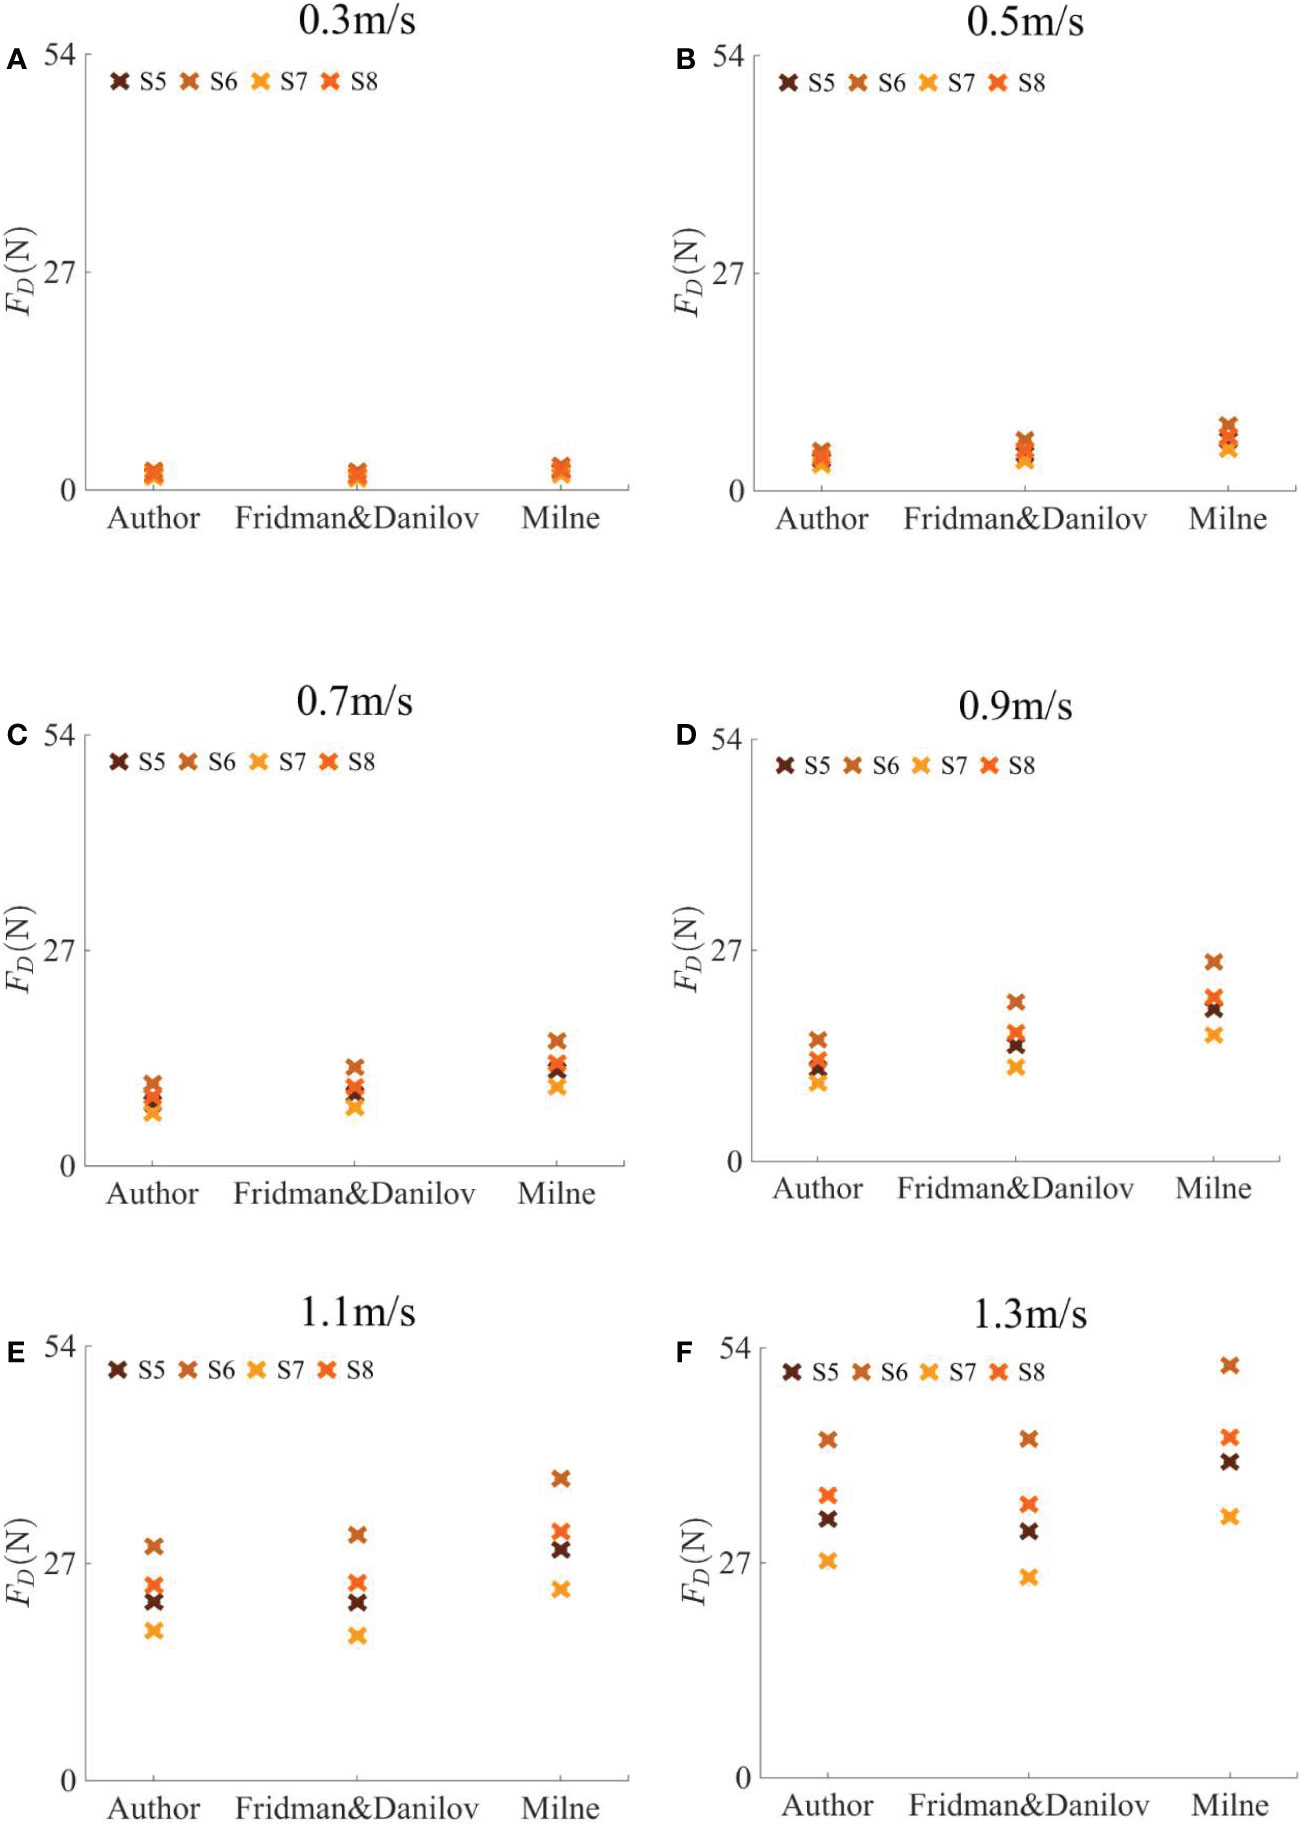
Figure 9 Comparisons of the drag force of S5, S6, S7 and S8 at the attack angle of 90°. The data are calculated by the empirical formula in this paper and by Milne (1972) as well as by Fridman and Danilov (1967) under different current velocities.
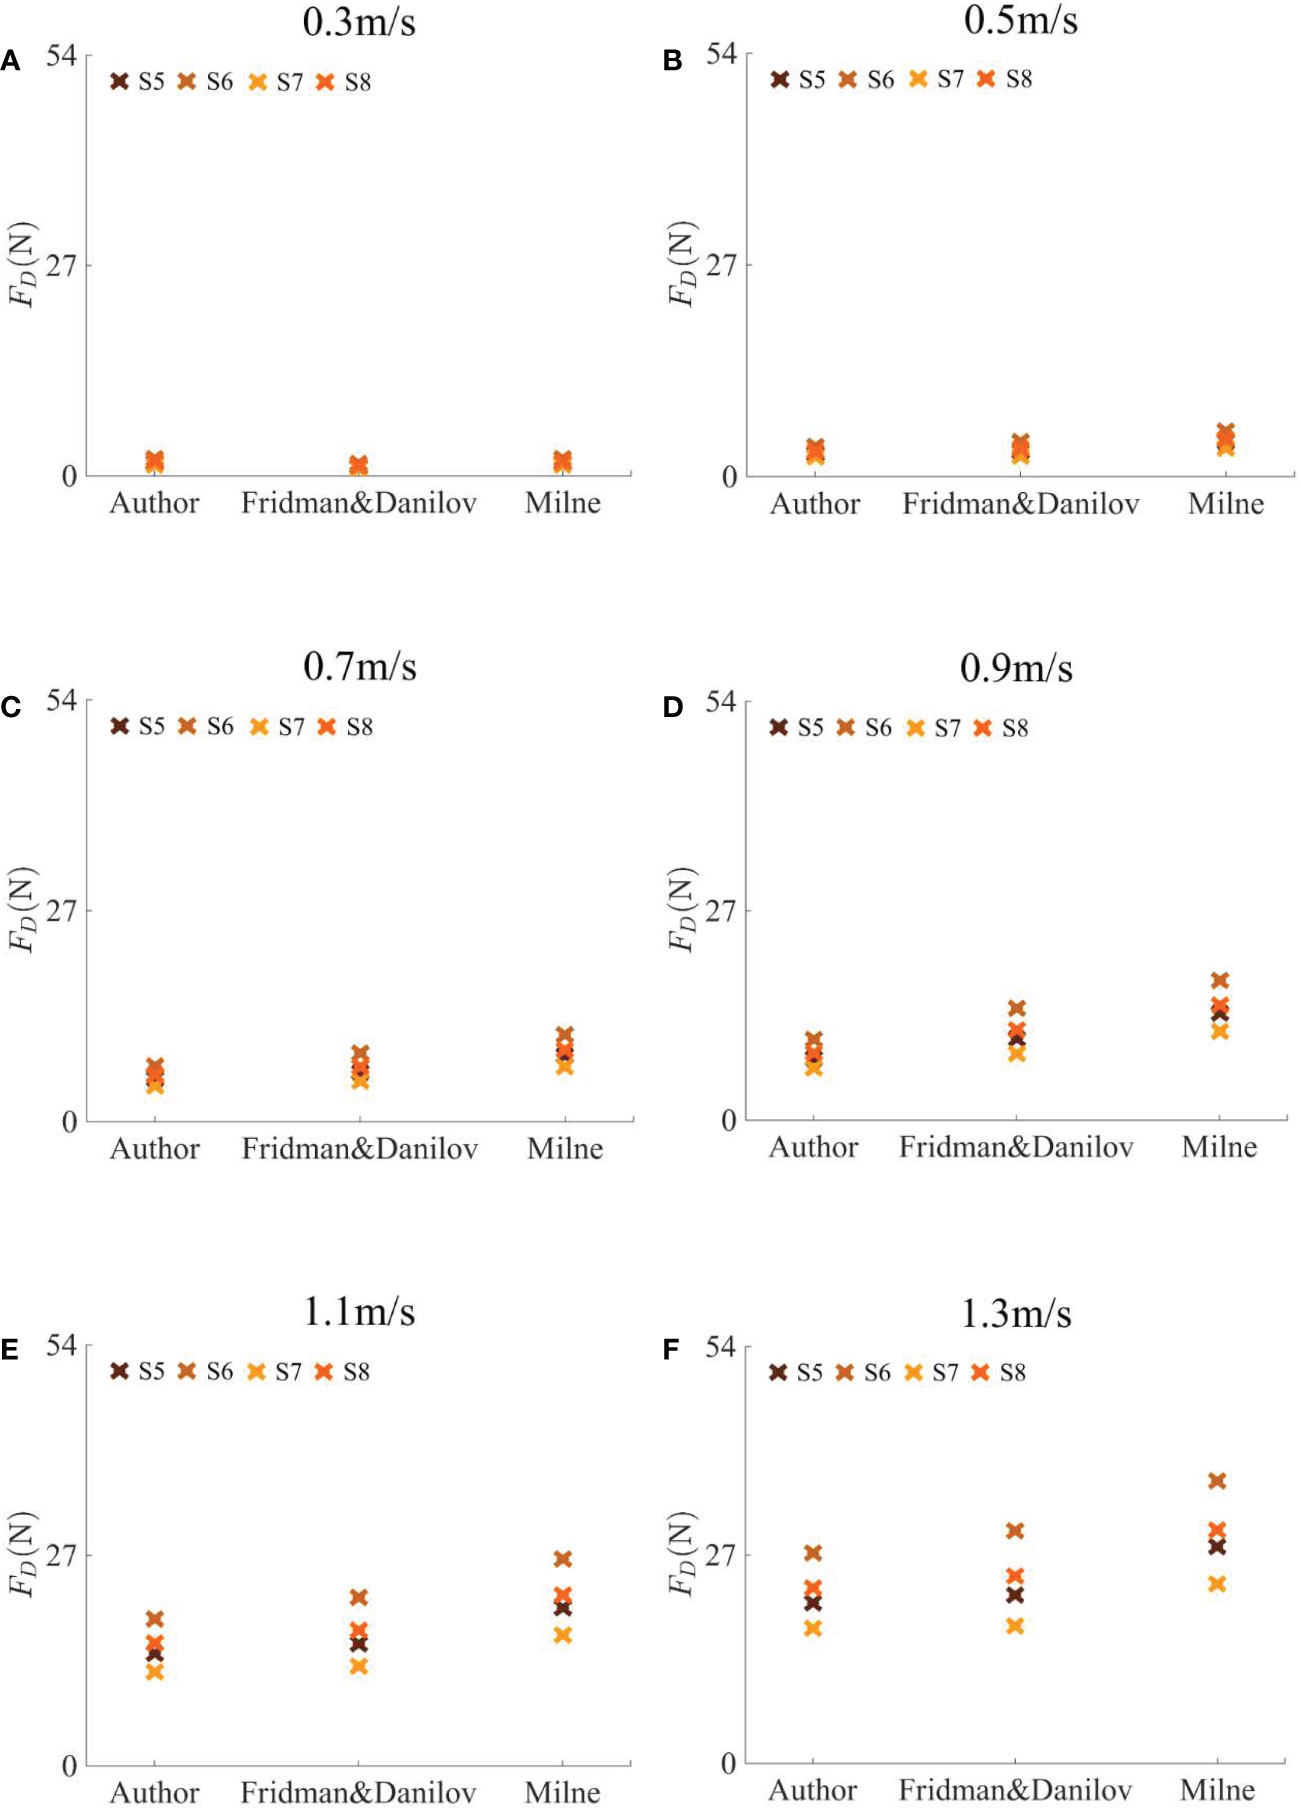
Figure 10 Comparisons of the drag force of S5, S6, S7 and S8 at the attack angle of 45°. The data are calculated by the empirical formula in this paper and by Milne (1972) as well as by Fridman and Danilov (1967) under different current velocities.
4 Conclusion
For the average drag force under different current velocities and attack angles, the experimental average drag forces are in good agreement with the numerical results. The relationship between the drag force of the net and the current velocity is quadratic polynomial. Under a similar mesh size, the thicker the net twine, the greater the drag force, and it is more obvious under the attack angle of 90°. The drag force at 90° is basically times that at 45° because of the projected area under different attack angles. The empirical formulae of the drag force on the net are given; the results were compared with the literatures and were found to be in good agreement.
In addition, the error between the numerical and experimental results is relatively large under the condition of large current velocity, and the experimental error comes from three probable aspects: (1) measurement error of the drag force on empty frame and the frame with net, (2) an acceleration in the velocity direction will be produced by the current when the current is passing through the net according to the continuity equation, that is, a force will be generated in the current direction. A force opposite to the current direction but with the same value will be generated on the net at this time according to Newton’s Third Law, which will be different from the numerical results, and (3) the certain error between the practical current velocity generated by the propeller and the designed current velocity. Finally, a moment will be generated by the weight coming from the stainless steel net at the attack angle of 45°. The impact of the moment acting on the force measuring balance is eliminated by balancing and zeroing step, which will result in errors.
Data availability statement
The original contributions presented in the study are included in the article/supplementary material. Further inquiries can be directed to the corresponding author.
Author contributions
SY: Physical model experiments, Validation, Investigation, Data curation and analysis. Writing - original draft. HQ: Supervision, Project administration. PL: Supervision, Project administration, Funding acquisition. FG: Physical model experiments. YT: Physical model experiments. All authors contributed to the article and approved the submitted version.
Funding
This work is financially supported by the National Natural Science Foundation of China (grant numbers 51909040 and 52231011). The Research Fund from Stable Supporting Fund of Science and Technology on Underwater Vehicle Technology (grant number JCKYS2022SXJQR-11), and the Key Technology Research and Development Program of Shandong (grant number 2020CXGC010702) are also greatly acknowledged.
Conflict of interest
The authors declare that the research was conducted in the absence of any commercial or financial relationships that could be construed as a potential conflict of interest.
Publisher’s note
All claims expressed in this article are solely those of the authors and do not necessarily represent those of their affiliated organizations, or those of the publisher, the editors and the reviewers. Any product that may be evaluated in this article, or claim that may be made by its manufacturer, is not guaranteed or endorsed by the publisher.
References
Balash C., Colbourne B., Bose N., Raman-Nair W. (2009). Aquaculture net drag force and added mass. Aquacultural Engineering. 41 (1), 14–21. doi: 10.1016/j.aquaeng.2009.04.003
Bi C. W., Zhao Y. P., Dong G. H., Xu T. J., Gui F. K. (2013). Experimental investigation of the reduction in flow velocity downstream from a fishing net. Aquacultural Engineering. 57, 71–81. doi: 10.1016/j.aquaeng.2013.08.002
Bi C. W., Zhao Y. P., Dong G. H., Xu T. J., Gui F. K.. (2014). Numerical simulation of the interaction between flow and flexible nets. J. Fluids Structures. 45, 180–201. doi: 10.1016/j.jfluidstructs.2013.11.015
Cha B. J., Kim H. Y., Bae J. H., Yang Y. S., Kim D. H.. (2013). Analysis of the hydrodynamic characteristics of chain-link woven copper alloy nets for fish cages. Aquacultural Engineering. 56, 79–85. doi: 10.1016/j.aquaeng.2013.05.002
Cheng H., Li L., Aarsæther K. G., Ong M. C.. (2020). Typical hydrodynamic models for aquaculture nets: A comparative study under pure current conditions. Aquacultural Engineering. 90, 102070. doi: 10.1016/j.aquaeng.2020.102070
Costa-Pierce B. A., Bridger C. J. (2002). The role of marine aquaculture facilities as habitats and ecosystems. Responsible Mar. aquaculture., 105–144. doi: 10.1079/9780851996042.0105
Dong G. H., Tang M. F., Xu T. J., Bi C. W., Guo W. J.. (2019). Experimental analysis of the hydrodynamic force on the net panel in wave. Appl. Ocean Res. 87, 233–246. doi: 10.1016/j.apor.2019.04.005
Endresen P. C., Føre H. M. (2022). Numerical Modelling of Drag and Lift Forces on Aquaculture Nets: Comparing New Numerical Load Model with Physical Model Test Results. Proceedings of the ASME 2022 41st International Conference on Ocean, Offshore and Arctic Engineering. Volume 4: Ocean Space Utilization. Hamburg, Germany. V004T05A002. ASME.
Fredriksson D. W., Swift M. R., Irish J. D., Tsukrov I., Celikkol B.. (2003). Fish cage and mooring system dynamics using physical and numerical models with field measurements. Aquacultural Engineering. 27 (2), 117–146. doi: 10.1016/S0144-8609(02)00043-2
Fridman A. L., Danilov Y. A. (1967). Ob osobennostyah soprotivleniya rybolovnoi seti. Rybolovnoe Hozyajstvo 6, 38–40.
Klebert P., Lader P., Gansel L., Oppedal F.. (2013). Hydrodynamic interactions on net panel and aquaculture fish cages: A review. Ocean Engineering. 58 (4), 260–274. doi: 10.1016/j.oceaneng.2012.11.006
Klebert P., Patursson Ø., Endresen P. C., Rundtop P., Birkevold J., Rasmussenb H. W.. (2015). Three-dimensional deformation of a large circular flexible sea cage in high currents: field experiment and modeling. Ocean Engineering. 104, 511–520. doi: 10.1016/j.oceaneng.2015.04.045
Kristiansen T., Faltinsen O. M. (2012). Modelling of current loads on aquaculture net cages. J. Fluids Structures. 34, 218–235. doi: 10.1016/j.jfluidstructs.2012.04.001
Løland G. (1993). Current forces on, and water flow through and around, floating fish farms. Aquaculture Int. 1 (1), 72–89. doi: 10.1007/BF00692665
Lader P., Dempster T., Fredheim A., Jensen Ø.. (2008). Current induced net deformations in full-scale sea-cages for Atlantic salmon (Salmo salar). Aquacultural Engineering. 38 (1), 52–65. doi: 10.1016/j.aquaeng.2007.11.001
Lader P. F., Enerhaug B., Fredheim A., Krokstad J.. (2003) in 3rd International Conference on Hydroelasticity in Marine Technology. 19–26 (The University of Oxford Oxford, UK: Department of Engineering Science).
Li L., Jiang Z. Y., Ong M. C., Hu W. F.. (2019). Design optimization of mooring system: an application to a vessel-shaped offshore fish farm. Eng. Structures. 197, 109363. doi: 10.1016/j.engstruct.2019.109363
Li Y. C., Zhao Y. P., Gui F. K., Teng B.. (2006). Numerical simulation of the hydrodynamic behaviour of submerged plane nets in current. Ocean Engineering. 33 (17-18), 2352–2368. doi: 10.1016/j.oceaneng.2005.11.013
Milne P. H. (1972). “Fish and shellfish farming in coastal waters,” in Fishing news (Books) (London: UNIPub).
Niño Y., Vidal K., Tamburrino A., Zamorano L., Beltrán J. F., Estay G., et al. (2020). Normal and tangential drag forces of nylon nets, clean and with fouling, in fish farming. Exp. Study. Water. 12 (8), 2238. doi: 10.3390/w12082238
Patursson Ø., Swift M. R., Tsukrov I., Simonsen K., Baldwin K., Fredriksson D. W., et al. (2010). Development of a porous media model with application to flow through and around a net panel. Ocean Engineering. 37 (2-3), 314–324. doi: 10.1016/j.oceaneng.2009.10.001
Santo H. (2022). On the application of current blockage model to steady drag force on fish net. Aquacultural Engineering. 97, 102226. doi: 10.1016/j.aquaeng.2022.102226
Shimizu H., Mizukami Y., Kitazawa D. (2018). Experimental study of the drag on fine-mesh netting. Aquacultural Engineering. 81, 101–106. doi: 10.1016/j.aquaeng.2018.03.005
Tang H., Hu F. X., Xu L. X., Dong S. C., Zhou C., Wang X. F.. (2017). The effect of netting solidity ratio and inclined angle on the hydrodynamic characteristics of knotless polyethylene netting. J. Ocean Univ. China. 16 (5), 814–822. doi: 10.1007/s11802-017-3227-6
Tang H., Hu F. X., Xu L. X., Dong S. C., Zhou C., Wang X. F.. (2019). Variations in hydrodynamic characteristics of netting panels with various twine materials, knot types, and weave patterns at small attack angles. Sci. Rep. 9 (1), 1–13. doi: 10.1038/s41598-018-35907-1
Tsukrov I., Drach A., DeCew J., Swift M. B., Celikkol B.. (2011). Characterization of geometry and normal drag coefficients of copper nets. Ocean Engineering. 38 (17-18), 1979–1988. doi: 10.1016/j.oceaneng.2011.09.019
Tsukrov I., Eroshkin O., Fredriksson D., Swift M. B., Celikkol B.. (2003). Finite element modeling of net panels using a consistent net element. Ocean Engineering. 30 (2), 251–270. doi: 10.1016/S0029-8018(02)00021-5
Wang G., Martin T., Huang L. Y., Bihs H.. (2021). Modelling the flow around and wake behind net panels using large eddy simulations. Ocean Engineering. 239, 109846. doi: 10.1016/j.oceaneng.2021.109846
Wang G., Martin T., Huang L. Y., Bihs H.. (2022a). An improved screen force model based on CFD simulations of the hydrodynamic loads on knotless net panels. Appl. Ocean Res. 118, 102965. doi: 10.1016/j.apor.2021.102965
Wang G., Martin T., Huang L. Y., Bihs H.. (2022b). Modeling the flow around and the hydrodynamic drag on net meshes using REEF3D. J. Offshore Mechanics Arctic Engineering. 144 (1), 011902. doi: 10.1115/1.4051408
Xu Z. J., Qin H. D. (2020). Fluid-structure interactions of cage based aquaculture: From structures to organisms. Ocean Engineering. 217, 107961. doi: 10.1016/j.oceaneng.2020.107961
Yu S. C., Qin H. D., Li P., Xu Z. J.. (2021). Nonlinear vertical accelerations and mooring loads of a semi-submersible offshore fish farm under extreme conditions. Aquacultural Engineering. 95, 102193. doi: 10.1016/j.aquaeng.2021.102193
Zhan J. M., Jia X. P., Li Y. S., Sun M. G., Guo G. X., Hu Y. Z.. (2006). Analytical and experimental investigation of drag on nets of fish cages. Aquacultural engineering. 35 (1), 91–101. doi: 10.1016/j.aquaeng.2005.08.013
Zhao Y. P., Bi C. W., Dong G. H., Gui F. K., Cui Y., Guan C. T., et al (2013). Numerical simulation of the flow around fishing plane nets using the porous media model. Ocean Engineering. 62, 25–37. doi: 10.1016/j.oceaneng.2013.01.009
Zhou C., Xu L. X., Hu F. X., Qu X. Y.. (2015). Hydrodynamic characteristics of knotless nylon netting normal to free stream and effect of inclination. Ocean Engineering. 110, 89–97. doi: 10.1016/j.oceaneng.2015.09.043
Keywords: practical net, drag force, attack angle, empirical formula, current velocity
Citation: Yu S, Qin H, Li P, Gong F and Tian Y (2023) Experimental study on drag characteristics of the practical rigid net under different current conditions. Front. Mar. Sci. 10:1134278. doi: 10.3389/fmars.2023.1134278
Received: 30 December 2022; Accepted: 20 January 2023;
Published: 07 February 2023.
Edited by:
Zhao Yunpeng, Dalian University of Technology, ChinaReviewed by:
Binzhen Zhou, South China University of Technology, ChinaHung-Jie Tang, National Cheng Kung University, Taiwan
Copyright © 2023 Yu, Qin, Li, Gong and Tian. This is an open-access article distributed under the terms of the Creative Commons Attribution License (CC BY). The use, distribution or reproduction in other forums is permitted, provided the original author(s) and the copyright owner(s) are credited and that the original publication in this journal is cited, in accordance with accepted academic practice. No use, distribution or reproduction is permitted which does not comply with these terms.
*Correspondence: Peng Li, cGVuZy5saUBocmJldS5lZHUuY24=