Abstract
This paper investigates the effects of the cutoff wall on the fate of nitrate (NO3-), the NO3- removal rate, and the salinity distribution in a coastal aquifer under tidal action. A numerical study was performed based on a coupled model with variable-saturation and variable-density flow and a convection-diffusion-reaction equation for solute transport in a coastal unconfined aquifer. The results showed that the cutoff wall led to a larger upper salinity plume (USP) and that the saltwater wedge (SW) further retreated seaward. The recirculation pathways of saltwater and groundwater were largely modified by the wall. The cutoff wall within the tidal range could increase the NO3- mass of denitrification and the NO3- removal efficiency and decrease the length of the SW and the freshwater flux. This modification of the saltwater and groundwater recirculation pathways was enhanced with increasing wall depth. A deeper cutoff wall led to a further retreated SW, lower freshwater flux, and greater improvements in the NO3- mass of denitrification and the NO3- removal efficiency. In addition, the cutoff wall significantly decreased the terrestrial dissolved organic carbon (TDOC) discharge into the sea. Dissolved organic carbon source (SDOC) promoted a higher NO3- removal efficiency. This study provides us with a better understanding of coastal physical-biogeochemical processes and dynamic mechanisms, as well as a guide for designing engineering measures to mitigate NO3- contamination and thus enhance groundwater quality management.
1 Introduction
Saltwater intrusion (SWI, the movement of saltwater into coastal freshwater aquifers) is a phenomenon that occurs worldwide, affecting industrial and agricultural productivity in coastal wetlands (Chmura et al., 2003; Zhang et al., 2019; Fang et al., 2022). Recently, the reduction in aquifer recharge and over-abstraction of groundwater have lowered the freshwater hydraulic head, which could result in the saline front advancing inland (Van Weert et al., 2009). In addition, the World Health Organization (WHO) and various countries have established drinking water standards with a maximum NO3- concentration of 11.3 mg L-1, but since the 1960s, a high degree of NO3- pollution in groundwater has been reported in most parts of the world (such as the United States (Burow et al., 2010), Africa, (Kringel et al., 2016), and China, (Lu et al., 2019)). With most of the world’s population living in coastal zones, the challenges include freshwater development optimization and NO3- contamination mitigation.
To protect groundwater resources, studies have verified a series of measures, including reducing groundwater extraction (artificial replenishment of freshwater via injection wells) and inhibiting saltwater inflow (extracting saltwater and constructing subsurface barriers) (Luyun et al., 2009; Botero-Acosta and Donado, 2015; Christy and Lakshmanan, 2017; Lu et al., 2017). Previous studies have shown that subsurface barriers are an effective solution to SWI problems in coastal aquifers, and they are widely used in coastal areas worldwide (Chang et al., 2019; Yang et al., 2021; Zheng et al., 2021; Fang et al., 2022; Zheng et al., 2022). Subsurface barriers are constructed by injecting impervious materials into underground aquifers (Abdoulhalik et al., 2017). To date, there are three main forms (Kaleris and Ziogas, 2013): (i) the subsurface dam, which provides an opening at the upper part of the aquifer for groundwater discharge (Figure 1B); (ii) the cutoff wall, which leaves an opening at the bottom of the aquifer for groundwater discharge (Figure 1C); and (iii) the semipermeable cutoff wall, which extends from top to bottom of the aquifer. Among these three forms, the cutoff wall is the most widely used worldwide (Luyun et al., 2009; Abdoulhalik et al., 2017).
Figure 1

(A) Conceptual diagram of the numerical model domain, parameters and boundary condition, the tide range, groundwater flow, and salinity distribution in a nearshore aquifer under tide conditions. The upper saline plume (USP) and the saltwater wedge (SW), the cutoff wall, and the freshwater-saltwater mixing zone are shown. (B, C) are schematics of a subsurface dam (B) and a cutoff wall (C) on saltwater intrusion prevention in coastal aquifers under static sea boundary conditions.
NO3- pollution in groundwater has attracted worldwide attention (Jang et al., 2017) and plays a key role in maintaining ecosystem diversity and coastal productivity. The tide enhances the biogeochemical activity of nutrients (Charbonnier et al., 2013; Heiss and Michael, 2014; Geng et al., 2020), such as dissolved organic carbon (DOC) degradation, aerobic respiration, nitrification, and denitrification (Li et al., 2017; Li et al., 2018; Sun et al., 2019; Gao et al., 2023). These series of chemical reactions affect aquifer NO3- pollutant distribution. Previous studies on contaminant transport in coastal aquifers have been conducted through laboratory experiments (Jang et al., 2017; Li et al., 2017; Li et al., 2018; Fang et al., 2022) and numerical simulations (Shammas and Thunvik, 2009; Sun et al., 2019; Gao et al., 2023). They have illustrated the control of variable-density flow, sea-level rise, and aquifer heterogeneity on the contaminant transport process. Yoshimoto et al. (2013) reported that the NO3- concentration in groundwater could significantly increase after cutoff wall construction. Knights et al. (2017) studied the impact of tidal fluctuation on riverbed denitrification by combining a one-dimensional (1-D) numerical model and field observations. The results showed that tidal fluctuation slightly impacts the removal of NO3- in surface water, but it can remove most nitrogen nutrients in groundwater. Further analysis showed that increasing the tidal amplitude and the permeability coefficient of riverbed sediment could reduce the denitrification rate. Shuai et al. (2017) investigated whether river level fluctuation can greatly improve NO3- removal, increasing the water fluctuation amplitude and soil permeability coefficient. After wall construction, Sun et al. (2019) conducted laboratory experiments and numerical simulation investigations of the spatial distribution of NO3- to prevent SWI and NO3- pollution. The results indicated that the NO3-contaminated area depended on the wall height. However, their results were limited to the scale of the laboratory, and they ignored the influence of denitrification, thus overestimating NO3- contamination in the field observations. Sun et al. (2021) conducted numerical simulation investigations of the mechanisms and influences of subsurface dams and cutoff walls on SWI and NO3- pollution. They found that a constructed physical barrier could reduce NO3- discharge and accumulation in upstream aquifers and concluded that the NO3- accumulated area depended on the barrier height and location. Fang et al. (2022) combined the effect of tides and examined subsurface dams in regard to NO3- pollution in upstream groundwater via laboratory experiments and numerical simulations. Their results revealed that the difference in the extent of NO3- contamination was related to the temporal pollution behavior. Overall, previous studies have found that the construction of cutoff walls influences the extent of SWI and the NO3- concentration inland in groundwater. However, most studies were conducted under static sea boundary conditions or simply without considering the kinetics of NO3-. At present, under the action of tides, the effect of cutoff walls on the fate of NO3- and the salinity distribution in the intertidal zone has not been explored.
Hence, in our study, we aimed to (1) determine the combined effects of the cutoff wall and tidal action on the fate of NO3-, the NO3- removal rate, and the salinity distribution; (2) evaluate the effects of the cutoff wall location and depth on NO3- contamination; (3) investigate the influence of the cutoff wall on NO3- contamination under sea-terrestrial nutrient interaction; and (4) evaluate the impact of DOC on NO3- contamination in aquifers. A transport and reaction model with variable-density flow based on COMSOL was applied to investigate the impact of the cutoff wall on the fate of NO3-, the NO3- removal rate, and the salinity distribution under tidal action. Two numerical studies with and without cutoff walls were performed to validate the model’s effectiveness. Subsequently, the model was used to predict NO3- contamination under various conditions.
2 Methodology
2.1 Numerical model setup
Figure 1A shows the geometry of the 2-D vertical section of the aquifer, where the inland boundary (DE) was considered freshwater and exhibited a fixed water table, and the ocean boundary on the left side (AB) was assumed to indicate a constant saltwater concentration Csea = 3500 mg/L. Constant dissolved organic carbon (DOC), dissolved oxygen (DO), NO3-, and ammonium (NH4+) concentrations were assumed at the ocean boundary, and the specific concentration values are shown in Table 1. The hydraulic head varies over time under tidal action. In this study, we considered a simple sinusoidal tide as follows:
Table 1
| Model parameters | |||
|---|---|---|---|
| Parameter | Description | Value | Units |
| Boundary condition | |||
| NO3- | NO3- boundary concentration | 0.25a,b (0.179)c | mM |
| NH4+ | NH4+ boundary concentration | 0.2a,b (-) | mM |
| DO | DO boundary concentration | 0.2a,b (0.177)c | mM |
| DOC | DOC boundary concentration | 0.75a,b (0.066)c | mM |
| Kinetic parameter | |||
| KDOC | Rate constant for degradation of DOC | 5.0×10⁻⁶d | s-1 |
| Kfox | Rate constant for oxidation of DOC | 3.0×10⁻⁹a,b | s-1 |
| Knitri | Rate constant for nitrification | 4.8×10⁻⁴a,b | mM-1s-1 |
| K mO2 | Limiting concentration of O2 | 0.008a,b | mM |
| K mNO3- | Limiting concentration of NO3- | 0.001a,b | mM |
Boundary condition and kinetic parameter.
() is the validation of solute transport and reaction parameters based on Kim et al., 2017.
where h(t) is the tidal head at time t (m); hmsl is the mean sea level (10 m); A is the tidal amplitude (0.5 m); and T is the tidal cycle (semi-diurnal tide, 12 h). In addition, zero-flux boundary conditions were assigned to the remaining boundaries.
In COMSOL, variable-saturation and variable-density pore flow is governed by the Richards equation (Eq. (2)), which is further coupled with the convection-diffusion-reaction equation for solute transport (Eq. (3)) (Cardenas et al., 2015; Shuai et al., 2017; Gao et al., 2023):
where ρ is the fluid density (kg m-3), c is the concentration of the solute (mol m-3, M), P is the pressure (Pa), z is the elevation head (m), θ is the water content (-),ksis the saturated hydraulic permeability (m s-1), kr is the relative permeability (m s-1), q is the Darcy velocity (m s-1), Cmis the specific moisture capacity (m-1), g is the acceleration of gravity (9.81 m s-2), Q*denotes a stress source term (kg m-3 s-1), D is the hydrodynamic dispersion coefficient (m2 s-1), and R is the reaction rate for the solute (mol m-3 s-1, mM s-1).
where θs and θr are the saturated and relative water contents (-), respectively; K is the hydraulic conductivity (m s-1); and n and α are fitting parameters that describe the shapes of both the moisture and relative permeability functions, obtained by van Genuchten (1980).
Following the approach of Wilson and Gardner (2006) and Xin et al. (2010), a seepage face was allowed to develop along the beach during the falling tide. The process is realized as follows:
where Rbis the conductance term (s-1), defined as the ratio of the saturated hydraulic conductivity (ks) with a coupling length scale (L, m). Rbwas set to a high value allowing water to readily move across the interface. Moreover, Hb is the external head representing the sea level (m), H is the total head (m), n is the unit vector normal to the interface (pointing outward), and Csea is seawater salinity (ppt).
The model domain represented a homogeneous and isotropic coastal aquifer with a thickness of 12 m and a beach slope of 1:10, with a hydraulic conductivity of 15 m d-1 and a porosity of 0.25. Moreover, discretized into triangular elements with uneven sizes, a much finer mesh was used for the inundated area. The van Genuchten (1980) soil water retention parameters α and n were set to 14.5 m−1 and 2.68, respectively, and the diffusivity, longitudinal, and transversal dispersivity coefficients were set to 1×10⁻⁹ m2 s-1, 0.2 m, and 0.02 m, respectively. These parameters were adopted from the model of Anwar et al. (2014). The cutoff wall thickness is 0.16 m with the hydraulic conductivity set to 3×10⁻⁶ m s-1, three orders of magnitude lower than that of the aquifer, which is consistent with a previous study (Shen et al., 2020). Within the domain, the maximum element length size was 0.8 m, and the minimum element length size was 0.07 m (note that a refined mesh was used for the area under the beach). The values of the Courant number and Péclet number did not exceed 1 and 2, respectively, which satisfied the stability criterion and avoided numerical oscillation. In our simulations, the temperature was kept constant, resulting in a constant dynamic viscosity.
2.2 Solute reaction model
A reactive transport model was built to conduct tide-driven mixing and biogeochemical processes in the coastal aquifer. The reaction network comprised four kinetic reactions (Table 2), including nitrification, denitrification, aerobic respiration, and DOC degradation, where the reaction network and rate expressions involved in the model were adapted from Bardini et al. (2012) and Spiteri et al. (2008). Validation of this reaction network and the kinetic parameters was performed by examining and comparing simulation results to field data for Waquoit Bay (MA, USA) (Spiteri et al., 2008) and Delaware Bay (near Cape Henlopen, Delaware, USA) (Kim et al., 2017). The kinetic parameter values vary with the coastal settings. However, since the objective of this study was to determine the influence of the cutoff wall on the fate of NO3- in a nearshore aquifer, sensitivity analysis of the kinetic parameter values was not included in this study. It should be noted that the current model did not explicitly account for the production/consumption of protons and the effect of pH on particular reaction kinetics. Moreover, the oxidation of Fe2+ and the adsorption of PO4- were not considered. Hence, the reaction rates of DOC, O2, NO3− and NH4+ can be calculated with Eq. (13):
Table 2
| Reaction | Rate expression | |
|---|---|---|
| DOC degradationa | ||
| Aerobic respirationb | ||
| Nitrificationb | ||
| Denitrificationb |
Rection and kinetic rate expressions.
The groundwater flow model and solute transport reaction model were first validated via simulation studies. Once the solute transport reaction model was successfully validated, it could be used to simulate the reactive transport of the solutes (with and without the cutoff wall) in the aquifer under tidal action. First, we set the initial condition to zero and ran the model to a steady state for all groundwater flow and salt transport under tidal action. Subsequently, all conservative transport simulations were leveraged to simulate the steady state in all cases. Finally, these simulation results were used as initial concentrations for the reactive model, which was run to a quasi-steady state for a simulation time of 700 d with a time step of 100 s.
2.3 Evaluation indexes
The effectiveness of the cutoff wall can be evaluated by the change rate of the saltwater Toe location, denoted by Δm, as follows:
where Toe0 and Toei are the quasi-steady-state saltwater toe locations before and after cutoff wall construction, respectively. The effectiveness was measured by the position of the 50% salinity interface.
The NO3- removal efficiency (RN) can be quantified as:
where mdn is the amount of NO3- determined as , and min is the total mass of NO3- transported into the aquifer during a given period, with , where Ω is the domain area, t is the tidal cycle time (12 h), fb is the sea boundary flux, RNO3 is the rate of NO3-, c0NO3 is the boundary initial concentration (mM), and l is the total length of the sea boundary layer.
3 Validation of this model
3.1 Validation of the groundwater flow and salinity distribution
To validate the present numerical model, we simulated the groundwater flow and salinity distribution in the laboratory-scale aquifer under nontidal or tidal conditions, where the laboratory-scale model setting is consistent with that in Shen et al. (2020) (readers are referred to Shen et al. (2020) for details).
Figures 2 and 3 show comparisons of the laboratory experimental results (Shen et al., 2020) and corresponding simulation results under nontidal and tidal conditions, respectively. Under nontidal conditions, both sets of results showed that the SW was driven by density. In the experiments of Shen et al. (2020), the Toe was located at 2.38 m. After the cutoff wall was constructed, as expected, the experimental results (Shen et al., 2020) showed that the SW significantly moved seaward, and the Toe location changed from 2.38 to 1.65 m, retreating by 30.7% (Figures 2A, C). In this numerical study, although the Toe location was slightly different from the experimental value (Figures 2B, D), the changing trend of the salinity distribution was consistently demonstrated after cutoff wall construction. Both sets of results showed that the cutoff wall led to a significant seaward movement of the SW, with the Toe retreating by 36%. This is also consistent with previous studies (Anwar et al., 1983; Luyun et al., 2011; Kaleris and Ziogas, 2013), demonstrating that the cutoff wall can reduce the length of the SW under static hydraulic conditions.
Figure 2
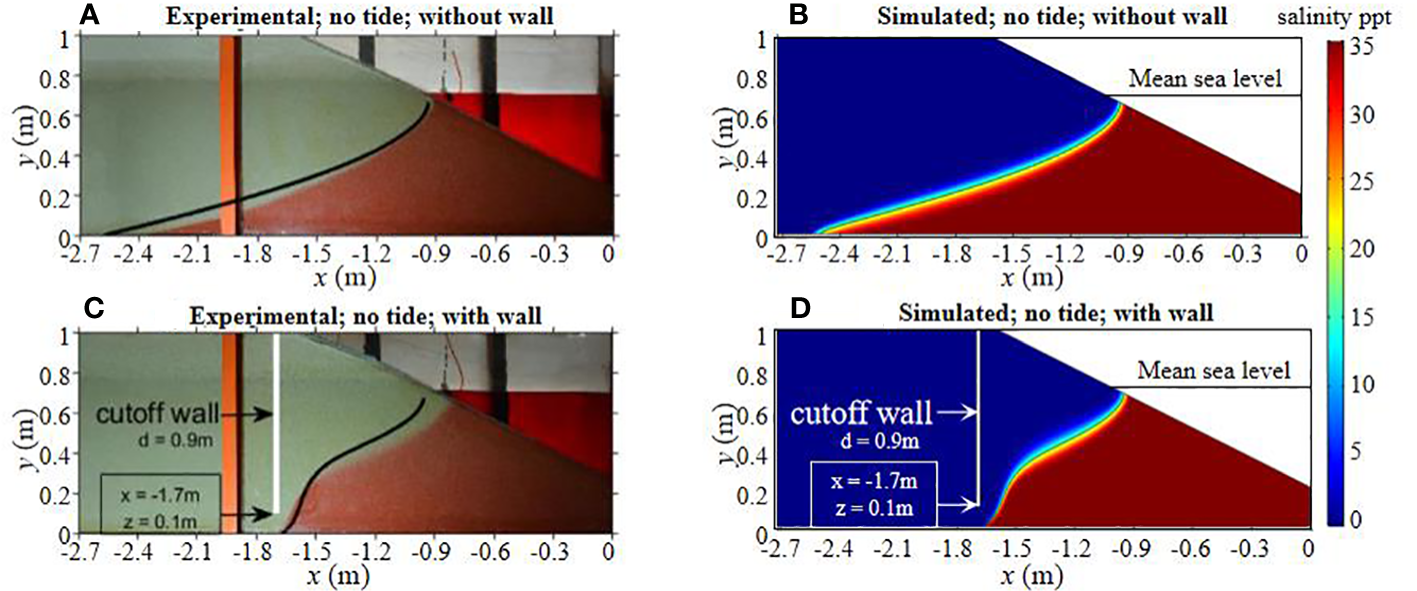
Comparison of experimental (A, C), (Shen et al., 2020) and simulated (B, D) results of salinity distribution. Results are for the no tide condition, saltwater wedge (SW), and saltwater wedge toe (Toe), the red color shows saltwater, and black lines show the simulated 50% saltwater isohalines.
Figure 3
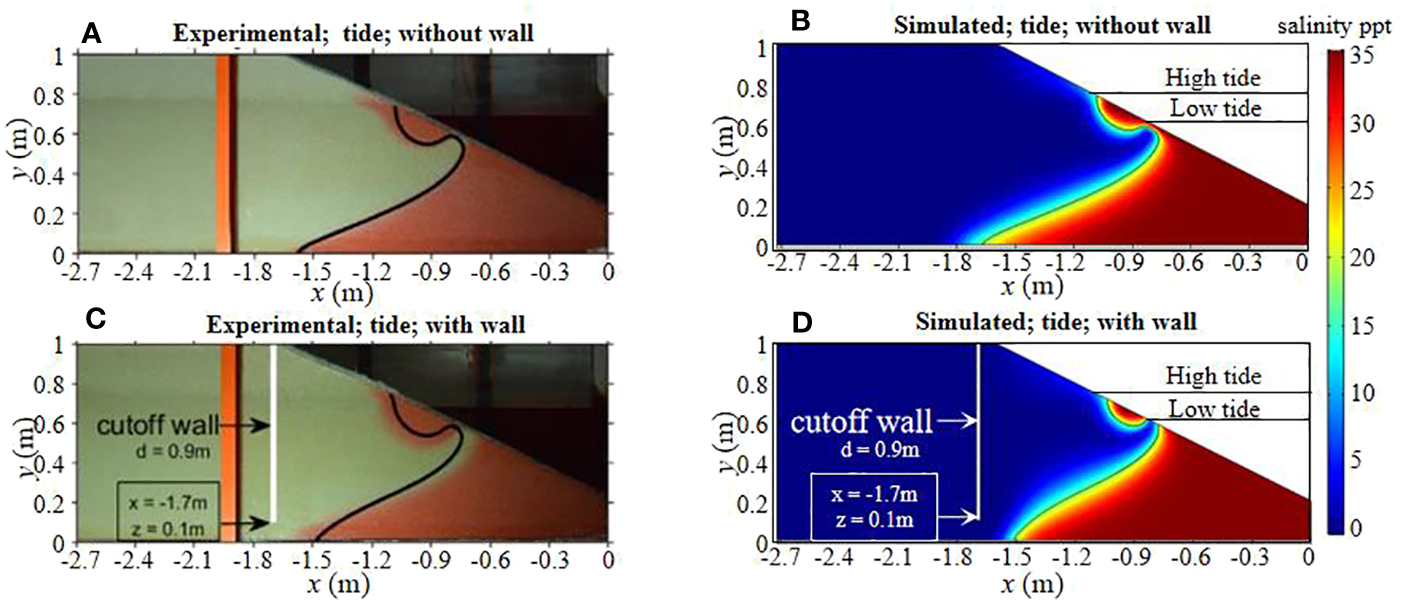
Comparison of experimental (A, C), (Shen et al., 2020) and simulated (B, D) results of salinity distribution. Results are for the tide condition, saltwater wedge (SW), upper salinity plume (USP), saltwater wedge toe (Toe), the red color shows saltwater, and black lines show the simulated 50% saltwater isohalines.
Under tidal conditions, both laboratory experimental results (Shen et al., 2020) and simulation results of USP and SW formation under salinity distribution were obtained. As expected, the USP led to the SW retreating seaward. As shown in the experiments (Shen et al., 2020), the Toe location moved from 2.38 to 1.65 m without the cutoff wall, and the numerical results indicated the same retreat seaward. After a cutoff wall was constructed, the length of the SWI zone decreased from 1.65 to 1.60 m, only a 3% reduction, and the numerical results were consistent with the experimental data (Shen et al., 2020). This demonstrates that the cutoff wall and tide can modify the salinity distribution under tidal conditions. Both the experimental and numerical results consistently demonstrated that either cutoff walls or tides could reduce the length of the SWI zone, and the simulated salinity distribution agreed well with the experimental results (Shen et al., 2020).
3.2 Validation of solute transport and reactions
We further compared the numerical results with field and numerical data pertaining to Delaware Bay (near Cape Henlopen, Delaware, USA, Kim et al. (2017)). The numerical model exhibited a hydraulic conductivity of 25 m d-1, porosity of 0.3, longitudinal dispersivity of 0.15 m, and transverse dispersivity of 0.015. The inland boundary indicated a constant freshwater flux of 1.01 m3 d-1. A semi-diurnal (period = 0.5 d) sinusoidal tide was adopted with an amplitude of 0.71 m. These parameters were adopted from the numerical simulation study of Kim et al. (2017) (for details, please refer to Kim et al. (2017)). Then, we simulated DOC degradation, aerobic respiration, and denitrification along groundwater flow paths. The reaction kinetics and parameters of DOC, O2, NO3-, and N2 are listed in Table 1. The initial DOC, NO3-, and O2 concentrations in our model were assigned according to the highest measured values in situ. The reactive solute concentrations of DOC, NO3-, and O2 were 0.0666 mM, 0.179 mM, and 0.177 mM, respectively (Table 1).
Figure 4 shows that the transport and reaction model approximately reproduced the observed salinity, O2, NO3-, and N2 distributions. Notably, the measured salinities at the landward position (x ≈ 143 m) were higher than the simulated salinities. However, there was a favorable agreement in the fresh discharge zone as well as the intertidal mixing zone (Figure 4 (A1), (A2)). The measured and modeled O2 and NO3- concentrations were highest near the surface below the mean sea level and decreased with depth and distance seaward, but the measured O2 concentration decreased more rapidly with depth than that in the saturation zone and was higher at the surface (Figure 4 (B1), (B2)). The distinction between the measured and modeled NO3- concentrations was notable in the freshwater zone (Figure 4 (C1), (C2)), which can be explained by the NO3- concentration not set at the inland boundary. The discrepancy between the measured and modeled NO3- concentrations was also likely due to the simplifying assumptions without considering the temporal variability of the seawater input due to storm tides or waves, seasonality of the groundwater flux, and sediment heterogeneity. In addition, biogeochemical reactions were not considered in this study, including nitrification and iron and sulfate reduction. Either of the above factors could impact the NO3- and reaction patterns in beach aquifers (Xin et al., 2010; Abarca et al., 2013; Heiss & Michael, 2014; Geng et al., 2020; Kreyns et al., 2020). The results also showed that the simulated N2 results were basically consistent with the spatial distribution measured in the aquifer. In general, the present numerical model could suitably reflect the biogeochemical processes in aquifers.
Figure 4
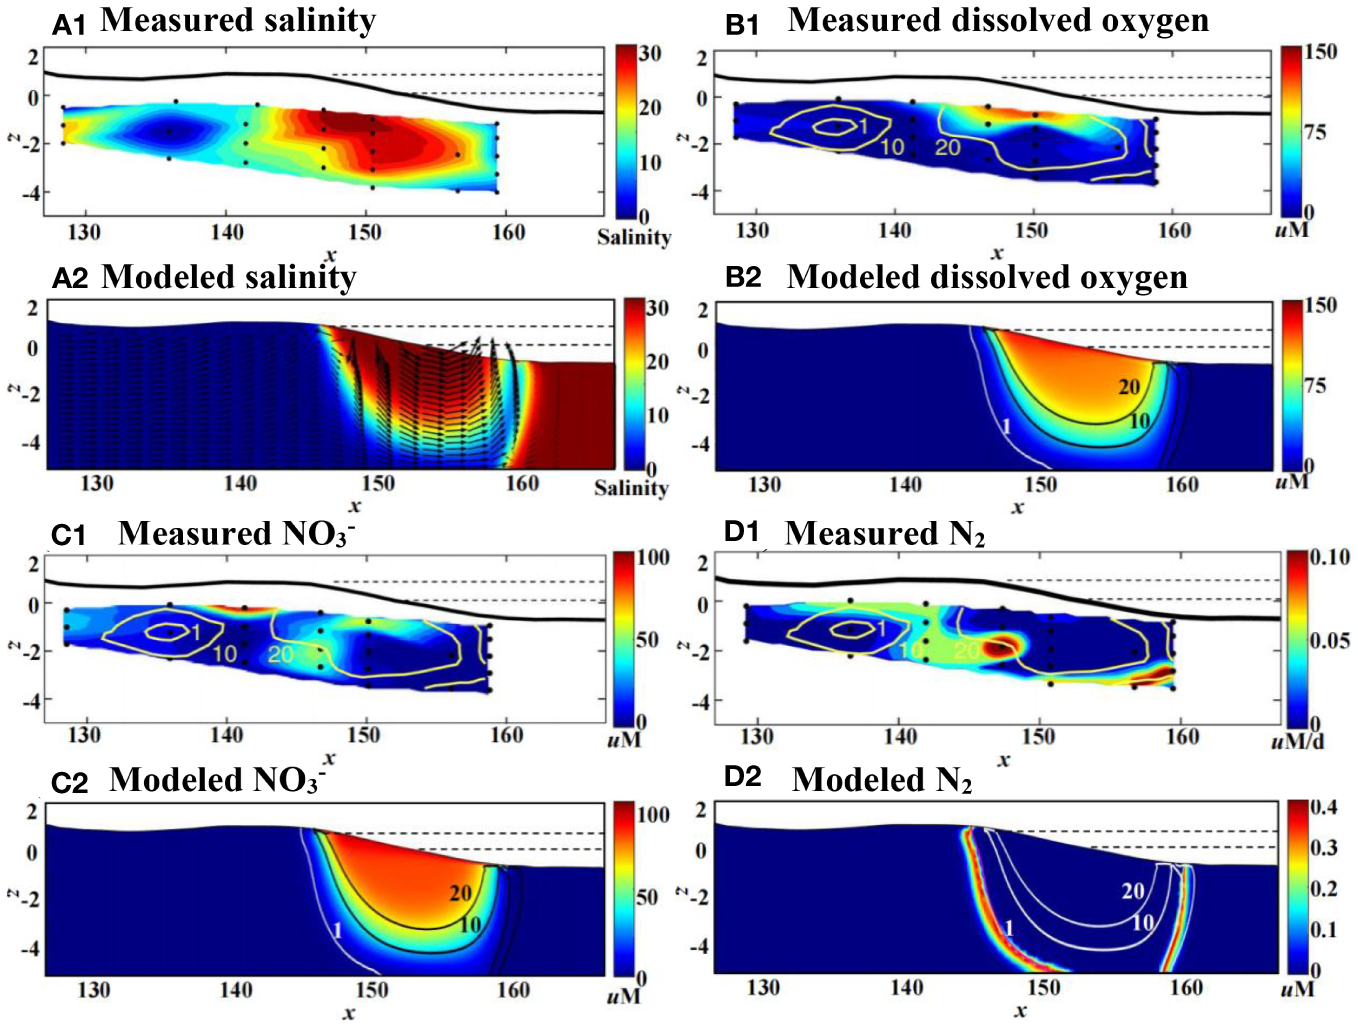
Measured (1) (Kim et al., 2017) and our modeled (2) distributions for salinity (A), O2(B), NO3-(C), and N2(D) in the intertidal beach aquifer. The arrow indicates the quasi-steady groundwater flow velocity in (a-2). The horizontal dotted lines in both panels are high tide and mean sea level, and low tide is contiguous with the topography at the base of the beach face. And 1, 10, and 20 salinity contours are shown.
We further analyzed the influence of the cutoff wall on the fate of NO3-, the NO3- removal rate, and the salinity distribution under tidal action through the following cases (Table 3): (I) Case 1, with tidal action but without the cutoff wall; (II) Cases 2-4, with various cutoff wall locations (x = 17 m, 23 m, and 26 m, respectively) and with tidal action; and (III) Cases 3 and 5-8, with cutoff walls at x = 23 m and depths of 2.3, 3.3, 4.3, 5.3, and 6.3 m. (IV) In Cases 9 and 10, we investigated the effects of the cutoff wall on NO3- contamination under the interaction between the sea and terrestrial nutrients. (V) In Case 11, we investigated the effect of SDOC at the bottom of the cutoff wall on NO3- contamination.
Table 3
| Simulation | Cutoff wall location (x: m) |
Cutoff wall depth (h: m) |
DOC source (mM) |
|---|---|---|---|
| Sea nutrients | |||
| Case 1 | No-wall | No-wall | – |
| Case 2 | 17 m | 4.3 m | – |
| Case 3 | 23 m | 4.3 m | – |
| Case 4 | 26 m | 4.3 m | – |
| Case 5 | 23 m | 2.3 m | – |
| Case 6 | 23 m | 3.3 m | – |
| Case 7 | 23 m | 5.3 m | – |
| Case 8 | 23 m | 6.3 m | – |
| Terrestrial DOC (TDOC) | |||
| Case 9 | No-wall | No-wall | – |
| Case 10 | 23 m | 4.3 m | – |
| DOC source (SDOC) | |||
| Case 11 | 23 m | 4.3 m | 10 mM |
Summarize the cases.
"-" is no value.
4 Results and discussion
4.1 Influence of the cutoff wall location
In this section, a series of cases with different cutoff wall locations were adopted to investigate the influence of the barrier location on the fate of NO3-, the NO3- removal rate, and the salinity distribution. We fixed the depth of the wall (h = 4.3 m) and determined the importance of the wall location on the x-axis (x = 17, 23, and 26 m).
4.1.1 Influences of the cutoff wall on O2, NO3- and the reaction and salinity distributions
Figure 5 shows the distributions of O2 and NO3- and the reaction and salinity distributions for the different barrier locations. O2 and NO3- were distributed in the same pattern as the salinity in the aquifer, forming two high-concentration areas (USP and SW) (Figure 5) before the reaction. The O2 distribution closely resembles that measured by Kim et al. (2017), with the concentration decreasing with depth and distance seaward from the high tide mark.
Figure 5
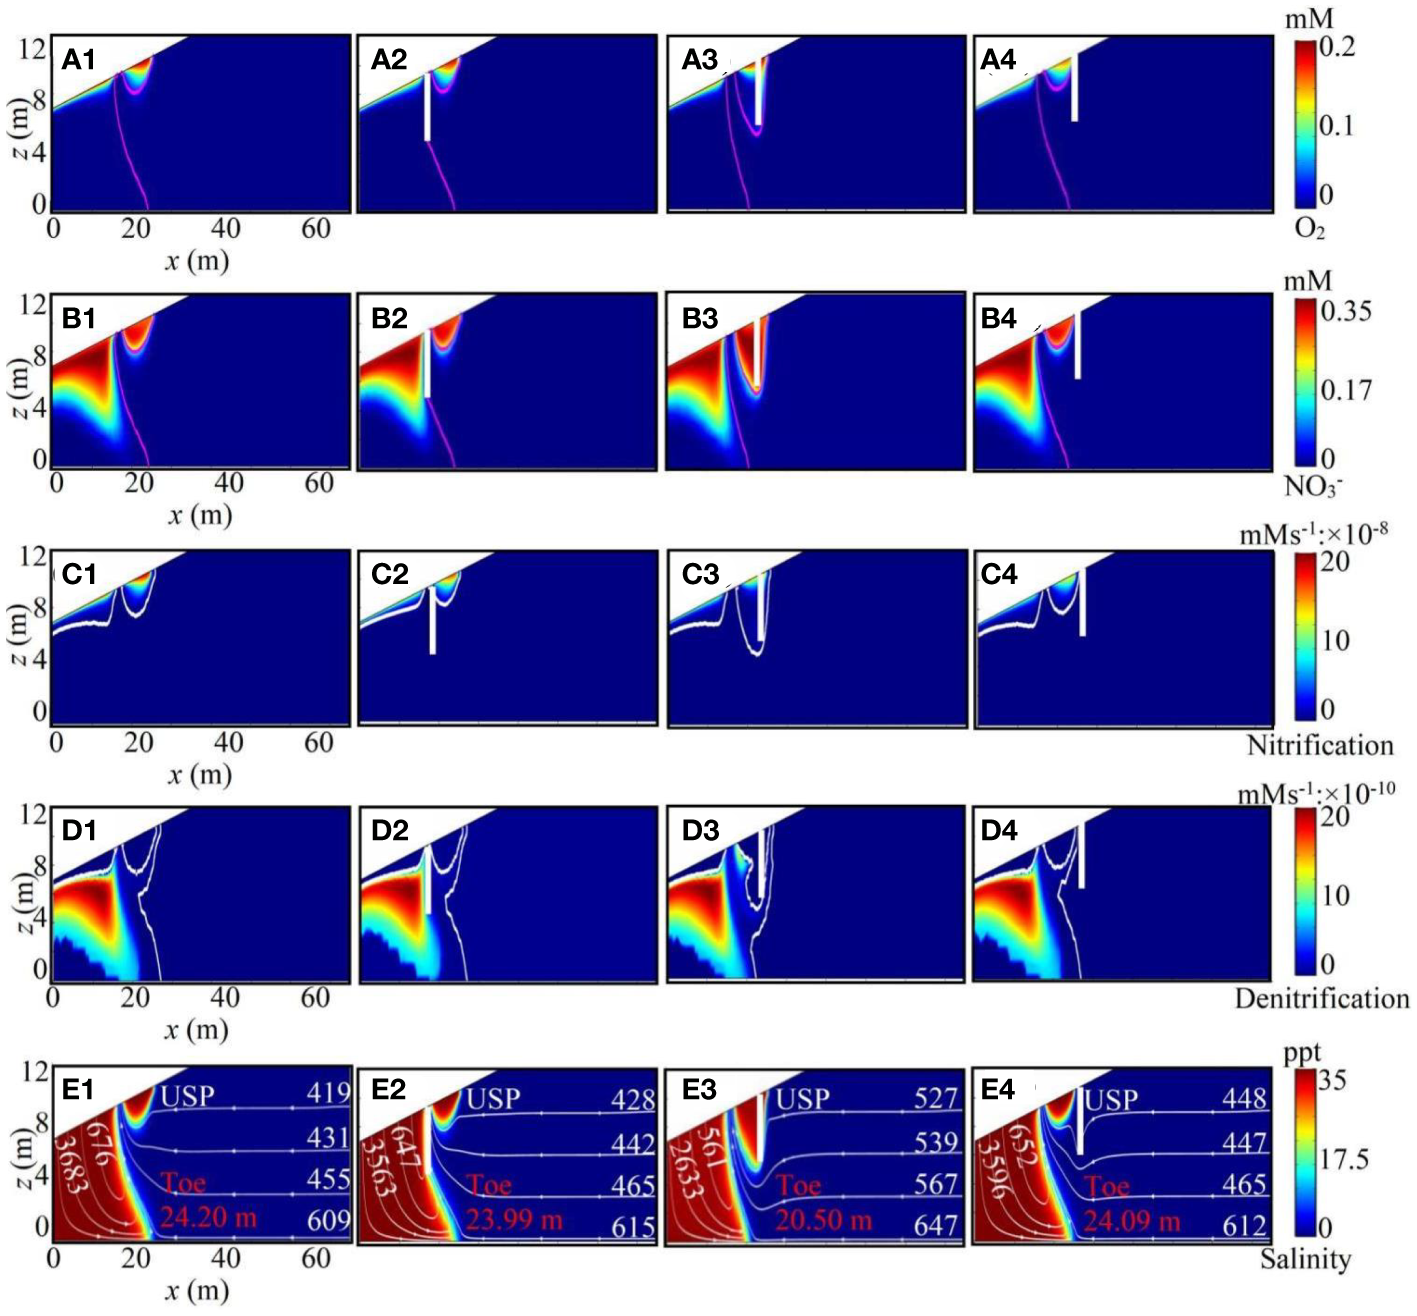
(A–E) is the O2 and NO3-, nitrification, denitrification, and salinity distribution and particle paths in the aquifer with cutoff walls of different locations (the cutoff wall location is no-wall, 17 m, 23 m, and 26 m, respectively). Upper salinity plume (USP), saltwater wedge toe (Toe), and the particle paths and travel times (starting from the inland boundary and the beach) are marked. The vertical white line indicates the cutoff wall, the magenta lines, and white lines show the before reaction species distribution, and t = 300 d reaction distribution, respectively.
After the reaction reached a steady state, a significant change appeared. The O2 concentrations were low throughout the deeper aquifer circulation cell and mainly concentrated in the shallow layer of the aquifer (Figure 5). The deep O2 was mainly consumed by nitrification and aerobic respiration due to the long residence time and sufficient reaction. This produced favorable conditions for denitrification when DOC and NO3- were abundant. The NO3- concentrations in the shallow beach subsurface were elevated (Figure 5), where saltwater infiltration was highest and decreased with depth (Figure 5). With the wall located at x = 23 m, O2, NO3- and the reaction distribution significantly changed (Figure 5). The O2 and NO3- distributions closely resembled those under non-wall conditions, and they were elevated in the shallow beach subsurface where saltwater infiltration was highest and decreased with depth. In addition, O2 and NO3- infiltrated vertically at the edge of the wall (x = 23 m) and flowed upward to the ocean on the left in the intertidal zone. Nitrification and denitrification increased under wall action. Nitrification slightly increased at the edge of the wall (Figure 5), and denitrification significantly increased at the edge of the USP (Figure 5).
To further explore the effect of the wall location on NO3- contamination, we quantified the salinity distribution and groundwater flow under the different locations of the cutoff wall (Figure 5). As expected, when the cutoff wall was inserted, the salinity distributions changed (Table 4). Interestingly, corresponding to the wall at x = 23 m, the Toe location and salinity distribution significantly changed, e.g., as the wall moved from x = 17 to 23 m, the Toe location moved from 20.50 to 23.99 m. Corresponding to the wall at x = 26 m, the Toe location increased to 24.09 m. Tidal-induced saltwater infiltrated vertically at the edge of the cutoff wall and flowed upward to the ocean on the left side of the cutoff wall under freshwater flow action, inducing a larger USP. Therefore, the larger USP led to the SW retreating further seaward.
Table 4
| Case | Cutoff wall | Toe | Freshwater flux | NO3- mass of inflow | NO3- mass of denitrification | NO3- removal efficiency |
|---|---|---|---|---|---|---|
| (x: m) | (m) | (m2 s-1) | (g m-1) | (g m-1) | (RN: %) | |
| Case 1 | No-wall | 24.2 | 0.4751 | 7.86 | 0.148 | 1.88 |
| Case 2 | 17 m | 23.99 | 0.4682 | 7.69 | 0.143 | 1.859 |
| Case 3 | 23 m | 20.5 | 0.405 | 6.739 | 0.156 | 2.315 |
| Case 4 | 26 m | 24.09 | 0.462 | 7.484 | 0.137 | 1.831 |
Model parameters and Toe, freshwater flux, NO3- mass of inflow and denitrification, and NO3- removal efficiency (RN).
To explain why the Toe of the wall at x = 23 m was significantly smaller than that under the other locations, we further quantitatively analyzed the traces and travel times of particles moving through the aquifer (note the averaged values over the tidal cycle; readers are referred to Xin et al. (2010) for details) (Figure 5). Each trace tracks the particle movement driven by pore water flow in the aquifer (Shen et al., 2020). We released four particles at the inland boundary and the beach surface (refer to Table 5 for the starting position). Under non-wall conditions (Figure 5), particles released inland moved along the freshwater path, bypassed the USP and SW, and were discharged into the sea. The deeper particles needed more time than the shallow ones; for example, a particle starting at a shallow depth (x = 75 m, z = 9.2 m) needed 419 d, while one starting deep inland (x = 75 m, z = 0.2 m) needed 609 d (Figure 5). At the beach surface, the particles released into the deeper part of the beach moved further landward and followed longer paths. In this way, the travel time through the deeper beach was longer, e.g., a tracked particle starting at (x = 0.8 m, z = 7.12 m) needed 7245 d, while that starting at (x = 10.3 m, z = 8.47 m) needed 676 d (Figure 5), a decrease of 632%. With the wall (Figure 5), both the particle movement and travel time were significantly modified. The particles released from the shallow inland zone started to bypass the wall by moving down and up on the landside and seaside, respectively. Corresponding to the cutoff wall at x = 23 m, the one starting at (x = 75 m and z = 9.2 m) needed 527 d, increasing 23.1% relative to the cutoff wall location at x = 17 m (Figure 5). As the SW was pushed seaward, the particle travel path and moving time were also altered on the seaside, e.g., 4807 d were needed for the particles released at (x = 0.8 m and z = 7.12 m) under the cutoff wall (x = 23 m) but 6934 d were needed when released under the cutoff wall location at x = 17 m. Under the action of the cutoff wall at x = 23 m, the travel time of the particles at the beach boundary was significantly shortened and increased inland. Therefore, the cutoff wall (x = 23 m) decreased the toe and increased the residence time of the solute particles.
Table 5
| Starting position | No-wall | x = 17m | x = 23m | x = 26m |
|---|---|---|---|---|
| (m) | (d) | (d) | (d) | (d) |
| x = 0.8 m, z = 7.12 m | 7245 | 6934 | 4807 | 7024 |
| x = 3.2 m, z = 7.46 m | 3683 | 3563 | 2633 | 3596 |
| x = 6.5 m, z = 7.93 m | 1689 | 1596 | 1303 | 1647 |
| x = 10.3 m, z = 8.47 m | 676 | 647 | 561 | 652 |
| x = 75 m, z = 0.2 m | 609 | 605 | 657 | 610 |
| x = 75 m, z = 3.2 m | 455 | 465 | 567 | 465 |
| x = 75 m, z = 6.2 m | 431 | 442 | 539 | 447 |
| x = 75 m, z = 9.2 m | 419 | 428 | 527 | 448 |
Particle travel times and starting position.
4.1.2 Influence of the cutoff wall location on NO3- inflow and denitrification, RN and freshwater storage
We further quantitatively analyzed the total mass of NO3- inflow (Figure 6A) and denitrification (Figure 6B), NO3- removal efficiency (RN) (Figure 7A), and freshwater flux (Figure 7B) under various wall locations in the aquifer (note the averaged values over the tidal cycle). Under non-wall conditions, the total mass of NO3- inflow was 7.86 g m-1, the NO3- mass of denitrification was 0.148 g m-1, RN was 1.88%, and the freshwater flux was 0.475 m2 s-1. After cutoff wall construction, the total mass of NO3- inflow and denitrification, NO3- removal efficiency (RN), and freshwater flux were significantly modified, e.g., with the wall at x = 17 m, the mass of NO3- inflow was 7.69 g m-1, the NO3- mass of denitrification was 0.143 g m-1, RN was 1.86%, and the freshwater flux was 0.468 m2 s-1.
Figure 6
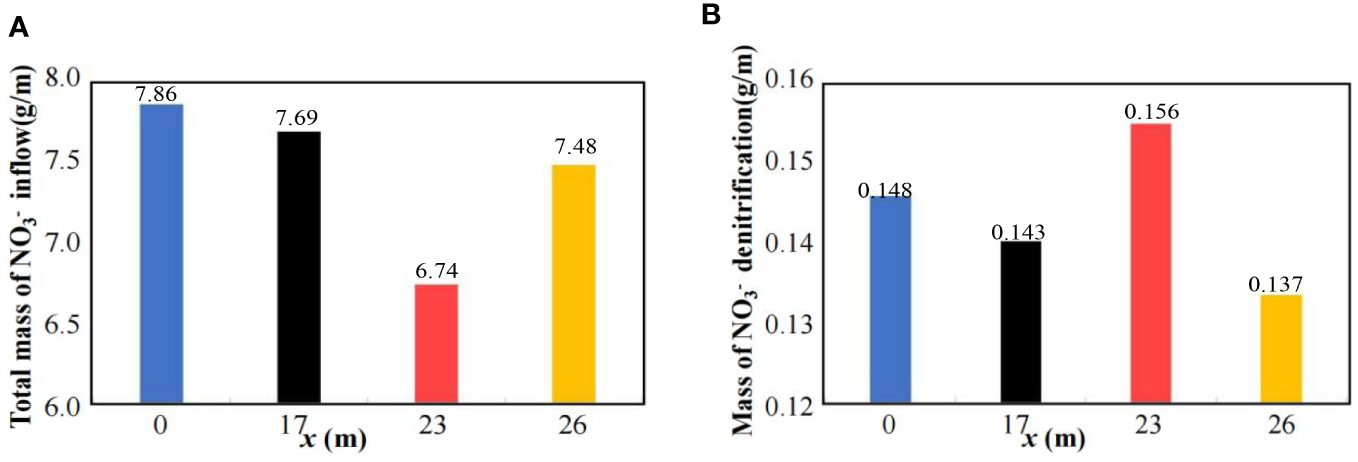
Total mass of NO3- inflow (A) and denitrification (B) of various locations of cutoff wall.
Figure 7
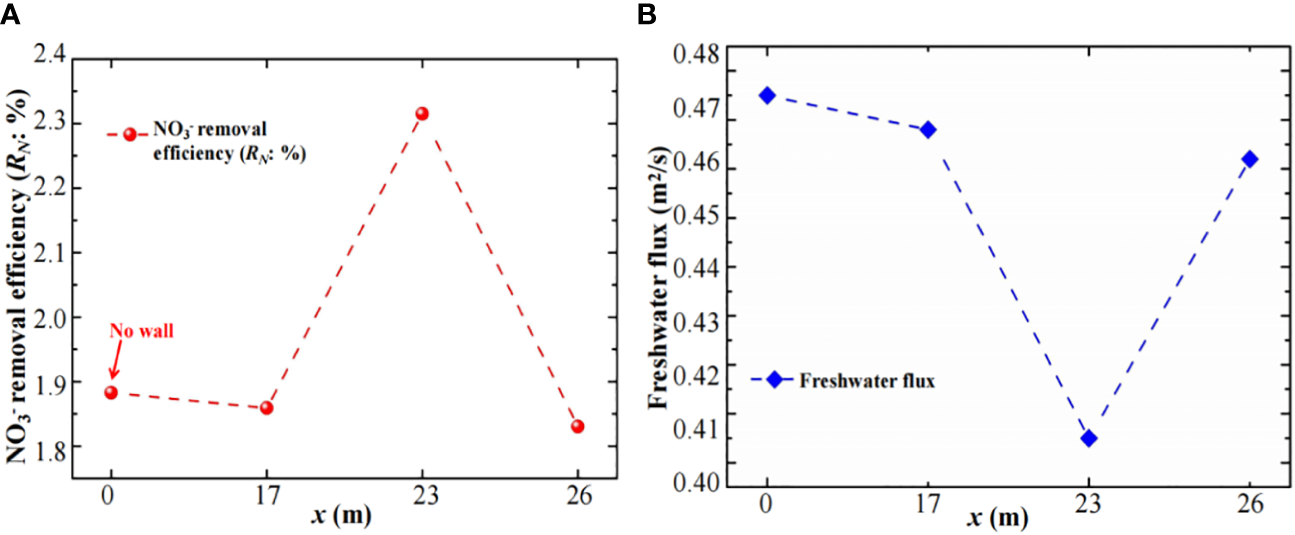
(A, B) is NO3- removal efficiency (RN) and freshwater flux with cutoff wall locations (the wall location is no-wall, 17 m, 23 m, and 26 m, respectively), and the wall depth is 4.3 m.
With the wall at x = 23 m, the mass of NO3- inflow was 6.74 g m-1, the NO3- mass of denitrification was 0.156 g m-1, RN was 2.32% and the freshwater flux was 0.405 m2 s-1. Therefore, with the wall at x = 23 m, the total mass of NO3- inflow and freshwater flux were the lowest, and the NO3- mass of denitrification and NO3- removal efficiency (RN) were the highest.
These results suggested that cutoff walls could mitigate NO3- contamination, decrease salinity distribution, and increase freshwater storage. These effects were the most significant with the cutoff wall at x = 23 m in the present study.
4.2 Influence of the cutoff wall depth
In this section, with the cutoff wall set at x = 23 m, we investigated the effects of the barrier depth on NO3- contamination and salinity distribution.
4.2.1 Influence of the cutoff wall depth on O2, NO3- and the reaction and salinity distributions
Figure 8 shows the distributions of O2 and NO3- and the reaction and salinity distributions for the different barrier heights. O2 and NO3-, consistent with the salinity distribution (Figure 8), formed two high-concentration areas (USP and SW), with the concentrations decreasing with depth and distance seaward from the high tide mark.
Figure 8
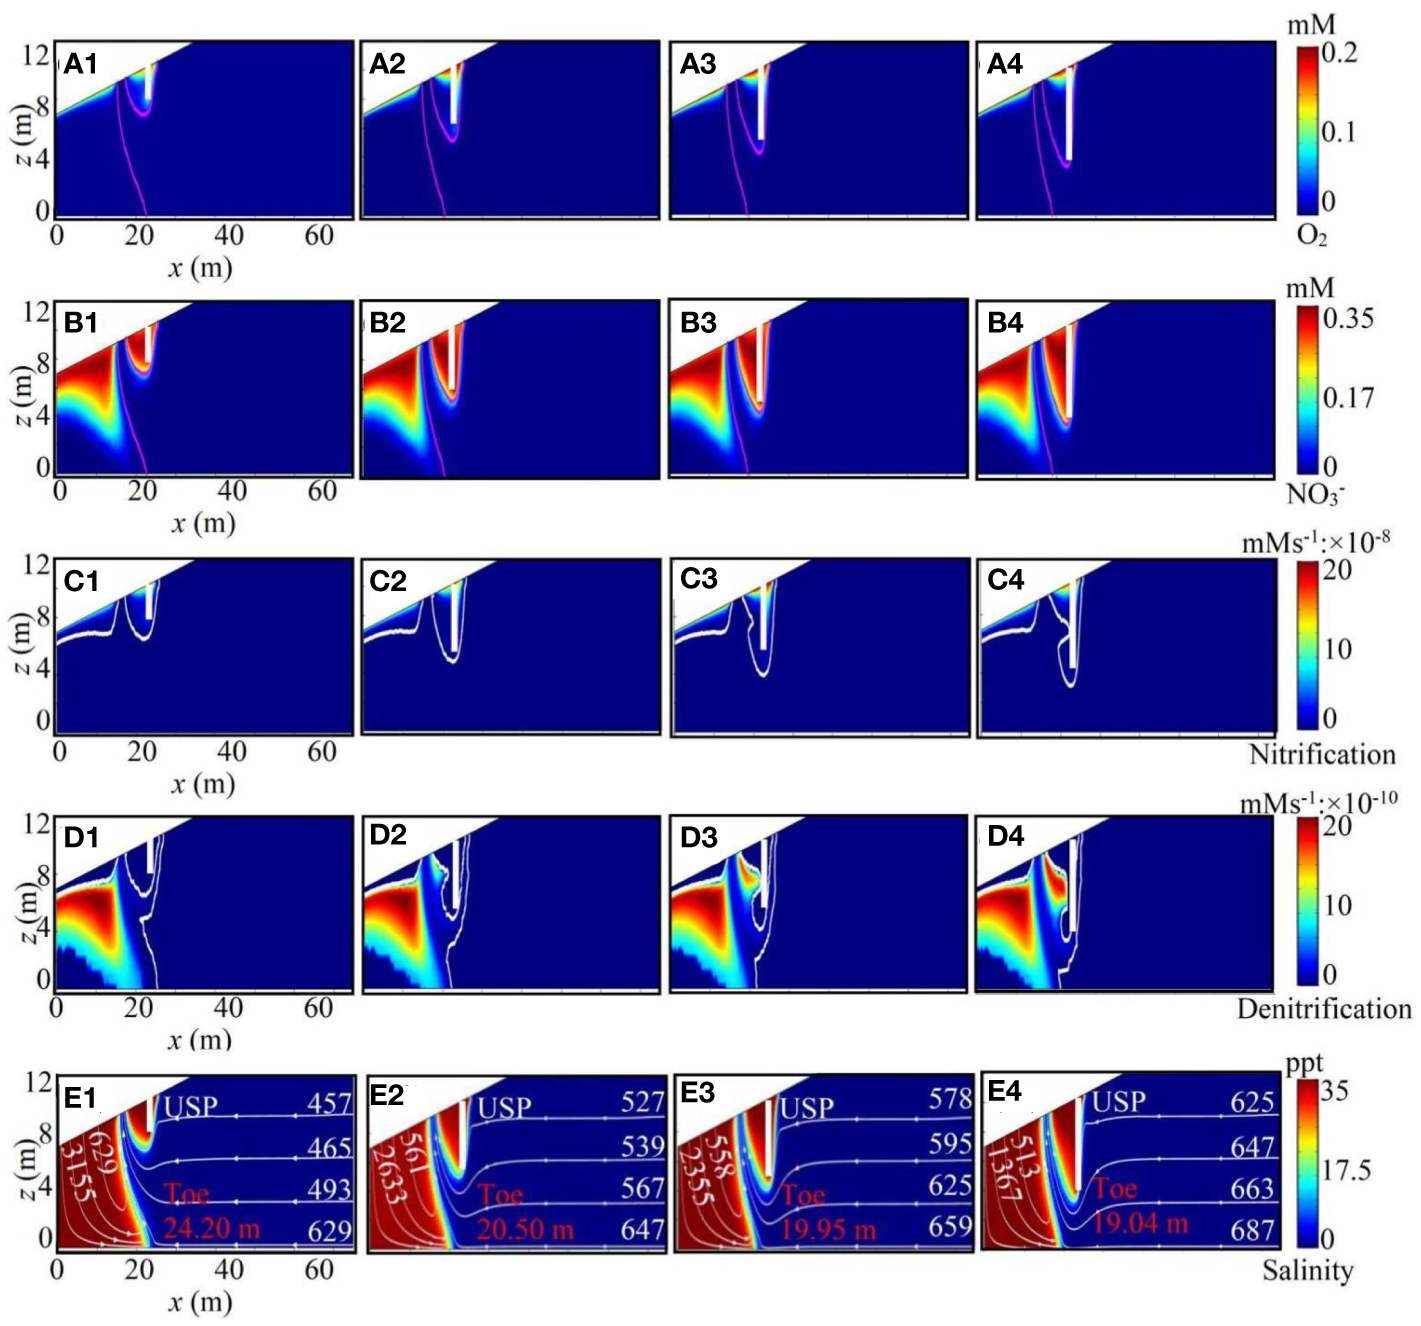
(A–E) is the O2 and NO3-, nitrification, denitrification, and salinity distribution and particle paths in the aquifer with cutoff walls of different depths (the cutoff wall depth is 2.3 m, 4.3 m, 5.3 m, and 6.3 m, respectively. H = 3.3 m not shown). Upper salinity plume (USP), saltwater wedge toe (Toe), and the particle paths and travel times (starting from the inland boundary and the beach) are marked. The vertical white line indicates the cutoff wall, the magenta lines, and white lines show the before reaction species distribution, and t = 300 d reaction distribution, respectively.
After the reaction reached a steady state, there were significant changes in the distribution of nutrients. Under the different wall depths, the O2, NO3-, and reaction distributions changed, and the O2 and NO3- distributions closely resembled those under non-wall conditions; they were elevated in the shallow beach subsurface where saltwater infiltration was the highest and decreased with depth. In addition, O2 and NO3- infiltrated vertically at the edge of the wall (Figure 8) and flowed upward to the ocean on the left side in the intertidal zone, and the distribution area increased with increasing wall depth, e.g., in the intertidal zone, the O2 and NO3- distributions above increased with increasing wall depth from 2.3 to 6.3 m (Figure 8). Nitrification and denitrification increased with increasing wall depth; specifically, nitrification slightly increased at the edge of the wall (Figure 8), and denitrification significantly increased at the edge of the USP (Figure 8). This was due to nitrification-dependent O2, and denitrification requires anaerobic bacteria.
To explain why denitrification significantly increased for the wall with h = 6.3 m (x = 23 m), we evaluated the salinity distribution and the travel time of particles moving through the aquifer (note the averaged values over the tidal cycle; readers are referred to Xin et al. (2010) for details). As expected, when the cutoff wall height was small (Figure 8), saltwater partly intruded into the landward aquifer. However, when the barrier height was large (Figure 8), despite the largest USP, the distance of saltwater intrusion was successfully controlled (Table 6), e.g., it decreased from 22.68 to 19.04 m as the cutoff wall depth was increased from 2.3 to 6.3 m (Figure 8), and the impact on salinity change (Δm) increased from 6.28% to 21.3% (Figure 8). We released four particles at both the inland boundary and beach surface (refer to Table 7 for the starting position). When the cutoff wall depth was varied, the USP vertically increased with increasing cutoff wall depth, and the retreat of the SW became increasingly significant with increasing cutoff wall depth. The travel time of the particles released inland increased with increasing cutoff wall depth, which is due to the longer time and path of the particles when bypassing the USP, e.g., the particle released at (x = 75 m, z = 9.2 m) needed 457 d when the cutoff wall depth was 2.3 m, and the travel time was 625 d under a depth of h = 6.3 m, an increase of 36.8%. The travel time of the particles released seaside decreased with increasing cutoff wall depth, e.g., when the wall depth was 2.3 m, the particle released at (x = 0.8 m, z = 7.12) m needed 5923 d, while 3753 d were needed when the depth was 6.3 m, a reduction of 57.8%. Therefore, the toe decreased and the residence time of the solute particles increased with increasing cutoff wall depth, which is consistent with previous studies (Robinson et al., 2007; Shen et al., 2020).
Table 6
| Case | Cutoff wall | Toe | Freshwater flux | NO3- mass of inflow | NO3- mass of denitrification | NO3- removal efficiency |
|---|---|---|---|---|---|---|
| (h: m) | (m) | (m2 s-1) | (g m-1) | (g m-1) | (RN: %) | |
| Case 5 | 2.3 m | 22.68 | 0.4662 | 7.526 | 0.152 | 1.907 |
| Case 6 | 3.3 m | 22.17 | 0.435 | 6.684 | 0.154 | 2.304 |
| Case 3 | 4.3 m | 20.5 | 0.4051 | 6.439 | 0.156 | 2.315 |
| Case 7 | 5.3 m | 19.95 | 0.3797 | 5.752 | 0.161 | 2.805 |
| Case 8 | 6.3 m | 19.04 | 0.3542 | 5.543 | 0.167 | 2.903 |
Model parameters and Toe, freshwater flux, NO3- mass of inflow and denitrification, and NO3- removal efficiency (RN).
Table 7
| Starting position | h = 2.3m | h = 3.3m | h = 4.3m | h = 5.3m | h = 6.3m |
|---|---|---|---|---|---|
| (m) | (d) | (d) | (d) | (d) | (d) |
| x = 0.8 m, z = 7.12 m | 5923 | 5070 | 4807 | 4266 | 3753 |
| x = 3.2 m, z = 7.46 m | 3155 | 2733 | 2633 | 2335 | 1367 |
| x = 6.5 m, z = 7.93 m | 1433 | 1353 | 1303 | 1196 | 1086 |
| x = 10.3 m, z = 8.47 m | 629 | 618 | 561 | 558 | 513 |
| x = 75 m, z = 0.2 m | 629 | 631 | 657 | 662 | 681 |
| x = 75 m, z = 3.2 m | 493 | 531 | 567 | 609 | 653 |
| x = 75 m, z = 6.2 m | 465 | 498 | 539 | 581 | 634 |
| x = 75 m, z = 9.2 m | 457 | 486 | 527 | 579 | 615 |
Particle travel times and starting position.
4.2.2 Influence of the cutoff wall depth on NO3- inflow and denitrification, RN and freshwater storage
Figures 9 and 10 show the mass of NO3- inflow and denitrification, NO3- removal efficiency (RN), and freshwater flow per unit aquifer width with the barrier height (note the averaged values over the tidal cycle). The mass of NO3- inflow decreased with depth (Figure 9A), while denitrification increased (Figure 9B), e.g., when the wall depth was 2.3 m, the mass of NO3- inflow and denitrification were 7.52 g m-1 and 0.152 g m-1, respectively, and when the wall depth was 6.3 m, the mass of NO3- inflow and denitrification were 5.54 g m-1 and 0.167 g m-1, respectively. As expected, the NO3- removal efficiency (RN) increased with increasing cutoff wall depth because the nitrification distribution at the right wall increased with increasing cutoff wall depth, while denitrification at the USP increased with depth. In detail, as the wall depth was increased from 2.3 to 6.3 m, the NO3- removal efficiency (RN) increased from 2.02% to 3.0% (Figure 10A). The freshwater flow decreased relative to non-wall conditions (Figure 10B). It should be noted that the freshwater flow decreased with increasing cutoff wall depth, e.g., it decreased from 0.467 to 0.354 m2 s-1 as the cutoff wall depth was increased from 2.3 to 6.3 m (Figure 10B).
Figure 9
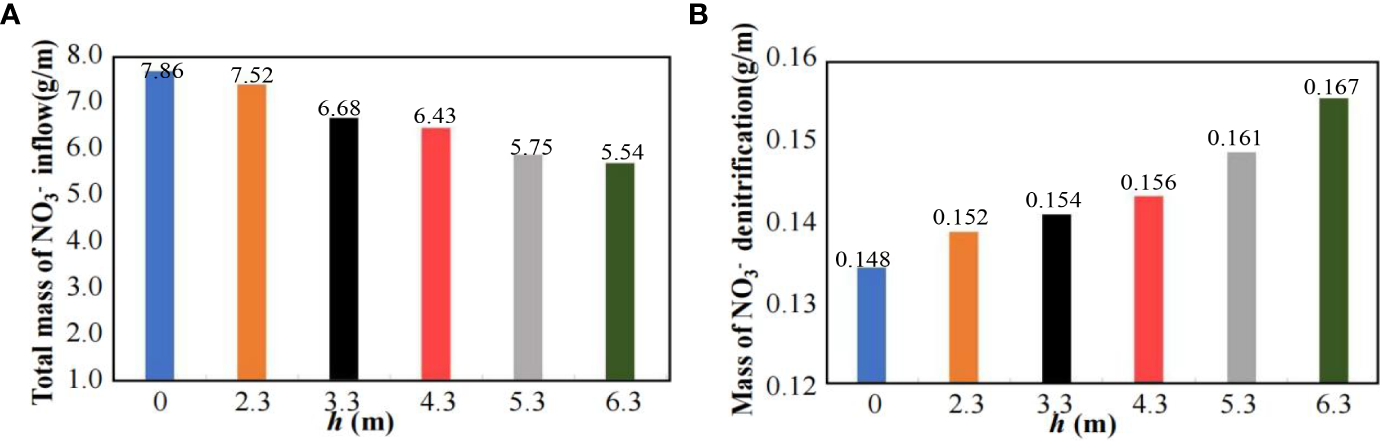
Total mass of NO3- inflow (A) and denitrification (B) of various depths of cutoff wall.
Figure 10
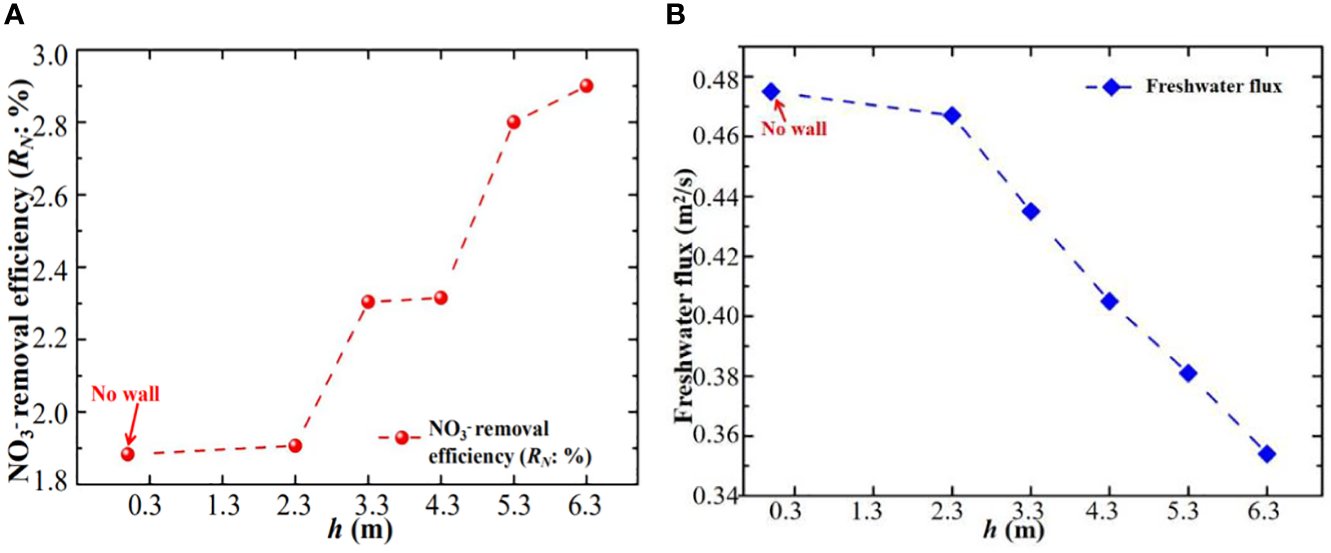
(A, B) is NO3- removal efficiency (RN) and freshwater flux with cutoff walls depth (the cutoff wall depth is no-wall, 2.3 m, 3.3 m, 4.3 m, 5.3 m, and 6.3 m, respectively), the wall location at x = 23 m.
These results suggested that the cutoff wall depth affects nitrification, denitrification, and salinity distribution. In other words, the cutoff wall could effectively reduce NO3- contamination and the salinity distribution and increase freshwater storage, and the effectiveness increased with increasing wall depth.
4.3 Influence of TDOC
We further investigated the effect of the cutoff wall on NO3- contamination under the interaction between the sea and terrestrial nutrients.
By comparing the simulation results (Figures 11A, B), it could be observed that the distribution of DOC and denitrification in the nearshore aquifer were significantly altered by the cutoff wall due to the modified transport pathways and saltwater recirculation pathways. Terrestrial groundwater migrated downward around the tide-induced saltwater recirculation (USP) and was discharged near the low tide mark. Discharge of TDOC occurred in a narrow zone between the USP and SW. Terrestrial groundwater and TDOC further migrated downward around the tide- and wall-induced saltwater recirculations under the influence of the wall, which caused a decrease in TDOC discharge into the sea, e.g., it decreased from 0.05 to 0.01 mol m-1 s-1.
Figure 11

(A–D) is DOC and denitrification distribution in the aquifer with TDOC of different walls (the wall set at x = 23 m, h = 4.3 m). The horizontal black line indicates the tidal range and the vertical white line indicates the cutoff wall.
In the case of TDOC-non wall, degradation of terrestrial DOC by oxic recirculating saltwater, followed by nitrification, produced NO3- in the upper mixing zone. Denitrification occurred in the freshwater-saltwater mixing zone formed by the circulation and interface between the saltwater and freshwater parts of the SW. With the wall at x = 23 m, the denitrification distribution significantly changed (Figure 11). Denitrification increased significantly at the edge of the USP due to the wall. Because DOC in the nearshore aquifer was significantly altered by the cutoff wall, the mass of NO3- denitrification was 0.08 g m-1 under non-wall conditions and 0.084 g m-1 under wall conditions.
The results demonstrated the importance of walls for NO3- contamination under the influence of TDOC in beach aquifers, and the cutoff wall not only promoted greater NO3- removal but also significantly decreased the TDOC discharge into the sea.
4.4 Influence of SDOC
With the cutoff wall set at x = 23 m and h = 4.3 m, we further investigated the effect of SDOC at the bottom of the cutoff wall on NO3- contamination.
Figure 12 shows the impact of SDOC on NO3- and the denitrification rate distribution. SDOC led to elevated DOC concentrations at the bottom of the wall, which decreased along flow paths owing to DOC oxidation. This altered the chemical composition of the pore water. The NO3- distribution changed relative to that under non-SDOC conditions. The location and size of the denitrification zone were affected by SDOC, and the aerobic respiration rate for SDOC was high enough that O2 was fully consumed.
Figure 12
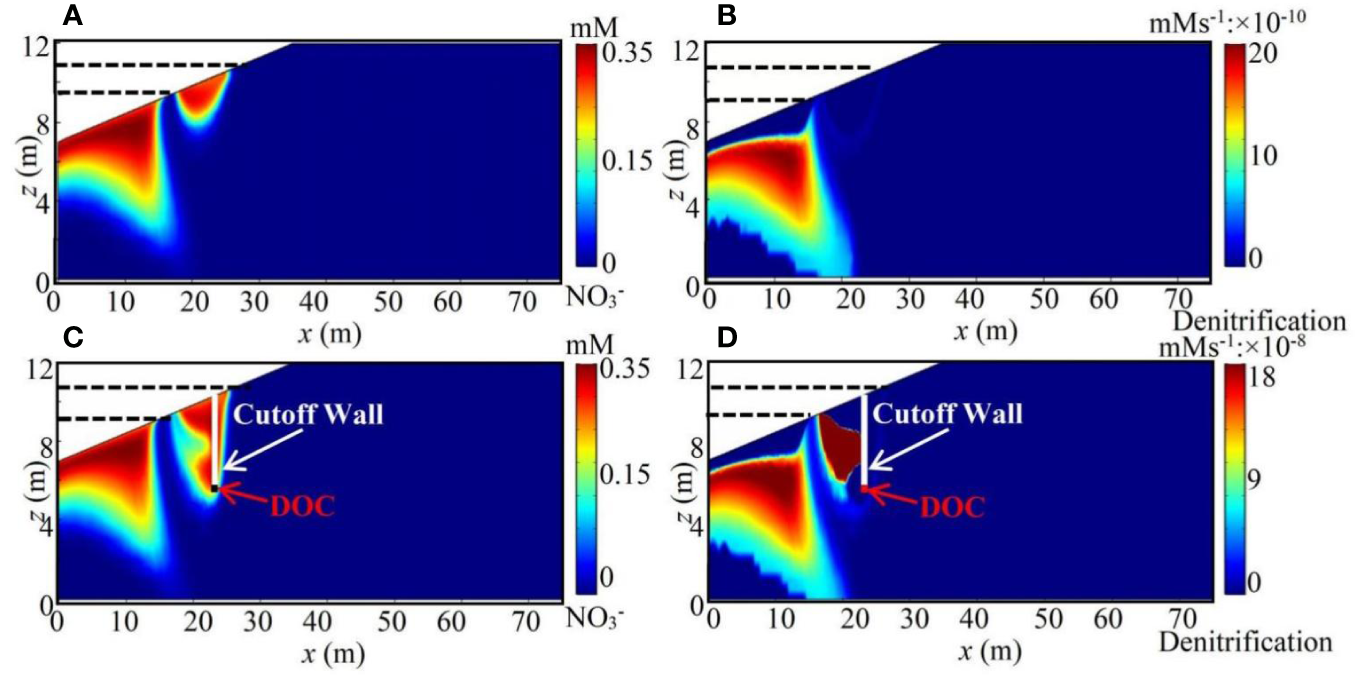
(A–D) is the NO3- and denitrification in the aquifer with SDOC of different concentrations (the concentrations are 0 mM and 10mM. The cutoff wall set at x = 23 m, h = 4.3 m). The horizontal black line indicates the tidal range and the vertical white line indicates the cutoff wall.
Table 8 shows that the NO3- removal efficiency increased with SDOC. The NO3- removal efficiency increased from 2.315% to 27.753% with an increase in SDOC from 0 to 10 mM. The mass of NO3- denitrification increased 10 times. However, the freshwater flux and mass of NO3- inflow remained constant. The results demonstrated that SDOC promoted greater NO3- removal.
Table 8
| Case | Cutoff wall | Toe | Freshwater flux | NO3- mass of inflow | NO3- mass of denitrification | NO3- removal efficiency |
|---|---|---|---|---|---|---|
| (h: m) | (m) | (m2 s-1) | (g m-1) | (g m-1) | (RN: %) | |
| Case 3 | 4.3 m | 20.5 | 0.4051 | 6.439 | 0.156 | 2.315 |
| Case 9 | 4.3 m | 20.5 | 0.4051 | 6.439 | 1.787 | 27.753 |
Model parameters and Toe, freshwater flux, NO3- mass of inflow and denitrification, and NO3- removal efficiency (RN).
5 Discussion
5.1 Implications of the cutoff wall and SDOC for SWI and NO3- removal
The objective of this study was to evaluate the effects of the cutoff wall location and depth on NO3- removal and the salinity distribution in the aquifer. Under tidal action, the formation of the USP and SW under salinity distribution, as expected, led to the SW retreating seaward (Buquet et al., 2016; Kuan et al., 2019; Shen et al., 2020). Figure 5 shows that the location of the cutoff wall significantly influenced the salinity distribution (Shen et al., 2020); in detail, the effectiveness was higher with the cutoff wall located in the tidal range (Figure 5, x = 23 m). There was a larger USP than those under the other location conditions, and the SW further retreated seaward. When the wall (location is x = 23 m) height was small (Figure 8, h = 2.3 m), the Toe size was 22.68 m, and under a wall depth of 6.3 m, the Toe decreased to 19.04 m. These results suggested that constructing the wall in the tidal range can successfully control the SWI phenomenon, and the effectiveness increased with increasing cutoff wall depth.
Coastal aquifers provide an important freshwater resource for industry and agriculture in coastal zones. Our results demonstrated that cutoff walls can decrease the freshwater flux and increase freshwater storage in the aquifer. With cutoff wall construction, the freshwater flow and TDOC discharge into the sea decreased (Figures 7B and 11, respectively). The freshwater flux decreased with increasing cutoff wall depth. It decreased from 0.467 to 0.354 m2 s-1 as the cutoff wall depth was increased from 2.3 to 6.3 m. These results suggested that cutoff walls within the tidal range can successfully decrease the freshwater discharge, and the effectiveness increases with increasing cutoff wall depth.
In Sections 4.1 and 4.2, we found that nitrification mainly occurred in the surface layer, and denitrification occurred in the middle and shallow layers because the deep O2 was consumed by nitrification and aerobic respiration, while the deep NO3- was consumed by denitrification due to the longer residence time. Notably, we found that the total mass of NO3- inflow, the mass of NO3- denitrification, and the RN increased with wall depth.
Denitrification plays an important role in the removal of NO3- in aquifers (Anwar et al., 2014), which facilitates NO3- removal by increasing denitrification. Therefore, we could construct a wall within the tidal range to successfully increase the mass of NO3- denitrification and the NO3- removal efficiency (RN) with a suitable depth of the cutoff wall, which should also be considered for the actual ecosystem, as shown in Section 4.2.
From Figure 12 and Table 8, we found that SDOC promotes greater NO3- removal. In addition, these results support field observations of the role of DOC in moderating NO3- fluxes into coastal ecosystems (Kim et al., 2017). This has important implications for beach managers. These results are expected to provide a theoretical reference for the ecological restoration of coastal tidal flat wetlands. Therefore, we can inject dissolved organic carbon (DOC) at the bottom of the wall to enhance the denitrification rate and increase the NO3- removal efficiency, leading to higher NO3- attenuation.
5.2 Future work and other influencing factors
This study examined the effect of cutoff walls located in the tidal range on NO3- removal and the salinity distribution in an aquifer and evaluated the importance of the cutoff wall location and depth under tidal action. Tides and waves are important components of ocean forcing (Kong et al., 2016); they can induce saltwater circulation in shallow and seaward aquifers, and their physical and chemical activities are extremely complex (Robinson et al., 2007; Xin et al., 2010). Although Anwar et al. (2014) showed that waves can modify the subsurface discharge pathways for terrestrial nutrients and enhance the transformation of these nutrients, their movement mechanism after cutoff wall insertion remains unclear. Generally, previous studies adopted a single sinusoidal or cosine-shaped tide form; in fact, the tidal dynamics of the coastal zone are very complex (Werner, 2013; Robinson et al., 2018; Yu et al., 2019). These actors affect the influence of the cutoff wall on NO3- removal and the salinity distribution in aquifers, which should be investigated in the future.
For simplicity, we used a fixed inland water table. In coastal aquifers, freshwater resources are available for the population. Currently, with the increase in population and economic development, over-exploitation of groundwater has led to groundwater level decreases, and rainfall and evaporation (Zhang et al., 2014) have exacerbated the complex changes in groundwater surroundings. Sea level rise caused by climate change causes challenges in cutoff wall deployment within the tidal range to control the salinity distribution. These factors should also be considered in future work.
In addition, other hydrological and biogeochemical factors, such as the availability and concentration of nutrients, residence and reaction time scales of solutes (Shuai et al., 2017), sediment heterogeneity (Yu et al., 2019; Kreyns et al., 2020), unsaturated zone flow (Luo et al., 2018; Luo et al., 2021a), and aquifer geometry (Luo et al., 2021b), were not considered here, which could potentially impact the NO3- removal rate and its efficiency. These factors can also determine the influence of cutoff walls on NO3- removal and the salinity distribution.
6 Conclusion
In this study, we developed a 2-D coupled variable-saturation, variable-flow, and biogeochemical model to examine the combined effects of cutoff walls on the fate of NO3-, the NO3- removal rate, and the salinity distribution in aquifers. We investigated the impacts of the location and depth by examining the changes in the saltwater toe location and NO3- removal in the aquifer before and after subsurface barrier construction. We assessed the importance of the cutoff wall location and depth. The following conclusions can be drawn:
-
The cutoff wall can affect the groundwater flow and salinity distribution in coastal unconfined aquifers. The cutoff wall located within the tidal range can induce a larger USP and decrease the length of the SW. Changes in the location of the cutoff wall can significantly influence the size of the seawater and NO3- contaminated area, increase freshwater storage, and mitigate NO3- contamination.
-
In the intertidal zone, a deeper cutoff wall can lead to a further increase in the NO3- mass of denitrification and NO3- removal efficiency and a further decrease in the length of the SW and the freshwater flux.
-
Under the influence of terrestrial dissolved organic carbon, the cutoff wall not only promotes greater NO3- removal but also significantly decreases the terrestrial dissolved organic carbon discharge into the sea.
-
DOC is a key factor controlling denitrification rates and distributions. Injecting DOC (SDOC) at the bottom of the wall can effectively promote the denitrification rate and lead to higher NO3- attenuation.
This study revealed the influence of cutoff walls on the fate of NO3-, the NO3- removal rate, and the salinity distribution in aquifers and demonstrated the importance of the cutoff wall depth, which provides guidance for the removal of NO3- contamination and mitigation of SWI. It should be noted that this study assumed that the aquifer is a homogeneous and isotropic medium, while real aquifers comprise heterogeneous and anisotropic media, which will be the focus of future research.
Statements
Data availability statement
The original contributions presented in the study are included in the article/supplementary material. Further inquiries can be directed to the corresponding author.
Author contributions
JK: Investigation, Methodology, Resources, Funding acquisition Conceptualization, Writing - original draft, Writing - review and editing. CG: Resources, Writing - review and editing. Visualization, Supervision. CJ: Writing - review and editing. JW: Writing - review and editing. XG: Writing - review and editing. LJ: Writing - review and editing. All authors contributed to the article and approved the submitted version.
Funding
This research was supported by the National Key R&D Program of China (2021YFB2600200), the National Natural Science Foundation of China (51979095), the Qing Lan Project of Jiangsu Province (2020).
Conflict of interest
The authors declare that they have no known competing financial interests or personal relationships that could have appeared to influence the work reported in this paper.
Publisher’s note
All claims expressed in this article are solely those of the authors and do not necessarily represent those of their affiliated organizations, or those of the publisher, the editors and the reviewers. Any product that may be evaluated in this article, or claim that may be made by its manufacturer, is not guaranteed or endorsed by the publisher.
References
1
Abarca E. Karam H. Hemond H. F. Harvey C. F. (2013). Transient groundwater dynamics in a coastal aquifer: The effects of tides, the lunar cycle, and the beach profile. Water Resour. Res.49, 1–16. doi: 10.1002/wrcr.20075
2
Abdoulhalik A. Ahmed A. A. (2017). The effectiveness of cutoff walls to control saltwater intrusion in multi-layered coastal aquifers: Experimental and numerical study. J. Environ. Manage.199, 62–73. doi: 10.1016/j.jenvman.2017.05.040
3
Abdoulhalik A. Ahmed A. Hamill G. A. (2017). A new physical barrier system for seawater intrusion control. J. Hydrology.549, 416–427. doi: 10.1016/j.jhydrol.2017.04.005
4
Anwar H. O . (1983). The effect of a subsurface barrier on the conservation of freshwater in coastal aquifers. Water Research17(10), 1257–1265. doi: 0.1016/0043-1354(83)90250-6
5
Anwar N. Robinson C. Barry D.A. (2014). Influence of tides and waves on the fate of nutrients in a near shore aquifer: Numerical simulations. Adv. Water Resour.73 (2014), 203–213. doi: 10.1016/j.advwatres.2014.08.015
6
Bardini L. Boano F. Cardenas M. B. Revelli R. Ridolfi L. (2012). Nutrient cycling in bed-form induced hyporheic zones. Geochimica Cosmochimica Acta84, 47–61. doi: 10.1016/j.gca.2012.01.025
7
Botero-Acosta A. Donado L. D. (2015). Laboratory scale simulation of hydraulic barriers to seawater intrusion in confined coastal aquifers considering the effects of stratification. Proc. Environ. Sci.25, 36–43. doi: 10.1016/j.proenv.2015.04.006
8
Buquet D. Sirieix C. Anschutz P. Malaurent P. Charbonnier C. Naessens F. (2016). Shape of the shallow aquifer at the fresh water-cea water interface on a high-energy sandy beach. Estuarine Coast. Shelf Sci.179, 79–89. doi: 10.1016/j.ecss.2015.08.019
9
Burow K. R. Nolan B. T. Rupert M. G. Dubrovsky N. M. (2010). Nitrate in groundwater of the united states 1991–2003. Environ. Sci. Technol.44, 4988–4997. doi: 10.1021/es100546y
10
Cardenas M. B. Bennett P. C. Zamora P. B. (2015). “Devastation of aquifers from tsunami-like storm surge by supertyphoon haiyan,” in (Agu Fall Meeting. American Geophysical Union: Fall Meeting).
11
Chang Q. Zheng T. Zheng X. Zhang B. Sun Q. Walther M. (2019). Effect of subsurface dams on saltwater intrusion and fresh groundwater discharge. J. Hydrology576, 508–519. doi: 10.1016/j.jhydrol.2019.06.060
12
Charbonnier C. Anschut P. Poirier D. Bujan S. Lecroart P. (2013). Aerobic respiration in a high-energy sandy beach. Mar. Chem.155, 10–21. doi: 10.1016/j.marchem.2013.05.003
13
Chmura G. L. Anisfeld S. C. Cahoon D. R. Lynch J. C. (2003). Global carbon sequestration in tidal, saline wetland soils, global biogeochem. Cycles17 (4), 1111. doi: 10.1029/2002GB001917
14
Christy R. M. Lakshmanan E. (2017). Percolation pond as a method of managed aquifer recharge in a coastal saline aquifer: A case study on the criteria for site selection and its impacts. J. Earth System Sci.126 (5), 66. doi: 10.1007/s12040-017-0845-8
15
Fang Y. H. Zheng T. Y. Wang H. Zheng X. L. Walther M. (2022). Nitrate transport behavior behind subsurface dams under varying hydrological conditions. Sci. Total Environ.838, 10. doi: 10.1016/j.scitotenv.2022.155903
16
Gao C. Kong J. Zhou L. Shen C. Wang J. (2023). Macropores and burial of dissolved organic matter affect nitrate removal in intertidal aquifers. J. Hydrology617 (2023), 129011. doi: 10.1016/j.jhydrol.2022.129011
17
Geng X. Michael H. A. Boufadel M. C. Molz F. J. Gerges F. Lee K. (2020). Heterogeneity affects intertidal flow topology in coastal beach aquifers. Geophysical Res. Lett.47, e2020GL089612. doi: 10.1029/2020GL089612
18
Heiss J. W. Michael H. A. (2014). Saltwater-freshwater mixing dynamics in a sandy beach aquifer over tidal, spring-neap, and seasonal cycles. Water Resour. Res.50, 6747–6766. doi: 10.1002/2014WR015574
19
Jang E. He W. Savoy H. Dietrich P. Kolditz O. Rubin Y. et al . (2017). Identifying the influential aquifer heterogeneity factor on nitrate reduction processes by numerical simulation. Adv. Water Resour.99, 38–52. doi: 10.1016/j.advwatres.2016.11.007
20
Kaleris V. K. Ziogas A. I. (2013). The effect of cutoff walls on saltwater intrusion and groundwater extraction in coastal aquifers. J. Hydrology476, 370–383. doi: 10.1016/j.jhydrol.2012.11.007
21
Kim K. H. Heiss J. W. Michael H. A. Cai W. J. Laattoe T. Post V. (2017). Spatial patterns of groundwater biogeochemical reactivity in an intertidal beach aquifer. Journal f Geophysical Research: Biogeosciences. 122, 2548–2562. doi: 10.1002/2017JG003943
22
Knights D. Sawyer A. H. Barnes R. T. (2017). Tidal controls on riverbed denitrification along a tidal freshwater zone. Water Resour. Res.53 (1), 799–816. doi: 10.1002/2016WR019405
23
Kong J. Luo Z. Shen C. Hua G. Zhao H. (2016). An alternative Boussinesq equation considering the effect of hysteresis on coastal groundwater waves. Hydrological Processes. 30, 2657–2670. doi: 10.1002/hyp.10810
24
Kreyns P. Geng X. Holly A.M. (2020). The influence of connected heterogeneity on groundwater flow and salinity distributions in coastal volcanic aquifers. J. Hydrology586, 124863. doi: 10.1016/j.jhydrol.2020.124863
25
Kringel R. Rechenburg A. Kuitcha D. Fouépé A. Bellenberg S. Kengne I. M. et al . (2016). Mass balance of nitrogen and potassium in urban groundwater in central Africa, Yaounde/Cameroon. Sci. Total Environ.547, 382–395. doi: 10.1016/j.scitotenv.2015.12.090
26
Kuan W. K. Xin P. Jin G. Robinson C. E. Gibbes B. Li L. (2019). Combined effect of tides and varying inland groundwater input on flow and salinity distribution in unconfined coastal aquifers. Water Resour. Res.55, 8864–8880. doi: 10.1029/2018WR024492
27
Li L. Barry D. A. Santos I. R. Xin P. Charette M. A. Robinson C. E. (2017). Groundwater dynamics in subterranean estuaries of coastal unconfined aquifers: controls on submarine groundwater discharge and chemical inputs to the ocean. Adv. Water Resour.115, 315–331. doi: 10.1016/j.advwatres.2017.10.041
28
Li F. Chen X. Liu C. Lian Y. He L. (2018). Laboratory tests and numerical simulations on the impact of subsurface barriers to saltwater intrusion.Nat. Hazards91, 1223–1235. doi: 10.1007/s11069-018-3176-4
29
Lu C. Shi W. Xin P. Wu J. Werner A. D. (2017). Replenishing an unconfined coastal aquifer to control seawater intrusion: Injection or infiltration? Water Resources Res.53(6), 4775–86. doi: 10.1002/2016WR019625
30
Lu J. Bai Z. Velthof G. Wu Z. Chadwick D. Ma L. (2019). Accumulation and leaching of nitrate in soils in wheat-maize production in China. Agric. Water Manage.212, 407–415. doi: 10.1016/j.agwat.2018.08.039
31
Luo Z. Kong J. Shen C. Lu C. Xin P. Barry D. (2021a). Approximate analytical solutions for assessing the effects of unsaturated flow on seawater extent in thin unconfined coastal aquifers. Adv. Water Resour.160 (2022), 104104. doi: 10.1016/j.advw-atres.2021.104104
32
Luo Z. Kong J. Shen C. Xin P. Barry D. (2021b). Effects of aquifer geometry on seawater intrusion in annulus segment island aquifers. Hydrol. Earth Syst. Sci.25, 6591–6602. doi: 10.5194/hess-25-6591-2021
33
Luo Z. Shen C. Kong J. Hua G. Gao X. Zhao Z. (2018). Effects of unsaturated flow on hillslope recession characteristics. Water Resour. Res.54, 2037–2056. doi: 10.1002/2017WR022257
34
Luyun R. Momii K. Nakagawa K. (2009). Laboratory-scale saltwater behavior due to subsurface cutoff wall. J. Hydrology.377 (3-4), 227–236. doi: 10.1016/j.jhydrol.2009.08.019
35
Luyun R. Momii K. Nakagawa K. (2011). Effects of recharge wells and flow barriers on seawater intrusion. Ground Water49(2), 239–249. doi: 10.1111/j.1745-6584.2010.00719.x
36
Robinson C. Li L. Barry D. A. (2007). Effect of tidal forcing on a subterranean estuary.Adv. Water Res.30 (4), 851–865. doi: 10.1016/j.advwatres.2006.07.006
37
Robinson C. E. Xin P. Santos I. R. Charette M. A. Li L. Barry D. A. (2018). Groundwater dynamics in subterranean estuaries of coastal unconfined aquifers: Controls on submarine groundwater discharge and chemical inputs to the ocean. Adv. Water Resour.115, 315–331. doi: 10.1016/j.advwatres.2017.10.041
38
Shammas M. I. Thunvik R. (2009). Predictive simulation of flow and solute transport for managing the salalah coastal aquifer, Oman. Water Resour. Manage.23, 2941–2963. doi: 10.1007/s11269-009-9417-2
39
Shen Y. Xin P. Yu X. (2020). Combined effect of cutoff wall and tides on groundwater flow and salinity distribution in coastal unconfined aquifers. J. Hydrology581 (2020), 124444. doi: 10.1016/j.jhydrol.2019.124444
40
Shuai P. Bayani Cardenas M. Knappett P. S. K. Bennett P. C. Neilson. B. T. (2017). Denitrification in the banks of fluctuating rivers: The effects of river stage amplitude, sediment hydraulic conductivity and dispersivity, and ambient groundwater flow. Water Resour. Res.53, 7951–7967. doi: 10.1002/2017WR020610
41
Spiteri C. Slomp C. P. Charette M. A. Tuncay K. Meile C. (2008). Flow and nutrient dynamics in a subterranean estuary (Waquoit bay, MA, USA): Field data and reactive transport modeling. Geochim. Cosmochim. Acta72, 3398–3412. doi: 10.1016/j.gca.2008.04.027
42
Sun Q. Zheng T. Zheng X. (2021). Effects of physical barrier on seawater intrusion and nitrate accumulation in upstream aquifers. J. Contaminant Hydrology243 (2021), 103913. doi: 10.1016/j.jconhyd.2021.103913
43
Sun Q. Zheng T. Zheng X. Chang Q. Walther M. (2019). Influence of a subsurface cutoff wall on nitrate contamination in an unconfined aquifer. J. Hydrol.575, 234–243. doi: 10.1016/j.jhydrol.2019.05.030
44
van Genuchten M. T. (1980). A closed-form equation for predicting the hydraulic conductivity of unsaturated soils1. Soil Sci. Soc Am. J.44 (5), 892 898. doi: 10.2136/sssaj1980.03615995004400050002x
45
Van Weert F. van der Gun J. Reckman J. (2009). Global overview of saline groundwater occurrence and genesis (Utrectht, the Netherlands: UNESCO and WMO).
46
Werner A. D. (2013). Seawater intrusion processes, investigation and management:recent advances and future challenges. Adv. Water resources.51, 3–26. doi: 10.1016/j.advwatres.2012.03.004
47
Wilson A. M. Gardner L. R. (2006). Tidally driven groundwater flow and solute exchange in a marsh:Numerical simulations. Water Resour.Res.42, W01405. doi: 10.1029/2005WR004302
48
Xin P. Robinson C. Li L. Barry D. A. Bakhtyar R. (2010). Effects of wave forcing on a subterranean estuary. Water Resour. Res.46 (12). doi: 10.1029/2010WR009632
49
Yang J. Graf T. Luo J. Lu C. (2021). Effect of cut-off wall on freshwater storage in small islands considering ocean surge inundation. J. Hydrology603, 127–143. doi: 10.1016/j.jhydrol.2021.127143
50
Yoshimoto S. Tsuchihara T. Ishida S. Imaizumi M. (2013). Development of a numerical model for nitrates in groundwater in the reservoir area of the komesu subsurface dam, Okinawa, Japan. Environ.Earth Sci.70, 2061–2077. doi: 10.1007/s12665-011-1356-6
51
Yu X. Xin P. Lu C. (2019). Seawater intrusion and retreated in tidally-affected unconfined aquifers: laboratory experiments and numerical simulations. Adv. Water Resour.132, 103393. doi: 10.1016/j.advwatres.2019.103393
52
Zhang C. Li L. Lockington D. (2014). Numerical study of evaporation-induced salt accumulation and precipitation in bare saline soils:Mechanism and feedback. Water Resour. Res.50, 8084–8106. doi: 10.1002/2013WR015127
53
Zhang B. Zheng T. Zheng J. Xin S. Zhang D. (2019). The influence of slope collapse on water exchange between a pit lake and a heterogeneous aquifer. Front. Environ. Sci. Eng.13 (2), 20. doi: 10.1007/s11783-019-1104-9
54
Zheng T. Gao M. Chang Q. Zheng X. Walther M. (2022). Dynamic desalination of intruding seawater after construction of cut-off walls in a coastal unconfined aquifer. Front. Mar. Sci.9. doi: 10.3389/fmars.2022.857807
55
Zheng T. Zheng X. Chang Q. Zhan H. Walther M. (2021). Timescale and effectiveness of residual saltwater desalinization behind subsurface dams in an unconfined aquifer. Water Resour. Res.57 (2), 1–18. doi: 10.1029/2020WR028493
Summary
Keywords
cutoff wall, salinity distribution, tide, denitrification, removal efficiency
Citation
Kong J, Gao C, Jiang C, Wang J, Gao X and Jing L (2023) Effect of the cutoff wall on the fate of nitrate in coastal unconfined aquifers under tidal action. Front. Mar. Sci. 10:1135072. doi: 10.3389/fmars.2023.1135072
Received
31 December 2022
Accepted
13 March 2023
Published
29 March 2023
Volume
10 - 2023
Edited by
Tianyuan Zheng, Ocean University of China, China
Reviewed by
Qinpeng Chang, Ocean University of China, China; Pengwei Zhang, Beijing Jiaotong University, China; Zhongnian Yang, Qingdao University of Technology, China
Updates
Copyright
© 2023 Kong, Gao, Jiang, Wang, Gao and Jing.
This is an open-access article distributed under the terms of the Creative Commons Attribution License (CC BY). The use, distribution or reproduction in other forums is permitted, provided the original author(s) and the copyright owner(s) are credited and that the original publication in this journal is cited, in accordance with accepted academic practice. No use, distribution or reproduction is permitted which does not comply with these terms.
*Correspondence: Jun Kong, kongjun999@126.com
This article was submitted to Marine Ecosystem Ecology, a section of the journal Frontiers in Marine Science
Disclaimer
All claims expressed in this article are solely those of the authors and do not necessarily represent those of their affiliated organizations, or those of the publisher, the editors and the reviewers. Any product that may be evaluated in this article or claim that may be made by its manufacturer is not guaranteed or endorsed by the publisher.