 Jinzhao Tian
 Yisheng Liu
- School of Economics and Management, Beijing Jiaotong University, Beijing, China
This study investigates the impact of China’s carbon emission trading (CET) framework on the green development of the construction sector, a topic that has been underexplored. Utilizing annual data from 107 publicly listed construction companies from 2007 to 2022, we apply green total factor productivity (GTFP) as a metric for green development. Our findings reveal that GTFP increased by 0.36 during this period. Using the Difference-in-Differences (DID) methodology, we account for factors such as market dimensions, ownership structure, financial stability, geographical location, and state financial aid. The interaction term coefficient in our model is 0.0089, significant at the 1% level, indicating that CET implementation has significantly improved GTFP in construction enterprises. Heterogeneity analysis further shows that the CET’s impact is more pronounced in large-scale, state-owned, highly indebted enterprises, those located in the eastern region, and those receiving government subsidies, with coefficients of 0.112, 0.0108, 0.0092, 0.0133, and 0.0099, respectively, all significant at the 1% level. These results underscore the importance of unified market development and tailored governance strategies. The study concludes with policy recommendations and calls for further research to explore CET’s nuanced impacts across different sectors and regions.
1 Introduction
The imperative to reduce emissions has become increasingly urgent as the climate continues to deteriorate. The Global State of Buildings and Construction Report 2022 reveals that carbon dioxide emissions from building operations surged to an unprecedented 10 billion tonnes in 2021, representing an increase over 2020 levels and surpassing the previous peak recorded in 2019 (Bahman et al., 2023). Consequently, the construction industry must integrate considerations of its ecological footprint into its operational frameworks, necessitating a transition towards low-carbon and sustainable development practices. There exists substantial potential for synergy between green development, corporate sustainability, and ecological resilience (Qin, 2023). Therefore, elevating the green development levels of construction enterprises has emerged as a pivotal issue in shifting from traditional production methodologies to sustainable long-term development within the industry.
Scholars have extensively studied methodologies to assess the degree of enterprises’ green development. Some have pursued quantitative assessment approaches through the construction of indicator measurement systems. For example, Wang et al. (2021) developed a comprehensive dark green evaluation index system for mineral resource listed companies, focusing on economic, environmental, and health perspectives. They identified managerial weaknesses and operational inefficiencies by evaluating enterprises’ green development statuses. Yang and Fang (2020) introduced the concepts of carbon dioxide and green credit indices to measure unexpected and green outputs of real estate enterprises, conducting both static and dynamic evaluations of their green productivity. Helman et al. (2023) identified critical green metrics pertinent to the automotive industry, particularly focusing on elements during a vehicle’s life cycle and potential data sources. Unlike the aforementioned studies, other scholars have approached the issue through qualitative analysis, focusing on developing theoretical frameworks and conceptual models for deeper examination. For instance, Tong and Zhang (2017) uses the external presentation layer, business support layer, and core layer to further explain the relationship between the green development capability of enterprises and suppliers, consumers, and the public, which improves the theoretical system of green development capability of enterprises. Ding and Yang (2019) establishes a green development reporting framework and green development indicators, and applies them to a case study of a Chinese textile enterprise, which provides a reference path for the enterprise to self-check and compare itself, and improve its own green development level. However, the application of these indicators lacks breadth, and it is difficult to circulate and use them in different evaluation calibres, which is insufficient to achieve intuitive comparison between different industries, regions and individuals. Green total factor productivity (GTFP), however, as a widely used green economic growth evaluation index has strong universality and comparability. The green development of enterprises is essentially the continuous improvement of GTFP, so this paper will use GTFP to measure the level of green development. Previous research on GTFP has mostly used econometric approaches to investigate the impact of economic and non-economic factors, as well as the interaction of input and output components. To realize enterprise green transformation, Chinese government has implemented carbon emission trading (CET) policy, which triggers a huge influence on various sectors. These policies also provide experiences for other economies to consider.
CET scheme aims to achieve emission reduction targets through a market-based approach. Within the framework of CET, emission quotas are established and allocated to participants through various mechanisms (Wang S. et al., 2022). Participants who emit less carbon dioxide than their allocated quota can trade surplus allowances in the market. Consequently, CET is recognized as a cost-effective mechanism for reducing emissions (Wang X. Q. et al., 2022). The Chinese carbon commercial market comprises eight percent of the global carbon market, amounting to approximately 4.5 billion tons (Zhang, 2022). This statistic highlights the extensive scope of China’s carbon trading system and its significant impact on the nation’s economic and societal structures. The building industry in China is markedly more energy-intensive compared to other sectors. Carbon emissions from the construction sector have been escalating, reaching approximately 2.1 billion tons in 2019, thus constituting a substantial proportion of the nation’s total emissions. This figure represents a threefold increase from the 2000 level of 668 million tons, reflecting a consistent annual growth rate of 6.96% (Bahman et al., 2023). Therefore, analyzing the impact of CET on green development through Green Total Factor Productivity (GTFP) is imperative for construction firms. This research is pivotal for advancing the building industry towards sustainability and efficiency within the global CET system.
GTFP, encompassing economic development, energy consumption, and environmental degradation, has become a critical indicator for academics studying corporate carbon reduction transitions and green development levels (Li et al., 2022). GTFP extends the traditional concept of Total Factor Productivity (TFP) by incorporating environmental elements to assess the efficiency of corporate inputs and outputs (Zhou et al., 2023). Firms adopting this methodology acknowledge that economic prosperity should not come at the expense of the environment, thereby promoting sustainable and ecologically conscious advancement (Zhang et al., 2021). Researchers have identified several significant drivers of GTFP, including digital twin technology (Hao et al., 2023), remote development (Jian et al., 2023), artificial intelligence (Ying et al., 2023), the industry agglomeration effect (Cheng and Jin, 2022), and ecosystem protection (Cheng and Kong, 2022). Although these studies have explored the primary factors affecting GTFP, they have predominantly focused on the industry as a whole, neglecting the crucial role of construction enterprises in the carbon emission reduction market. Furthermore, these investigations have not adequately aligned their findings with current carbon emission reduction strategies. This study examines the impact of the Carbon Emissions Trading (CET) policy on construction companies’ GTFP, utilizing a Difference-in-Differences (DID) model on construction firms listed from 2007 to 2022. The research aims to elucidate how CET improves construction enterprises’ GTFP through empirical testing and additional analysis of its various roles. It aspires to guide China’s construction industry towards a sustainable development path that balances economic growth with environmental sustainability, energy efficiency, and emission reduction, while also providing significant insights for global counterparts pursuing green development.
In the context of enhancing corporate green development, numerous scholars have engaged in extensive discussions and research. These studies are concentrated in the following areas. First, system design has emerged as the most direct means for scholars to improve corporate green development. For instance, Xiong et al. (2023) investigated the impact and heterogeneity of establishing green standards on corporate green development. Aragòn-Correa et al. (2020), DeLaPaz (2013) and Vierra, (2016) found that both mandatory and recommended standards can guide companies in formulating their strategic plans and self-assessment goals, significantly advancing green development through the promotion of green innovation dissemination. Second, financial instruments, due to their close relationship with economy entity, have become vital in encouraging companies to improve their green development levels. Several research indicates that green financial products provide economic support for companies to adopt green practices, thereby promoting greater willingness among companies to engage in green behaviors. In terms of technological innovation in construction companies, new green building materials and creative designs aligned with sustainable development principles offer critical green elements to their products, ensuring that corporate planning is not merely theoretical. Additionally, some scholars have explored the role of green organizational culture and green knowledge management in enhancing employees’ green creativity, further driving corporate green development. Jiang et al. (2020a) developed an employee green creativity scale from four dimensions: green creative motivation, thinking, behavior, and outcome, to promote green development from the perspective of enhancing employees’ green creativity. Wang S. et al. (2022) demonstrated that green knowledge management enhances an organization’s capacity for green innovation and achieving sustainable development goals.
However, the current research gap lies in the fact that these studies focus on companies across various industries without specific data and circumstances for any particular sector. Although scholars like Jiang et al. (2022) have investigated the socio-economic and environmental effects of incorporating high oil-consuming and natural gas industries into the carbon emissions trading system, there is a significant gap in research on construction enterprises characterized by high energy consumption and long project cycles. This makes it challenging for managers and policymakers in the construction industry to obtain effective guidance when formulating green development strategies. Therefore, there is a lack of comprehensive and effective post-evaluation mechanisms to ensure the effective implementation and continuous improvement of green production measures. The aim of this paper is to fill this research gap.
As previously mentioned, research on the green development levels of construction enterprises is currently very limited. Thus, the primary contribution of this study is its targeted use of data from the construction sector, focusing on analyzing the impact of the CET policy on construction enterprises. This avoids the pitfall of analyzing the entire industry while ignoring sector-specific characteristics. Secondly, this study innovatively explores the green development direction of construction enterprises from the perspective of the post-implementation effects of the policy. This research not only provides policymakers with a framework for analyzing the construction industry but also offers industry managers a mechanism for self-evaluation. Thirdly, as the world’s largest developing country, China’s issues and solutions regarding the green development of its construction enterprises offer valuable insights for all other developing countries and regions. Other developing countries facing similar issues can adopt this study’s theoretical framework, combined with their own circumstances, to further explore the green development levels of local construction enterprises and the implementation of the CET policy. Lastly, the heterogeneity analysis in this study further examines the reactions of different types of construction enterprises to the CET policy, deeply integrating the characteristics of construction enterprises and addressing the often-overlooked issue of how to enhance their green development levels.
The remainder of this study is structured as follows. Section 2 outlines the related work including key factors, methodology and research hypotheses as well as model construction. Section 3 describes the model results. Section 4 shows the tests of robustness. Section 5 proposes the mechanism test. Section 6 demonstrates the heterogeneity analysis. Finally, Section 7 summaries the conclusions and policy recommendations.
2 The related work
2.1 The significance of CET policy for building companies green development
Carbon trading policy, being a prominent environmental regulatory instruments, has emerged as the primary mechanism for encouraging the transition to sustainable practices in construction firms. China’s CET policy has garnered substantial practical insights throughout its execution and is poised to supplant the EU Emissions Trading System (ETS) as the world’s largest carbon market. Consequently, an examination of China’s carbon trading landscape stands to enhance the global understanding of carbon trading mechanisms in developing nations. This development has triggered a surge of scholarly research aimed at evaluating the efficacy of CET policies, with numerous academics analyzing CET through the lenses of macroeconomics and public policy design (Dong et al., 2013; Zhao et al., 2016; Munnings et al., 2016).
Studying the impact of CET policy on the green development of construction enterprises has become imperative for promoting sustainability in the construction industry. In the carbon emission regimes of Europe and the United States, specific carbon-emitting devices or facilities have become the focus of their rules (Zhang, 2015). In contrast to the CET frameworks in western countries, China’s CET policy mainly focus economic entities such as enterprises rather than specific devices. Consequently, utilizing enterprise data to analyze China’s CET market represents a prevailing approach in contemporary research. This approach not only aids policymakers in comprehending CET policy implementation but also enables construction company managers to gain a clearer insight into their economic standing and future strategic endeavors.
Consequently, attaining a thorough comprehension of the influence of CET policies on the sustainable growth of construction enterprises, elucidating the primary regulators and mediating factors, and evaluating policy responses across diverse scenarios are imperative for advancing the sustainability agenda within the construction sector. This approach not only facilitates the progression towards eco-friendly practices but also contributes to the enhancement of the global carbon trading framework’s theoretical underpinnings. The outcomes of such investigations offer a spectrum of strategies aimed at bolstering the efficacy of carbon trading markets in developing nations.
2.1.1 Measurement of GTFP
Initial economic development theories, including the Solow growth model and the endogenous growth model, posited that sustainability relied solely on technological advancement, as indicated by Total Factor Productivity (TFP). However, these models failed to take into account the larger socioeconomic advantages of resource exploitation as well as environmental factors (Chen and Golley, 2014). With energy and environmental limits increasingly hampering economic growth, the oversight became apparent when production resources needed to be redirected to environmental management activities, slowing economic advancement (Liu et al., 2020). The Asian Productivity Organization introduced the concept of GTFP in the 1990s to address this issue by supporting a holistic strategy that increases productivity while also promoting environmental stewardship. Subsequent research has focused on methods for evaluating green productivity growth in order to more properly assess economic sustainability (Liu et al., 2020). In this setting, studies concentrating on GTFP indicators that account for energy and environmental performance have increased, emphasizing their importance. Xia and Xu (2020) used GTFP to analyze the quality of China’s economic growth, revealing disparities between GTFP and traditional TFP measurements that exclude environmental concerns, with certain northeastern areas outperforming and others in the western region behind. Additional research looked into the factors that drive China’s green productivity growth, focusing on the effects of economic scale, structure, technological advancement, and innovation. Further research has examined the impact of governmental policies and regulatory systems on green productivity. Providing essential insights for understanding variances in green productivity and instructing policymakers on how to promote green economic advancement.
In the measurement of GTFP, scholars have engaged in explorations, leading to two main controversies. Firstly, there is debate on how to appropriately incorporate environmental factors into the production function. In 1983 Pittman was among the first to consider environmental pollution factors in economic models by accounting for pollution costs and integrating them into product prices for analysis (Tyteca, 1996). Färe (1989), Chung et al. (1997) applied directional distance functions (DDF) to estimate green TFP, incorporating environmental pollution emissions as an “undesirable output” into the model, a method widely acknowledged (Chung et al., 1997). Subsequently, Zhao et al. (2020) attempted to consider environmental pollution emissions, previously regarded as “undesirable output,” as an input factor similar to capital and labor. Scheel, (2001) recalculated environmental pollution values by taking their reciprocal and incorporating them into the model, converting “undesirable output” into “desirable output.” However, both approaches by Scheel, (2001) is contradictory to the actual production process of enterprises. Secondly, controversy exists regarding the methods used to calculate the final efficiency values after constructing production function models considering undesirable outputs. Reviewing the extant literature suggests that major estimating approaches now include: 1) The Solow residual method, akin to conventional TFP estimation, derives from Solow’s growth theory. Hu et al. (2022) applied this technique to assess green TFP across various Chinese regions. 2) The nonparametric frontier analysis approach, as utilized by Feng et al. (2018), is prevalent for GTFP estimation, emphasizing the relative efficiency of inputs and outputs. Additionally, Tao et al. (2016) introduced an innovative Slacks-Based Measure (SBM) model that incorporates undesirable outputs, offering a novel methodology for evaluating green economic efficiency. Nonetheless, it is crucial to emphasize that this method is best suited for static assessments and does not capture the productivity dynamics of Decision-Making Units (DMUs) throughout multiple years. In contrast, incorporating unwanted outputs into the Malmquist-Luenberger (ML) index allows for a more precise measurement of DMU productivity improvements over time. Li and Chen (2021) created the SBM-ML model, which combines the SBM technique with unwanted outputs and a fixed ML index to precisely determine the extent of GTFP. This methodology combines nonparametric frontier analysis and the Malmquist-Luenberger index to provide a comprehensive tool for analysis. Researchers such as Wu et al. (2023) and Sun et al. (2021) have applied above approach to explore the basic operational mechanisms of green development in a company. Through studying previous research process, we calculated GTFP by appling SBM-ML model.
It is noteworthy that the academic community has identified indices similar to GTFP, namely, the Green Technology Efficiency Change Index (GTECI) and the Green Technology Progress Change Index (GTPCI). The GTECI assesses variations in the efficiency of factor utilization. This index is comprehensive, encompassing both the efficiency improvements brought about by technological advancements and the changes in efficiency due to the reallocation of production factors. Moreover, this index captures changes in economies of scale resulting from institutional innovation and the accumulation of experience within enterprises (Zhong, C et al., 2024). The GTECI is calculated primarily by comparing the production efficiency of different enterprises or units at a specific point in time. While, GTPCI measures the extent of technological advancement within a specific field or industry. It reflects the degree of innovation and development in technology, serving as an essential tool for evaluating the speed and direction of technological progress. The GTPCI is typically calculated by comparing changes in specific technological indicators over different time periods (Luo, Q., et al., 2019). In this study, we employed the growth rate method to compute this index, which involves calculating the growth rate of a particular technological indicator between two points in time. This research introduces the aforementioned indices to assist in analyzing the green development levels of construction enterprises over the past 15 years.
2.1.2
DMU, which functions at the minimum level of production, refers to the separated listed firms in the database of this research. Assume there are DMUs, represented by
In Eq. 1,
2.1.3 Malmquist indicator
Malmquist index was devised by Sten Malmquist in 1953. Subsequently, Chung et al. (1997) modified this model to create the ML index, which extends the Malmquist framework to encompass undesirable outputs through the directional distance function. Any Malmquist index that accounts for unwanted outputs will now be referred to as the ML productivity index, or simply the ML indicator. The ML indicator developed as follows:
The collection of reference for the unit duration is denoted by
The DMU0 flux from duration t to t + 1 is denoted as
Calculated steps:
In this study, we employ the method developed by Li and Chen’s (2021) to determine the green development efficiency value for the base period, designating 2007 as the baseline year. The GTFP of a listed firm in a specific period, relevant to the initial duration (the starting time in the dataset under inquiry), can be seen as below:
By putting Eq. 2 into Eq. 3, we show that the both sides of the equation are identical. As a result, Eq. 3 calculates the GTFP for all listed firms compared to the base period. This enables for a thorough comparison of these organizations’ productivity, both horizontally and vertically.
2.1.4 Calculation result
Based on the above, this study calculates the GTFP, GTECI, and GTPCI of Chinese listed construction enterprises from 2007 to 2022. Due to the large number of specific enterprises involved, we averaged the values for each year to obtain the annual average values for all listed construction enterprises, thereby studying the overall green development situation of the enterprises. The specific values are shown in Table 1. Figure 1 illustrates the trend changes of the three indices from 2007 to 2022. Figure 1 indicates that the trends of GTFP and GTECI are largely consistent. Both indices increased from 0.74 to 1.15. This data shows that from 2007 to 2022, the GTFP of listed construction enterprises in China rose by 41%. Notably, following the implementation of the CET policy in 2013, the GTFP increased by 24%. In contrast, the increase from 2007 to 2013 was 16.8%. To investigate whether this rapid increase is attributable to the CET policy, this study proposes a hypothesis and will establish a model for verification. Over the past 15 years, the GTPCI has remained relatively unchanged, consistently maintaining a value of 1. This indicates that there have been no significant breakthroughs in innovation related to green production technologies and processes in the Chinese listed construction industry over this period. This phenomenon warrants the attention of both industry professionals and government authorities.
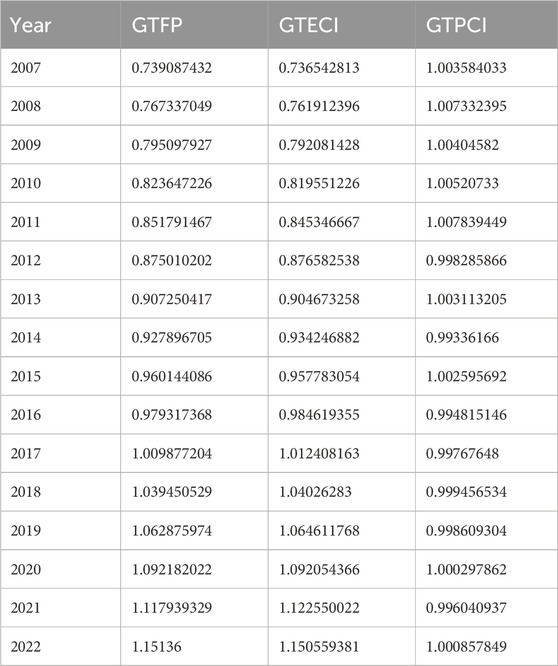
Table 1. The annual average value of GTFP, GTECI, and GTPCI of listed construction companies in China from 2007 to 2022.
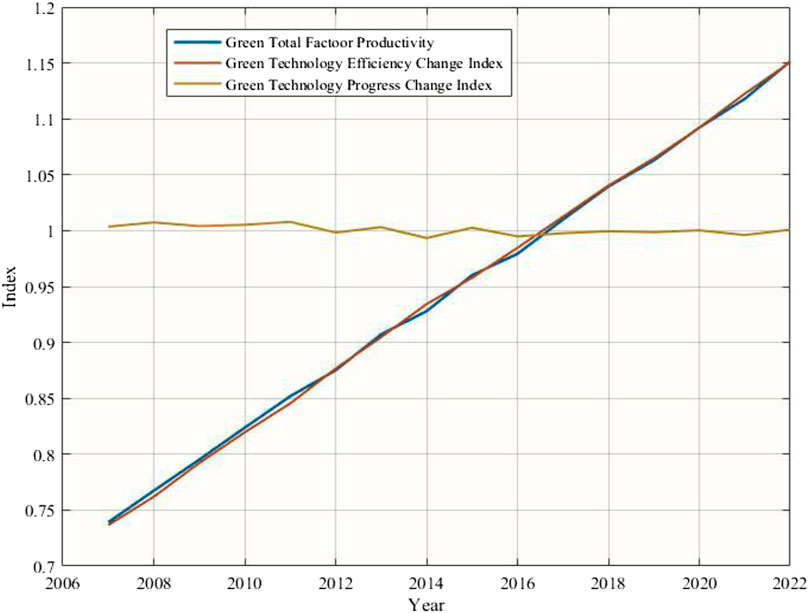
Figure 1. Development trend of GTFP, GTECI, and GTPC from 2007–2022.
2.2 Research hypotheses
2.2.1 Factors affecting green development level of building companies
Based on the literature review of previous studies, this research identifies the key factors influencing corporate green development and uses them as research variables in the foundational model. Various types of construction firms, each facing unique circumstances, exhibit varying levels of effectiveness in engaging with CET mechanisms. Jiang H. D et al. (2020) in their study elaborated that assessing environmental policies requires a combination of multiple factors, therefore this study will refer to the previous results to continue to assess the impact of CET policies on the level of green development of construction firms from a multifactorial perspective. More specifically, Li et al. (2022) posits that larger firms possess greater financial resilience, enabling them to navigate the financial demands of green transitions effectively and enhance their sustainability practices swiftly. In terms of shareholding structure, Hua et al. (2022) highlights state-owned enterprises’ (SOEs) notable social responsibility compared to private enterprises, as they often collaborate closely with local governments in China, demonstrating proactive commitment to green initiatives. In addition, financial considerations are indispensable for a business. Alonso-Martinez et al. (2021) underscores the role of green credit in supporting firms to implement sustainable business models, expediting their transition towards sustainability. Moreover, Chen Y et al. (2017) underscores the significance of subsidies in aiding enterprises to navigate transition periods, regain stability, and enhance their eco-friendly practices. Jiang et al. (2024) in his research emphasized that subsidies for renewable energy represent a relatively optimal approach to achieving green development, demonstrating the critical role of subsidies in enhancing levels of green development. Furthermore, technological innovation has garnered attention from numerous researchers. Gomes et al. (2024) emphasizes the pivotal role of green innovation in driving enterprises towards higher levels of environmental responsibility. Jiang et al. (2023) provides a detailed description of the characteristics of the agricultural sector, evaluates the impacts of different technological scenarios under the carbon reduction background on agricultural development, and emphasizes the influence of technological innovation on green transformation. Specifically, Jiang et al. (2020b) pointed out that carbon capture and storage technologies are crucial technologies in current green development. It is worth noting that China’s vast territory results in significant heterogeneity in carbon emissions reduction and green development levels across different regions, as evidenced in Jiang H. D. et al.’s (2023) study.
In summary, based on previous scholars’ utilization of factors influencing environmental policies and green development levels, this study selected enterprise size, ownership structure, debt levels, geographic location, subsidy acceptance, and technological innovation as influencing factors. Subsequently, it explores the development of green development levels among construction enterprises following their participation in the CET policy.
2.2.2 Theoretical hypotheses on the relationship between CET and GTFP
Carbon emission market prices internalize the external costs associated with construction enterprises’ carbon emissions, allowing for effective management of carbon emissions throughout production and operational activities. This regulation is largely assisted by cost drivers and profit incentives. Cost drivers refer to the commercialization of carbon emission rights, which is closely regulated by government bodies. Under such regulatory regimes, building businesses that need to emit more than their given quotas must get additional emission rights from the government or the market. This acquisition leads in additional environmental maintenance charges, which reduces the firm’s GTFP to some extent. Enterprises that fail to comply with environmental standards will suffer equivalent fines, raising their additional expenses and requiring all building enterprises to efficiently use carbon emission limits. Profit incentives are primarily expressed in the ability of carbon emissions rights to be sold within a specific market mechanism, hence enabling profit potential for participating firms. Using this strategy, construction companies can reduce carbon emissions through increased technical innovation while also collecting revenue by exchanging excess quotas. Specifically, if the expense incurred by a company to cut emissions falls below the prevailing carbon market rate, it has the opportunity to sell its surplus carbon emission allowances on a trading platform, profiting from the margin between expenditure of maintenance and sale price. This incentive mechanism implies that the better an enterprise’s efficiency in technological innovation, the cheaper its emission-reduction expenses and the higher its earnings from carbon trading. Carbon emission quotas are efficiently dispersed using market trading methods, resulting in lower carbon emissions and cheaper costs for all participating enterprises. Consequently, this research proposes Hypothesis 1 concerning the effectiveness of CET policies.
Hypothesis 1. Pilot carbon emissions trading policies enhance GTFP in construction enterprises.
2.2.3 Theoretical hypotheses of green innovation in CET and GTFP of construction firms
Scientific and technological advancements are critical for increasing organizations’ GTFP. Within the scope of designated carbon emission quotas, construction enterprises in pilot carbon emissions trading regions are increasingly focusing on developing emission reduction technology. This priority intends to minimize emission costs and increase efficiency, hence accelerating research into emissions-reducing technology, ultimately lowering prices and improving the effectiveness of carbon emission reduction activities. In contrast, building companies produce excess carbon emission quotas by implementing novel green emission reduction solutions. These excesses can then be traded on the carbon trading market, creating new opportunities for profit. From a strategic, long-term standpoint, the most effective way for construction enterprises to negotiate carbon emission regulations and minimize emission costs is to vigorously develop and implement carbon emission reduction technology. Given this circumstance, construction companies are actively involved in green innovation research and development in the context of carbon trading policies. Such occurrences not only ensure that the construction industry’s overall carbon emissions meet government-imposed emission constraints, but they also spark a wave of research into new carbon emission reduction technologies across the industry, thereby improving the GTFP of all industry enterprises. To study this, the paper looks at the path of green innovation and the conduction mechanism. Hypothesis 2 is provided to demonstrate that carbon emissions trading pilot regulations improve the GTFP of construction firms in pilot areas by encouraging enterprise innovation.
Hypothesis 2. Carbon emissions trading pilot policies drive enterprise innovation, increasing construction firms’ GTFP.
2.3 Model construction
The Difference-in-differences (DID) method is popular in econometrics and quantitative analysis. This study employs the DID approach to ascertain the influence of CET on the green development level of construction companies. DID has the advantage of being applicable to large-sample regressions and representing trends more accurately within huge datasets. This study includes data from 1,040 publicly traded construction companies, meeting the criteria for massive data situation. In management sciences, this approach employs observational data to replicate experimental research by comparing the effects of an intervention on a “treated group” to those on a “control group” within a quasi-experimental framework. This technique evaluates the effect of an intervention by analyzing and comparing the baseline characteristics or time-related changes during the output variable between the therapeutic and containment groups. Prior to conducting DID analysis, the time-series data for both groups must cover at least two periods: one before and one following the intervention. This method is extensively used to evaluate treatments or interventions including legislative passing, policy enactment, and mega project implementation.
The research framework of this article is structured as follows (see Figure2): First, the collected data is cleaned, and key research variables are extracted. Second, a basic model is established, and multicollinearity tests are conducted. Only models that pass the multicollinearity tests, confirming the absence of linear relationships among variables, proceed to the next stage of analysis. Third, conducting rigorous robustness tests on the basic model is essential to ensure the scientific validity of the analysis results. Therefore, parallel trend tests, placebo tests, propensity score matching, and mechanism tests will further evaluate the model’s reliability. Models that fail these tests will be redesigned until they meet the required standards. Finally, a heterogeneity analysis will be conducted to deeply examine the research results. As Figure 1 illustrated, this study analyzes the impact of CET policies on the green development level of construction enterprises based on market scale, ownership structure, financial structure, geographic location, and government subsidies.
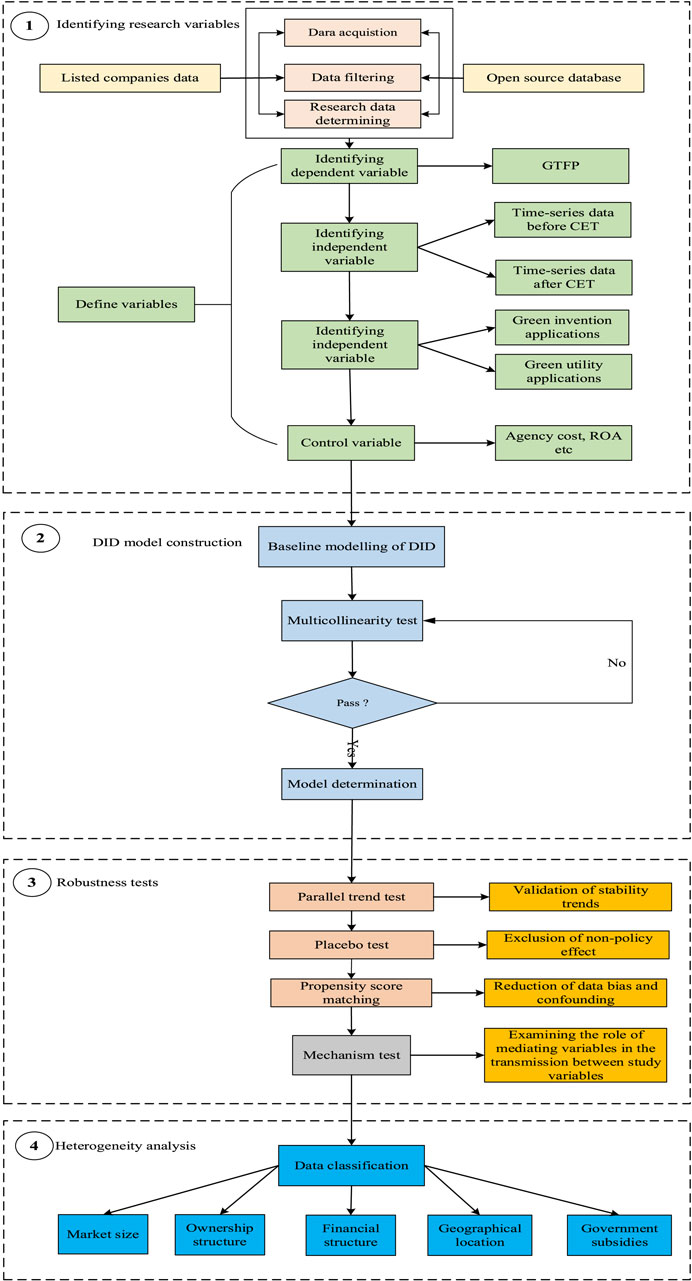
Figure 2. Research framework.
2.3.1 Description of variables
The sample of the study is the construction industry with a time horizon of 2007–2022 years, 107 companies with 15 years of annual data and a sample size of 1,029 observations were used in this study. The analysis tool is Stata 17.0.
For the dependent variables, GTFP is assessed using the non-radial SBM-ML index. Drawing on existing literature, we identified factors potentially influencing the GTFP of construction firms and chose the following as control variables to mitigate estimation bias: Firm market scale (Scale), Return on assets (Roa), Gearing ratio (Lev), agency cost (Cost), cash flow from operations (CF), factor intensity (Capital), and the shareholding ratio of the largest shareholder (Top1). The definitions of these variables are provided in Table 2.
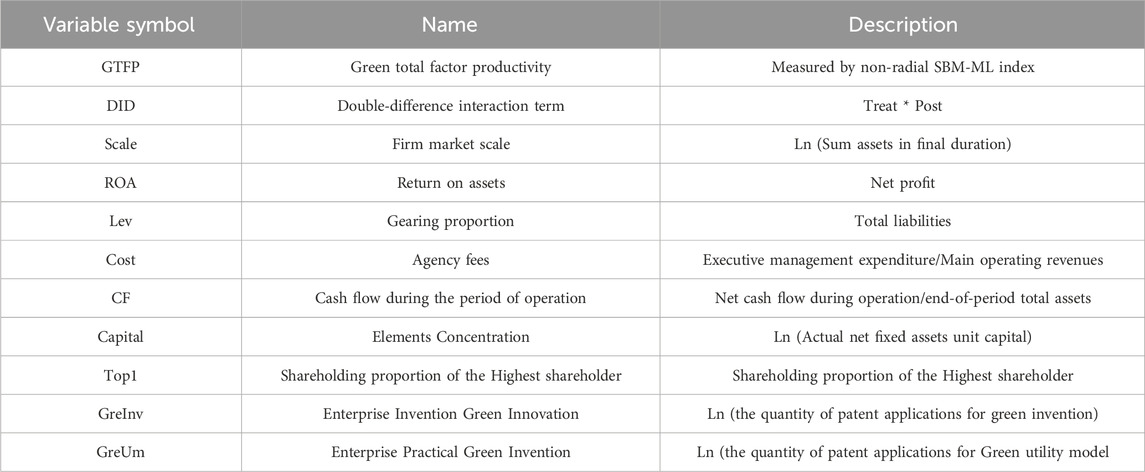
Table 2. Definitions of variables.
2.3.2 Construction of baseline model
To assess the influence of CET on the GTFP of construction businesses, the following model was developed for this study (see Eqs 4, 5):
To verify the presence of the mechanism effect, the subsequent model was developed as follows:
3 Analysis of empirical research
3.1 Sample selection and database
The listed corporate data is notable for its accessibility and correctness. Furthermore, data from publicly traded construction enterprises, often collected from their standardized annual reports, aids scientific research.
This study encompassed construction firms that are listed on the Shanghai Stock Exchanges and Shenzhen Stock Exchanges and adhere to construction sector classification guidelines established by the China Securities Regulatory Commission. Selected firms were involved in a range of sectors including property, urban street construction, engineering raw materials, and other citizens’ welfare infrastructure development corporation (to name a few facilities for culture, education, health, sports, and music), as well as monumental architecture and various other construction activities. The research assessed the effects of CET, green innovation, and GTFP on the civil engineering and construction sectors, utilizing annual data spanning from 2007 to 2022. The dataset was preprocessed and cleaned before being analyzed. Out of 1,728 construction firms, 699 were removed because they did not fit the study’s criteria, leaving 1,029 useable observations. The mentioned construction enterprises’ financials and quantity of green patents were collected from China National Research Data Services (CNRDS) (https://www.cnrds.com/) (accessed on 10 October 2023) and national patent databases (https://english.cnipa.gov.cn/index.html). The analysis used Stata 17.0’s “opreg” command, China stock market and accounting research database (www.gtarsc.com) (accessed on 11 August 2023). Supplementary data sources were Tonghuashun (https://www.10jqka.com.cn/; an information website of stock) and Finance of Sina (https://finance.sina.com.cn/). The focal variable, green creation, was quantified through the tally of green invention application and utility model application, indicative of technological progress. Data on green patent application were collected from China National Intellectual Property Administration (english.cnipa.gov.cn/) (accessed on 13 August 2023), categorized using green patent classification of world intellectual property organization (www.wipo.int/portal/en/index.html) (accessed on 15 August 2023) totally green invention applications. A linkage was identified between the quantity of green inventions and green creation level. The study encompassed 150,994 green invention patents and 20,389 green practically model applications. All of the above data is consolidated in the following links: https://github.com/Kriscoo/research-data-and-code-of-construction-companies-green-development.
Table 3 indicates a description of the statistics for key factors. Table 2 shows that the mean, minimum, and maximum GTFP values for construction enterprises are, and 1.146, respectively, with a standard deviation of 0.113, indicating significant variation and data dispersion. The mean quantity of green patents and practically applications unit firm stands at 1.06 and 1.273, respectively, with standard deviations being 1.377 and 1.422.
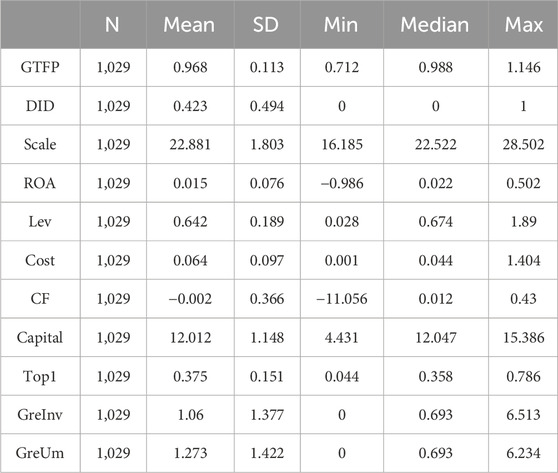
Table 3. Descriptive statistics.
3.2 Multicollinearity test
Multicollinearity occurs when the explanatory variables in a regression model exhibit strong or precise relationships, resulting in skewed or difficult-to-estimate outcomes. As for this study, we used the approach of Variance Inflation Factor (VIF) to assess the model for multicollinearity, with the goal of identifying and addressing any flaws. Significant multicollinearity is defined as a maximum VIF value greater than 10 (Kim, 2019). When all VIF values are less than 10, the model is considered to be free of multicollinearity. Multicollinearity reduces the dependability of model estimations, rendering the results questionable. Table 4 of this study demonstrates the absence of multicollinearity, as all VIF values are below 10. Therefore, this model does not suffer from multicollinearity.
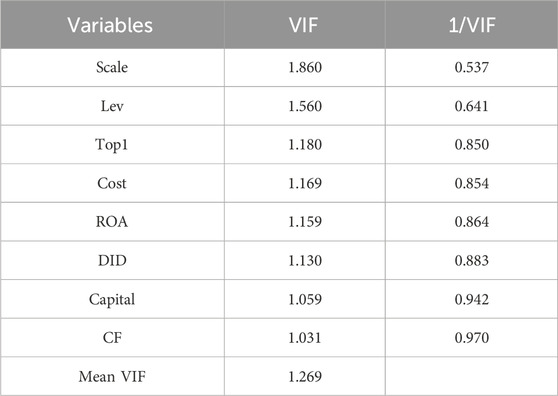
Table 4. Calculation of variance inflation factor.
3.3 Consequence of basic model analysis
The outcomes of basic regression models employed in this research are presented in Table below. In column (1) of Table 5, excluding control variables yet incorporating bidirectional fixation effects, exhibits a modulus of 0.0093, and it is statistically significant at the 1 percentage level. In second Column, which contains control variables but no fixed effects, has a coefficient of 0.0850, which is likewise substantially positive at the 1% level. The model displayed in third column, incorporating control variables and bidirectional fixation effects, yields a coefficient of 0.0089, statistically remarkable at the level of 1 percent. This denotes an impressive rise in GTFP for laboratory group, specifically an increase of 0.0089 units. Among the control variables, with all else constant, the coefficient for Lev is significantly positive, signifying a meaningful positive impact of Lev on GTFP. These findings suggests that CET policy may positively influence construction enterprises’ GTFP, providing preliminary support for Hypothesis 1. To increase the confidence of these findings, the study will perform a number of robustness checks. Moreover, the values for the models in Table 4 exceed 0.1, deemed an acceptable level of explanatory power given the complexity of the researched phenomena.
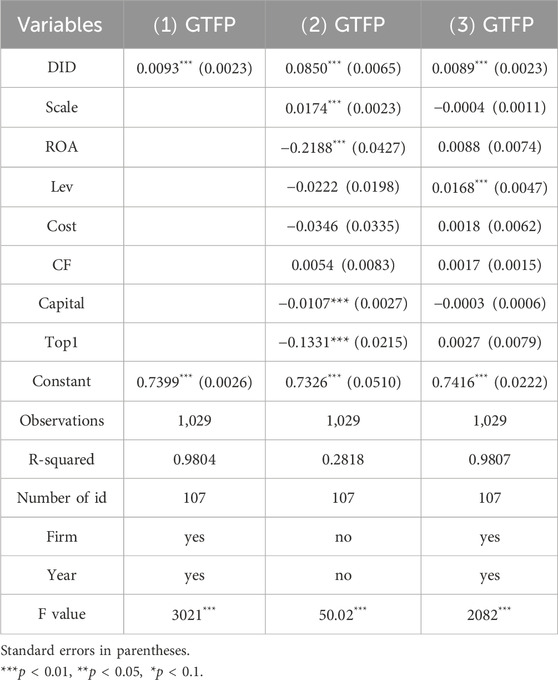
Table 5. The outcomes of basic regression models.
4 Test of robustness
4.1 Test of parallel trend
Employing DID method necessitates the parallel trends assumption, which posits that before realization of CET policy in 2013, experimental group’s data should align with the control group’s across various indicators, exhibiting parallel trajectories. If this criteria is not met, the DID model may be ineffective, resulting in biased results. To test for parallel trends, this study develops a regression equation using dummy variables, as shown below:
In the specified Eq. 6,
In Table 6, the first column is evident that coefficients are not significant in Pre
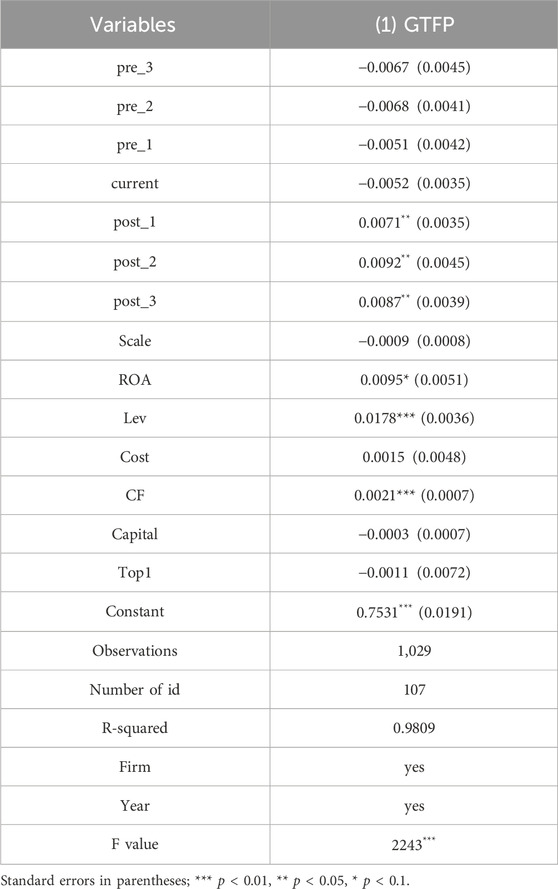
Table 6. The parallel trends results.
Visualizing the parallel trends test results, as shown in Figure 3, before and during the current period (such as, before the policy is implemented), demonstrates no remarkable differences in the dependent variable between controlled group and laboratory group. This result remains true even after accounting for control parameters such as Scale, ROA, Lev, Cost, CF, Capital, and Top1, all of which have confidence intervals that contain zero. This supports the parallel trend assumption. After the policy’s implementation, the lower limits of the modulus intervals for prior three periods are strictly above zero, suggesting that CET had a remarkable catalytic effect on GTFP.
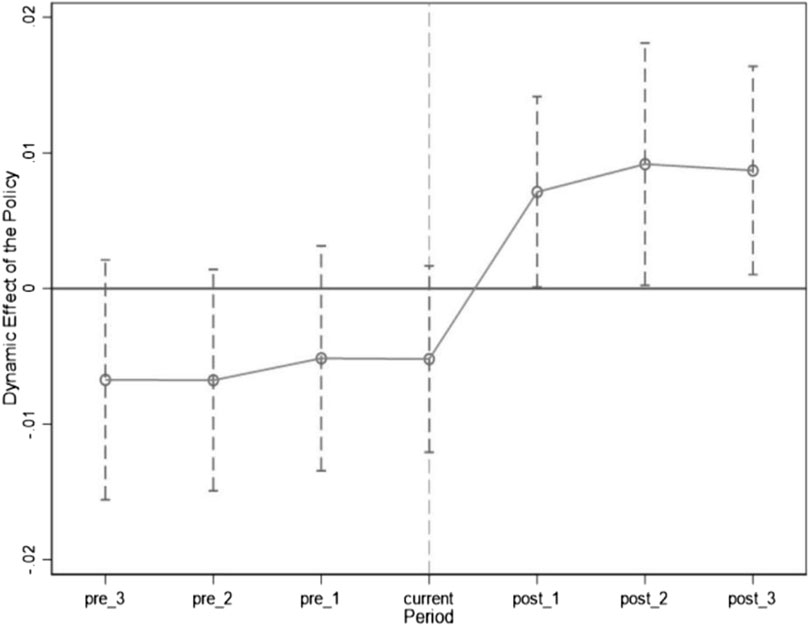
Figure 3. Visualization of parallel trend test results.
4.2 Test of placebo
The goal of placebo tests is to determine whether a policy or intervention actually caused the desired outcome. These tests are used to rule out the possibility of other unobserved factors influencing the findings, hence confirming the causality of the study’s conclusions. In the field of economics, placebo tests are employed to exclude the impact of non-policy factors on the study results. For example, if a policy is about to be implemented, it may affect the behavior and outcomes of the subjects under study, leading to errors in the so-called “policy effect.” Placebo tests help ascertain whether the policy is indeed the cause of the observed results.
To ensure the dependability of experimental research findings, this work follows Topalova’s (2010) methodology and employs a counterfactual testing approach for placebo tests. This entails changing the policy implementation dates in the sample data to 2009 and 2010—years before the actual carbon trading policy pilotand running regression analyses. If the carbon pricing policy pilot in 2013 had increased construction companies’ GTFP, the interaction term coefficients for these hypothetical pilot years should produce insignificant findings. As illustrated in columns (1) and (2) of Table 7, DID2009 and DID2010 are scenarios in which CET pilot policy is assumed to have been implemented in 2009 and 2010, respectively. The insignificance of the interaction term coefficients for both DID2009 and DID2010 confirms that the improvement non GTFP among construction enterprises is due to the carbon pricing pilot policy adopted in 2013. This data reinforces the notion that the carbon trading pilot scheme notably improved the GTFP of construction firms.
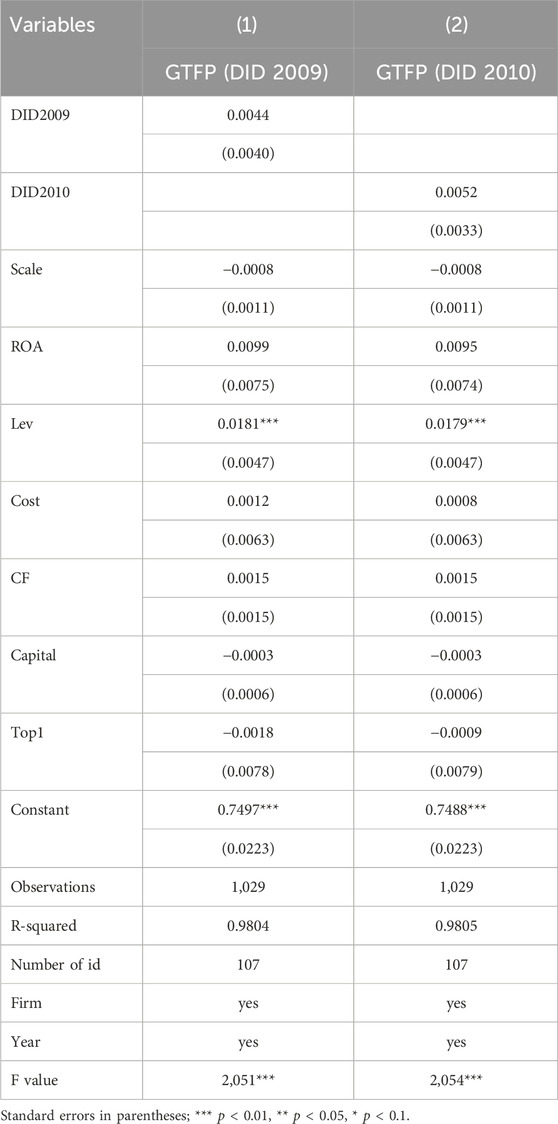
Table 7. Test result of placebo.
4.3 Propensity score matching
Studies indicate that CET pilot strategy enhances GTFP of construction businesses. Yet, these figures do not sufficiently depict the causal link between CET and GTFP of construction firms. Furthermore, business size and investment in technological development have a considerable impact on construction firms’ GTFP. To confirm that the rise in GTFP attributed to the carbon trading pilot policy is not accidental, it is essential to account for confounding factors like business size. As a result, this study uses propensity score matching to address sample selection bias, reducing disruptions to experimental outcomes and increasing the study’s robustness. Table 8 presents the methods of kernel, nearest neighbor and radius matching. The consistency in the sign and significant level of DID coefficients of interaction term with prior analyses suggests that the regression outcomes are robust. This reinforces previous regression findings that the carbon pricing pilot scheme significantly enhances GTFP in construction firms.
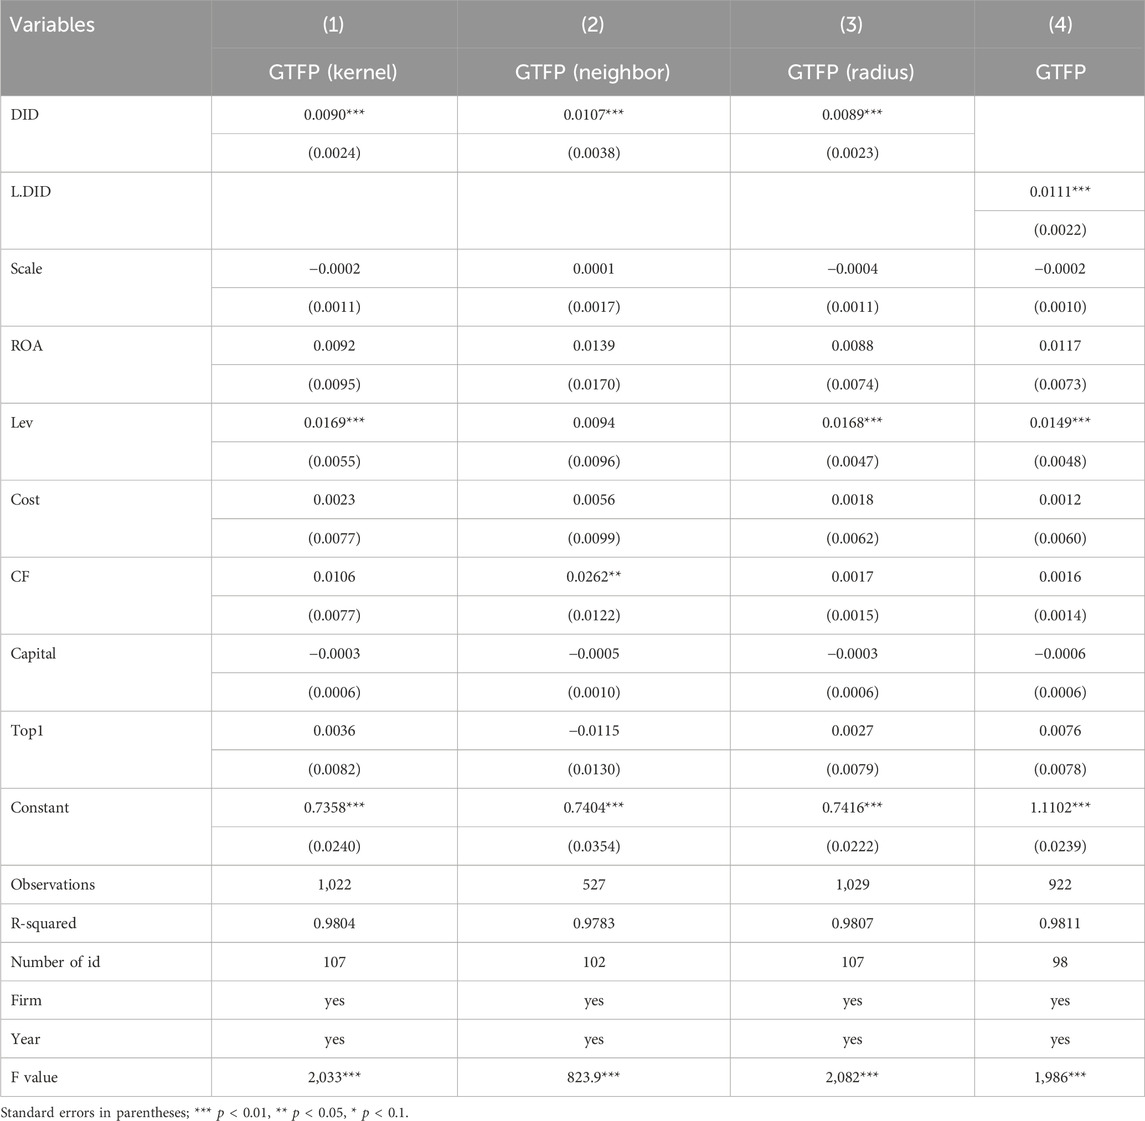
Table 8. Potential lagged effect results for CET.
4.4 Explanatory variables in one-period
In fourth column of Table 8 explores potential lagged effect of CET by analyzing key explanatory elements in subsequent duration, as denoted by the modulus L.DID. The data demonstrate that regression modulus consistently remain significantly positive, suggesting the robustness of basic regression outcomes.
5 Mechanism test
Previous research has shown that by implementing CET pilot programs, building businesses’ GTFP can improve dramatically. Building on this insight, some researchers believe that green technical breakthroughs aiming at reducing carbon emissions can have a significant impact on GTFP oscillations. Building on this foundation, the present research examines green technological innovation as a possible mediating factor, employing a mediation effect model to analyze the influence of CET on construction businesses’ GTFP. The coefficient in first column of Table 9 pertains to the coefficient with quantity of green patent applications

Table 9. Mechanism test result.
6 Heterogeneity analysis
6.1 Market scale perspectives
Construction companies market scale significantly affects equivalent of carbon emissions to be reduced and associated maintenance expense. This study assesses whether CET’s impact on construction firms’ GTFP significantly differs by company size, with firms classified according to size in the database. Separate basic regressions are performed for larger and smaller firms. Regression outcomes presented in the first and second columns of Table 10 indicate that the CET pilot positively influences the GTFP of larger-scale construction enterprises by 1%, while it has no discernible effect on smaller-scale entities. This suggests that CET has a stronger influence on larger enterprises than on smaller ones. This gap may be ascribed to major construction businesses’ greater risk-management capabilities. In the context of new policy implementation, large construction enterprises can use their established industrial chains, strategic relationships, and economies of scale to offset market risks. They leverage their long-established market share, reputation, and influence to do so. It is noteworthy that large construction firms, due to their more significant social influence, are more likely to receive government financial subsidies and tax incentives. They can use national macro policies to pave their way toward autonomous transformation. For deep analysis, Large-scale enterprises experience a faster increase in GTFP compared to small-scale enterprises. The primary reasons for this phenomenon are as follows: Firstly, enterprises of different market sizes have varying resource integration capabilities. Large construction enterprises, leveraging their superior resource integration capabilities, can more effectively spread fixed costs. Specifically, large construction enterprises can attract significant investments in environmental technology and establish industry-influential innovation and research platforms. This conclusion is confirmed by Zhou et al. (2023), who also highlight that large enterprises have greater bargaining power in this process, giving them an advantage in reducing costs. Consequently, in the carbon trading market, they can more easily absorb and internalize carbon costs, thereby improving GTFP. Secondly, large construction enterprises typically develop more mature risk management systems and higher resilience as they grow. This enables them to better manage uncertainties and price fluctuations in the carbon trading market, swiftly adjusting strategies to respond to market changes. This ability results in higher policy response capabilities for large enterprises, particularly those with dedicated policy research and response departments. These enterprises can promptly interpret and respond to government environmental policies and regulations. Not only can they quickly adjust their operational strategies, but they can also influence policy direction through lobbying and participation in policy formulation, making policies more favorable to their development. This is substantiated by the research of Kalaycıoğlu et al. (2016). Thirdly, larger enterprises place greater emphasis on social responsibility and brand image construction. By participating in the carbon trading market, they not only enhance their GTFP but also improve their social reputation and brand value. This positive feedback mechanism further promotes their advancement in green development levels. This finding is supported by Yang et al. (2016).

Table 10. Heterogeneity analysis result.
6.2 Enterprise ownership perspectives
Construction firms may differ in their societal roles depending on whether they are state-controlled. This is particularly evident in the differences between stateowned enterprises (SOEs) and privately-owned enterprises (POEs). The existence of such differences leads to varying responses and outcomes in relation to the government’s CET pilot policy among firms of different ownership types. This study uses a dummy variable to characterize firm ownership, separating the sample into SOEs and non-state-owned enterprises, and doing a DID analysis on them. Table 10’s third and fourth columns reveal that state-owned construction enterprises’ GTFP has a substantial favorable impact (interaction term coefficient = 0.0108, p < 1%). Conversely, the interaction term coefficient for private construction businesses is 0.0092, demonstrating statistically significant at one percentage level. This indicates that the coefficients for SOEs are slightly elevated compared to those for non-SOEs, with SOEs also exhibiting a higher level of significance. This suggests that while the policy impacts both firm types, its effect is more pronounced on SOEs, signifying that government-implemented CET programs exert a stronger influence on state-owned entities than on private firms. SOEs tend to achieve faster green development under the CET policy for several reasons: Firstly, according to government intervention theory, state-owned construction enterprises are subject to stronger government supervision and policy guidance. This oversight ensures a certain level of efficiency and consistency in executing national policies. Due to government ownership, SOEs must balance shareholder interests with the government’s social and economic objectives, providing greater motivation to implement carbon reduction policies (Zhu et al., 2016). Secondly, compared to private enterprises, state-owned construction enterprises enjoy better social recognition and reputation in securing financing and technical support. This advantage facilitates more effective participation in carbon trading markets and investment in clean technologies. Additionally, SOEs typically have long-term development strategies and a stronger sense of social responsibility, focusing not only on short-term profits but also on long-term sustainability and environmental protection. Most SOEs align their long-term plans with national strategic plans, which makes them more inclined to engage in carbon trading policies and actively reduce emissions. Lastly, SOEs often have strict organizational cultures and regulatory systems, ensuring greater compliance with carbon trading policies and reducing violations. Moreover, significant social and political pressures, along with a self-demonstration effect, drive SOEs to execute green transitions more rigorously and comprehensively.
6.3 Financial structure perspectives
Based on financial leverage theory, incurring debt could shrink the capital expenditure associated with conducting business operations, thereby aiding in the enhancement of a firm’s profitability. For managers, a higher debt ratio means a greater concentration of equity, enabling shareholders to obtain a larger share of the profits from projects. This is particularly relevant in construction firms that have an appetite for risk, as an increased proportion of debt can lead to investments in higher-risk projects. This research categorizes construction firms into high and low debt groups based on their debt-to-asset ratio median values, conducting distinct regression analyses for each. The aim is to ascertain the differential impact of the CET program on companies with varied debt levels. As illustrated in Table 10’s fifth and sixth columns, coefficient of construction firms regarding high level debt is notably significant in one percentage level, whereas for those in low level debt, it is remarkably significant with five percentage level. Moreover, the modulus for high level debt data are marginally bigger than that for the low level debt, suggesting a more pronounced level of significance. This demonstrates that the policy significantly impacts both groups, with notably higher efficiency for high-debt companies. This indicates that the CET policy exerts a remarkable influence on GTFP of construction companies with high level debt than those in low level. Such effect could be mainly attributed to the interpretation that a high debt ratio reflects a firm’s optimism regarding its future profitability. Markets tend to favor working with such companies, which in turn can promote the enhancement of their GTFP. In addition, By analyzing previous research and incorporating the findings, it is evident that construction enterprises with high levels of debt may face significant financial pressure and a need for stringent cost control. Carbon trading policies offer the opportunity to generate additional revenue through emission reductions, which is particularly attractive to highly indebted enterprises. Consequently, these firms are likely to be more motivated to actively participate in carbon trading (Lu Y et al.).
6.4 Geographical location perspectives
Since China has a vast land, there are significant developmental gaps between its eastern and western regions, which are reflected in the construction industry’s varying responses to the CET pilot policy. As a result, this study divides enterprises into three categories based on their geographical location: eastern, middle, and western. Table 11 presents the experimental data, including experimental consequence for different regions (eastern, middle, and western) in columns 1, 2, and 3, respectively. The results reveal that the policy effect is remarkable at one percentage level in the eastern region, whereas the consequence for middle and western area are not significant. The results indicates that policy’s impact is more effective in the eastern rather than middle and western areas. The lack of significant interaction term coefficients for middle and western areas indicates that to be a new carbon emission reduction tool, CET, is more evident in well-developed areas. As for middle and western regions, still depending on traditional, energy-intensive construction processes and boasting less vibrant marketplaces, are not fully reaping the advantages of novel programs like CET.
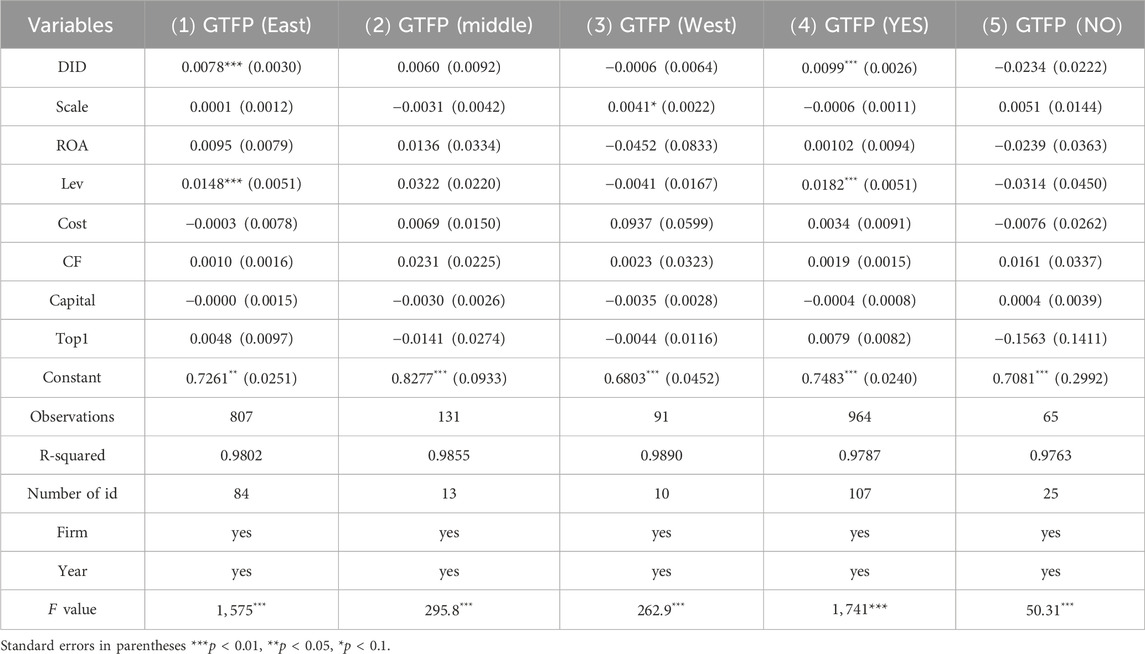
Table 11. Heterogeneity analysis result.
6.5 Official subsides perspectives
Whether a firm receives government subsidies can impact its business operations to a certain extent. This study incorporates a dummy variable for government subsidies to assess the differences in policy effects for construction businesses that get them vs. those that do not. It splits the sample data into two groups: firms that receive government subsidies and those that do not, and then runs simple regression analysis on each. As depicted in columns 4 and 5 of Table 11, the interaction term coefficient for enterprises that receive government subsidies is remarkably positive in one percentage level. The consequence indicates a substantial policy effect on these subsidized businesses in advanced regions. This phenomenon may occur because construction firms that receive government subsidies can leverage this financial support to enhance their capacity for innovation and management. This can lead to continual improvement in their GTFP and promote overall corporate performance enhancement. This conclusion has been confirmed in the photovoltaic industry. Numerous scholars (Li et al., 2022) have found that subsidies, as a policy tool, have strongly promoted the development of emerging green industries. However, this significant impact is only evident in the early stages of the industry, with less noticeable effects during the intermediate and mature stages (Nordensvard et al., 2018; Wang Z. et al., 2018).
7 Conclusion and policy recommendations
7.1 Conclusion
As global climate change worsens, carbon trading is increasingly recognized as a critical environmental management and control technique for mitigating the negative consequences of economic activity on the climate. Additionally, considering the vital role of the building industry in human survival, supporting green and sustainable development in this sector is critical to the existing economic and social framework. Thus, investigating the response of construction firms’ green development situation to the implementation of CET policies is critical for their harmonious development. This research analyzes data from construction firms listed on the Shanghai and Shenzhen A-share and ChiNext markets between 2007 and 2022. It utilizes DID and mediation effect models to empirically explore the influence of CET on the green development situation of Chinese construction companies, aiming to elucidate the underlying mechanisms. The key finding is that the CET policy significantly enhances the GTFP of these firms. Additionally, green technology innovation serves as a pivotal mechanism through which CET policy influences the GTFP of these enterprises. According to the analysis, the carbon emissions pricing plan benefits larger-scale, state-owned, and deeply indebted construction businesses more. Furthermore, enterprises in China’s eastern regions show a greater improvement in GTFP than those in the middle and western areas. This research indicates that CET could enhance the green development level of construction firms in China and it is necessary to adjust the policy according to different situation of firms.
7.2 Practical implications
Reflecting on and focusing on the implementation of CET policies in developed regions can provide valuable lessons for developing countries and regions. For example, the development of CET policies in the European Union has had different impacts on enterprises at different stages. Andreou and Kellard (2021) found that companies with proactive environmental behaviors under the EU ETS performed poorly financially. From the first to the second phase, the EU Emissions Trading System (ETS) harmed corporate profits (Abrell et al., 2011). In the third phase of the EU ETS, the motivation for companies to improve production efficiency may not have improved (Carratù et al., 2020). If the carbon emission trading system becomes more stringent, high-emission enterprises are more likely to divest and relocate (Genovese and Tvinnereim, 2019). Conversely, some scholars have found that companies participating in CET could pass the additional costs onto consumers through product pricing, leading to increased turnover (Marin et al., 2018). Regarding China’s specific national conditions, construction enterprises transitioning from traditional operational models to green low-carbon models will inevitably incur costs, which will likely be borne by consumers (Zhang and Wang, 2021). Timely monitoring of the effects of construction enterprises participating in carbon trading policies is crucial for maintaining the effectiveness of these policies.
This study proposes an evaluation and impact tracking mechanism for the implementation of CET policies, establishing a post-evaluation framework and model for construction enterprises participating in carbon trading policies. Based on the results of this study, green innovation has a positive impact on enhancing the green development levels of construction enterprises. Therefore, government departments should implement incentive policies for green patent inventions and utility models or regularly hold invention competitions to stimulate technological innovation. For bidding units, adding green innovation as a criterion in standards can strengthen the requirements for green innovation among bidders. In corporate management practices, managers should establish green research departments and collaborate extensively with research institutions or research-oriented universities. This “enterprise-university-research institute” collaboration can achieve synergy and integration of functional and resource advantages, facilitating the alignment and coupling of upstream, midstream, and downstream technological innovations. Secondly, the green development levels in China’s central and western regions lag significantly behind those in the eastern regions. Therefore, market regulators should avoid a one-size-fits-all approach when establishing national standards and promote a virtuous cycle in which the eastern region drives green development in the central and western regions. Thirdly, it is recommended that government departments establish driving and incentive mechanisms at the current stage. For example, during the bidding process, tendering units should be encouraged to set green development evaluation points, giving enterprises with higher green development levels a better chance of winning contracts. Additionally, this study finds that state-owned and government-subsidized construction enterprises show more significant improvements in green development levels when participating in CET policies. This suggests that government departments can have state-owned enterprises take on more leading responsibilities and provide appropriate subsidies to private construction enterprises to help them navigate crises. Finally, highly leveraged enterprises also exhibit significant improvements in green development levels. Therefore, in practice, banks and financial institutions should be encouraged to increase the issuance of green loans and financial derivatives to stimulate enterprises to raise their debt levels, thereby enhancing their green development levels.
7.3 Suggestion for CET policy
The Chinese CET market represents a multifaceted and systemic endeavor. Based on the findings of this study, it is clear that further enhancement in strategic planning, market structures, and subsidy frameworks is necessary within the national carbon market. Therefore, the following recommendations are proposed: First and foremost, enhancing the regulations and support mechanisms of the carbon trading market is essential to ensure that carbon quota trading occurs in a legal and structured manner in China. This approach will maximize the effectiveness of carbon pricing policies in improving firms’ GTFP and assist construction companies in their transformation and upgrading efforts. The government should actively promote carbon trading plans to encourage voluntary compliance and foster a positive market environment. Additionally, participants in the carbon market should establish channels for green technology innovation and increase their investment in scientific research and technological development. Government departments should utilize macroeconomic regulation to strengthen the market mechanism’s incentive effect on innovative enterprises, creating policy tools that incentivize green innovation technology. This alignment will synchronize the influx of social capital with the financial needs of enterprises for research and development.
Furthermore, there should be a gradual enhancement of the carbon finance market mechanism to amplify the incentivizing effect of green finance on carbon trading entities. At present, China’s national carbon financial market remains in its nascent phase, characterized by limited activity and public acceptance of pilot carbon financial product transactions. Consequently, China’s carbon market development should explore the derivatives market, forming targeted financial tools to stimulate the active participation of construction companies in carbon trading and their sustainable transformation. In addition, the government should increase policy subsidies for construction companies. When these companies encounter challenges in their transformation or face existential threats, the government should provide support funds or tax incentives to bolster their risk mitigation capacity. Moreover, it is crucial to reduce the movement of carbon emissions between regions, which may result from differing regional subsidy schemes. The subsidy system should act as a catalyst for reducing carbon emissions. It is also vital to establish a platform for sharing exemplary practices, highlighting the leading role of large, state-owned enterprises, particularly those in the Eastern region, within the carbon trading market. Businesses in Central and Western China’s less developed carbon markets could benefit from opportunities for learning and networking through rewards for exemplary cases and inter-regional conferences. This strategy will enhance the efficacy of green transformation across society.
Finally, it is imperative to implement differentiated environmental regulatory strategies tailored to the characteristics of construction enterprises in different regions of China, considering their varying sizes, ownership types, and debt levels. Avoiding a one-size-fits-all regulatory approach is necessary to ensure equitable treatment of different types of enterprises, fostering a fair competitive environment that maximizes the effectiveness of environmental regulations. Additionally, rapidly achieving the decoupling of high production capacity from high carbon emissions is a critical goal.
Data availability statement
Publicly available datasets were analyzed in this study. This data can be found here: https://github.com/Kriscoo/research-data-and-code-of-construction-companies-green-development.
Author contributions
JT: Writing–original draft. YL: Writing–review and editing. ML: Data curation, Writing–review and editing.
Funding
The authors declare that financial support was received for the research, authorship, and/or publication of this article. This research was funded by National Key Research and Development Program of China, grant number 2023YFE0102100.
Acknowledgments
This study is very appreciatied for the support of Beijing Jiaotong University (BJTU).
Conflict of interest
The authors declare that the research was conducted in the absence of any commercial or financial relationships that could be construed as a potential conflict of interest.
Publisher’s note
All claims expressed in this article are solely those of the authors and do not necessarily represent those of their affiliated organizations, or those of the publisher, the editors and the reviewers. Any product that may be evaluated in this article, or claim that may be made by its manufacturer, is not guaranteed or endorsed by the publisher.
References
Abrell, J., Ndoye Faye, A., and Zachmann, G. (2011). Assessing the impact of the EU ETS using firm level data (No. 2011/08). Bruegel working paper. Available at: https://www.econstor.eu/handle/10419/77988.
Alonso-Martinez, D., De Marchi, V., and Di Maria, E. (2021). The sustainability performances of sustainable business models. J. Clean. Prod. 323, 129145. doi:10.1016/j.jclepro.2021.129145
Andreou, P. C., and Kellard, N. M. (2021). Corporate environmental proactivity: evidence from the European Union’s emissions trading system. Br. J. Manag. 32 (3), 630–647. doi:10.1111/1467-8551.12356
Aragòn-Correa, J. A., Marcus, A. A., and Vogel, D. (2020). The effects of mandatory and voluntary regulatory pressures on firms’ environmental strategies: a review and recommendations for future research. Acad. Manag. Ann. 14 (1), 339–365. doi:10.5465/annals.2018.0014
Bahman, N., Alalaiwat, D., Abdulmohsen, Z., Al Khalifa, M., Al Baharna, S., AlMannai, M. A., et al. (2023). A critical review on global co2 emission: where do industries stand? Rev. Environ. Health 38, 681–696. doi:10.1515/reveh-2022-0105
Carratù, M., Chiarini, B., and Piselli, P. (2020). Effects of European emission unit allowance auctions on corporate profitability. Energy Policy 144, 111584. doi:10.1016/j.enpol.2020.111584
Chen, S., and Golley, J. (2014). ‘green’productivity growth in China’s industrial economy. Energy Econ. 44, 89–98. doi:10.1016/j.eneco.2014.04.002
Cheng, Z., and Jin, W. (2022). Agglomeration economy and the growth of green totalfactor productivity in Chinese industry. Socio-Economic Plan. Sci. 83, 101003. doi:10.1016/j.seps.2020.101003
Cheng, Z., and Kong, S. (2022). The effect of environmental regulation on green totalfactor productivity in China’s industry. Environ. Impact Assess. Rev. 94, 106757. doi:10.1016/j.eiar.2022.106757
Chung, Y. H., Färe, R., and Grosskopf, S. (1997). Productivity and undesirable outputs: a directional distance function approach. J. Environ. Manag. 51, 229–240. doi:10.1006/jema.1997.0146
DeLaPaz, A. (2013). LEED locally: hoe local governments can effectively mandate green building standards. U. Ill. L. Rev. 1211.
Dong, F., Li, X., Long, R., and Liu, X. (2013). Regional carbon emission performance in China according to a stochastic frontier model. Renew. Sustain. energy Rev. 28, 525–530. doi:10.1016/j.rser.2013.08.009
Feng, C., Huang, J. B., and Wang, M. (2018). Analysis of green total-factor productivity in China’s regional metal industry: a meta-frontier approach. Resour. Policy 58, 219–229. doi:10.1016/j.resourpol.2018.05.008
Gomes, S., Pinho, M., and Lopes, J. M. (2024). From environmental sustainability practices to green innovations: evidence from small and medium-sized manufacturing companies. Corp. Soc. Responsib. Environ. Manag. 31 (3), 1677–1687. doi:10.1002/csr.2657
Hao, X., Wang, X., Wu, H., and Hao, Y. (2023). Path to sustainable development: does digital economy matter in manufacturing green total factor productivity? Sustain. Dev. 31, 360–378. doi:10.1002/sd.2397
Helman, J., Rosienkiewicz, M., Cholewa, M., Molasy, M., and Oleszek, S. (2023). Towards GreenPLM—key sustainable indicators selection and assessment method development. Energies 16 (3), 1137. doi:10.3390/en16031137
Hu, Q., Li, X., and Feng, Y. (2022). Do green credit affect green total factor productivity? empirical evidence from China. Front. Energy Res. 9, 821242. doi:10.3389/fenrg.2021.821242
Hua, J., Zhu, D., and Jia, Y. (2022). Research on the policy effect and mechanism of carbon emission trading on the total factor productivity of agricultural enterprises. Int. J. Environ. Res. Public Health 19 (13), 7581. doi:10.3390/ijerph19137581
Jian, W., Huang, W., Yamaka, W., and Liu, J. (2023). Internet development and green total factor productivity: new evidence of mediation and threshold effects. Sustainability 15, 12438. doi:10.3390/su151612438
Jiang, H., Wang, K., Lu, Z., Liu, Y., Wang, Y., and Li, G. (2020a). Measuring green creativity for employees in green enterprises: scale development and validation. Sustainability 13 (1), 275. doi:10.3390/su13010275
Jiang, H. D., Dong, K. Y., Zhang, K., and Liang, Q. M. (2020b). The hotspots, reference routes, and research trends of marginal abatement costs: a systematic review. J. Clean. Prod. 252, 119809. doi:10.1016/j.jclepro.2019.119809
Jiang, H. D., Pradhan, B. K., Dong, K., Yu, Y. Y., and Liang, Q. M. (2024). An economy-wide impacts of multiple mitigation pathways toward carbon neutrality in China: a CGE-based analysis. Energy Econ. 129, 107220. doi:10.1016/j.eneco.2023.107220
Jiang, H. D., Xue, M. M., Dong, K. Y., and Liang, Q. M. (2022). How will natural gas market reforms affect carbon marginal abatement costs? Evidence from China. Econ. Syst. Res. 34 (2), 129–150. doi:10.1080/09535314.2020.1868410
Jiang, H. D., Yu, R., and Qian, X. Y. (2023). Socio-economic and energy-environmental impacts of technological change on China’s agricultural development under the carbon neutrality strategy. Petroleum Sci. 20 (2), 1289–1299. doi:10.1016/j.petsci.2023.01.013
Kalaycıoğlu, S., and Gönel, F. (2016). “The role of business in environmental policy-making,” in Environmentalism in Turkey, 131–144.
Kim, J. H. (2019). Multicollinearity and misleading statistical results. Korean J. Anesthesiol. 72, 558–569. doi:10.4097/kja.19087
Li, X., Guo, D., and Feng, C. (2022). The carbon emissions trading policy of China: does it really promote the enterprises’ green technology innovations? Int. J. Environ. Res. Public Health 19, 14325. doi:10.3390/ijerph192114325
Li, Y., and Chen, Y. (2021). Development of an sbm-ml model for the measurement of green total factor productivity: the case of pearl river delta urban agglomeration. Renew. Sustain. Energy Rev. 145, 111131. doi:10.1016/j.rser.2021.111131
Liu, G., Wang, B., Cheng, Z., and Zhang, N. (2020). The drivers of China’s regional green productivity, 1999-2013. Resour. Conservation Recycl. 153, 104561. doi:10.1016/j.resconrec.2019.104561
Marin, G., Marino, M., and Pellegrin, C. (2018). The impact of the European Emission Trading Scheme on multiple measures of economic performance. Environ. Resour. Econ. 71, 551–582. doi:10.1007/s10640-017-0173-0
Munnings, C., Morgenstern, R. D., Wang, Z., and Liu, X. (2016). Assessing the design of three carbon trading pilot programs in China. Energy Policy 96, 688–699. doi:10.1016/j.enpol.2016.06.015
Nordensvard, J., Zhou, Y., and Zhang, X. (2018). Innovation core, innovation semi-periphery and technology transfer: the case of wind energy patents. Energy Policy 120, 213–227. doi:10.1016/j.enpol.2018.04.048
Qin, Y. (2023). Evaluating the non-linear interplay and threshold dynamics between aggregated industry synergy and green total factor productivity. J. Green Econ. Low-Carbon Dev. 2, 72–83. doi:10.56578/jgelcd020203
Scheel, H. (2001). Undesirable outputs in efficiency valuations. Eur. J. operational Res. 132, 400–410. doi:10.1016/s0377-2217(00)00160-0
Sun, P., Liu, L., and Qayyum, M. (2021). Energy efficiency comparison amongst service industry in Chinese provinces from the perspective of heterogeneous resource endowment: analysis using undesirable super efficiency sbm-ml model. J. Clean. Prod. 328, 129535. doi:10.1016/j.jclepro.2021.129535
Tao, X., Wang, P., and Zhu, B. (2016). Provincial green economic efficiency of China: a non-separable input-output sbm approach. Appl. energy 171, 58–66. doi:10.1016/j.apenergy.2016.02.133
Tyteca, D. (1996). On the measurement of the environmental performance of firms - a literature review and a productive efficiency perspective. J. Environ. Manag. 46, 281–308. doi:10.1006/jema.1996.0022
Vierra, S. (2016). Green building standards and certification systems. Washington, DC: National Institute of Building Sciences.
Wang, B., Liu, Y., Zhou, Y., and Wen, Z. (2018). Emerging nanogenerator technology in China: a review and forecast using integrating bibliometrics, patent analysis and technology roadmapping methods. Nano energy 46, 322–330. doi:10.1016/j.nanoen.2018.02.020
Wang, S., Abbas, J., Sial, M. S., Álvarez-Otero, S., and Cioca, L. I. (2022). Achieving green innovation and sustainable development goals through green knowledge management: moderating role of organizational green culture. J. innovation Knowl. 7 (4), 100272. doi:10.1016/j.jik.2022.100272
Wang, X. Q., Su, C. W., Lobonţ, O. R., Li, H., and Nicoleta-Claudia, M. (2022). Is China’s carbon trading market efficient? evidence from emissions trading scheme pilots. Energy 245, 123240. doi:10.1016/j.energy.2022.123240
Wang, Y., Chen, H., Long, R., Liu, B., Jiang, S., Yang, X., et al. (2021). Evaluating green development level of mineral resource-listed companies: based on a “dark green” assessment framework. Resour. policy 71, 102012. doi:10.1016/j.resourpol.2021.102012
Wang Z, Z., Liang, L., Cheng, D., Li, H., Zhang, Y., et al. (2022). Emission reduction benefits and economic benefits of China’s pilot policy on carbon emission trading system. Comput. Intell. Neurosci. 2022, 1–13. doi:10.1155/2022/5280900
Wu, D., Lie, Y., Liu, L., Cheng, Z., Zhang, Y., Yang, Y., et al. (2023). City-level environmental performance and the spatial structure of China’s three coastal city clusters. J. Clean. Prod. 422, 138591. doi:10.1016/j.jclepro.2023.138591
Xia, F., and Xu, J. (2020). Green total factor productivity: a re-examination of quality of growth for provinces in China. China Econ. Rev. 62, 101454. doi:10.1016/j.chieco.2020.101454
Xiong, W., Guo, X., Sun, Y., and Ou, J. J. (2023). Green standard and green development: theory and empirical evidence. J. Clean. Prod. 414, 137768. doi:10.1016/j.jclepro.2023.137768
Yang, Z., and Fang, H. (2020). Research on green productivity of Chinese real estate companies—based on SBM-DEA and TOBIT models. Sustainability 12 (8), 3122. doi:10.3390/su12083122
Yang Yang, L., Li, F., and Zhang, X. (2016). Chinese companies’ awareness and perceptions of the Emissions Trading Scheme (ETS): evidence from a national survey in China. Energy Policy 98, 254–265. doi:10.1016/j.enpol.2016.08.039
Ying, Y., Cui, X., and Jin, S. (2023). Artificial intelligence and green total factor productivity: the moderating effect of slack resources. Systems 11, 356. doi:10.3390/systems11070356
Zhang, J., Lu, G., Skitmore, M., and Ballesteros-Pérez, P. (2021). A critical review of the current research mainstreams and the influencing factors of green total factor productivity. Environ. Sci. Pollut. Res. 28, 35392–35405. doi:10.1007/s11356-021-14467-4
Zhang, Y. J., and Wang, W. (2021). How does China’s carbon emissions trading (CET) policy affect the investment of CET-covered enterprises? Energy Econ. 98, 105224. doi:10.1016/j.eneco.2021.105224
Zhang, Z. (2015). Carbon emissions trading in China: the evolution from pilots to a nationwide scheme. Clim. Policy 15, S104–S126. doi:10.1080/14693062.2015.1096231
Zhang, Z. (2022). China’s carbon market: development, evaluation, coordination of local and national carbon markets, and common prosperity. J. Clim. Finance 1, 100001. doi:10.1016/j.jclimf.2022.100001
Zhao, P. j., Zeng, L. e., Lu, H. y., Zhou, Y., Hu, H. y., and Wei, X. Y. (2020). Green economic efficiency and its influencing factors in China from 2008 to 2017: based on the super-sbm model with undesirable outputs and spatial dubin model. Sci. Total Environ. 741, 140026. doi:10.1016/j.scitotenv.2020.140026
Zhao, X. G., Jiang, G. W., Nie, D., and Chen, H. (2016). How to improve the market efficiency of carbon trading: a perspective of China. Renew. Sustain. Energy Rev. 59, 1229–1245. doi:10.1016/j.rser.2016.01.052
Zhou, D., Lu, Z., and Qiu, Y. (2023). Do carbon emission trading schemes enhance enterprise green innovation efficiency? Evidence from China’s listed firms. J. Clean. Prod. 414, 137668. doi:10.1016/j.jclepro.2023.137668
Keywords: construction firms, carbon emission trading, green development, difference-in-differences model, green total factor productivity
Citation: Tian J, Liu Y and Lan M (2024) Is carbon trading working for construction companies green development ? Evidence from listed Chinese companies. Front. Environ. Sci. 12:1414086. doi: 10.3389/fenvs.2024.1414086
Received: 08 April 2024; Accepted: 12 July 2024;
Published: 02 August 2024.
Edited by:
Wei Zhang, China University of Geosciences Wuhan, ChinaReviewed by:
Fuli Zhou, Zhengzhou University of Light Industry, ChinaHong-Dian Jiang, China University of Geosciences, China
Copyright © 2024 Tian, Liu and Lan. This is an open-access article distributed under the terms of the Creative Commons Attribution License (CC BY). The use, distribution or reproduction in other forums is permitted, provided the original author(s) and the copyright owner(s) are credited and that the original publication in this journal is cited, in accordance with accepted academic practice. No use, distribution or reproduction is permitted which does not comply with these terms.
*Correspondence: Jinzhao Tian, cmlja3l0aWFuQGJqdHUuZWR1LmNu