 Jiatong Han
 Qing Sun
- School of Finance, Tianjin University of Finance and Economics, Tianjin, China
In this paper, we select the China Carbon Market Price Index, which reflects the overall price changes in China’s carbon market (CCM), and employs the TVP-VAR-BK model to examine the risk spillover effects between the carbon market and high-carbon-emission industries in China from a frequency domain viewpoint. Employing the nonparametric quantile Granger causality test, it delves further into the effects of economic policy uncertainty (EPU) in China on the degree of risk spillovers between the carbon market and high-carbon-emission industries. There are significant risk spillover effects between the carbon market and high-carbon-emission industries. During the short term, the carbon market affects the cement industry more than the electric power and steel industries. However, the carbon market is affected by the volatility of the high-carbon-emission industries over the long term. In addition, the effect of EPU on the magnitude of risk spillovers between the carbon market and high-carbon-emission industries is nonsignificant at extreme quartiles and significant at the middle quartile level, which is typically asymmetric.
1 Introduction
As global warming has gotten worse over the past few years, the world’s glaciers are melting rapidly (Tran, 2022), and the international community has come together to address this global crisis. The signing of the Kyoto Protocol and the Paris Agreement marked significant progress in strengthening cooperation on climate governance at the global level. In this context, the goals of “Carbon Peaking” and “Carbon Neutrality” demonstrate a firm stance on climate change in China (Zhang et al., 2023). A lot of attention has been paid by scholars to the carbon market as an important part of China’s high-quality growth, green and low-carbon transformation, and reaction to global warming. The Chinese Listed Companies Carbon Emissions Ranking was released in Beijing on 17 November 2021. The list is divided into “total” and “intensity”, which shows that electric power, steel, and cement are the top three carbon emission industries. Therefore, exploring the spillover effects between the carbon market and high-carbon-emission industries is vital for effectively controlling the risk of carbon trading, advancing the “double carbon” target and national conservation of energy and reduction of emissions.
As the CCM has steadily improved, some academics have started to concentrate on the ways that the spillover effects between the CCM and high-carbon-emission industries. Tang et al. (2024) examined the risk spillover effects among China’s electricity, coal and carbon markets using the DY spillover index. The empirical results show that there are significant long-term bidirectional asymmetric spillovers between these markets. In addition, extreme risk events significantly exacerbate the volatility spillover effects in the power, coal and CCM. Xu and Huang (2023) investigated the relations between the CCM and ten high-energy-consuming industries, such as electric power, paper, steel, and nonferrous metals, using the variance spillover index constructed with the TVP-VAR model. The research findings indicate that the CCM had a more profound effect on energy-intensive companies during the COVID-19 pandemic and the carbon market establishment, as well as a more closer risk contagion network. However, when most scholars study the spillover effect between CCM and high-carbon-emission industries, the selected CCM variables do not reflect the overall changes in CCM price as a whole. For example, Tao (2015) considered the completeness and authenticity of the data and thus studied the Shanghai carbon trading market. On the other hand, Wang and Wang (2022) studied the Hubei carbon trading market. Meanwhile, the existing literature has not overcome the shortcomings of the chosen model when exploring the relationship between carbon and financial markets from the frequency domain perspective. For example, Adekoya et al. (2021) used the BK model in order to investigate the spillover effects that occurred between the EU carbon market and a number of other commodities and financial markets at varying frequencies. Ding et al. (2022) utilized the DY and BK models to explore the time-frequency spillovers between the carbon market, the fossil energy market, and the clean energy market in both time and frequency domains. However, none of these modeling approaches can avoid the specific drawbacks of the rolling window VAR approach, such as the problems of arbitrarily choosing the size of the rolling window and the loss of observations.
In addition, another shortcoming of the existing studies is that they neglect to explore the impact of macroeconomic variables on the spillover effects between carbon markets and high-carbon-emission industries. Relevant studies have shown that economic policy uncertainty has significant explanatory power on financial market variables such as commodity prices (Prokopczuk et al., 2019), bond market volatility (Kim et al., 2024), foreign exchange spreads (Husted et al., 2018), and stock prices (Liang et al., 2020), and the impact is more significant, especially during the crisis. Therefore, it is important to explore the impact of EPU on the spillover effect between the carbon market and high-carbon-emission industries to realize the risk prevention and control between the carbon market and high-carbon-emission industries, as well as to introduce corresponding policies.
In summary, the main contributions of this paper are as follows: First, in order to better study the spillovers between the CCM and high-carbon-emission industries, this paper selects the Wind Power Industry Index, China Steel Price Index and China Cement Price Index as representative of high-carbon-emission industries and selects the China Carbon Trading Price Index constructed by Han and Jiang (2022) as representative of CCM, so that it can better reflect the spillover effect of overall price changes in the CCM on the high-carbon-emission industries. Second, this paper utilizes the BK spillover index constructed by the TVP-VAR model, which overcomes the shortcomings of the traditional BK spillover index model, in order to study the spillover effect between the carbon market and high-carbon-emission industries. Third, the impact of the EPU on the spillover effects between the CCM and high-carbon-emission industries is further explored. Overall, the research framework of this paper provides some new ideas for analyzing the spillover effects between carbon markets and high-carbon-emission industries, and the conclusions of this paper also have some guiding significance for the prevention of risk contagion in the process of carbon market construction.
The paper is structured as follows. The related literature review is in Section 2. The modeling methodology is in Section 3. The analysis of the empirical results, conclusions and policy recommendations are discussed in Sections 4, 5, respectively.
2 Literature review
The production of high-carbon-emission industries requires considerable energy consumption, such as natural gas, oil and coal. The use of these energy sources will exacerbate global warming, so most scholars pay more attention to the relationship between the carbon market and the energy needs of high-carbon-emission industries. Current research focus on the EU carbon market, the longest-established. Chen et al. (2022) used the QVAR model in order to investigate the connection between the carbon market and the energy and metal markets. Their analysis found a strong spillover impact between these two marketplaces, especially at the extreme quartile level. At the same time as Byun and Cho (2013) made the discovery that there is an asymmetric link between the volatility of carbon futures and energy volatility using the GARCH model, they also noticed the direction of the spillover. The findings of Byun and Cho (2013) were corroborated by Liu and Chen (2013), who conducted additional research to examine the extent of the spillover effects. Through the utilization of the TVP-VAR-SV model and impulse response function, Qiao et al. (2023) investigated the intensity of spillovers and the direction in which they occurred in the carbon, fossil energy, and electric power markets. In the end, the findings demonstrated that the carbon market, the fossil energy market, and the electricity market all exhibit time-varying asymmetric characteristics in terms of the intensity and direction of their spillovers. With the help of the quantile VAR network framework and the GARCHSK model, Zhou et al. (2022) discovered that there are considerable risk spillover effects between the carbon market, the energy market, and the nonferrous metal market., and these effects have significant dynamic characteristics. However, there are clear disparities in risk spillovers across dimensions. Numerous studies have been conducted on the carbon market and energy market in China, coinciding with the gradual establishment and improvement of the China carbon market (CCM). Sample entropy is used by Yin et al. (2021) to investigate the volatility link between the coal and CCM from a multiscale and crossover viewpoint. The study found some degree of synchrony between the two markets. In the current study, Song et al. (2022) examined the spillover effects between the CCM and energy market using the VAR model and the BEKK-MGARCH model. They found spillover effects between a part of the CCM and the energy market, but there is a difference in the direction and intensity of the spillover effect. Liu et al. (2023) employed the TVP-Copula-CoVaR methodology to examine the spillover effect of extreme risk between the CCM and the energy market. Their results suggest that, in comparison to the energy market, the CCM is more vulnerable to severe external shocks.
Among the related volatility spillover studies, the literature mostly analyses the link between the carbon market and various financial markets from a time-domain perspective. Wang and Guo (2018) employed the spillover index developed by Diebold and Yilmaz (2012) to examine the presence of asymmetric spillover effects among the carbon, crude oil, and natural gas markets. Using a modified error variance decomposition and network analysis, Tan et al. (2020) analysed the linkages between the EU carbon market and other financial markets and found that the carbon market and the oil and equity and nonenergy commodity markets are closely linked. The “carbon-energy-finance” system is more heavily influenced by macroeconomic variables than commodities considerations. Zhang and Wei (2024) examined the volatility spillovers between energy, agriculture, metals and carbon markets using a TVP-VAR model and empirically showed that the overall volatility spillover intensity between these markets is relatively low compared to the total return spillover index, thus suggesting that the linkages between these markets are weaker during periods of market turbulence. At the same time, a number of researchers have also investigated the spillover impact between the carbon market and the financial market from the point of view of the frequency domain perspective. Wang and Wang (2022) employed the BK model to examine the spillover effect between the CCM and the electric power market. The findings revealed that the spillover level is most pronounced in the short term and least pronounced in the long term. Jiang and Chen (2022) investigated the spillover effects between metal, energy and carbon markets during the New Crown outbreak in both time and frequency domains using the DY spillover model and the BK spillover model, and the results showed that the total spillover effects between carbon markets and metal and energy were significantly higher in the post-epidemic period compared to the pre-epidemic period. Among the total spillovers, the short-term spillovers were significantly higher than the long-term spillovers.
In addition, as the financialization of the carbon market continues to advance, price volatility and potential risks are gradually interacting significantly with other financial markets (Xu, 2021). Many variables impact financial markets, including energy market volatility, military conflicts, monetary policies, economic policies, and unpredictabilities in financial and energy markets, can exacerbate carbon market volatility (Abbas et al., 2019; Yu et al., 2021; Ge et al., 2022; Zhang et al., 2022) and further diminish its effectiveness and impact in decreasing carbon emissions (Mamirkulova et al., 2020; Dou et al., 2022), while increased volatility in the carbon market leads to an increase in the volatility spillovers of the financial markets to which it is linked. Therefore, it is important to continue to investigate the influence of macroeconomic variables on the level of risk spillovers between carbon and other markets. Chevallier (2011) used three different datasets and two testing methods to find that the increasing uncertainty of annual compliance events explains the instability of carbon price fluctuations, indicating a connection between macroeconomics and carbon markets. Similarly, Koch (2014) argued that the correlation between carbon and financial markets can be significantly affected by uncertainty induced by macroeconomic shocks during financial crises.
A review of the literature shows that, first, the above studies on the selection of the CCM variables mostly selected one or more carbon markets as representative of the China carbon market, thus failing to reflect the total CCM price shift. Second, the majority of previous research focuses on time domain analysis between the carbon market and high-carbon-emission industries. Although some scholars have also conducted research in the frequency domain, the selected model has not overcome the rolling window VAR method’s drawbacks. Finally, existing studies do not further explore the influence of macroeconomic variables on the spillover effects between the carbon market and other markets.
3 Materials and methods
3.1 TVP-VAR-DY
Since Sims (1980) proposed the VAR model, it has been widely used in economic research. However, due to the defects of the model, Sims (1986) improved it and proposed the structural vector autoregressive SVAR model. Primiceri (2005) improved the TVP-VAR model on the basis of the SVAR model, which well solves the problem of effective estimation of nonlinear time series in the SVAR model.
Antonakakis and Gabauer (2017) made a time-varying volatility spillover index using the TVP-VAR model and the method for making a spillover index by Diebold and Yilmaz (2012). This method is called the TVP-VAR-DY methodology in this paper. The TVP-VAR(p) equation is:
where
The generalised forecast error variance decomposition (GFEVD), which indicates the impact of a shock to variable j on the forecast error variance of variable i, can be calculated using the TVP-VMA coefficient Ψℎ. It is written as follows:
where
With Equations 2, 3, all risk spillover levels can be calculated, including:
Total spillover index:
The bigger the total spillover index, the stronger the relationship between the variables in the system. This coefficient shows the contribution of mutual spillovers between variables to the total forecast error variance.
Net pairwise directional spillover:
It is the difference between the shock from variable i to variable j and the shock from variable j to variable j, and it shows the net spillover between two variables in the system.
Total Spillover TO others:
It represents the spillover effect of variable i on all the other variables in the system.
Total Spillover FROM others:
It represents the spillover effect of all the other variables in the system to variable i.
Net spillover effects:
It shows how variable i has a net spillover effect on all other variables. When
3.2 TVP-VAR-BK
By integrating the TVP-VAR model with the BK model, which was presented by Baruník and Křehlík (2018), we can investigate the frequency domain volatility spillovers between variables. The frequency response function
Normalised processing is applied to the frequency domain generalised forecast error variance decomposition, and its equation is:
Aggregating all the frequencies in a given range to calculate spillovers in the short and long term, rather than at a single frequency, yields
Additionally, we have
Where
3.3 Nonparametric quantile Granger causality test
To continue to examine the effects of EPU on spillovers between variables, this study employs the nonparametric quantile Granger causality test developed by Balcilar et al. (2016), building upon the research conducted by Nishiyama et al. (2011) and Jeong et al. (2012). This test is effective in determining causal relationships between variables.
In the model, if
Equation 18 indicates that the variable
Letting
And letting
Jeong et al. (2012) measure quantile causality using the distance measure
In Equation 22,
In Equation 23,
The kernel function is represented by
In Equation 25,
To obtain the feasible test statistic, the
4 Results
4.1 Data
4.1.1 Data selection
To investigate the influence of the CCM and high-carbon-emission industries, this paper selects the China Carbon Market Price Index constructed by Han and Jiang (2022) for the carbon market variables. The index is based on the average price of transactions in the seven carbon markets of Shenzhen, Shanghai, Beijing, Guangdong, Tianjin, Hubei and Chongqing, and is compiled accordingly using the Paasche Index methodology with monthly data. In the selection of variables for the electric power industry (CPI), steel industry (CSI) and cement industry (CCI), the Wind Power Industry Index, China Steel Price Index and China Cement Price Index are selected as representatives of the three industries. For the empirical analysis, we follow Yu et al. (2021) and use monthly data to measure the spillover effects between the CCM and high-carbon-emission industries in the short-term (1–3 months) and long-term (more than 3 months) scenarios. The starting point of the empirical evidence is August 2014, the starting date of the China carbon market price index was constructed by Han and Jiang (2022), and the sample study interval was from August 2014 to September 2022. The EPU index is selected from the China Economic Policy Uncertainty Index constructed by Baker et al. (2016). The Wind database is the source of the data.
4.1.2 Descriptive statistics
Table 1 shows the descriptive statistics of the CCM price index, the power industry index, the steel industry index, and the cement price index. Analyzed from the viewpoint of standard deviation, the data of each series have different volatility, with the most drastic fluctuation in the electric power industry, and a greater degree of volatility in the iron and steel industry, the cement industry, and the domestic carbon market. From the viewpoint of kurtosis coefficient and skewness coefficient, the skewness of each series is not 0, and the kurtosis is significantly larger than 2, showing significant sharp peaks and thick tails. The value of Jarque-bara statistic of the original series of CCM and electric power industry at 5% level is 14.062 and 31.960 respectively, which significantly rejects the original hypothesis, so it does not obey normal distribution. However, the values of Jarque-Bara statistic for steel industry and cement industry at 5% level are 1.097 and 2.606 respectively, which do not reject the original hypothesis and obey normal distribution.
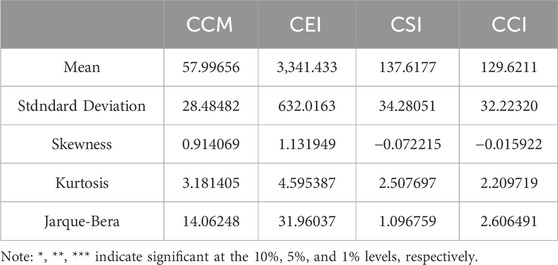
Table 1. Descriptive statistics for samples.
4.1.3 Data testing
A smoothness test needs to be performed on the raw data before empirical evidence is collected to prevent pseudoregression. The ADF test results in Table 2 show that the China carbon trading market price is stationary at the 10% significance level. The power industry index, steel industry index and cement price index cannot reject the original hypothesis at three significance levels, indicating that the original series are not stationary. The China Economic Policy Uncertainty Index is stationary at the 5% significance level. Therefore, this paper selects the original CCM price and the original China economic policy uncertainty index as well as the first-order difference series of the electric power industry, the steel industry index, and the cement price index for the subsequent empirical study.

Table 2. ADF test.
4.2 Empirical results
4.2.1 Static spillover effect results
Table 3 presents the total spillover effects between the CCM and high-carbon-emission industries, while Tables 4, 5 demonstrate the short-term and the long-term results of the spillover effects. The total spillover effects have an average value of 61.33%, which is divided into 53.85% attributable to short-term spillover effects and 7.48% attributable to long-term spillover effects. This indicates that 61.33% of the total spillover effects in the network “CCM – high-carbon-emission industries” come from the network itself and that the CCM has considerable spillover effects on high-carbon-emission industries. According to frequency domain decomposition, short-term spillovers dominate the CCM and high-carbon-emission industries spillovers. In terms of net spillover effects to others, it may be seen quite plainly that the CCM has the largest net spillover effect of 13.46%, which is the main exporter of spillover effects in the network “CCM – high-emission-carbon industries”, followed by the steel industry and the electric power industry. Therefore, in the network “CCM – high-carbon-emission industries”, the CCM will have a substantial influence on high-carbon-emission industries. Regarding the net spillover effects from others, the main net recipient in the network “CCM and high-carbon-emission industries” is the cement industry, with a value of −30.16%. From the frequency domain decomposition standpoint, the cement industry has the greatest impact in the short term, at −35.33%, while in the long term, it is a net exporter with a net spillover effect of 5.17%.
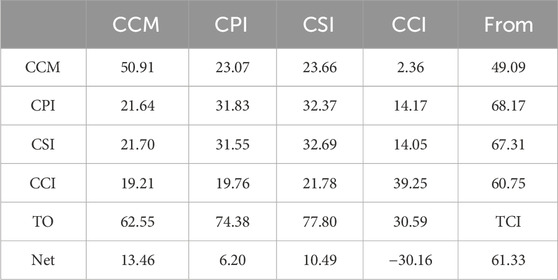
Table 3. Total spillover effects.

Table 4. Total spillover effects in the short term (1–3 months).
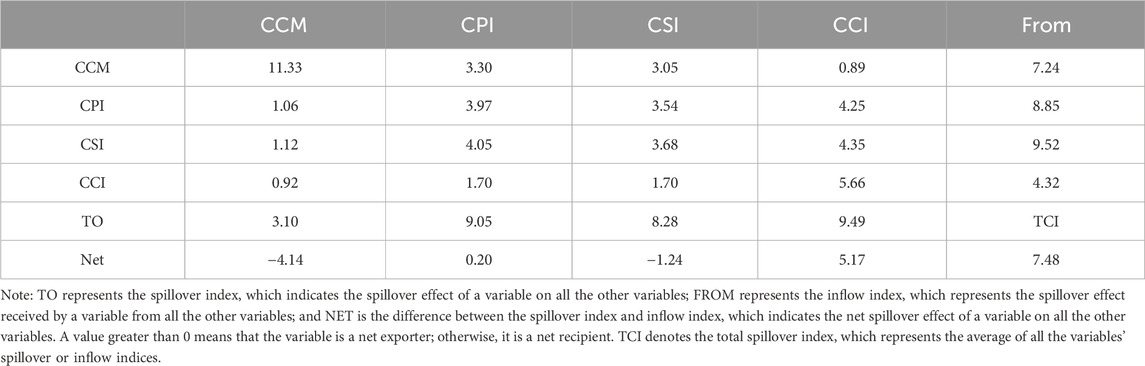
Table 5. Total spillover effects in the long term (longer than 3 months).
4.2.2 Dynamic spillover effect results
4.2.2.1 Total spillover effects of the “carbon markets – high-carbon-emission industries” network
The frequency domain decomposition in Figure 1 shows that the short-term spillover level is significantly greater than the long-term spillover level, and the long-term spillover level is close to 0 most of the time, illustrating that the spillover effect in the “CCM – high-carbon-emission industries” network in the time domain lasts less than 3 months, but the spillover effects have little effect after 3 months. Overall, the total spillover index in this network shows different stages of change over time, and its time-varying trend is influenced mainly by policy, the macroeconomy and other factors. In 2014–2015, the stock market in China was in a bull market phase, and in 2015, the stock market continued to fall due to the previous irrational rise of the stock market, which created a large bubble; thus, the central government adopted deleveraging and tightened financial regulation to regulate stock market risks. Thus, due to the volatility of macroeconomic conditions, the total spillover index reached an extreme value between 2014 and 2015, followed by a gradual decline from 2015 onwards. The second half of 2016 ushered in a period of supply-side reform and the use of market-based solutions to address overcapacity, so the overall spillover index rose again from the second half of 2016 onwards. In 2018, due to the continued escalation of the trade war between the United States and China and the continued depreciation of the RMB, the total spillover effect peaked in 2018 and remained relatively stable in subsequent years. The overall spillover effect in the network “CCM – high-carbon-emission industries” shown a considerable increase trend after the formal start of the China carbon emissions trading program in 2021.
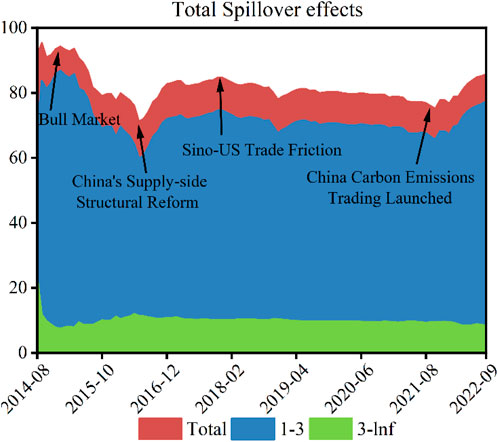
Figure 1. Total Spillover effects.
4.2.2.2 Net spillover effect results
In Figure 2, we find that the CCM acts as a net exporter of short-term spillovers for most of the sample period, with its net spillover index value being positive for the vast majority of the time, while it is a net recipient in the long-term. This result implies that the CCM has a larger influence on the high-carbon-emission industries in the shrot term. Notably, the short-term spillover index of the CCM was negative in 2016, which may be related to China’s supply-side structural reform and low trading prices and activity in the CCM.
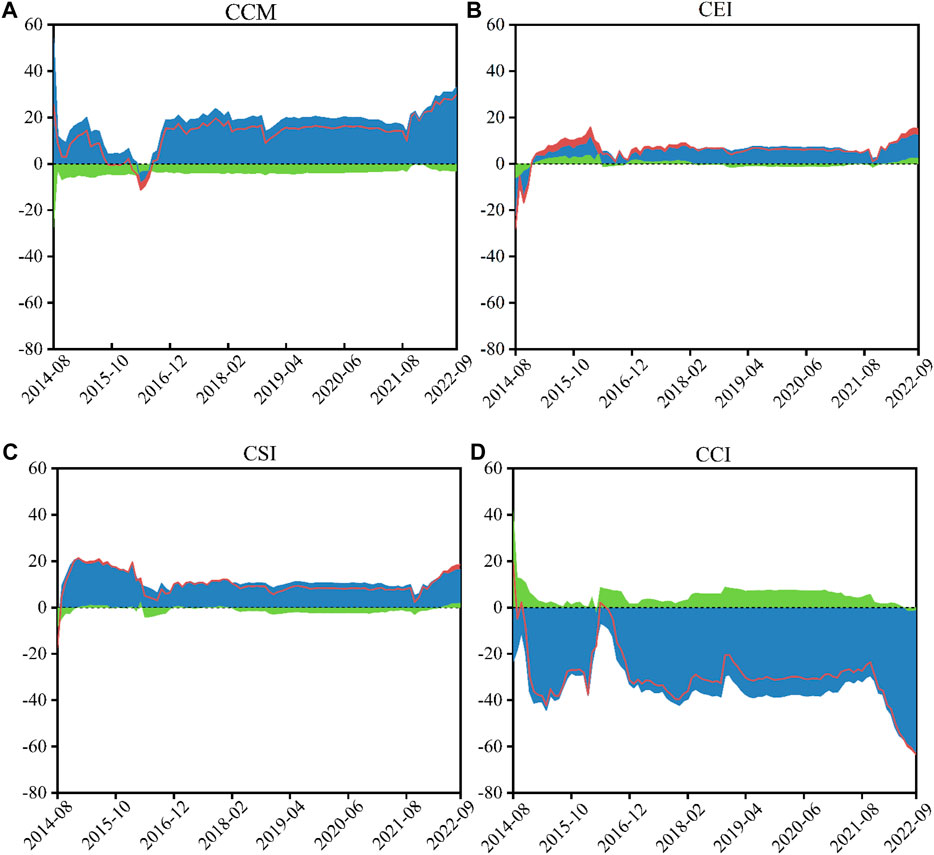
Figure 2. Net spillover effects.
The total spillover situation in the steel industry is almost the same as that in the electric power industry, both being net exporters of short-term spillovers for most of the sample period. However, the electric power industry acted as a net recipient of spillovers in both the short and long term between 2014 and 2015. Throughout the sample period, the cement sector received short-term spillovers, but in the long run, it was a net exporter of spillovers throughout the majority of the time. The net spillover indices for each market are vulnerable to unexpected events during the sample period. Examples include China’s supply-side structural reform in 2016 and the trade conflict between China and the United States in 2018. It is evident that the spillover effects of all markets reach stage extremes under the influence of unexpected events. Moreover, the short-term and long-term net spillovers notably differ, and in the long-term frequency domain, the net spillovers in each market are relatively smooth and less volatile, reflecting that each market can digest market uncertainty information in the long term.
4.2.2.3 Net pairwise spillover effect results
To enhance comprehension of the interactive influential characteristics of the CCM and high-carbon-emission industries, the net pairwise spillover effects between the CCM and these industries are once again examined in the following from the standpoint of the frequency domain Figure 3.
(i) Show that the short-term spillover effects of the CCM on the electric power industry and the steel industry reached extreme values in 2014–2015 but then declined rapidly. Until the second half of 2016, the CCM was a net recipient of the electric power and steel industries in the short term, and after the second half of 2016, the CCM affected the electric power and steel industries in the short term. The short-term spillover effects of the CCM on the electric power and steel industries in 2018 also reached extreme values in the short term in this phase. However, the CCM is a net recipient of the electric power and steel industries in the long-term throughout the sample period. Overall, the short-term spillovers between the CCM and the electric power and steel industries are greater than the long-term spillovers. This finding also supports, to some extent, the conclusions of Wang and Wang (2022). This paper argues that the extreme short-term spillover effects of the CCM on the power sector and the steel sector in 2014–2015 arose because of the influence of financial speculative factors in the stock market. Before the second half of 2016, the CCM affected the electric power industry and the steel industry mainly because the CCM at establishment was still incomplete, and after the supply-side structural reform in 2016, the CCM developed, so that the influence on the steel industry and electric power industry gradually strengthened in the short term. Moreover, the trade war between China and the United States in 2018 intensified the influence of the CCM on the sectors of steel and electric power in the near term. The findings of the previous analysis on the net spillover impact are validated by this as well.
(ii) As shown in Figure 3, the CCM had a significant impact on the cement industry in the short term during 2014–2015, but in the long term the cement industry had a significant impact on the CCM. After 2015, the cement industry was a net recipient of the CCM in both the short and long term. The chart clearly shows that the CCM spillover impact on the cement sector is considerably influenced by extreme occurrences.
(iii) A comparison of the above graphs shows that the electric power and steel industries had a significant impact on the CCM before 2016. This is because the was initially incomplete. In the early stage of operation, market liquidity was insufficient, price signal distortion and other problems occurred, and the price signal of the CCM could not truly reflect the demand and supply of carbon emission permits. Changes in the price of carbon emissions cannot significantly impact the production decision-making of enterprises, and enterprises lack active emission reduction incentives. Moreover, it is clear from the figure that the impact of the CCM on the cement industry in the short term is significantly greater than that on the electric power and steel industries. The paper suggests that this may be due to the relatively high carbon intensity of the cement industry’s production process. Cement production involves the calcination of limestone at high temperatures, a process that releases large amounts of carbon dioxide. Since this chemical reaction is inherent in cement production and limestone is difficult to replace as a raw material, the cement industry faces a greater challenge in reducing carbon emissions. Secondly, the cement industry may be relatively lagging behind in emission reduction technologies compared to the power and steel industries. The power industry has more choices and greater flexibility in emission reduction technologies, and the steel industry can also reduce carbon emissions by improving production processes, using low-carbon raw materials and recycling waste gas. The cement industry, on the other hand, may find it difficult to find cost-effective and technically feasible abatement options in the short term, and is therefore more susceptible to price fluctuations in the carbon market.
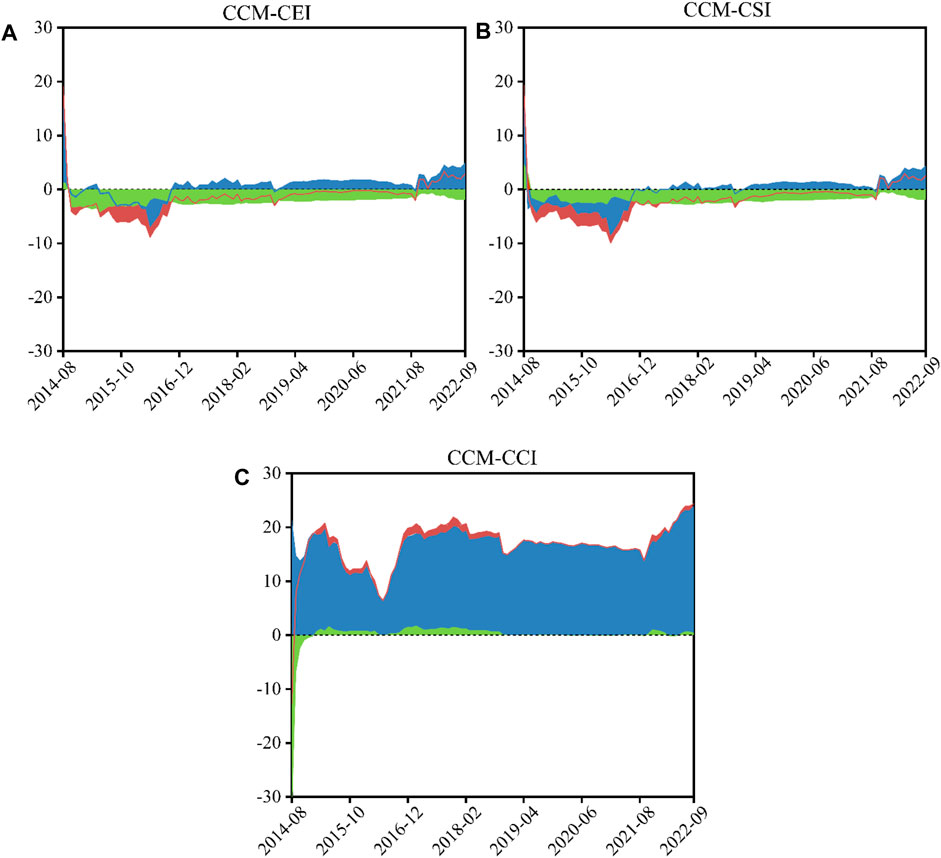
Figure 3. Net pairwise spillover effects.
4.2.2.4 Dynamic spillover network analysis of CCM and high-carbon-emission industries
The above examined the spillover effect between carbon market and high-carbon-emission industries from the perspective of frequency domain based on static and dynamic analysis, and in order to further clarify the dynamic change characteristics of volatile spillover among variables, and to demonstrate the risk contagion paths between carbon market and high-carbon-emission industries and the change of contagion paths under the influence of typical events, this paper examined the spillover network during the bull market in 2015 (August 2014–June 2015), the spillover network during the U.S.-China trade friction (January 2018–November 2019) and after the official start of the national carbon emissions trading (July 2021-end of the sample period).
Figures 4–6 report the short-term and long-term networks of the “Carbon Market - high-carbon-emission industries” system in the time domain as well as in the frequency domain under three special time periods:
(i) In terms of the structural characteristics of the spillover network, the spillover networks under the three special event segments are basically the same, but the structural characteristics of the time domain and the short-term network are obviously different from those of the long-term network. From this, it can be seen that in the system of “CCM – high-carbon-emission industries”, the short-term and long-term have different transmission paths, and the positions and roles of each node in the spillover network are not the same.
(ii) Under the three special event segments, the steel industry is the information leader in the time domain and in the short term, and the spillover effect on other markets is the largest. This may be due to the high sensitivity of the steel industry to changes in the economic environment. During bullish phases, when economic growth is expected to be strong, demand for steel increases, and industry sentiment rises, the market performance of the steel industry tends to foreshadow the overall market trend. During the U.S.-China trade war, steel as a key raw material, its price fluctuations are directly affected by trade policies, which in turn affects the cost and profitability expectations of the relevant markets. And after the opening of the carbon trading market, the cost of carbon emissions from the steel industry became the focus of market attention, and its dynamics directly affected the supply and demand and price fluctuations in the carbon market.
(iii) Whether in the time domain or in the short term, there is a significant spillover effect of the carbon market on high-carbon-emission industries, while in the long term the spillover effect of the carbon market on high-carbon-emission industries is small. This is also consistent with the conclusions drawn in the spillover analysis above, and further supports the points made above.

Figure 4. Network spillover during bull market.
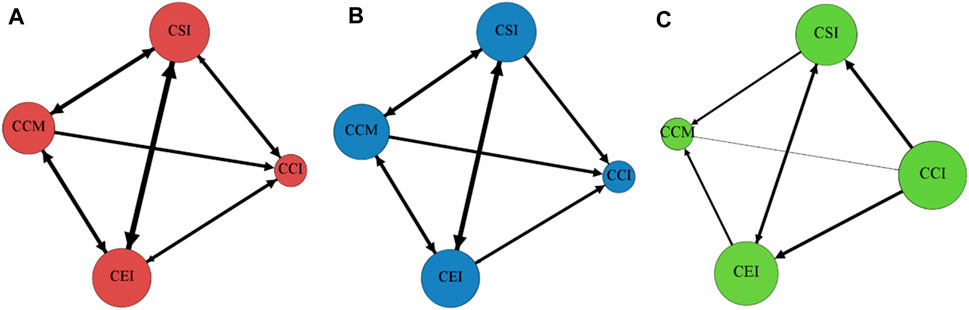
Figure 5. Network spillovers during US-China trade friction.
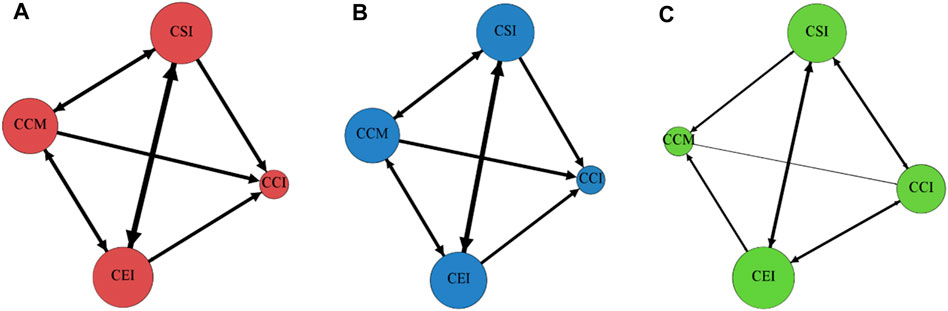
Figure 6. Network spillovers during the official start of China carbon emissions trading.
4.2.2.5 Study of the impact of EPU on volatility spillovers between CCM and high-carbon-emission industries
Thus, in order to better understand how EPU influences volatility spillovers between the CCM and high-carbon-emission industries, this paper employs Balcilar et al. (2016)’s nonparametric quantile Granger causality test to examine the causal relationship between EPU and both total and net pairwise spillovers.
Before studying the nonlinear effect link between EPU and volatility spillovers between the CCM and high-carbon-emission industries, it is first necessary to clarify whether there is a nonlinear structure between the two. In order to filter out the linear influence of the volatility spillover between EPU and the CCM and high-carbon-emission industries, this research uses the Broock et al. (1996) BDS test to design a VAR model. It then extracts the residuals for testing. The Table 6 displays the findings. The nonparametric quantile causality test may be performed as, as the Table 6 shows, all residual series are able to reject the initial hypothesis.
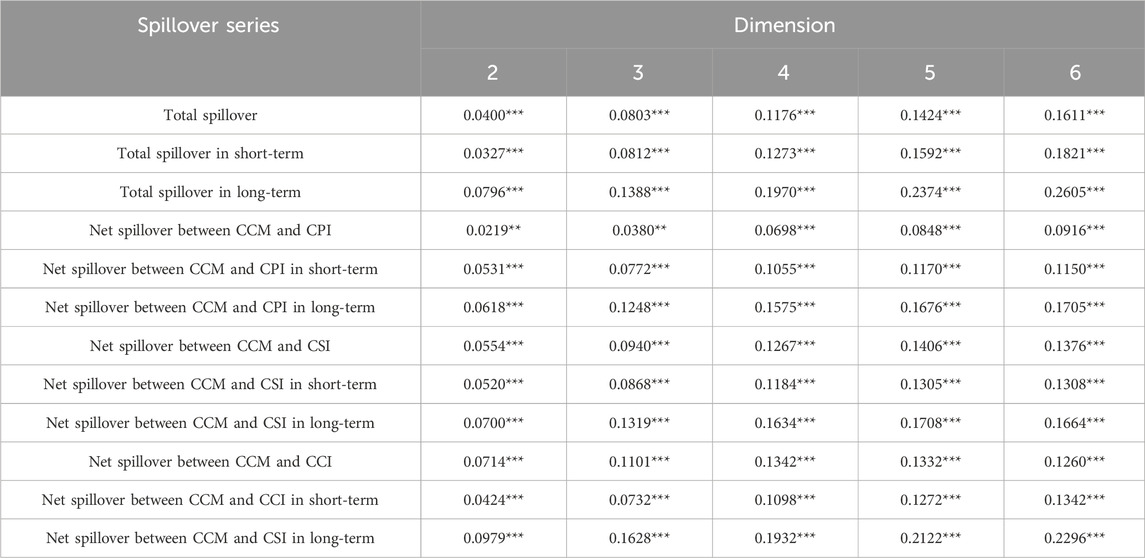
Table 6. BDS test.
The findings of the nonparametric quantile causality test of the volatility spillovers between the EPU and the CCM and high-carbon-emission industries are shown in the Figure 7. First, the study demonstrates that at most quantile levels, EPU has an impact on both the total and net pairwise spillovers between the CCM and the high-carbon-emission industries. Additionally, it also demonstrates a greater correlation between EPU and volatility spillovers from carbon markets to high-carbon-emission industries. Furthermore, the figure indicates that the overall spillovers and net pairwise spillovers within the network of the “CCM – high-carbon-emission industries” are particularly susceptible to the influence of EPU when it is at the mid-quartile level. Basu and Bundick (2017) find declines in production, consumption, investment and employment time under uncertainty shocks. Therefore, economic policy uncertainty leads to a reduction in the supply of money in the financial market, which may trigger liquidity risk in the financial market, which in turn affects the supply of allowances in the carbon market, which leads to changes in the production, research and development (R&D) management of high-emission carbon-based industries, etc., which in turn causes changes in the level of production technology, and the price of products. Total spillovers and volatility spillovers between the CCM and high-carbon-emission industries are not greatly impacted by EPU at the low quantile level; moreover, they are even less affected by EPU at the high quantile level. The limited impact of EPU on volatility spillovers between the CCM and high-carbon-emission industries is due to the fact that producers in high-carbon-emission industries are capable of making rational decisions when market volatility is low, whereas they are driven by extreme pessimism or optimism when market volatility is high.
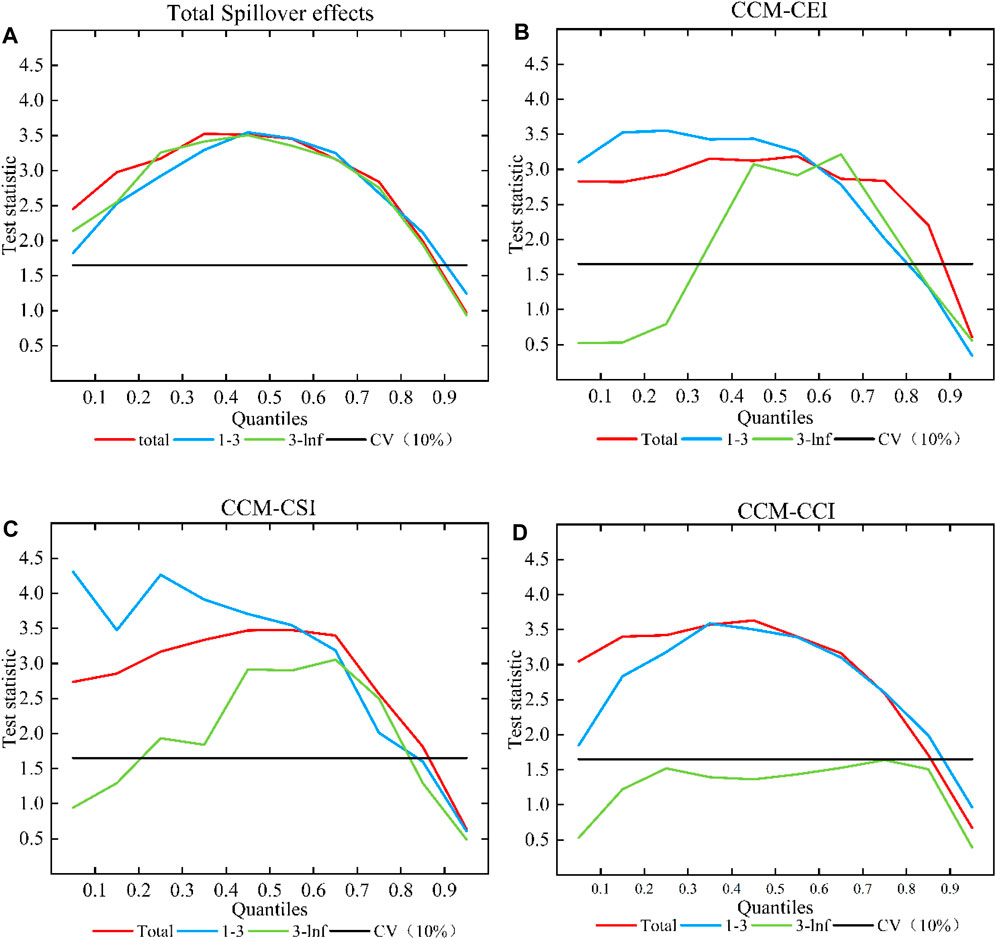
Figure 7. Causality-in-quantiles test results.
5 Conclusion and policy recommendations
The advancement of the carbon market under the background of global warming is receiving increasing amounts of attention from all countries, so it is urgent to address the problem of carbon emissions from high-carbon-emission industries. Nevertheless, there has been limited scholarly focus on the risk spillover effects from the CCM and high-carbon-emission industries, specifically in relation to the frequency domain. Consequently, in order to examine the spillover impact between the CCM and high-carbon-emission industries from a frequency domain perspective, this research first uses the BK spillover index, which was built based on the TVP-VAR model. Second, this research comprehensively examines the influence of EPU on the spillover effects between the CCM and high-carbon-emission industries in order to further explore the relationship between the two.
First the study found that “CCM – high-carbon-emission-industries” have much higher short-term spillovers than long-term spillovers. In addition, there are strong risk spillover effects between the CCM and high-carbon-emission industries. In the short term, carbon markets are mostly net exporters of spillovers; however, in the long term, they are more susceptible to shocks from high-carbon-emission industries. Second, while the carbon emissions and intensity of the steel and electric power sectors are considerably higher in comparison to the cement industry, the short-term repercussions of the carbon market on the cement sector are considerably more pronounced. This demonstrates that the CCM is insufficient to drive the electric power and steel industries. As a result, in order to achieve a low-carbon and environmentally sustainable economic transformation, greater emphasis should be placed on the interconnections between the CCM and the steel and electricity sectors, in order to direct and incentivize businesses to conserve energy and decrease emissions. Third, the spillovers between the CCM and high-carbon-emission industries are significantly affected by EPU, and the effect is typically asymmetric; i.e., at the mid-quartile level, EPU is more likely to have an effect on the spillovers between the CCM and high-carbon-emission industries, while at the extreme-quartile level, EPU’s effect is not obvious.
The foregoing conclusions lead this study to the following suggestions:
(i) For high-carbon-emission industries, with the improvement and development of the CCM, the influence of the CCM on these industries is becoming increasingly important. Therefore, high-carbon-emission industries should actively set emission reduction targets, promote enterprise transformation and upgrading, and realise green development to reduce the risk of losses they may bear in the process of carbon market development.
(ii) Regarding decision-making, the current carbon reform of the electric power and steel industries is insufficient, so special attention should be given to the coverage of the electric power and steel industries. In the meantime, the range of industries included in the CCM should be expanded further, gradually including building materials, chemical, petrochemical, nonferrous metals, and other high-carbon-emission industries, in order to improve the coverage of carbon emissions. At the same time, from the perspective of dynamic spillover network, we should be alert to the risk transmission of high-carbon-emission industries, identify the center of the network, and effectively supervise the key nodes to reduce the probability and scope of individual risk transmission.
(iii) For investors, it helps them to save risk management costs and improve risk prevention and control awareness. For example, market participants should be especially aware of the effects of changes in EPU when the spillover level between the CCM and high-carbon-emission industries is at the middle quartile level.
Data availability statement
The original contributions presented in the study are included in the article/supplementary material, further inquiries can be directed to the corresponding author.
Author contributions
JH: Formal Analysis, Funding acquisition, Methodology, Software, Supervision, Writing–original draft. QS: Conceptualization, Data curation, Visualization, Writing–review and editing. YJ: Data curation, Software, Visualization, Writing–review and editing.
Funding
The author(s) declare that financial support was received for the research, authorship, and/or publication of this article. This work was supported by the National Natural Science Foundation of China Youth Fund Project “Research on Financial Market Anomalies and Asset Pricing Problems Based on Investors’ Heterogeneous Beliefs” (Project number: 71901160).
Conflict of interest
The remaining authors declare that the research was conducted in the absence of any commercial or financial relationships that could be construed as a potential conflict of interest.
Publisher’s note
All claims expressed in this article are solely those of the authors and do not necessarily represent those of their affiliated organizations, or those of the publisher, the editors and the reviewers. Any product that may be evaluated in this article, or claim that may be made by its manufacturer, is not guaranteed or endorsed by the publisher.
References
Abbas, J., Mahmood, S., Ali, H., Raza, M., Aman, G., Aman, J., et al. (2019). The effects of corporate social responsibility practices and environmental factors through a moderating role of social media marketing on sustainable performance of business firms. Sustain 11 (12), 3434. doi:10.3390/su11123434
Adekoya, O. B., Oliyide, J. A., and Noman, A. (2021). The volatility connectedness of the EU carbon market with commodity and financial markets in time-and frequency-domain: the role of the US economic policy uncertainty. Resour. Pol. 74, 102252. doi:10.1016/j.resourpol.2021.102252
Antonakakis, N., and Gabauer, D. (2017). Refined measures of dynamic connectedness based on TVP-VAR. Mpra. Pap. 4, 1–14.
Baker, S. R., Bloom, N., and Davis, S. J. (2016). Measuring economic policy uncertainty. Q. J. Econ. 131 (4), 1593–1636. doi:10.1093/qje/qjw024
Balcilar, M., Gupta, R., Kyei, C., and Wohar, M. E. (2016). Does economic policy uncertainty predict exchange rate returns and volatility? Evidence from a nonparametric causality-in-quantiles test. Open Econ. Rev. 27, 229–250. doi:10.1007/s11079-016-9388-x
Baruník, J., and Křehlík, T. (2018). Measuring the frequency dynamics of financial connectedness and systemic risk. J. Financ. Econ. 16 (2), 271–296.
Basu, S., and Bundick, B. (2017). Uncertainty shocks in a model of effective demand. Econometrica 85 (3), 937–958. doi:10.3982/ECTA13960
Broock, W. A., Scheinkman, J. A., Dechert, W. D., and LeBaron, B. (1996). A test for independence based on the correlation dimension. Econom. Rev. 15 (3), 197–235. doi:10.1080/07474939608800353
Byun, S. J., and Cho, H. (2013). Forecasting carbon futures volatility using GARCH models with energy volatilities. Energy Econ. 40, 207–221. doi:10.1016/j.eneco.2013.06.017
Chatziantoniou, I., Gabauer, D., and Gupta, R. (2021). Integration and risk transmission in the market for crude oil: a time-varying parameter frequency connectedness approach. Univ. Pretoria. Dep. Econ. Work. Pap. Ser.
Chen, J., Liang, Z., Ding, Q., and Liu, Z. (2022). Quantile connectedness between energy, metal, and carbon markets. Int. Rev. Financ. Anal. 83, 102282. doi:10.1016/j.irfa.2022.102282
Chevallier, J. (2011). Detecting instability in the volatility of carbon prices. Energy Econ. 33 (1), 99–110. doi:10.1016/j.eneco.2010.09.006
Diebold, F. X., and Yilmaz, K. (2012). Better to give than to receive: predictive directional measurement of volatility spillovers. Int. J. Forecas. 28 (1), 57–66. doi:10.1016/j.ijforecast.2011.02.006
Ding, Q., Huang, J., and Zhang, H. (2022). Time-frequency spillovers among carbon, fossil energy and clean energy markets: the effects of attention to climate change. Int. Rev. Financ. Anal. 83, 102222. doi:10.1016/j.irfa.2022.102222
Dou, Y., Li, Y., Dong, K., and Ren, X. (2022). Dynamic linkages between economic policy uncertainty and the carbon futures market: does Covid-19 pandemic matter? Resour. Pol. 75, 102455. doi:10.1016/j.resourpol.2021.102455
Ge, T., Abbas, J., Abbas, A., Sadiq, I., and Zhang, R. (2022). Women’s entrepreneurial contribution to family income: innovative technologies promote females’ entrepreneurship amid COVID-19 crisis. Front. Psycho. 13, 828040. doi:10.3389/fpsyg.2022.828040
Han, J. T., and Jiang, Y. B. (2022). A study on time-varying spillover effect of carbon market and non-ferrous metal futures market. J. Ind. Technol. Econ. 41 (7), 113–123. doi:10.3969/j.issn.1004-910X.2022.07.014
Husted, L., Rogers, J., and Sun, B. (2018). Uncertainty, currency excess returns, and risk reversals. J. Int. Money Finance 88, 228–241. doi:10.1016/j.jimonfin.2017.07.011
Jeong, K., Härdle, W. K., and Song, S. (2012). A consistent nonparametric test for causality in quantile. Econom. Theory 28 (4), 861–887. doi:10.1017/S0266466611000685
Jiang, W., and Chen, Y. (2022). The time-frequency connectedness among metal, energy and carbon markets pre and during COVID-19 outbreak. Resour. Pol. 77, 102763. doi:10.1016/j.resourpol.2022.102763
Kim, J., Kumar, A., Mallick, S., and Park, D. (2024). Financial uncertainty and interest rate movements: is Asian bond market volatility different? Ann. Oper. Res. 334 (1), 731–759. doi:10.1007/s10479-021-04314-7
Koch, N. (2014). Dynamic linkages among carbon, energy and financial markets: a smooth transition approach. Appl. Econ. 46 (7), 715–729. doi:10.1080/00036846.2013.854301
Liang, C. C., Troy, C., and Rouyer, E. (2020). US uncertainty and Asian stock prices: evidence from the asymmetric NARDL model. N. Am. J. Econ. Fin. 51, 101046. doi:10.1016/j.najef.2019.101046
Liu, H. H., and Chen, Y. C. (2013). A study on the volatility spillovers, long memory effects and interactions between carbon and energy markets: the impacts of extreme weather. Econ. Mode. 35, 840–855. doi:10.1016/j.econmod.2013.08.007
Liu, J., Man, Y., and Dong, X. (2023). Tail dependence and risk spillover effects between China's carbon market and energy markets. Int. Rev. Econ. Finance 84, 553–567. doi:10.1016/j.iref.2022.11.013
Mamirkulova, G., Mi, J., Abbas, J., Mahmood, S., Mubeen, R., and Ziapour, A. (2020). New Silk Road infrastructure opportunities in developing tourism environment for residents better quality of life. Glob. Ecol. Conserv. 24, e01194. doi:10.1016/j.gecco.2020.e01194
Nishiyama, Y., Hitomi, K., Kawasaki, Y., and Jeong, K. (2011). A consistent nonparametric test for nonlinear causality—specification in time series regression. J. Econom. 165 (1), 112–127. doi:10.1016/j.jeconom.2011.05.010
Primiceri, G. E. (2005). Time varying structural vector autoregressions and monetary policy. Rev. Econ. Stud. 72 (3), 821–852. doi:10.1111/j.1467-937X.2005.00353.x
Prokopczuk, M., Stancu, A., and Symeonidis, L. (2019). The economic drivers of commodity market volatility. J. Int. Money Financ. 98, 102063. doi:10.1016/j.jimonfin.2019.102063
Qiao, S., Dang, Y. J., Ren, Z. Y., and Zhang, K. Q. (2023). The dynamic spillovers among carbon, fossil energy and electricity markets based on a TVP-VAR-SV method. Energy 266, 126344. doi:10.1016/j.energy.2022.126344
Sims, C. A. (1986). Are forecasting models useable for policy analysis? Q. Rev. 10, 2–16. doi:10.21034/qr.1011
Song, X., Wang, D., Zhang, X., He, Y., and Wang, Y. (2022). A comparison of the operation of China's carbon trading market and energy market and their spillover effects. Renew. Sust. Energy Rev. 168, 112864. doi:10.1016/j.rser.2022.112864
Tan, X., Sirichand, K., Vivian, A., and Wang, X. (2020). How connected is the carbon market to energy and financial markets? A systematic analysis of spillovers and dynamics. Energy Econ. 90, 104870. doi:10.1016/j.eneco.2020.104870
Tang, J., Ren, Z. Y., Chen, H. H., and Qiao, S. (2024). Multidimensional risk spillover among power, coal, and carbon markets: empirical evidence from China. Environ. Sci. Pollut. Res. 31 (1), 1244–1259. doi:10.1007/s11356-023-31099-y
Tao, C. H. (2015). A Study on the dynamic correlation between Carbon emission trade and the stock market of China. J. Beijing Jiaot. Univ. Soc. Sci. Ed. 14 (4), 40–51. doi:10.16797/j.cnki.11-5224/c.2015.04.006
Wang, X. P., and Wang, Y. C. (2022). The risk spillover effect between carbon and power market—based on BK spillover model. J. Ind. Technol. Econ. 41 (05), 53–62. doi:10.3969/j.issn.1004-910X.2022.05.007
Tran, Q. H. (2022). The impact of green finance, economic growth and energy usage on CO2 emission in Vietnam–a multivariate time series analysis. China Finance Rev. Int. 12 (2), 280–296. doi:10.1108/CFRI-03-2021-0049
Wang, Y., and Guo, Z. (2018). The dynamic spillover between carbon and energy markets: new evidence. Energy 149, 24–33. doi:10.1016/j.energy.2018.01.145
Xu, Y. (2021). Risk spillover from energy market uncertainties to the Chinese carbon market. Pac.-Basin Financ. J. 67, 101561. doi:10.1016/j.pacfin.2021.101561
Xu, Y. H., and Huang, Y. Q. (2023). Research on risk contagion of carbon market to high energy—consuming Industries. J. Ind. Technol. Econ. 42 (10), 128–138. doi:10.3969/j.issn.1004-910X.2023.10.014
Yin, J., Zhu, Y., and Fan, X. (2021). Correlation analysis of China’s carbon market and coal market based on multi-scale entropy. Resour. Pol. 72, 102065. doi:10.1016/j.resourpol.2021.102065
Yu, J., Shi, X., Guo, D., and Yang, L. (2021). Economic policy uncertainty (EPU) and firm carbon emissions: evidence using a China provincial EPU index. Energy Econ. 94, 105071. doi:10.1016/j.eneco.2020.105071
Zhang, J., and Wei, Y. (2024). Does CEA or EUA matter for major commodity markets? Fresh evidence from the analysis of information spillovers and portfolio diversification. China Finance Rev. Int. doi:10.1108/CFRI-02-2024-0056
Zhang, W., Huang, Y., and Wu, H. (2022). The symmetric and asymmetric effects of economic policy uncertainty and oil prices on carbon emissions in the USA and China: evidence from the ARDL and non-linear ARDL approaches. Environ. Sci. Pollut. Res. 29 (18), 26465–26482. doi:10.1007/s11356-021-17839-y
Zhang, Y., Zeng, S., Wu, Q., Fu, J., and Li, T. (2023). A study on the impact of the carbon emissions trading policy on the mining industry based on Porter hypothesis. Resour. Pol. 87, 104349. doi:10.1016/j.resourpol.2023.104349
Keywords: carbon market, high-carbon-emission industries, ow-carbon economy, TVP-VAR-BK model, spillover effects, economic uncertainty
Citation: Han J, Sun Q and Jiang Y (2024) Studying the risk spillover effects of the carbon market and high-carbon-emission industries under economic uncertainty. Front. Environ. Sci. 12:1407135. doi: 10.3389/fenvs.2024.1407135
Received: 26 March 2024; Accepted: 30 July 2024;
Published: 09 August 2024.
Edited by:
Wei Zhang, China University of Geosciences Wuhan, ChinaReviewed by:
Peng-Fei Dai, Wuhan University of Technology, ChinaYaohui Jiang, Shanghai University of Finance and Economics, China
Yufeng Chen, Zhejiang Normal University, China
Copyright © 2024 Han, Sun and Jiang. This is an open-access article distributed under the terms of the Creative Commons Attribution License (CC BY). The use, distribution or reproduction in other forums is permitted, provided the original author(s) and the copyright owner(s) are credited and that the original publication in this journal is cited, in accordance with accepted academic practice. No use, distribution or reproduction is permitted which does not comply with these terms.
*Correspondence: Qing Sun, c3E5OTAzMDJAMTYzLmNvbQ==