 Taihao Wang
- 1College of Meteorology and Oceanology, National University of Defense Technology, Changsha, China
- 2Institute of Atmospheric Physics, Chinese Academy Sciences, Beijing, China
- 3Bureau of Audit of Foshan Municipality, Foshan, China
During the lockdown implemented to curb the spread of COVID-19, human activities have drastically reduced, providing a valuable opportunity to study and compare the impact of meteorological conditions and human activities on air quality. In this study, large-scale weather circulation, local meteorological conditions, and the impact of human activities are comprehensively considered, and changes in the concentration of major air pollutants in the northeast during this period are systematically studied. The large-scale weather circulation patterns that mainly affect the northeast region are divided into nine types by using the T-mode Principal components analysis objective circulation classification method. It is found that the northeast region is located at the edge of weak high pressure (Types 1, 2, and 7) and at the rear of high pressure (Type 4) and has higher concentrations of PM2.5, NO2, SO2, and CO; in cyclonic weather systems, low vortices (Types 3 and 5) and under the influence of the updraft (Type 6) in front of the trough, the ozone concentration is higher. The changes in the concentrations of PM2.5, NO2, CO, SO2, and O3 in the three cities, namely Shenyang, Changchun, and Harbin, during the lockdown period are compared, and it is found that the concentrations of PM2.5, NO2, CO, and SO2 have a tendency to first decrease and then increase, while the changes of O3 concentration are cyclical and increased significantly during this period. This demonstrates that pollutants such as PM2.5, NO2, CO, and SO2 are more susceptible to human activities and local meteorological conditions, and changes in O3 concentration are more closely related to changes in weather circulation types. Finally, the FLEXPART-WRF model is used to simulate the pollution process of nine circulation types, which confirms that particulate pollution in the northeast is mainly affected by local emissions and local westward sinking airflow.
1 Introduction
Since 2020, COVID-19 has spread globally (Jiang and Xu, 2021). Since 23 January 2020, the Chinese government has implemented closed management of cities across the country (China State Council, 2020; Zhao et al., 2020; Sulaymon et al., 2021a). A series of strict control measures, such as reducing large-scale activities, restricting people’s transportation, shutting down large factories and enterprises, and closing schools, has been beneficial in constraining the rapid spread of the disease (Chen S. et al., 2020; Liu et al., 2020; Li et al., 2021; Tian et al., 2020; Zhang et al., 2020; Zhao et al., 2021a). Many studies have also found that these restrictions have greatly improved the local air quality (Chen H. et al., 2020; Mahato et al., 2020; Muhammad et al., 2020; Sulaymon et al., 2021a). Silver et al. (2020) found that the average concentration of pollutants such as NO2, PM2.5, and PM10 in China during the lockdown period was significantly reduced by 27, 10.5, and 21.4%, respectively. The region with the largest decline was Hubei Province, with NO2 concentration being 50.5% lower than that expected during the lockdown. Filonchyk et al. (2020) used satellites to monitor changes in the concentration of SO2, NO2, CO, and AOD (Aerosol Optical Depth) in Eastern China during this period and found that during the COVID-19 lockdown, CO and NO2 concentrations in the region decreased by 20 and 30%, respectively, because of strict control of industrial and traffic emissions. Some countries in Europe, North America, and Africa also implemented strict lockdown measures, which reduced the concentration of local pollutants (Xiang et al., 2020; Zambrano-Monserrate et al., 2020; Filonchyk et al., 2021; Mostafa et al., 2021; Skirienė and Stasiškienė, 2021). Tobías et al. (2020) found that in Spain, the concentration of pollutants such as NO2 and PM10 decreased considerably during the lockdown. Berman and Ebisu, (2020) showed that the PM2.5 concentrations declined in the counties in the United States that implemented strict lockdown measures. Venter and Kristin, (2020) showed that isolation measures reduced the concentration of NO2 and particulate matter in 34 countries and regions by approximately 60 and 31%, respectively, and that the effect on ozone was mixed. Dinoi et al., 2021 showed that different percentage reductions in atmospheric nanoparticle concentrations are observed, −19% and −23% in Lecce and −7% and −4% in Lamezia Terme in southern Italy during lockdown and postlockdown, respectively. However, some studies have found that the concentration of pollutants sometimes increased abnormally during the lockdown (Broomandi et al., 2020; Dai et al., 2020; Liu et al., 2020; Wang et al., 2020; Zhao X. et al., 2021; Hong et al., 2021; Li et al., 2021). Sulaymon et al. (2021b) studied the changes in air quality during the pandemic in the Beijing-Tianjin-Hebei region of China and found that unfavourable weather conditions during the COVID-19 lockdown led to increasing PM2.5 pollution in this region. Hong et al. (2021) studied the changes in the concentration of pollutants along the southeast coast of China during this period and found that although traffic, dust, and industrial emissions decreased significantly by 9, 8.5, and 8%, respectively, the O3 concentration increased by 28.1% compared with that during the same period in 2019. Liu et al. (2020) studied the changes in air quality during the pandemic in the Yangtze River Delta and found that a significant increase in ozone concentration during the lockdown was caused by emission reduction (29–52%) and changes in meteorological conditions (17–49%). The increase in ozone concentration accelerates the formation of secondary aerosols. Shen et al. (2021) studied the impact of meteorological conditions on air pollution changes in Hubei, China, during the COVID-19 lockdown and found that abnormal vertical wind divergence and northeasterly winds contributed to the serious PM2.5 pollution. Most studies have only considered changes in the concentration of pollutants during the pandemic caused by local meteorological conditions or human activities (Chang et al., 2020; Huang et al., 2020; Shi and Brasseur, 2020). However, a few studies have combined large-scale weather circulation, local meteorological conditions, and meteorological factors and comprehensively considered the effects of human activities.
Northeast China is China’s heavy industry base (Li et al., 2015; Zhao et al., 2017), and biomass burning frequently occurs (Li et al., 2019; Cheng et al., 2021). This region witnesses a serious air pollution problem all year round (Ma et al., 2018; Li et al., 2019). The present study focuses on the relationship among air quality, weather conditions, and human activities in Northeast China during the lockdown implemented to control the pandemic. First, the T-PCA method is used to divide the synoptic circulation patterns in the northeast region into nine types, analyse the corresponding local meteorological conditions under each circulation type, and discuss the effects of circulation patterns and local weather conditions on changes in the concentration of main pollutants, namely PM2.5, O3, NO2, SO2, and CO. Then, based on the proportion of circulation patterns in Northeast China from January to April during 2016–2020 (defined as specific period, SP, same below), the changes in pollutant concentration during the SP period are discussed. Further, the 2020 pandemic lockdown phase is divided into three periods, before control (BC) unblocked, under control (UC) strictly blocked, and after control (AC) restricted activity period. The main circulation patterns in the three periods are analysed and the causes of abnormal large-scale air pollution during the epidemic in Northeast China are discussed, combining the changes in pollutant concentrations in the three periods. Finally, nine severe pollution events with PM2.5 concentrations exceeding the national secondary standard (75 μg/m3) under nine circulation patterns are screened, and the backward plume trajectory is simulated using the FLEXPART-WRF model to analyse the characteristics of pollutant transmission.
2 Data, Method, and Model
2.1 Data
2.1.1 Meteorological Data
In this study, we use the fifth-generation atmospheric reanalysis data ERA5 data set developed by ECMWF to perform circulation classification, with a horizontal resolution of 0.25 × 0.25. The sea level pressure field of 500 hPa, geopotential height field of 850 hPa, and wind field at 00:00 UTC time by day from 1979 to 2020 are used to determine the daily circulation pattern. The space range is 25–60° N, 105–140° E. To analyse the local meteorological conditions during the study period (2016–2020) in the northeast region, we use hourly wind field, humidity, and temperature data from meteorological observatories in Harbin, Changchun, and Shenyang to compare the local meteorological conditions, which are obtained from the National Climate Data Center (ftp://ftp.ncdc.noaa.gov/pub/data/noaa/) under the National Oceanic and Atmospheric Administration of the United States. The observatories are Harbin Taiping Airport, Changchun Longjia Airport and Shenyang Taoxian Airport, respectively.
2.1.2 Air Quality Data
Air pollution data are obtained from the China Environmental Monitoring website (http://www.cnemc.cn). Station-wise data are released after quality control by the environmental protection department. In this study, the 24 h average concentration data of PM2.5, NO2, SO2, and CO and the daily maximum 8 h average (MDA8) ozone concentration from 30 monitoring sites in Northeast China in Harbin, Changchun, and Shenyang are used. We also use the daily PM2.5 concentration data (Geng et al., 2021) in the near real-time tracking data set (TAP) of China’s atmospheric composition (spatial range: 25–60° N, 105–140° E; horizontal resolution = 10 km) to reflect the spatial distribution characteristics of pollutants when serious pollution occurs under each circulation pattern during lockdown and to verify the results of the backward simulation of the pollutant particle trajectory. The data set incorporates ground observations, satellite remote sensing, emission inventories, model simulations, and other multi-source data (Xiao et al., 2021a, 2021b) that can more accurately reflect the pollution status of the study area.
2.1.3 Study Area
To study the temporal and spatial distribution and change characteristics of the concentration of major atmospheric pollutants during the epidemic blockade, in this study, the northeast region is divided into three regions, namely Harbin (Northern N), Changchun (Middle M), and Shenyang (Southern S). All three regions include elements such as mountains, industrial areas, major cities, villages, and grasslands, and thus can represent the local meteorological conditions and the characteristics of the temporal and spatial distribution of pollutants in the northeast. The scope of the three regions and the surrounding topography are shown in Figure 1.
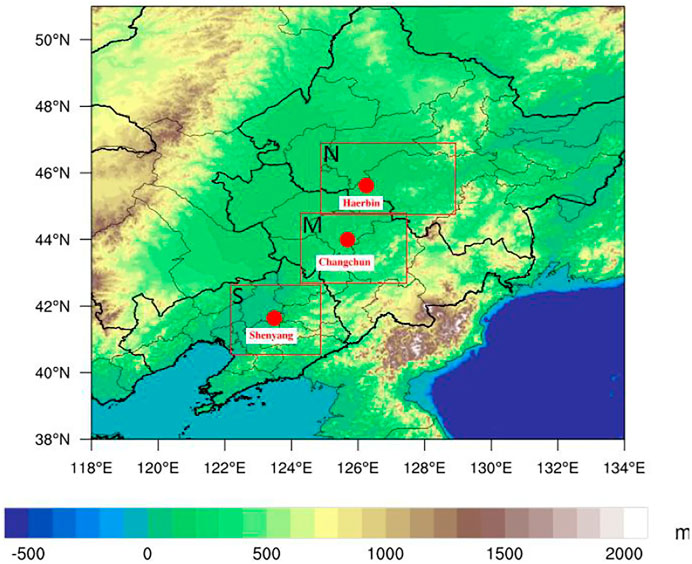
FIGURE 1. Research area and surrounding terrain.
2.2 Circulation Classification Method
To obtain an accurate and stable weather circulation pattern that affects Northeast China, we use the T-PCA method proposed by Huth et al. (2008) to classify the large-scale weather circulation in the northeast. Assuming that the parameter dependence is small, this method is widely used in the analysis of the impact of large-scale weather circulation on pollutants (Compagnucci and Richman, 2008; Zhou et al., 2018; Zhou et al., 2019; Zhao et al., 2019; Zhao et al., 2021b; Wang et al., 2022). Herein, sea level pressure field of 850 hPa and wind field and altitude field of 500 hPa are used to comprehensively and accurately explore the weather types that mainly affect this region. We use the COST733 mode software package based on the FORTRAN language, and the specific usage has been presented in detail in other studies (Yan et al., 2021; Zhang et al., 2018; Philipp et al., 2010; Philipp et al., 2014). Zhang et al. (2012) proved that circulation patterns are generally divided into nine types in the mid-high latitudes of the northern hemisphere; a similar classification method is adopted in this study.
2.3 Parameterisation Scheme of the WRF and FLEXPART-WRF Models
The WRF model can provide accurate weather field variables for the FLEXPART-WRF model in particle trajectory simulation. In this simulation, we use two nests; the first nesting is 15 × 15 km2 in horizontal resolution, covering the entire eastern part of China, and the second nesting is 4 × 4 km2, covering the entire northeast region. The main parameterisation schemes are Mellor-Yamada-Janjic (Eta) TKE boundary layer parameterisation scheme, Noah land surface scheme (Chen et al., 2006), WSM 3-class simple ice scheme (Hong et al., 2004), Kain-Fritsch (new Eta) Cumulus convection parameterisation scheme (Kain, 2004), Monin-Obukhov (Janjic Eta) surface layer scheme (Nakanishi and Niino, 2006), RRTM longwave radiation scheme (Mlawer et al., 1997), and Dudhia shortwave radiation scheme (Dudhia, 1989). The initial and boundary conditions of the model use fnl (Final) Operational Global Analysis 6-h data per day (horizontal resolution 0.25◦×0.25◦) from the National Centers for Environmental Prediction (NCEP), and the model outputs the results every 30 min.
Furthermore, we use the FLEXPART-WRF version 3.3 of the Lagrangian particle diffusion model (Brioude et al., 2013) that uses the function of backward simulation of particle trajectory. Because Changchun is located in the middle of the northeast, it is more susceptible to pollution particles from the south, north, and surrounding areas; therefore, the Changchun area (143.35N, 43.88E) is selected as the particle release point. The model releases particles uniformly every 1 h during the nine types of simulation periods (24 h) in Changchun area; overall, 50,000 particles are released throughout the simulation period. A total of five layers of vertical stratification (10, 100, 500, 1,000, and 5,000 m) are set up. The release height of particle clusters is 10–1,000 m, and the horizontal resolution is 0.125 × 0.125. The model comprehensively considers the processes of release transmission, turbulent diffusion, and dry and wet sedimentation and simulates the dispersion and aggregation of particles, possible source distributions, and other conditions by calculating the backward transmission trajectory of large-scale particles. In this study, we superimpose the 48-h plume trajectories of particles under several circulation patterns (Zhang et al., 2012; Shen et al., 2021) to obtain a comprehensive distribution, which helps analyse the source of pollutants and factors affecting the diffusion of pollutants.
3 Relationship Between Circulation Types and Pollutants in Northeast China
3.1 Circulation Classification Results
Figures 2A–C shows the nine main weather circulation patterns, with geopotential height fields and wind fields of 850 hPa and 500 hPa, respectively, that affect the northeast region of China. According to the ground circulation characteristics, the nine circulation types are classified as follows: Type 1 (western high-pressure type), Type 2 (northwest high-pressure type), Type 3 (northeast high-pressure type, weak pressure gradient), Type 4 (high-pressure type), Type 5 (northern low pressure, southeast high-pressure type), Type 6 (low pressure type), Type 7 (southwest high-pressure type), Type 8 (northern high-pressure type), and Type 9 (eastern high-pressure type). Figure 2 shows that the main types of circulation affecting the study region are Type 1 (21.7%) and Type 5 (20.1%) followed by Type 2 (13.2%).
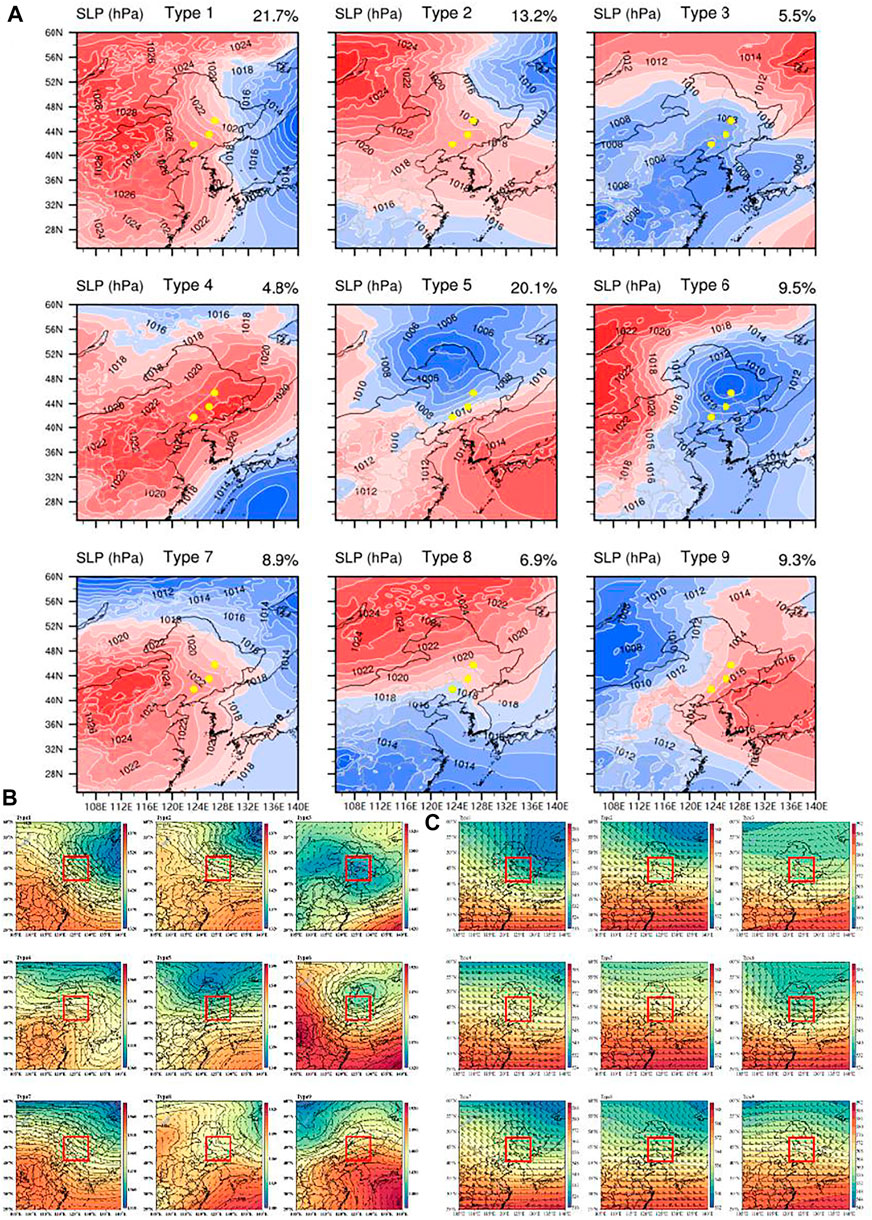
FIGURE 2. (A–C) Nine main weather circulation types (SLP) affecting the northeast, 850 hPa geopotential height field and wind field, and 500 hPa geopotential height field and wind field.
Types 1, 2, 4, and 7 are mainly related to the activities of cold high pressure. Under Type 1 and 7 control, the high-pressure centre is located in the west of the northeast region. Under Type 2 control, cold high pressure has not yet entered the territory of China, which is far from the northeast region. Type 4 controls the lower northeast region and is located behind the cold high pressure; it is closest to the high-pressure centre. Under the control of Types 3, 5, and 9, the West Pacific subtropical high extends from the west to the north and affects most of China. At the same time, the lower northeast of Types 3 and 5 is also affected by the low vortex. Under Type 6, the northeast region is often affected by high-altitude troughs and cyclones. At this time, the northeast region is often in front of the trough. The northeast area under the control of Type 8 is affected by both cold high pressure and subtropical high; thus, cold high pressure has a considerable influence on the northeast area.
3.2 Seasonal Characteristics, Local Meteorological Characteristics of the Nine Circulation Types, and Their Relationship With the Concentration of Major Air Pollutants
Figures 3, 4 show the seasonal distribution of nine circulation types and the corresponding local wind fields in Northeast China. Figure 5 shows the relationship between the concentration of five major pollutants (PM2.5, O3, NO2, CO, and SO2) and the circulation types in Harbin, Changchun, and Shenyang. The distributions of the five air pollutants under the nine circulation types in Changchun, Harbin, and Shenyang are relatively consistent. Table 1 shows the average values of the concentrations of these five pollutants under nine circulation types, as well as the average values of temperature, relative humidity, and wind speed, in these three cities. Figures 3–5 and Table 1 show that Types 1, 2, 4, and 7 mainly appear in winter and autumn. At this time, the northeast region is cold and dry (average temperatures are −0.26 , 7.35, 10.68, and 4.08 °C under Types 1, 2, 4 and 7 respectively, and the corresponding average relative humidity percentages are 40.65, 45.36, 43.74, and 42.25% under Types 1, 2, 4 and 7 respectively), the local wind field is characterised by weak southwesterly and northerly winds (average wind speed = 2.62 m/s, 2.77 m/s, 2.12 m/s, 2.12 m/s, and 2.59 m/s). In the meanwhile, Compared with summer, the atmosphere is more prone to static stability in autumn and winter (Zhou et al., 2019). Therefore, the diffusion conditions are poor, which is not conducive to the diffusion and transmission of pollutants, and the accumulation of pollutants is likely to occur under the control of Types 1, 2, 4, and 7. The concentrations of PM2.5, NO2, SO2, and CO under these types of circulation are relatively high (the average concentrations are as follows: PM2.5–47.8 μg/m3, 51.5 μg/m3, 56.3 μg/m3, and 57.1 μg/m3, NO2 –39.4 μg/m3, 38.8 μg/m3, 46.6 μg/m3, and 42.1 μg/m3, SO2 –33.01 μg/m3, 30.07 μg/m3, 31.58 μg/m3, and 32.01 μg/m3, and CO –0.92 mg/m3, 0.93 mg/m3, 1.15 mg/m3, and 1.01 mg/m3). Type 3 has obvious summer characteristics (high temperature and high humidity), with an average temperature of 23.85 °C and an average relative humidity of 57.29%. The region is dominated by strong northeast winds (average wind speed = 3.51 m/s), which is conducive to the diffusion and transmission of pollutants. PM2.5, NO2, SO2, and CO concentrations are extremely low (22.5 μg/m3, 29.6 μg/m3, 9.8 μg/m3, and 0.635 mg/m3, respectively), but at this time, O3 concentration is very high (97.2 μg/m3). Type 6 often occurs in spring and autumn. Due to the westerly wind (average wind speed = 4.58 m/s) in front of the trough, pollutants cannot accumulate easily. Simultaneously, the convection is prone to precipitation, which is conducive to the deposition of pollutants. At this time, the concentrations of PM2.5, NO2, SO2, and CO are relatively low (38.2 μg/m3, 31.3 μg/m3, 18.9 μg/m3, and 0.86 mg/m3), but O3 concentration is high (86.9 μg/m3). Types 5 and 9 mainly appear in summer and spring. The local wind field in the northeast under Type 5 is dominated by strong southwest wind (average wind speed = 5.4 m/s), with high temperature and humidity (20.17 °C and 47.13%, respectively) and convective development. Because of vigorous and good diffusion conditions, pollutants do not easily accumulate (the average concentrations of PM2.5, NO2, SO2, and CO are 40.1 μg/m3, 31.5 μg/m3, 18.1 μg/m3, and 0.85 mg/m3, respectively). The warm and humid airflow in the south brought by the subtropical high under Type 9 control is strong (average wind speed = 3.84 m/s), which is conducive to the diffusion of particulate pollutants, and the concentrations of PM2.5, NO2, SO2, and CO are relatively low (39.2 μg/m3, 34.5 μg/m3, 17.8 μg/m3, and 0.84 mg/m3), but O3 concentration is higher under the above two types of circulations (113.4 μg/m3 and 108.9 μg/m3, respectively).
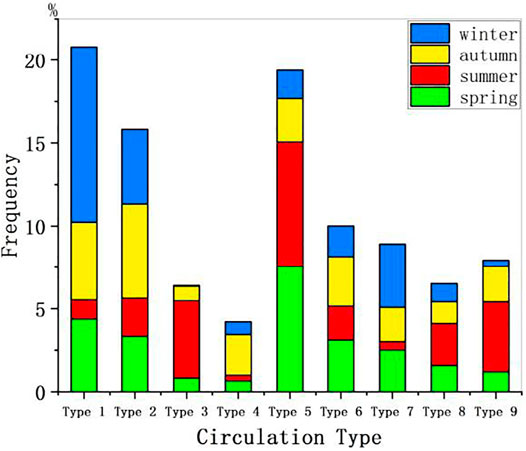
FIGURE 3. Seasonal distribution of nine circulation patterns in Northeast China during 2016–2020.
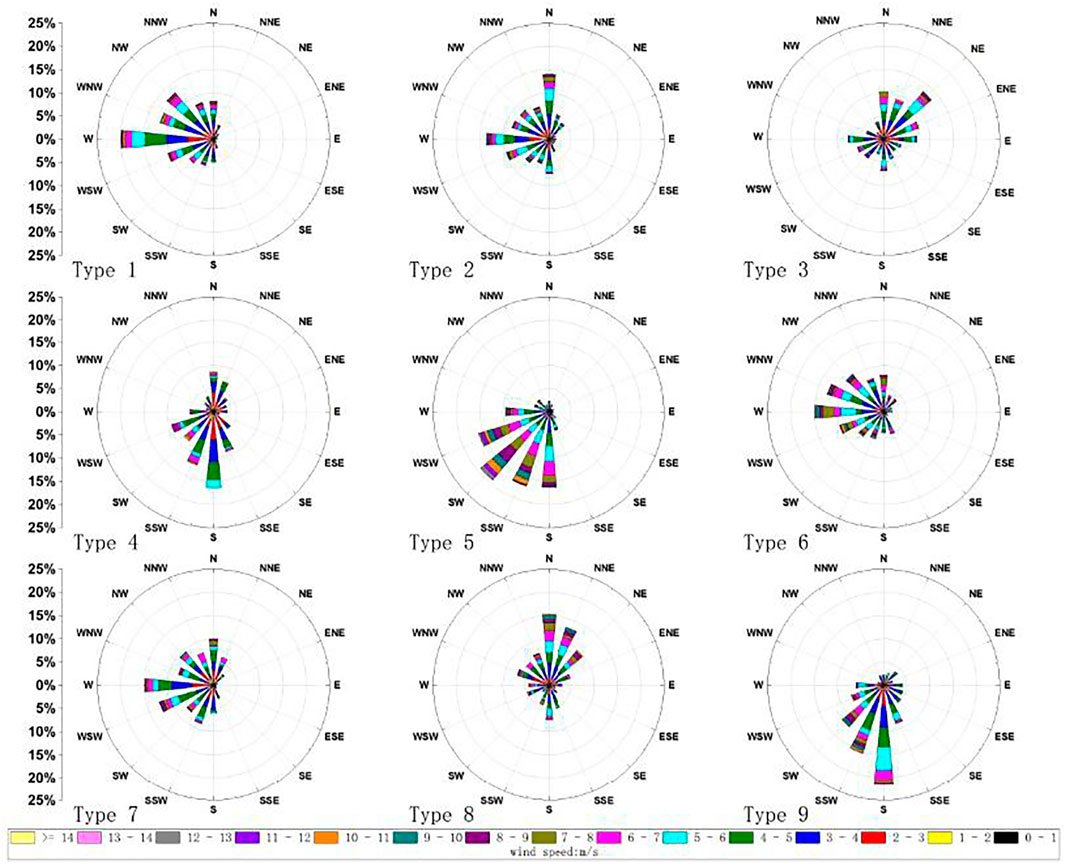
FIGURE 4. A wind rose of the local wind field corresponding to the nine circulation types in Northeast China during 2016–2020.
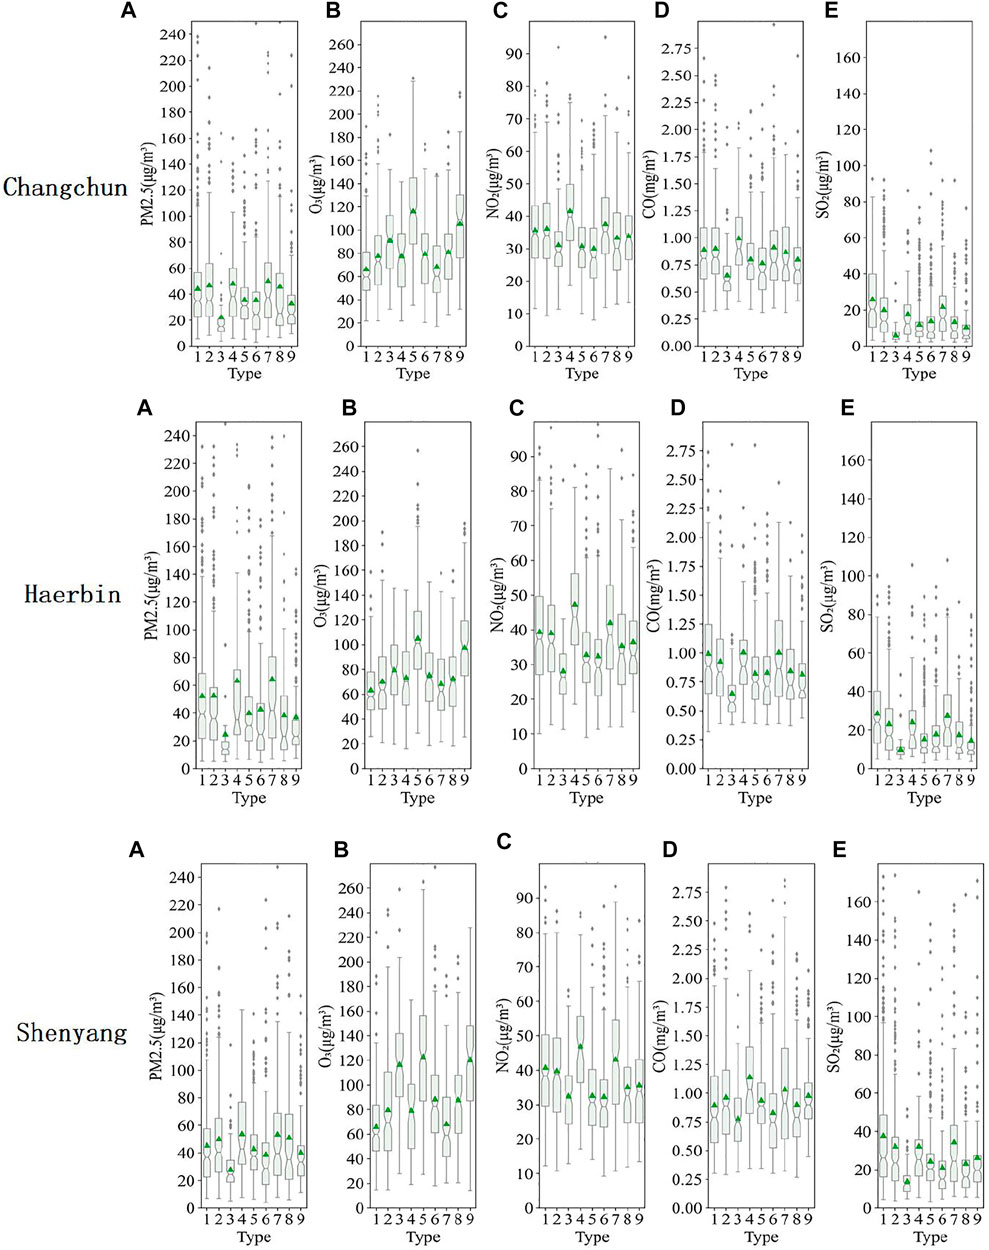
FIGURE 5. Relationship between the nine circulation patterns and the concentration of major air pollutants in Changchun, Harbin, and Shenyang; the triangle represents the average concentration, the short line represents the median concentration of pollutants, the upper short line of the box represents the third-quarter value, and the lower short line of the box represents the quarter-quarter value.
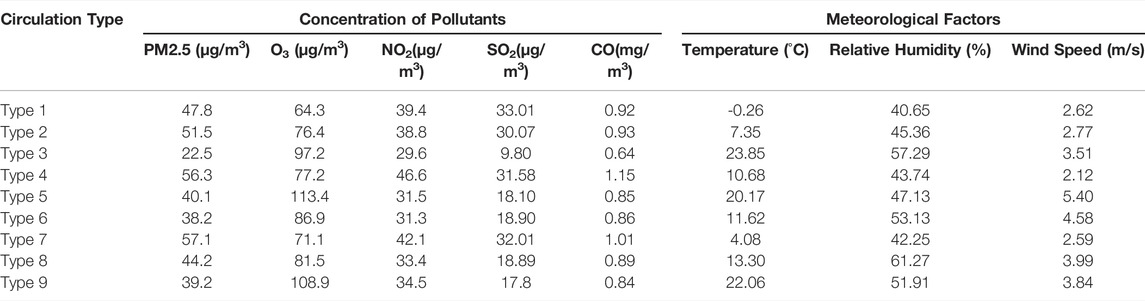
TABLE 1. Average concentrations of the five major atmospheric pollutants (PM2.5, O3, NO2, SO2, and CO) of the nine circulation types in Northeast China, and values of local meteorological elements (temperature, relative humidity, and average wind speed) during 2016–2020.
Based on the aforementioned analysis, we draw the following conclusions: under the control of Types 1, 2, 4, and 7, the concentrations of PM2.5, NO2, SO2, and CO in the northeast are all high, while under the control of Types 3, 5, 6, and 9, the concentrations of PM2.5, NO2, SO2, and CO are maintained at relatively low levels. O3 concentration distribution is different from other that of pollutants. O3 concentration is high under the control of Types 3, 5, 6, and 9, whereas it is low under the control of Types 1, 2, 4, and 7.
4 Changes in the Concentration of Pollutants in Northeast China During COVID-19
4.1 Changes in Circulation Types and Air Quality During the SP
Figure 6 shows the proportions of the nine main circulation patterns during the SP, which were rather similar. The main circulation patterns are Type 1, 2, 5, and 7, indicating that the weather-scale circulation affecting the northeast region during January–April is relatively stable. Comparing the analysis in Section 3.1, we find that Types 1, 2, and 7 respectively represent the three locations of cold high pressure affecting the northeast region, which is more consistent with the climatic characteristics of the northeast region during January–April. In spring (March–May), with the appearance of the northeast cold vortex and the northward uplift of the subtropical high, Type 5 appears more frequently (accounting for 13–18%).
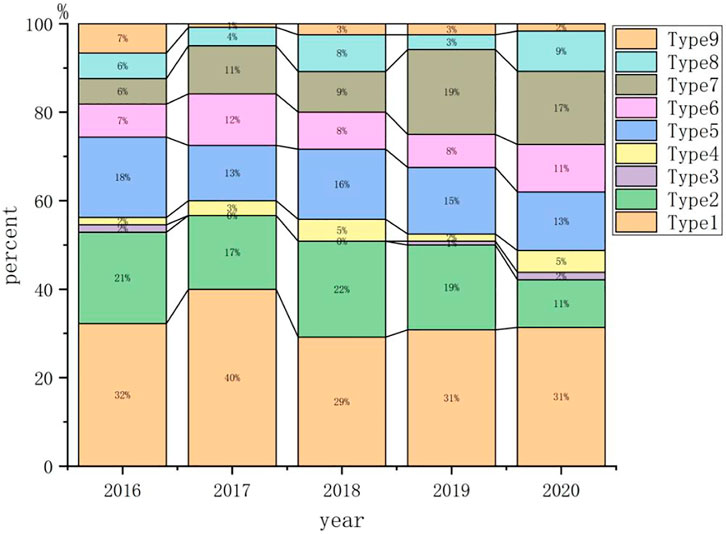
FIGURE 6. Proportions and changing trends of the nine circulation patterns during the SP period.
Figure 7 shows the concentration changes of the five main pollutants during the SP. The abscissa p1–p12 indicate that the January–April period is divided into 12 periods. Among these, p1–p3 correspond to BC, p4–p9 correspond to UC, and p10–p12 correspond to AC. At the same time, the average concentration change rate (R) is defined as the ratio of the difference (between the average pollutant concentration in 2020 under each circulation pattern and the average pollutant concentration under the same circulation pattern during 2016–2019) and the average concentration of pollutants under the same circulation pattern during 2016–2019. R > 0 means increase, and R < 0 means decrease; a large absolute value of R implies an obvious change, and vice versa. In this study, the circulation type during the lockdown period is roughly the same as in the same period in 2016–2019, although the human activity is substantially reduced. Therefore, the average concentration change rate R can reflect the degree to which meteorological conditions and human activities affect air quality in the region. Greater absolute value of the average concentration change rate R implies greater impact of human activities on the concentration of these pollutants, and the converse, that is, greater impact of circulation conditions on the concentration of these pollutants is also true. Table 2 shows the change rates of PM2.5, NO2, SO2, CO, and O3 pollutant concentrations during UC in 2020 compared with the same period in 2016–2019. Table 3 shows the average concentration change rate R of PM2.5 and O3 under nine circulation patterns. Figure 7; Table 2 show that the PM2.5 concentration of the three cities during the UC period decreased by 31.39, 29.7, and 23.7% from the average for the same period during 2016–2019 (average decrease of the three cities = 28.24%). The change trend of NO2, CO, and SO2 concentrations is similar to that of PM2.5, and their concentrations also declined significantly during the UC period (the average change rates are −39.31%, −33.37%, and −55.49%, respectively). This shows that the industrial, transportation, and agricultural emissions during the UC period decreased significantly compared with the same period during 2016–2019, resulting in a decrease in PM2.5, NO2, SO2, and CO concentrations. Human activities significantly impacted the concentration changes of these pollutants. Table 3 shows that the absolute value of the change rate R of the average PM2.5 concentration under the nine circulation patterns is very large, indicating that the PM2.5 concentration responds more strongly to human activities. The change trend of O3 concentration during the SP is almost the same and shows some regularity. During the UC period in 2020, the change rate of O3 concentration during the same period during 2016–2019 is only −2.43%. Additionally, Table 3 shows that the absolute value of the change rate R of the average O3 concentration is relatively small, indicating that although O3 concentration is affected by human activities and weather conditions, it is more susceptible to weather circulation conditions compared to PM2.5 concentration.
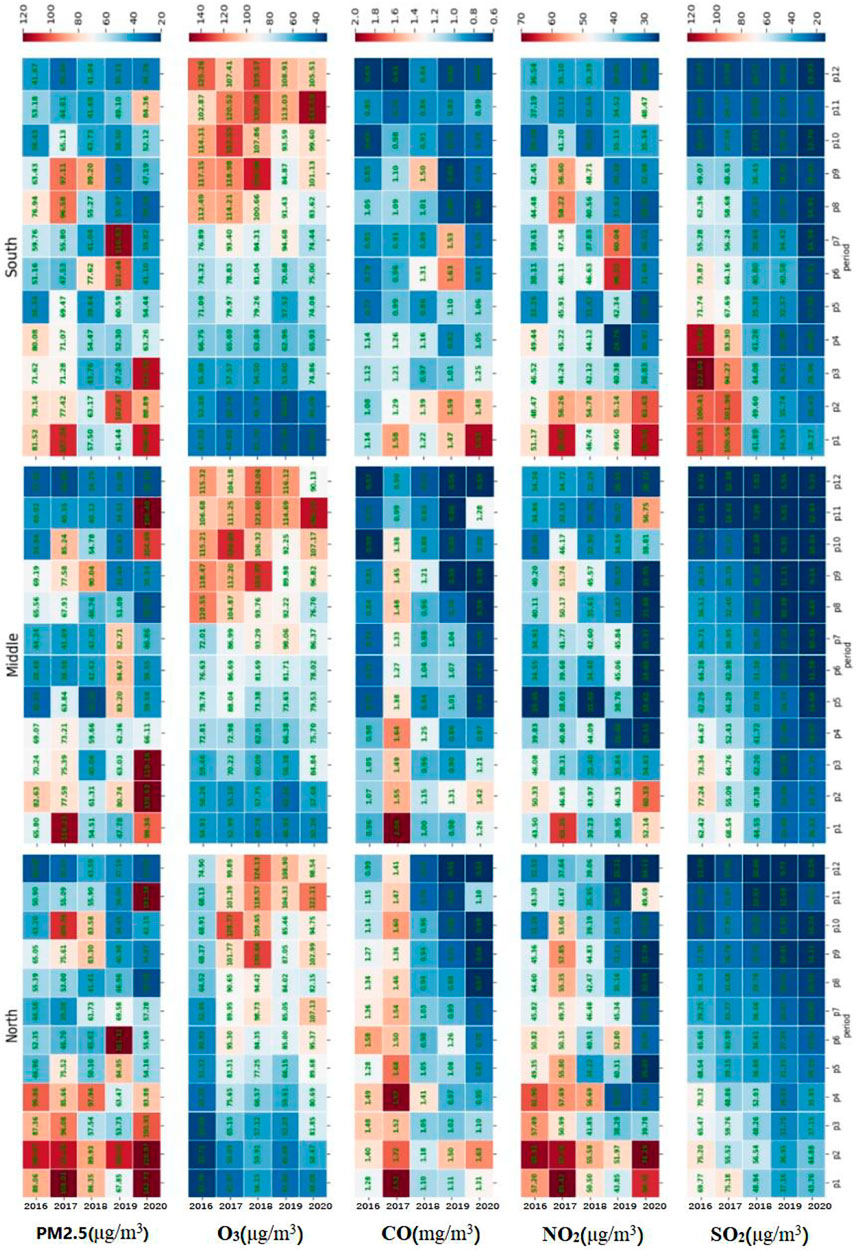
FIGURE 7. Heat map of the changes in the concentration of the five main pollutants during the SP. The north is Harbin, the middle is Changchun, and the south is Shenyang. The green numbers indicate the average pollutant concentration.
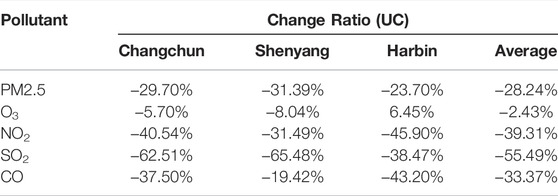
TABLE 2. Change rate of PM2.5, NO2, SO2, CO, and O3 pollutant concentrations during UC in 2020 compared with the same period in 2016–2019.
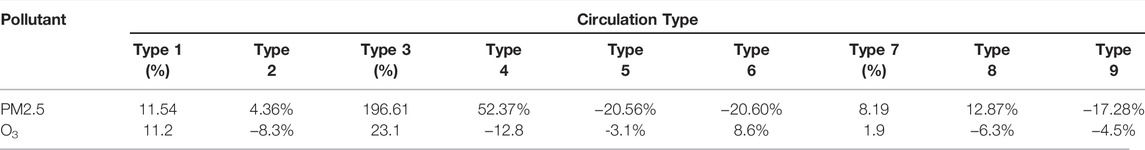
TABLE 3. Average concentration change rate R of PM2.5 and O3 under nine circulation types.
4.2 Changes of Air Quality in BC, UC, and AC Stages
Figure 8 shows the proportion of each circulation pattern under BC, UC, and AC. In the BC stage, the northeast region is mainly influenced by Types 1, 2, 4, and 7 (accounting for 32.3, 19.4, 12.9, and 22.6%, respectively), whereas in the UC stage, it is mainly influenced by Types 1, 2, 5, and 7 (accounting for 26.7, 11.7, 20, and 20%, respectively). The main circulation patterns of the BC and UC stages are not much different. In the AC phase, the circulation patterns affecting the northeast are Types 1, 5, 6, and 8 (40, 10, 30, and 10%, respectively), which are significantly different from the BC and UC phases. During the entire lockdown period, the total proportions of Types 1, 2, 4, and 7 gradually decrease over time (87.2, 61.2, and 43.3% in BC, UC, and AC, respectively). This shows that from winter to spring, the influence of cold high pressure on the northeast region gradually weakens. In the spring, the northeast cold vortex and cyclone systems frequently appear, and the subtropical high moves northward. Therefore, the total proportions of Types 3, 5, 6, and 9 related to these conditions during BC, UC, and AC also gradually increase (3.2, 30, and 46.7%, respectively). As mentioned in Section 3.2, the appearance of the aforementioned four circulation patterns is also related to the increase in O3 concentration.
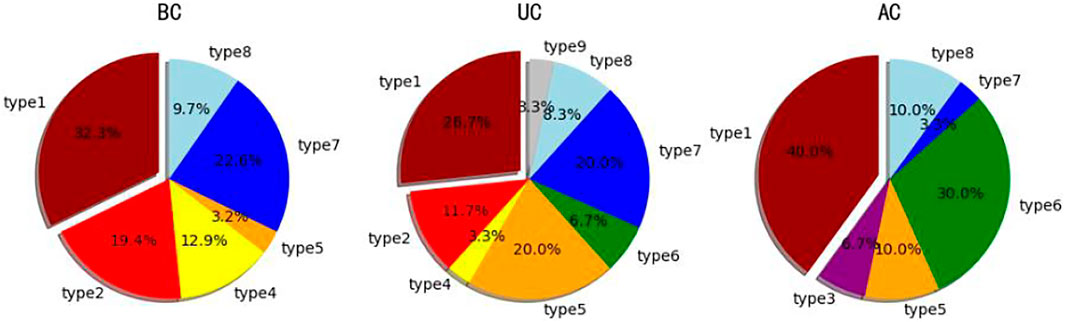
FIGURE 8. Proportion of the nine circulation types in the BC, UC, and AC stages.
Figure 9 shows the changes in the concentration of the five major pollutants between BC and UC stages and between UC and AC stages in Northeast China in 2020. As illustrated in Figures 8, 9, although the proportion of Types 1, 2, 4, and 7 decreased from 87 to 43.3% from the BC stage to the AC stage in 2020, the PM2.5 concentration did not consistently decrease; it first increased and then decrease, that is, due to curtailed human activities, the PM2.5 concentration considerably decreased from the BC stage to the UC stage (average rate of change = −50.22%). From the UC stage to the AC stage, some restrictions on human activities were lifted, and therefore, the PM2.5 concentration increased and showed a wide range (average rate of change = 28.32%). When the proportions of Types 3, 5, 6, and 9 corresponding to high ozone concentration increase, the O3 concentration shows an increasing trend from the BC stage to the UC stage and from the UC stage to the AC stage (the change rates are 37.81 and 29.54%, respectively). However, the increase rate from the BC stage to the UC stage is significantly higher than the increase rate from the UC stage to the AC stage. This is because PM2.5 decreased from the BC stage to the UC stage, the shading rate decreased, and the radiation enhanced, which promoted the photochemical reactions, generating large amounts of O3 while consuming large amounts of NO2. The concentrations of NO2, CO, and SO2 showed similar trend as that of PM2.5, decreasing considerably during the UC stage (the change rates are −44.94%, −38.5% and −38.45%, respectively). However, during the AC stage, these values showed an increasing trend, with the average increase rates of 21.1, 4.05, and 1.64%, respectively.
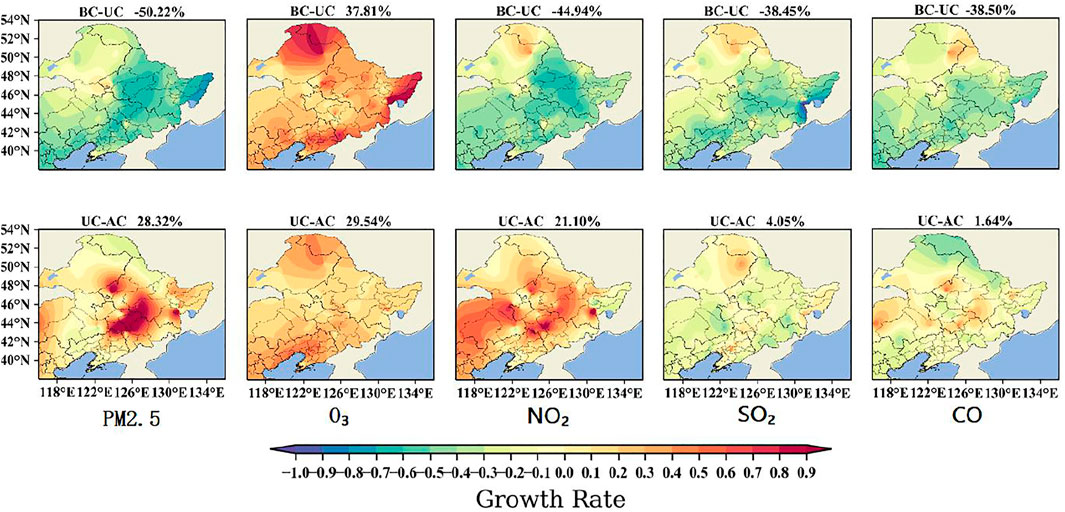
FIGURE 9. Spatial distribution of the concentration change rates of the five main pollutants in the BC-UC and UC-AC phases during the lockdown period in 2020.
In summary, curtailing human activities during the lockdown only slightly impacted the concentration changes of O3, and it was mainly affected by the large-scale circulation conditions. The concentrations of PM2.5, NO2, SO2, and CO, however, were greatly affected by the curtailed human activity during the lockdown.
4.3 Numerical Simulation Study on the Source of Particulate Matter During the Pandemic in Northeast China
To study the source and transmission path of the main pollutants during the lockdown period in 2020 in the northeast, Changchun City, located in the central part of this region, was selected for the simulation study of pollutant particle trajectory. The time periods when the average daily PM2.5 concentration during the lockdown period of COVID-19 was >75 μg/m3 were determined, and these periods were classified according to the circulation type. A 24-h backward trajectory simulation analysis was carried out to characterise the pollutant trajectory of each period under each circulation pattern.
Figure 10 shows the distribution of PM2.5 concentration corresponding to heavy pollution periods under the nine circulation patterns based on TAP data. Figure 11 shows the backward plume trajectory of pollutant particles in nine circulation patterns.
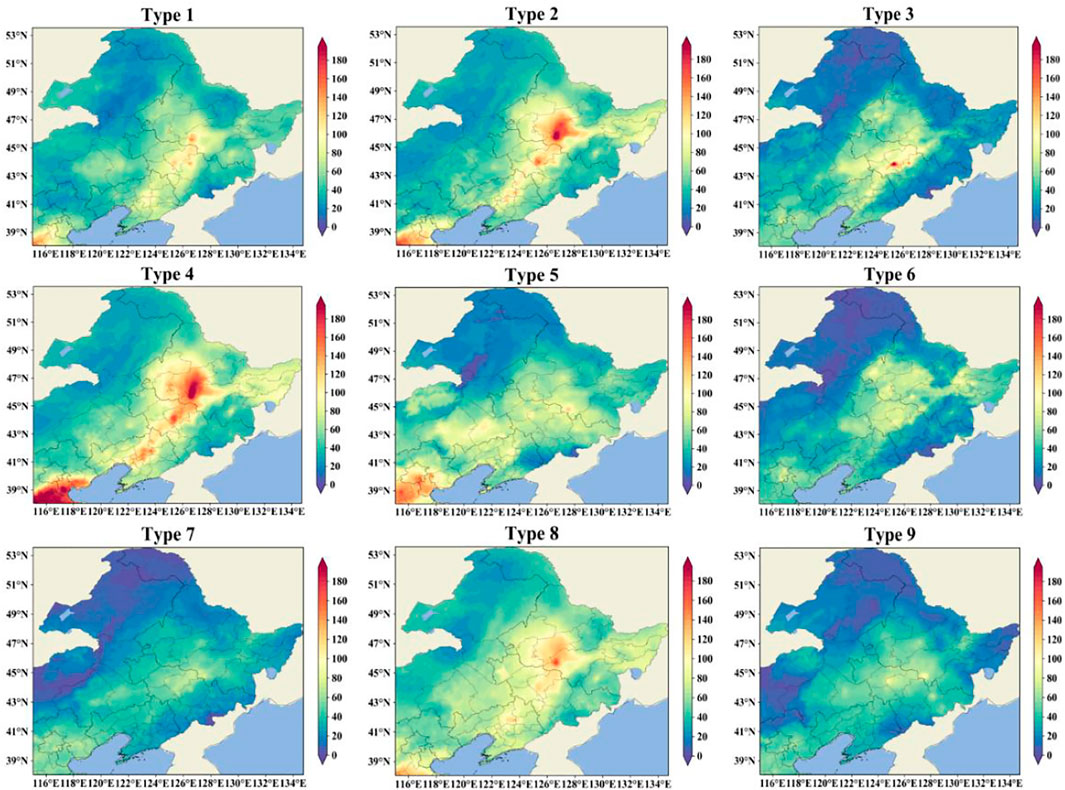
FIGURE 10. Distribution characteristics of PM2.5 concentration during severe pollution periods under nine circulation types.
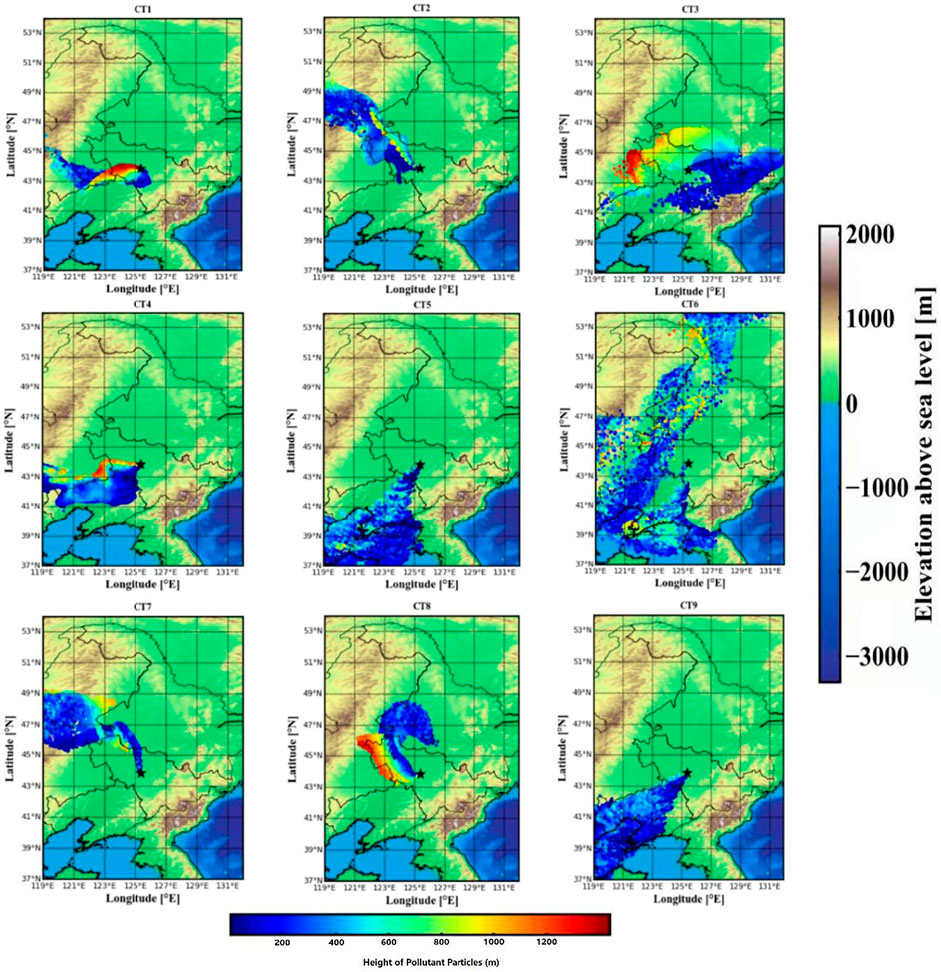
FIGURE 11. Backward plume trajectory of particles during heavy pollution periods of PM2.5 under nine circulation types during the lockdown. The colour bar below indicates the height of the particles from surface and that on the right represents the terrain height.
Figures 10, 11 show that under Type 1, pollutants exist in North China and the eastern part of Northeast China. However, the pollutants in Changchun are from the western part of Changchun. The heavily polluted areas under Type 2 are in Northeast and North China, and PM2.5 pollutants in Changchun come from the northwest mountains. The distribution of pollutants under Type 3 is concentrated around Changchun, and the pollutants transmitted over long distances mainly come from the mountainous areas in northern North Korea. The heavily polluted area under Type 4 appears on a heavily polluted zone in the northeast-southwest direction centred on the Harbin–Changchun–Shenyang region. The pollutants that affect Changchun mainly come from the surrounding areas such as southwest of Changchun. The particulate matter under Type 5 mainly travels long-distance from North China, Liaodong Peninsula, and northern Korean Peninsula. Under Type 6, there is considerable pollution in the northern part of Heilongjiang, and the particulate matter comes from the northwest part of Northeast China and the Liaodong Peninsula. The PM2.5 concentration under Type 7 is relatively low overall, and only a small area of polluted weather occurs around Changchun. Trajectory simulation shows that the pollution at this time mainly comes from local emissions, and some of the pollutants come from the Greater Xing’an Mountains in Inner Mongolia. Large-scale pollution occurs in the northern part of Northeast China under Type 8, and the pollutant particle trajectory shows that the particulate matter comes from near northwest Changchun. Under Type 9, the PM2.5 concentration in most areas of Northeast China is relatively small, and the pollution in Changchun area comes from the Bohai Bay in North China.
In summary, the particulate pollution in the severe pollution processes of Types 1, 2, 4, 7, and 8 is mainly from Changchun and surrounding area, and the particulate matter transmission height changes significantly. It indicates that the particulate matters are affected by sinking flow. However, particulate matter pollution of Types 3, 5, 6, and 9 in the lower northeast is mainly from North China, Liaodong Peninsula and other areas far away from Changchun.
5 Conclusion
This study investigates the effects of human activities and meteorological conditions on the changes in the concentrations of major pollutants (PM2.5, O3, NO2, SO2, and CO) during the lockdown implemented for curbing the spread of COVID-19. First, we classified the large-scale circulation in the northeast and obtained nine main weather circulation patterns (Type 1–Type 9) that affect this region. Analysis of sea level pressure field (500 hPa and 850 hPa) altitude and local meteorological conditions suggests that meteorological conditions are closely related to air quality in this region. Comparison of the concentrations of pollutants during the lockdown period in 2020 and the same period in previous years, as well as the changes in the concentrations of pollutants at different stages during the lockdown period suggests that human activities and meteorological conditions have different effects on the changes in the concentrations of different air pollutants. The specific research conclusions are as follows:
(1) Under Types 1, 2, 4, and 7, the concentrations of PM2.5, NO2, SO2, and CO in the northeast are high, while under Types 3, 5, 6, and 9, the concentrations of PM2.5, NO2, SO2, and CO are low. The O3 concentration is high under Types 3, 5, and 9, while it is low under Types 1, 2, 4, and 7. Particulate pollution in Northeast China is related to the equalising field in the back of high-pressure regions and the front of weak-high-pressure regions, while O3 pollution is closely related to the trough, low vortex, and surface cyclonic weather systems.
(2) Human activities and local meteorological conditions significantly impact the changes in PM2.5, NO2, SO2, and CO concentrations. Although O3 is formed from NO2 and VOC, O3 concentration is more sensitive to the large-scale weather circulation situation compared to PM2.5.
(3) FLEXPART-WRF simulation results suggest that local emissions and southwest and northwest sinking airflows are the main causes of severe particulate pollution in the northeast during the lockdown period.
Data Availability Statement
The original contributions presented in the study are included in the article/Supplementary Material, further inquiries can be directed to the corresponding author.
Author Contributions
Data curation, JZ; Methodology, JZ; Project administration, CZ; Software, HD; Visualization, HD; Writing—original draft, TW; Writing—review and editing, CZ and ZZ.
Funding
This study was supported by the National Key Research and Development Program of China (Grant No. 2017YFC1501803), the National Natural Science Foundation Committee of China (41475021, 41375154, and 41405146), and the Chinese Prime Minister Fund (DQGG0104). We thank the authors and developers of the COST733 classification software.
Conflict of Interest
The authors declare that the research was conducted in the absence of any commercial or financial relationships that could be construed as a potential conflict of interest.
Publisher’s Note
All claims expressed in this article are solely those of the authors and do not necessarily represent those of their affiliated organizations, or those of the publisher, the editors and the reviewers. Any product that may be evaluated in this article, or claim that may be made by its manufacturer, is not guaranteed or endorsed by the publisher.
References
Berman, J. D., and Ebisu, K. (2020). Changes in U.S. Air Pollution during the COVID-19 Pandemic. Sci. Total Environ. 739, 139864. doi:10.1016/j.scitotenv.2020.139864
Brioude, J., Arnold, D., Stohl, A., Cassiani, M., Morton, D., Seibert, P., et al. (2013). The Lagrangian Particle Dispersion Model FLEXPART-WRF Version 3.1. Geosci. Model. Dev. 6 (6), 1889–1904. doi:10.5194/gmd-6-1889-2013
Broomandi, P., Karaca, F., Nikfal, A., Jahanbakhshi, A., Tamjidi, M., and Kim, J. R. (2020). Impact of COVID-19 Event on the Air Quality in Iran. Aerosol Air Qual. Res. 20 (8), 1793–1804. doi:10.4209/aaqr.2020.05.0205
Chang, Y., Huang, R. J., Ge, X., Huang, X., Hu, J., Duan, Y., et al. (2020). Puzzling Haze Events in China during the Coronavirus (COVID-19) Shutdown. Geophys. Res. Lett. 47, e2020GL088533. doi:10.1029/2020GL088533
Chen, F., Tewari, M., Kusaka, H., and Warner, T. (2006). “Current Status of Urban Modeling in the Community Weather Research and Forecast (WRF) Model,” in paper presented at Joint Session with Sixth Symposium on the Urban Environment and AMS Forum: Managing our Physical and Natural Resources: Successes and Challenges, the 86th AMS Annual Meeting, 28 January–3 February (Atlanta, Georgia: AMS).
Chen, H., Guo, J., Wang, C., Luo, F., Yu, X., Zhang, W., et al. (2020). Clinical Characteristics and Intrauterine Vertical Transmission Potential of COVID-19 Infection in Nine Pregnant Women: a Retrospective Review of Medical Records. Lancet. doi:10.1016/s0140-6736(20)30360-3
Chen, S., Yang, J., Yang, W., Wang, C., and Bärnighausen, T. (2020). COVID-19 Control in China during Mass Population Movements at New Year. The Lancet. 395, 764–766. doi:10.1016/s0140-6736(20)30421-9
Cheng, Y., Cao, X., and Liu, J. (2022). New Open Burning Policy Reshaped the Aerosol Characteristics of Agricultural Fire Episodes in Northeast China. Sci. Total Environ. 810, 152272. doi:10.1016/j.scitotenv.2021.152272
China State Council (2020). The New Coronavirus Disease (Covid-19) Prevention and Control. Available at: http://news.xinhuanet.com/house/bj/2014-03-17/c_126274610.htm.
Compagnucci, R. H., and Richman, M. B. (2008). Can Principal Component Analysis Provide Atmospheric Circulation or Teleconnection Patterns? Int. J. Climatol. 28 (6), 703–726. doi:10.1002/joc.1574
Dai, Q., Liu, B., Bi, X., Wu, J., Liang, D., Zhang, Y., et al. (2020). Dispersion Normalized PMF Provides Insights into the Significant Changes in Source Contributions to PM2.5 after the COVID-19 Outbreak. Environ. Sci. Technol. 54 (16), 9917–9927. doi:10.1021/acs.est.0c02776
Dinoi, A., Gulli, D., Ammoscato, I., Calidonna, C. R., and Contini, D. (2021). Impact of the Coronavirus Pandemic Lockdown on Atmospheric Nanoparticle Concentrations in Two Sites of Southern Italy. Atmosphere. 12, 352. doi:10.3390/atmos12030352
Dudhia, J. (1989). Numerical Study of Convection Observed during the winter Monsoon experiment Using a Mesoscale Two-Dimensional Model. J. Atmos. Sci. 46, 3077–3107. doi:10.1175/1520-0469(1989)046<3077:nsocod>2.0.co;2
Filonchyk, M., Hurynovich, V., Yan, H., Gusev, A., and Shpilevskaya, N. (2020). Impact Assessment of COVID-19 on Variations of SO2, NO2, CO and AOD over East China. Aerosol Air Qual. Res. 20 (7), 1530–1540. doi:10.4209/aaqr.2020.05.0226
Filonchyk, M., Hurynovich, V., and Yan, H. (2021). Impact of Covid-19 Lockdown on Air Quality in the Poland, Eastern Europe. Environ. Res. 198, 110454. doi:10.1016/j.envres.2020.110454
Geng, G., Xiao, Q., Liu, S., Liu, X., Cheng, J., Zheng, Y., et al. (2021). Tracking Air Pollution in China: Near Real-Time PM2.5 Retrievals from Multisource Data Fusion. Environ. Sci. Technol. 55, 12106–12115. doi:10.1021/acs.est.1c01863
Hong, S.-Y., Dudhia, J., and Chen, S.-H. (2004). A Revised Approach to Ice Microphysical Processes for the Bulk Parameterization of Clouds and Precipitation. Mon. Wea. Rev. 132, 103–120. doi:10.1175/1520-0493(2004)132<0103:aratim>2.0.co;2
Hong, Y., Xu, X., Liao, D., Zheng, R., Ji, X., Chen, Y., et al. (2021). Source Apportionment of PM2.5 and Sulfate Formation during the COVID-19 Lockdown in a Coastal City of Southeast China. Environ. Pollut. 286, 117577. doi:10.1016/j.envpol.2021.117577
Huang, X., Ding, A., Gao, J., Zheng, B., Zhou, D., Qi, X., et al. (2020). Enhanced Secondary Pollution Offset Reduction of Primary Emissions during COVID-19 Lockdown in China. Natl. Sci. Rev. doi:10.1093/nsr/nwaa137
Huth, R., Beck, C., Philipp, A., Demuzere, M., Ustrnul, Z., Cahynová, M., et al. (2008). Classifications of Atmospheric Circulation Patterns. Ann. N. Y. Acad. Sci. 1146 (1), 105–152. doi:10.1196/annals.1446.019
Jiang, Y., and Xu, J. (2021). The Association between COVID-19 Deaths and Short-Term Ambient Air Pollution/meteorological Condition Exposure: a Retrospective Study from Wuhan, China. Air Qual. Atmos. Health. 14 (1), 1–5. doi:10.1007/s11869-020-00906-7
Kain, J. S. (2004). The Kain-Fritsch Convective Parameterization: An Update. J. Appl. Meteorol. 43, 170–181. doi:10.1175/1520-0450(2004)043<0170:tkcpau>2.0.co;2
Li, M., Wang, T., Xie, M., Li, S., Zhuang, B., Fu, Q., et al. (2021). Drivers for the Poor Air Quality Conditions in North China Plain during the COVID-19 Outbreak. Atmos. Environ. 246, 118103. doi:10.1016/j.atmosenv.2020.118103
Li, Y., Liu, J., Han, H., Zhao, T., Zhang, X., Zhuang, B., et al. (2019). Collective Impacts of Biomass Burning and Synoptic Weather on Surface PM2.5 and CO in Northeast China. Atmos. Environ. 213, 64–80. doi:10.1016/j.atmosenv.2019.05.062
Li, Y., Zhao, H., and Wu, Y. (2015). Characteristics of Particulate Matter during Haze and Fog (Pollution) Episodes over Northeast China, Autumn 2013. Aerosol Air Qual. Res. 15 (3), 853–864. doi:10.4209/aaqr.2014.08.0158
Liu, T., Wang, X., Hu, J., Wang, Q., An, J., Gong, K., et al. (2020). Driving Forces of Changes in Air Quality during the COVID-19 Lockdown Period in the Yangtze River Delta Region, China. Environ. Sci. Technol. Lett. doi:10.1021/acs.estlett.0c00511
Ma, Y., Zhao, H., Dong, Y., Che, H., Li, X., Hong, Y., et al. (2018). Comparison of Two Air Pollution Episodes over Northeast China in winter 2016/17 Using Ground-Based Lidar. J. Meteorol. Res. 32 (2), 313–323. doi:10.1007/s13351-018-7047-4
Mahato, S., Pal, S., and Ghosh, K. G. (2020). Effect of Lockdown amid COVID-19 Pandemic on Air Quality of the Megacity Delhi, India. Sci. Total Environ. 730, 139086. doi:10.1016/j.scitotenv.2020.139086
Mlawer, E. J., Taubman, S. J., Brown, P. D., Iacono, M. J., and Clough, S. A. (1997). Radiative Transfer for Inhomogeneous Atmospheres: RRTM, a Validated Correlated-K Model for the Longwave. J. Geophys. Res. 102, 16663–16682. doi:10.1029/97jd00237
Mostafa, M. K., Gamal, G., and Wafiq, A. (2021). The Impact of COVID 19 on Air Pollution Levels and Other Environmental Indicators - a Case Study of Egypt. J. Environ. Manage. 277, 111496. doi:10.1016/j.jenvman.2020.111496
Muhammad, S., Long, X., and Salman, M. (2020). COVID-19 Pandemic and Environmental Pollution: a Blessing in Disguise? Sci. Total Environ. 728, 138820. doi:10.1016/j.scitotenv.2020.138820
Nakanishi, M., and Niino, H. (2006). An Improved Mellor-Yamada Level-3 Model: Its Numerical Stability and Application to a Regional Prediction of Advection Fog. Boundary-layer Meteorol. 119 (2), 397–407. doi:10.1007/s10546-005-9030-8
Philipp, A., Bartholy, J., and Beck, C. (2010). Cost733cat – A Database of Weather and Circulation type Classifications. Phys. Chem. Earth, Parts A/b/c 35 (9–12), 360–373. doi:10.1016/j.pce.2009.12.010
Philipp, A., Beck, C., and Esteban, P. (2014). cost733-class-1.2 User Guide. Germany: Augsburg, 10–21.
Shen, L., Zhao, T., Wang, H., Liu, J., Bai, Y., Kong, S., et al. (2021). Importance of Meteorology in Air Pollution Events during the City Lockdown for COVID-19 in Hubei Province, Central China. Sci. Total Environ. 754, 142227. doi:10.1016/j.scitotenv.2020.142227
Shi, X., and Brasseur, G. P. (2020). The Response in Air Quality to the Reduction of Chinese Economic Activities during the COVID-19 Outbreak. Geophys. Res. Lett. 47 (11), e2020GL088070. doi:10.1029/2020GL088070
Silver, B., He, X., Arnold, S. R., and Spracklen, D. V. (2020). The Impact of COVID-19 Control Measures on Air Quality in China. Environ. Res. Lett. 15 (8), 084021. doi:10.1088/1748-9326/aba3a2
Skirienė, A. F., and Stasiškienė, Ž. (2021). COVID-19 and Air Pollution: Measuring Pandemic Impact to Air Quality in Five European Countries. Atmosphere. 12 (3), 290. doi:10.3390/atmos12030290
Sulaymon, I. D., Zhang, Y., Hopke, P. K., Zhang, Y., Hua, J., and Mei, X. (2021a). COVID-19 Pandemic in Wuhan: Ambient Air Quality and the Relationships between Criteria Air Pollutants and Meteorological Variables before, during, and after Lockdown. Atmos. Res. 250, 105362. doi:10.1016/j.atmosres.2020.105362
Sulaymon, I. D., Zhang, Y., Hopke, P. K., Hu, J., Zhang, Y., Li, L., et al. (2021b). Persistent High PM2.5 Pollution Driven by Unfavorable Meteorological Conditions during the COVID-19 Lockdown Period in the Beijing-Tianjin-Hebei Region, China. Environ. Res. 198, 111186. doi:10.1016/j.envres.2021.111186
Tian, H., Liu, Y., Li, Y., Wu, C.-H., Chen, B., Kraemer, M. U. G., et al. (2020). An Investigation of Transmission Control Measures during the First 50 Days of the COVID-19 Epidemic in China. Science. 368, 638–642. doi:10.1126/science.abb6105
Tobías, A., Carnerero, C., Reche, C., Massagué, J., Via, M., Minguillón, M. C., et al. (2020). Changes in Air Quality during the Lockdown in Barcelona (Spain) One Month into the SARS-CoV-2 Epidemic. Sci. Total Environ. 726, 138540. doi:10.1016/j.scitotenv.2020.138540
Venter, Z. S., Aunan, K., Chowdhury, S., and Lelieveld, J. (2020). COVID-19 Lockdowns Cause Global Air Pollution Declines. Proc. Natl. Acad. Sci. U.S.A. 117 (32), 18984–18990. doi:10.1073/pnas.2006853117
Wang, P., Chen, K., Zhu, S., Wang, P., and Zhang, H. (2020). Severe Air Pollution Events Not Avoided by Reduced Anthropogenic Activities during COVID-19 Outbreak. Resour. Conservation Recycling. 158, 104814. doi:10.1016/j.resconrec.2020.104814
Wang, T., Du, H., Zhao, Z., Russo, A., Zhang, J., and Zhou, C. (2022). The Impact of Potential Recirculation on the Air Quality of Bohai Bay in China. Atmos. Pollut. Res. 13 (1), 101268. doi:10.1016/j.apr.2021.101268
Xian, T., Li, Z., and Wei, J. (2021). Changes in Air Pollution Following the COVID-19 Epidemic in Northern China: The Role of Meteorology. Front. Environ. Sci. 9, 64. doi:10.3389/fenvs.2021.654651
Xiao, Q., Zheng, Y., Geng, G., Chen, C., Huang, X., Che, H., et al. (2021a). Separating Emission and Meteorological Contribution to PM2.5 Trends Over East China During 2000–2018. Atmos. Chem. Phys. 21, 9475–9496. doi:10.5194/acp-2021-28
Xiao, Q., Geng, G., Cheng, J., Liang, F., Li, R., Meng, X., et al. (2021b). Evaluation of Gap-Filling Approaches in Satellite-Based Daily PM2.5 Prediction Models. Atmos. Environ. 244, 117921. doi:10.1016/j.atmosenv.2020.117921
Xiang, J., Austin, E., Gould, T., Larson, T., Shirai, J., Liu, Y., et al. (2020). Impacts of the COVID-19 Responses on Traffic-Related Air Pollution in a Northwestern US City. Sci. Total Environ. 747, 141325. doi:10.1016/j.scitotenv.2020.141325
Yan, Y., Wang, X., Qu, K., Li, X., Shi, W., Peng, Z., et al. (2021). Impacts of Synoptic Circulations on Summertime Ozone Pollution in Guanzhong Basin, Northwestern China. Atmos. Environ. 262, 118660. doi:10.1016/j.atmosenv.2021.118660
Zambrano-Monserrate, M. A., Ruano, M. A., and Sanchez-Alcalde, L. (2020). Indirect Effects of COVID-19 on the Environment. Sci. Total Environ. 728, 138813. doi:10.1016/j.scitotenv.2020.138813
Zhang, J. P., Zhu, T., Zhang, Q. H., Li, C. C., Shu, H. L., Ying, Y., et al. (2012). The Impact of Circulation Patterns on Regional Transport Pathways and Air Quality over Beijing and its Surroundings. Atmos. Chem. Phys. 12, 5031–5053. doi:10.5194/acp-12-5031-2012
Zhang, R., Zhang, Y., Lin, H., Feng, X., Fu, T.-M., and Wang, Y. (2020). NOx Emission Reduction and Recovery during COVID-19 in East China. Atmosphere. 11, 433. doi:10.3390/atmos11040433
Zhang, Y., Wang, S., Jia, X., Lian, J., Zhang, X., and Xu, Y. (2018). Study on the Objective Classification of Air Pollution Weather in the winter Half Year in North China. Acta Scientiae Circumstantiae. 38 (10), 3826–3833. (in Chinese). doi:10.13671/j.hjkxxb.2018.0169
Zhao, H., Che, H., Ma, Y., Wang, Y., Yang, H., Liu, Y., et al. (2017). The Relationship of PM Variation with Visibility and Mixing-Layer Height under Hazy/Foggy Conditions in the Multi-Cities of Northeast China. Int. J. Environ. Res. Public Health. 14 (5), 471. doi:10.3390/ijerph14050471
Zhao, N., Wang, G., Li, G., Lang, J., and Zhang, H. (2020). Air Pollution Episodes during the COVID-19 Outbreak in the Beijing-Tianjin-Hebei Region of China: An Insight into the Transport Pathways and Source Distribution. Environ. Pollut. 267, 115617. doi:10.1016/j.envpol.2020.115617
Zhao, Z., Xi, H., Russo, A., Du, H., Gong, Y., Xiang, J., et al. (2019). The Influence of Multi-Scale Atmospheric Circulation on Severe Haze Events in Autumn and Winter in Shanghai, China. Sustainability. 11 (21), 5979. doi:10.3390/su11215979
Zhao, Z., Zhou, Z., Russo, A., Xi, H., Zhang, J., Du, H., et al. (2021a). Comparative Analysis of the Impact of Weather Conditions and Human Activities on Air Quality in the Dongting and Poyang Lake Region during the COVID-19 Pandemic. Atmos. Pollut. Res. 12 (5), 101054. doi:10.1016/j.apr.2021.101054
Zhao, Z., Zhou, Z., Russo, A., Du, H., Xiang, J., Zhang, J., et al. (2021b). Impact of Meteorological Conditions at Multiple Scales on Ozone Concentration in the Yangtze River Delta. Environ. Sci. Pollut. Res. 28 (44), 62991–63007. doi:10.1007/s11356-021-15160-2
Zhao, X., Wang, G., Wang, S., Zhao, N., Zhang, M., and Yue, W. (2021). Impacts of COVID-19 on Air Quality in Mid-eastern China: An Insight into Meteorology and Emissions. Atmos. Environ. 266, 118750. doi:10.1016/j.atmosenv.2021.118750
Zhou, C. J., Wei, G., and Xiang, J. (2018). Effects of Synoptic Circulation Patterns on Air Quality in Nanjing and its Surrounding Areas during 2013–2015. Atmos. Pollut. Res. 9 (4), 723∼734. doi:10.1016/j.apr.2018.01.015
Keywords: north east China, meteorological condition, t-mode PCA, air pollutants, human activies, FLEXPART-WRF
Citation: Wang T, Du H, Zhao Z, Zhang J and Zhou C (2022) Impact of Meteorological Conditions and Human Activities on Air Quality During the COVID-19 Lockdown in Northeast China. Front. Environ. Sci. 10:877268. doi: 10.3389/fenvs.2022.877268
Received: 16 February 2022; Accepted: 01 April 2022;
Published: 28 April 2022.
Edited by:
Suvarna Sanjeev Fadnavis, Indian Institute of Tropical Meteorology (IITM), IndiaReviewed by:
Daniele Contini, Institute of Atmospheric Sciences and Climate (CNR-ISAC), ItalySudesh Yadav, Jawaharlal Nehru University, India
Copyright © 2022 Wang, Du, Zhao, Zhang and Zhou. This is an open-access article distributed under the terms of the Creative Commons Attribution License (CC BY). The use, distribution or reproduction in other forums is permitted, provided the original author(s) and the copyright owner(s) are credited and that the original publication in this journal is cited, in accordance with accepted academic practice. No use, distribution or reproduction is permitted which does not comply with these terms.
*Correspondence: Chengjun Zhou, nudt_zcj@foxmail.com