 Taihao Wang
 Huadong Du1
 Chengjun Zhou
94% of researchers rate our articles as excellent or good
Learn more about the work of our research integrity team to safeguard the quality of each article we publish.
Find out more
ORIGINAL RESEARCH article
Front. Environ. Sci., 19 July 2022
Sec. Atmosphere and Climate
Volume 10 - 2022 | https://doi.org/10.3389/fenvs.2022.939147
Particulate matter pollution is increasingly serious in Changsha-Zhuzhou-Xiangtan urban agglomeration (CZT) due to rapid industrialization and urbanization. Particulate matter pollution and weather conditions are closely related. In this study, the relationship between the large-scale weather circulation types (CTs), horizontal recirculation wind field, boundary layer structure and particulate matter pollution (PM2.5) in CZT was systematically investigated. Firstly, the Allwine and Whiteman (AW) wind field classification method and Richardson method were used to calculate the horizontal recirculation index and the planetary boundary layer height (PBLH) in CZT. By analyzing the relationship among the recirculation index, the PBLH and the particle concentration, it was found that the recirculation process in CZT could be divided into horizontal recirculation and “pseudo recirculation”. Then, the circulation patterns affecting the CZT were divided into nine types (CT1-CT9) by using T-mode PCA method based on 925 hpa geopotential data. The CZT was prone to recirculation under the control of high pressure rear (CT4), weak high pressure edge (CT5) and southwest vortex (CT7, CT8). It was found that CT4 and CT5 accompanied with lower PBLH and poorer vertical diffusion conditions characterized by high particle concentration. While CT7 and CT8 accompanied with higher PBLH and better vertical diffusion conditions characterized by low particle concentration. Finally, the effect of CTs, recirculation index and boundary layer structure on paticle matter concentration were assessed during two recirculation processes in December 2016 and August 2017, repectively. The analysis was complemented with FLEXPART-WRF model simulations, which confirmed that the recirculation and “pseudo recirculation” can be effectively distinguished by introducing the PBLH, combined with the large-scale weather circulation.
The Changsha-Zhuzhou-Xiangtan (CZT) urban agglomeration is located in central China and is an important part of the economic belt in the middle reaches of the Yangtze River (Zhang et al., 2014; Wang et al., 2021). However, with the rapid economic development and acceleration of urbanization and industrialization, urban air pollution in the CZT region has become a serious problem faced by all levels of society (Feng et al., 2017; Tang et al., 2017; Zhang and Jiang, 2018; Xu et al., 2020). As early as 2012, the 12th Five-Year Plan formulated by the Chinese government listed the CZT as one of the 13 key regions for air pollution prevention and control in China (Ash et al., 2012; Zhou et al., 2012). Zhu et al., 2019 pointed out that the primary pollutants in the CZT region are aerosol particles, of which the PM2.5 fine particles are one of the main pollutants causing smog and haze. In addition to seriously endangering human health, the PM2.5 particles also lead to reduced visibility, affect human traffic, normal production, and life. In addition, it affects cloud formation and precipitation and changes in the East Asian monsoon climate system (Yan et al., 2021; Yin et al., 2015; Zhang et al., 2009; Zhou et al., 2019; Han et al., 2015; Ma et al., 2019; Miao et al., 2018; Li et al., 2019; Su et al., 2015; Sun et al., 2021; Jena et al., 2020, 2021).
Mastering the diffusion and transport laws of pollutants is very important to quantify air pollution levels, meteorological conditions play an important role in the diffusion and transport of pollutants (Li et al., 2012; Mao et al., 2020; Miao et al., 2017; Wang et al., 2016; Zong et al., 2021; Zhao et al., 2019, 2021a, 2021b; Sun et al., 2018, 2019). The meteorological conditions mainly include large-scale synoptic circulation and the mesoscale meteorological conditions (Zhou et al., 2018, 2019; Wang et al., 2022; Russo et al., 2014, Russo et al., 2016). Large-scale synoptic circulation determines the specific climatic background of the study area and provides the basic dynamic field for the diffusion and transport of particulate matter (Zhao et al., 2019; Bei et al., 2022; Yan et al., 2022; Gong et al., 2022a, Gong et al., 2022b). Several studies have revealed the relationship between large-scale circulation and particulate pollution (Zhang et al., 2012, Zhang et al., 2012; Zhan et al., 2019; Shu et al., 2020). Zhan et al., 2019 studied the effect of large-scale synoptic circulation on the diffusion and transport of particulate matter in the Sichuan Basin. They found that under the influence of the high pressure from the western region, the “continental air mass” transports particulate matter to the Sichuan Basin and causes serious pollution. On the other hand, under the influence of the high pressure from the eastern maritime region, the “ocean air mass” brings good quality clean air to the Sichuan Basin. Li et al., 2019 studied the effect of weather circulation and biomass burning on the PM2.5 concentration in northeast China and found that a weak and stable high-pressure system leads to poor diffusion conditions that increase the PM2.5 concentration. Further, the warm wet flow coming from the southwest in front of the trough enhances the hygroscopic growth ability of the aerosol particles and also leads to an increase in the PM2.5 concentration. Zhao et al., 2019 studied the relationship between autumn and winter haze events and weather circulation in the Yangtze River Delta region and found that severe haze events often occurred when the high-pressure center was located in the northwest and west of Shanghai. A specific large-scale synoptic circulation situation often corresponds to certain mesoscale regional transmission meteorological conditions (Zhou et al., 2019). The mesoscale regional transport meteorological conditions cover the vertical and horizontal dimensions, which affect the specific distribution and propagation of particulate matter (Ye et al., 2016; Li et al., 2021a; Li et al., 2021b; Yan et al., 2022).
The vertical movement of the atmosphere affects the height of the boundary layer, the stability of the atmosphere, and the height of the temperature inversion layer, and these factors directly determine the vertical diffusion rate and the vertical distribution of particles (Luan et al., 2018; Yang et al., 2018; Liu et al., 2019; Xu et al., 2019; Mao et al., 2020). Mao et al., 2020 found that during winter in central China, under the condition of a low planetary boundary layer height (PBLH) and high relative humidity in the planetary boundary layer (PBL), local accumulation of pollutants increases the PM2.5 concentration. Xu et al., 2019 and Luan et al., 2018 studied the impact of the boundary layer structure on the air quality in northern China and found that strong inversion and subsidence movement in the boundary layer causes pollutants to accumulate in the surface layer, resulting in hazy weather and low visibility. The horizontal movement of the atmosphere determines the local wind field, which affects the horizontal diffusion rate and the horizontal distribution of particulate matter (Russo et al., 2014, 2016, 2018; Zhou et al., 2019). Russo et al., 2014 used the AW (Allwine and Whiteman) wind field classification method (Allwine and Whiteman, 1994) to study the relationship between the local horizontal wind field and particulate matter in the coastal areas of Portugal and found that the coastal recirculation wind field leads to severe particulate matter pollution. Zhou et al., 2019 used the AW method to study the relationship between the local wind field and PM2.5 concentration in the Yangtze River Delta in China and found that when the cold high-pressure zone is far away, the Western Pacific Subtropical High gradually rises northward, and the Yangtze River Delta region is prone to recirculation which causes the concentration of PM2.5 to rise rapidly.
Our previous studies (Zhao et al., 2021a) used the AW wind field classification method to study the recirculation phenomenon and found that only considering the horizontal local wind field cannot fully reveal the feature of pollutant diffusion and transmission. When there is recirculation in the Yangtze River Delta, the pollutant concentration is not always high, and thus the influence of the vertical meteorological conditions on the spread of the pollutants needs to be considered. Therefore, in this study, we added the PBLH parameter to characterize the vertical motion of the atmosphere. Liu et al., 2019 revealed the relation between the PBL structure and the large-scale synoptic circulation patterns, and Wang et al., 2022 revealed the connection between the large-scale synoptic circulation and the local wind fields. Therefore, we have comprehensively considered the horizontal local wind field and the PBL structure by using the large-scale weather circulation classification method to explore their influence on the change in the PM2.5 concentration.
The purpose of this study was to correct the horizontal wind field classification index by adding PBLH to quantify the effect of the regional transport meteorological conditions on the diffusion and transport of particulate matter (PM2.5). Firstly, we investigated the relationship between the recirculation index, R, calculated by the AW method, and the concentration of PM2.5. Then, we calculated PBLH in Changsha in the CZT region and investigated the correlation between PBLH and PM2.5 concentration. Using the T-mode tilt-rotation principal component analysis (T-PCA) method, the 925 hPa large-scale synoptic circulation affecting the CZT region was divided into nine types, and PBLH and the meteorological conditions in the vertical direction of the nine circulation types (CTs) were studied. The distribution of the recirculation index R and PBLH under the nine CTs was investigated, and their effects on the diffusion and transport of PM2.5 were comprehensively analyzed. Finally, the weather research and forecasting (WRF) model (Nandi et al., 2020; Kumar et al., 2022) was used to simulate two recirculation processes in the CZT region from August 2017 and December 2016. The FLEXPART-WRF model was used for simulating the plume trajectories of the pollutant particles in the two processes to verify the influence of the PBLH on the diffusion and transport of the pollutants.
The 925 hPa geopotential height data from the ERA5 hourly reanalysis dataset (Hersbach et al., 2020) of the European Centre for Medium-Range Weather Forecasts were used in this study to determine the diurnal CTs in the CZT region. The horizontal resolution of the ERA5 dataset was 0.25°, the spatial range was 96°–128°E, 15° to 45°N, and the time range was from 1 January 1979, to 31 December 2020. Because the ERA5 reanalysis data at 00:00 UTC assimilates the radiosonde data as well as other data, the restoration of the meteorological field is the best. Thus, we used the 925 hPa geopotential height at 00:00 UTC to determine the daily CTs. In addition, the data of PBLH (the horizontal resolution was 0.1°, the spatial range was 111°–114°E, 26° to 30°N, and the time range was from 1 January 2014, to 31 December 2018), vertical divergence (the horizontal resolution was 0.1°, the spatial range was 105°–120°E, 20° to 35°N, and the time range was from 1 January 2014, to 31 December 2018), and vertical velocity (the horizontal resolution was 0.1°, the spatial range was 112°–114°E, 26° to 30°N, and the time range was from 1 January 2014, to 31 December 2018) in this dataset were used for analyzing the structure of the boundary layer under the nine CTs.
The local meteorological data comprising the air pressure, temperature, humidity, wind direction, wind speed, etc., can be downloaded from https://quotsoft.net/air/. The meteorological observation data is released after quality control. Further, the selected site is far away from the urban area and is less affected by human factors, and thus can accurately reflect the local meteorological conditions in the study area. This study used the hourly wind direction and the hourly wind speed data of Changsha, Changde, Hengyang, and Yueyang stations from 1 January 2014 to 31 December 2018 to calculate the recirculation index R. The locations of the four stations are shown in Figure 1 (the black dots are the stations).
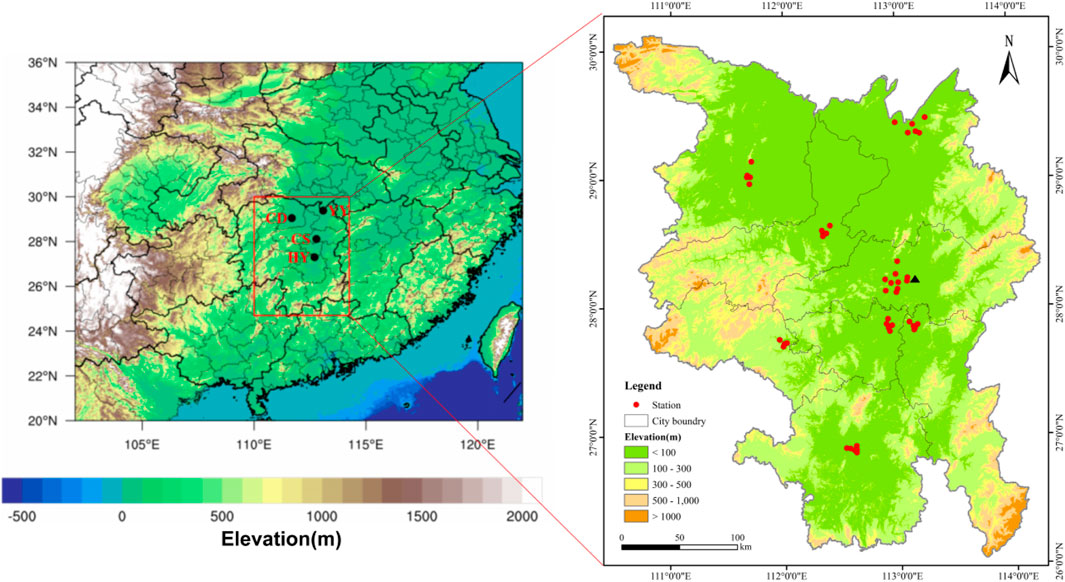
FIGURE 1. Surrounding terrain of the CZT and the location of meteo, environmental monitoring stations and the Mapoling sounding station. Black dots are meteorological observation stations (CD presents Changde, YY presents Yueyang, CS presents Changsha and HY presents Hengyang), red dots are environmental monitoring stations, and black triangle is the sounding station.
The sounding data used in this study included the pressure, height, air temperature, dew point, wind direction, and wind speed in the vertical direction. The data was taken from the website of the University of Wyoming (weather.uwyo.edu/wyoming/). We selected the specific humidity, temperature, wind speed, and wind direction in the radiosonde data of Changsha Mapoling high-altitude meteorological station at 00:00 UTC and 12:00 UTC from 1 January 2014 to 31 December 2018 to calculate PBLH in Changsha. The specific location of the sounding station is shown in Figure 1 (the black triangle is the sounding station).
Air quality data was taken from the China Environmental Monitoring website (http://www.cnemc.cn). The data is released after quality control by the China environmental protection department. This study used the 24-h average PM2.5 concentration data and the hourly PM2.5 concentration data of 178 monitoring stations in the CZT region (including the four cities of Changsha, Yueyang, Hengyang, and Changde) for the analysis. Figure 1 shows the locations of the monitoring stations (the red dots are the environmental monitoring stations).
We used the T-PCA method to perform the classification of circulation of the daily 925 hPa geopotential height in a large area in southern China, including the CZT region, from 1979 to 2020. Compared to the other objective circulation classification methods (correlation analysis, ordinary least squares, clustering methods, etc.) T-PCA can provide better reproduction of the main modes contained in the data (Richman, 1981; Levy et al., 2008a; Levy et al., 2008b; Compagnucci and Richman, 2008; Huth et al., 2008; Levy et al., 2010). The classification results obtained by T-PCA have higher temporal and spatial stability. Zhang et al., 2012a found that it is most reasonable to divide the circulation patterns of a certain area in the middle and high latitudes into nine types. Therefore, the circulation patterns affecting the CZT region in this study were divided into nine types. Mao et al., 2020 found that when the 925 hPa geopotential height field was used for circulation classification, the classification results were similar to other levels and exhibited a good correlation with the classification results between other levels. The CZT region is undulating and hilly, and thus circulation classification based on the geopotential height of 925 hPa was conducted in this study. The objective T-PCA weather circulation classification method has been integrated into a software package named cost733class, which can be downloaded from the following website: http://cost733.met.no/.
This study used the Bulk Richardson number (Ri) to calculate the boundary layer height. The method is suitable for diagnosing stable as well as convective boundary layer heights (Luo et al., 2014; Davy, 2018) and is thus considered a very effective research method. Ri is the ratio of turbulence and buoyancy and is expressed as:
where g is the acceleration due to gravity, z is the height above the ground,
In this study, we used an objective and quantitative wind field classification method (AW method) based on the vector wind principle, proposed by Allwine and Whiteman, 1994 to determine the recirculation index, R. This method defines R by comparing the distance (S) and the displacement (L) of an air tracer during the study period. The value of R is calculated as follows:
Step 1. The horizontal wind field is divided into two parts, longitudinal (ui) and latitudinal (vi).
Step 2. The daily mean of the distance, S, and the displacement, L, are calculated according to the following expression:
Step 3. The value of R is calculated from the S and L values as follows:
In the above equations, T is the time interval, and its value is 1. The value of τ is 24, and the wind speed is converted to km/h. The L value is the net distance (i.e., the displacement) from the original position of the air tracer, and S is the total distance traveled by the air tracer in a day. A low value of R indicates a persistent wind direction or low recirculation level, whereas a high value of R indicates a variable wind direction or high recirculation level. It can be seen from Eq. (2–5) that the value of R is between 0 to 1. Russo et al., 2018 gave a limit scheme for the classification index of the local wind field determined by combining the geographical environment of the study area and many other factors. This threshold determination scheme comprehensively considers the various local factors in different regions and has common applicability (surkova, 2013; Zhou et al., 2019; Russo et al., 2018). In our study, the critical value of R was mainly used to determine whether the recirculation phenomenon occurred or not. The criteria for determining the recirculation are as follows:
The WRF model can provide accurate meteorological field variables for the FLEXPART-WRF model (Brioude et al., 2013) in performing the particle trajectory simulations. In this simulation, we used two layers of nesting. The first layer had a horizontal resolution of 30 × 30 km and covered most of China. The second nesting was 10 × 10 km, covering the entire South China region. The two simulation time ranges were: August 8−14, 2017, and December 4−9, 2016. The main parameterization schemes were: Mellor-Yamada-Janjic (Eta) TKE boundary layer parameterization scheme (Janjic, 2001), Noah land surface scheme (Chen et al., 2006), WSM 3-class simple ice scheme microphysical process scheme (Hong et al., 2004), Kain-Fritsch (new Eta) cumulus convection parameterization scheme (Kain, 2004), Monin-Obukhov (Janjic Eta) near-surface layer parameterization scheme (Nakanishi and Niino, 2006), RRTM longwave radiation scheme (Mlawer et al., 1997), and Dudhia shortwave radiation scheme (Dudhia, 1989). The initial boundary conditions of the model used the Final Analysis (FNL) data (Kalnay et al., 1996) of 6 hours a day (horizontal resolution 0.25 ° × 0.25 °) from the National Centers for Environmental Prediction (NCEP), and the results were output every 30 min.
The Lagrangian particle diffusion model used in this study was the FLEXPART-WRFV3.1 version (Brioude et al., 2013) which uses the function of backward simulation of particle trajectories. The Changsha area (112.88°N, 28.08°E) was selected as the particle release point. During the simulation period in the Changsha area, a backward simulation was carried out every day (24 h) to release the particles evenly every 1 h, and 10,000 particles were released throughout every simulation period (24 h). The particle cluster release height was 1–51 m, and the horizontal resolution was 0.125 ° × 0.125 °. This model comprehensively considers the process of emission transport, turbulent diffusion, and wet and dry deposition, and simulates the particle dispersion and aggregation, possible source distribution, etc., by calculating the backward transport trajectory of the particles. In this study, we calculated the particle backward plume trajectories every 24 h to investigate the effect of the boundary structure and the horizontal local wind field on the dispersion of the pollutant particles.
Figure 2 shows the recirculation index, R, as a function of the PM2.5 concentration in the four cities of Changsha, Changde, Yueyang, and Hengyang in the CZT region. It can be seen from the figure that the size of the index, R, in the four cities has no obvious effect on the PM2.5 concentration. When R > 0.245 (Ravg = 0.245), the four cities of Changsha, Yueyang, Hengyang, and Changde accounted for 49.50, 41.98, 40.93, and 50.0% of the dates that had PM2.5 concentrations higher than 50 μg/m3, respectively. The proportion of days with PM2.5 concentration lower than 50 μg/m3 was 50.5, 58.02, 59.07, and 50.0%, respectively. It can be seen that under the recirculation wind field, the proportion of pollution and clean weather is almost equal (we define the occurrence of clean weather when the PM2.5 concentration is less than 50 μg/m3, under the recirculation wind field, as “pseudo recirculation”). This implies that in the CZT region, it is difficult to efficiently distinguish between polluted weather and clean weather by relying only on the AW horizontal wind field classification, and it is difficult to distinguish between the recirculation wind field and the “pseudo recirculation” that appear at the same time. Therefore, the important influence of the vertical meteorological parameters such as the boundary layer height, atmospheric inversion temperature, and vertical wind field on PM2.5 concentration must be considered.
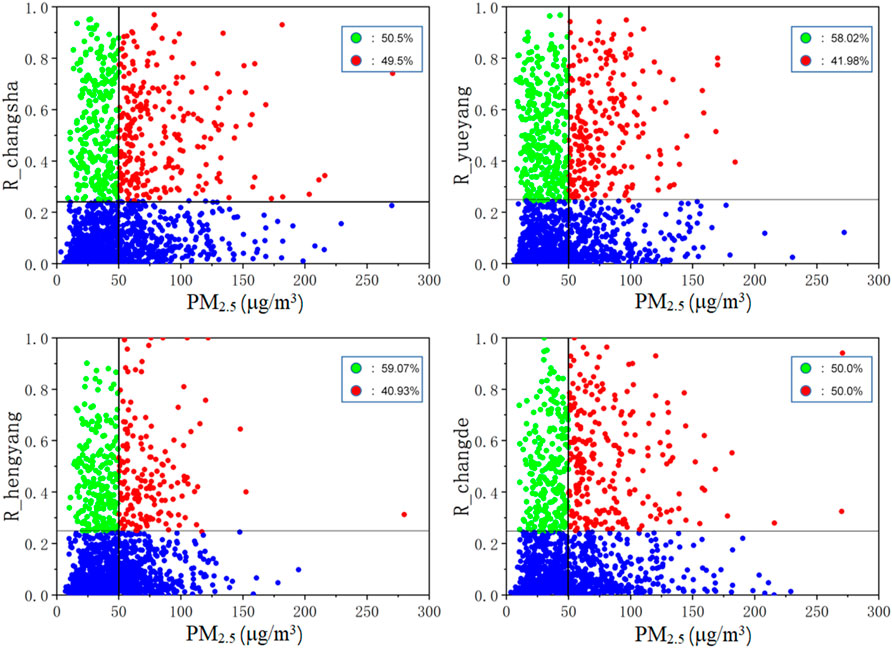
FIGURE 2. The index R as a function of the PM2.5 concentration. The green dots indicate R > Ravg (0.245, indicated by the black lines parallel to the X-axis) and PM2.5 concentration lower than 50 μg/m³ (indicated by the black lines parallel to the Y-axis), the red dots indicate R > Ravg, and PM2.5 concentration higher than 50 μg/m³, whereas the blue dots indicate the case of no recirculation (R < Ravg).
Figure 3 shows the correlation between PBLH and PM2.5 concentration at 8:00 (BJT) and 20:00 (BJT) every day in Changsha. It can be seen from the figure that the correlations between PBLH and PM2.5 concentrations at eight o’clock and 20 o’clock are −0.38 and −0.21, respectively, and the negative correlation is more obvious. Figure 4 shows the correlation between PBLH and PM2.5 concentration in Changsha at eight o’clock (BJT) and 20 o’clock (BJT) when R > 0.245 (under the recirculation wind field). It can be seen from the figure that the correlation coefficients of PBLH and PM2.5 concentrations at eight o’clock and 20 o’clock are −0.41 and −0.27, respectively, when the recirculation index is high, and the negative correlation is more obvious. This implies that under the recirculation wind field, the boundary layer height needs to be comprehensively considered to further evaluate its effect on the PM2.5 concentration. Figure 5 shows the scatter plot of the boundary layer height distribution in clean and polluted weather in Changsha, Yueyang, Changde, and Hengyang in the CZT region for the case of R > 0.245 (recirculation wind field). It can be seen from the figure that the average PBLH of Changsha, Yueyang, Changde, and Hengyang are 109.14, 101.59, 121.34, and 128.22 m, respectively, in the case of polluted weather conditions (PM2.5 concentration is more than 50 μg/m³). On the other hand, in the case of clean weather conditions, the average PBLH of Changsha, Yueyang, Changde, and Hengyang are 273.39, 277.76, 269.44, and 269.01 m, respectively. Furthermore, it can also be seen from Figure 5 that most of the PBLH values (accounting for 75%) are distributed between 0 and 200 m in the case of polluted weather under the recirculation wind field, whereas most (75%) PBLH values are distributed between 200 and 400 m in the case of clean weather. Taking 200 m as the threshold, under the recirculation wind field, PBLH >200 m generally results in the occurrence of clean weather, whereas PBLH <200 m, especially PBLH <100 m, results in the occurrence of polluted weather. In order to specifically study the effects of R and PBLH on the PM2.5 concentration, we have introduced the weather circulation classification method to consider the influence of the different boundary layer structures on the changes in the PM2.5 concentration under different CTs.
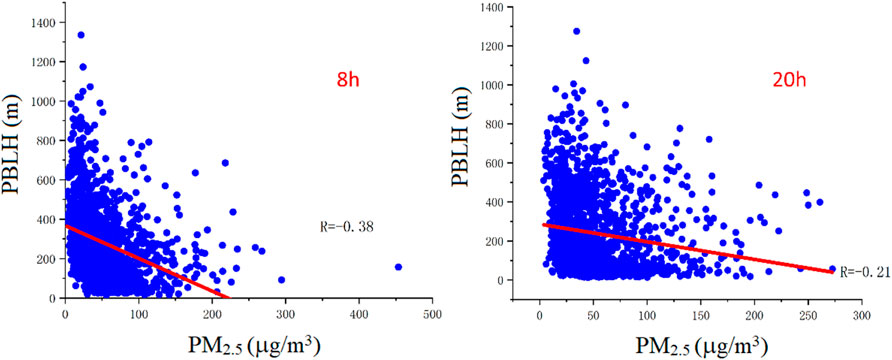
FIGURE 3. Correlation between PBLH and PM2.5 concentration at 8:00 (BJT) and 20:00 (BJT) in Changsha.
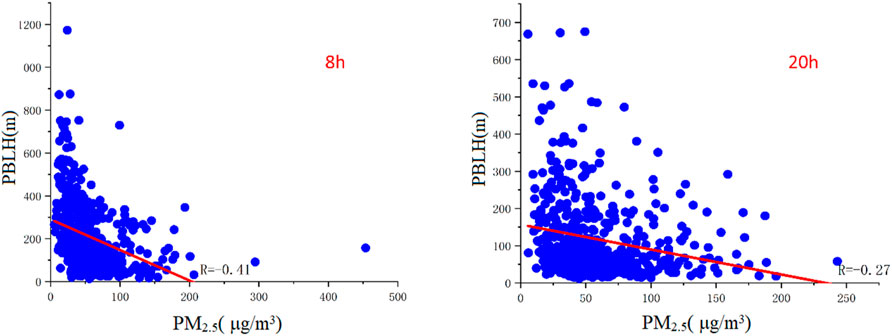
FIGURE 4. Correlation between PBLH and PM2.5 concentration in Changsha at 08:00 (BJT) and 20:00 (BJT) when R > 0.245 (under the recirculation wind field).
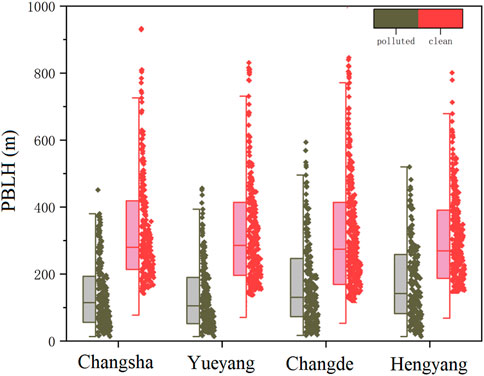
FIGURE 5. Scatter-point boxplots of the PBLH distribution in the case of clean weather and polluted weather in Changsha, Yueyang, Changde, and Hengyang in the CZT region under the recirculation wind field.
Using the T-PCA objective synoptic circulation classification method, we divided the large-scale synoptic circulation at 925 hPa in the CZT region into nine types (CT1, CT2, CT3, ..., CT9, respectively), as shown in Figure 6. Based on the distribution of high and low pressure, the nine CTs are named as follows: northwest high pressure (CT1), northwest low pressure (CT2), south low pressure (CT3), east high pressure (CT4), west high pressure (CT5), north high pressure (CT6), southeast high pressure and west low pressure (CT7), southwest low pressure (CT8), and uniform pressure field with low gradient (CT9). The main CTs affecting the CZT region are CT1, CT2, and CT3, accounting for 23.9, 16.0, and 16.5%, respectively.
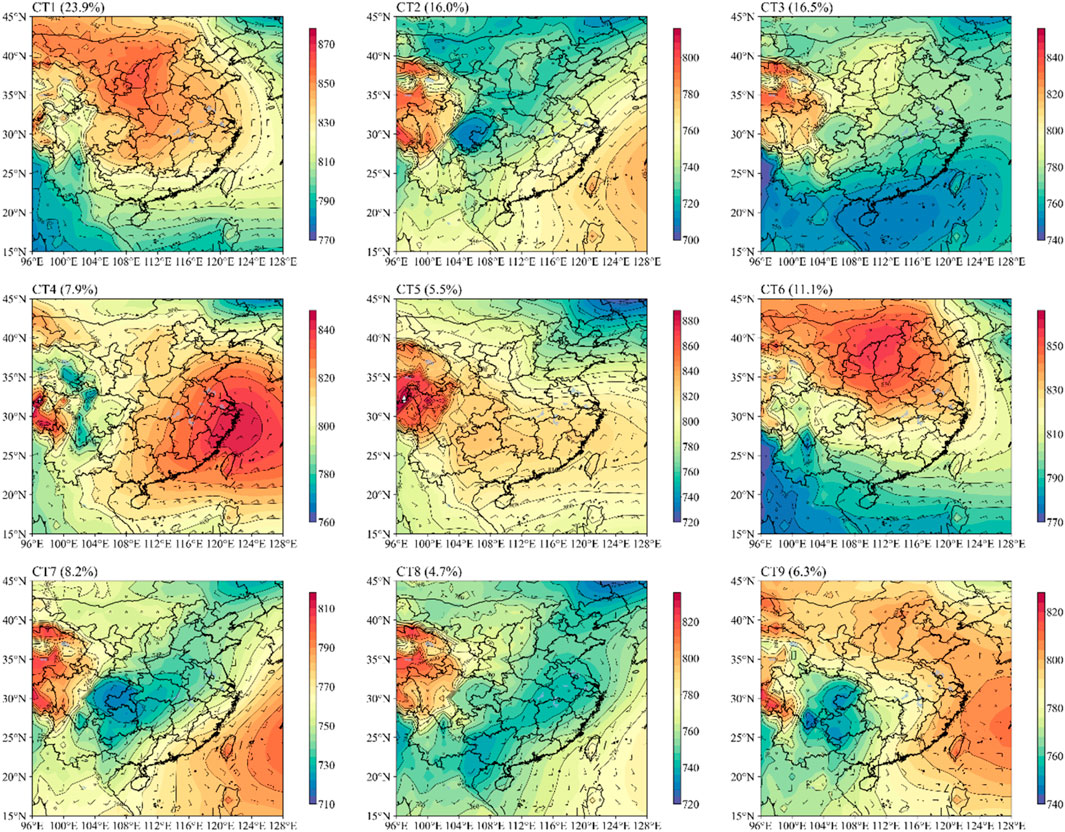
FIGURE 6. Contour plots showing the nine CTs at 925 hPa in the CZT region (unit: gpdm).
Table 1 shows the frequency of occurrence, average PM2.5 concentration, average PBLH, average index, R, and frequently occurring seasons of the nine CTs. From the results presented in Figure 6 and Table 1, it can be seen that CT1, CT4, CT5, and CT6 mainly appear in autumn and winter and are closely related to cold high-pressure activities. On the other hand, CT2, CT7, and CT8 often appear in summer and spring, and low-pressure cyclone systems often appear near the CZT region. In addition, under the control of CT2, CT7, and CT8, the subtropical high activity significantly affects the CZT region.
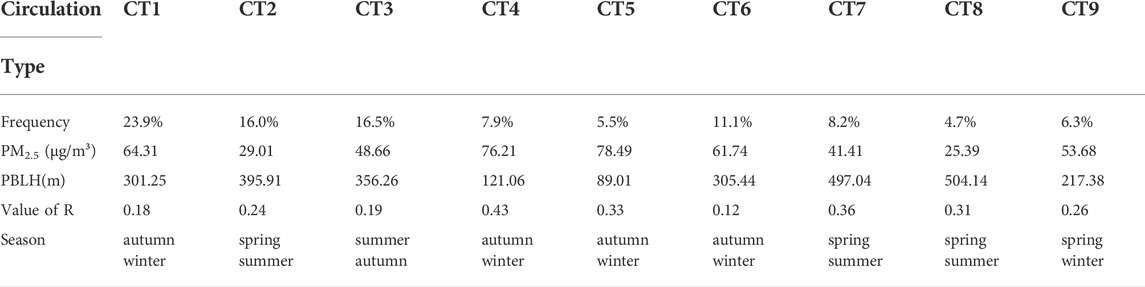
TABLE 1. Occurrence frequency, average PM2.5 concentration, average PBLH, average index, R, and frequently occurring seasons of the nine CTs in the CZT region.
Figure 7A shows the distribution of PM2.5 concentrations as a function of the 9 CTs in the CZT region, where the PM2.5 concentration is the daily average of each environmental monitoring station in the CZT region from 2014 to 2018. From Figure 7A and Table 1, it can be seen that the PM2.5 concentration in the CZT region is higher under the control of CT1, CT4, and CT5, with an average value of 64.31, 76.21, and 78.49, respectively. Under the control of CT2, CT3, CT7, and CT8, the concentration of PM2.5 in the CZT region is relatively low, with average values of 29.01, 48.66, 41.41, and 25.39, respectively.
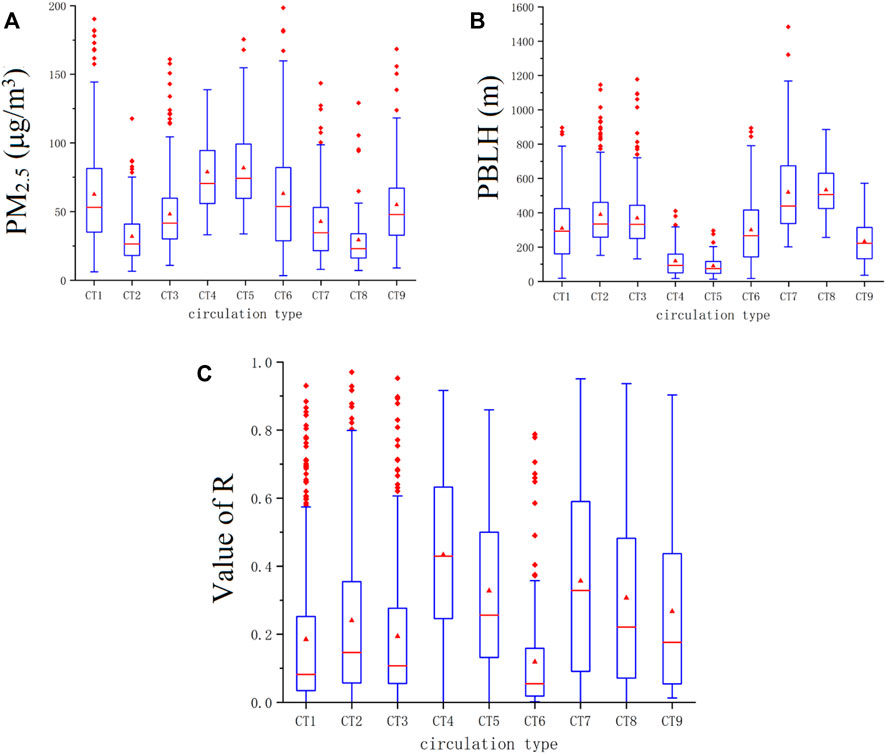
FIGURE 7. (A) Concentration distribution of PM2.5, (B) PBLH distribution, and (C) distribution of the recirculation index, R, as a function of the nine CTs in the CZT region.
Figure 7B shows the distribution of PBLH, and Figure 8 shows the latitude-height profiles of the vertical velocity under the nine CTs in the CZT region. Figure 9 shows the average wind divergence below 850 hPa under the nine CTs in the CZT. Figure 10 shows the vertical temperature profiles and vertical temperature anomaly profiles under the nine CTs in the CZT region. From Figure 7B, Figure 8, Figure 9, and Figure 10, it can be seen that under the control of CT1, CT4, and CT5, the average PBLH in the CZT region is lower (301.25, 121.06, and 89.01 m, respectively), and the CZT region is dominated by the downdraft airflow, having a high vertical velocity ( ∼ 4–12 × 10–2 Pas−1). The lower layer shows a wide range of weak horizontal divergence (average wind divergence below 850 hPa ∼ 5 × 10⁻⁶ s−1). Furthermore, there is an obvious temperature inversion layer, and the temperature of particles in the boundary layer tends to decrease from bottom to top, but the cooling effect decreases with increasing height. This indicates that under this condition, the structure of the boundary layer in the CZT region is relatively stable, and a stable atmospheric stratification is not conducive to the vertical transport and diffusion of the pollutants. Under the control of CT2, CT3, CT7, and CT8, the average PBLH in the CZT region is higher (395.91, 356.26, 497.04, and 501.14 m, respectively). Vertically, the CZT region is dominated by updrafts, in which under CT2 and CT3, the vertical wind speed is smaller (∼−4 × 10⁻² Pas−1) and that under CT7 and CT8 is higher (∼−12 × 10–2 Pas−1). This shows a large-scale convergence in the lower layer, and under CT2 and CT3, the convergence is weak (average wind divergence below 850 hPa ∼−5 × 10⁻⁶ s−1), whereas CT7 and CT8 converge strongly (average wind divergence below 850 hPa ∼−10 × 10–6 s−1). Furthermore, the surface temperature under the above four CTs (CT2, CT3, CT7, and CT8) is higher than 294 K, and the statistical results show that there is no obvious temperature inversion layer. Aerosol particles have a tendency to increase in temperature in the boundary layer, but the warming effect decreases with increasing height. The above characteristics indicate that under the control of CT2, CT3, CT7, and CT8, the boundary layer structure in the CZT region is unstable, and the vertical upward movement is obvious, which promotes the generation of convection. In this case, the weather will facilitate the vertical transmission of pollutants and make it difficult for particulate matter to accumulate on the surface layer. We have introduced the horizontal recirculation index, R, for further exploration.
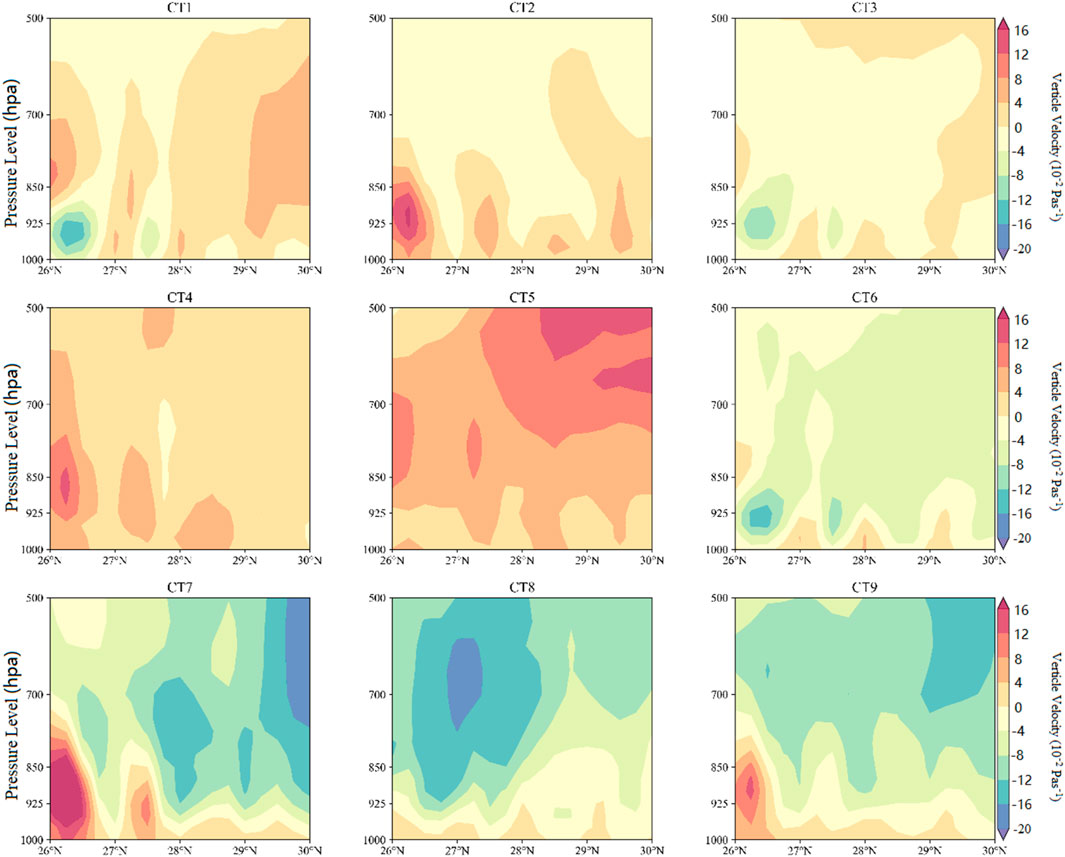
FIGURE 8. Latitude-altitude profile of the vertical wind velocity under the nine CTs in the CZT region, unit: 10–2 Pas−1.
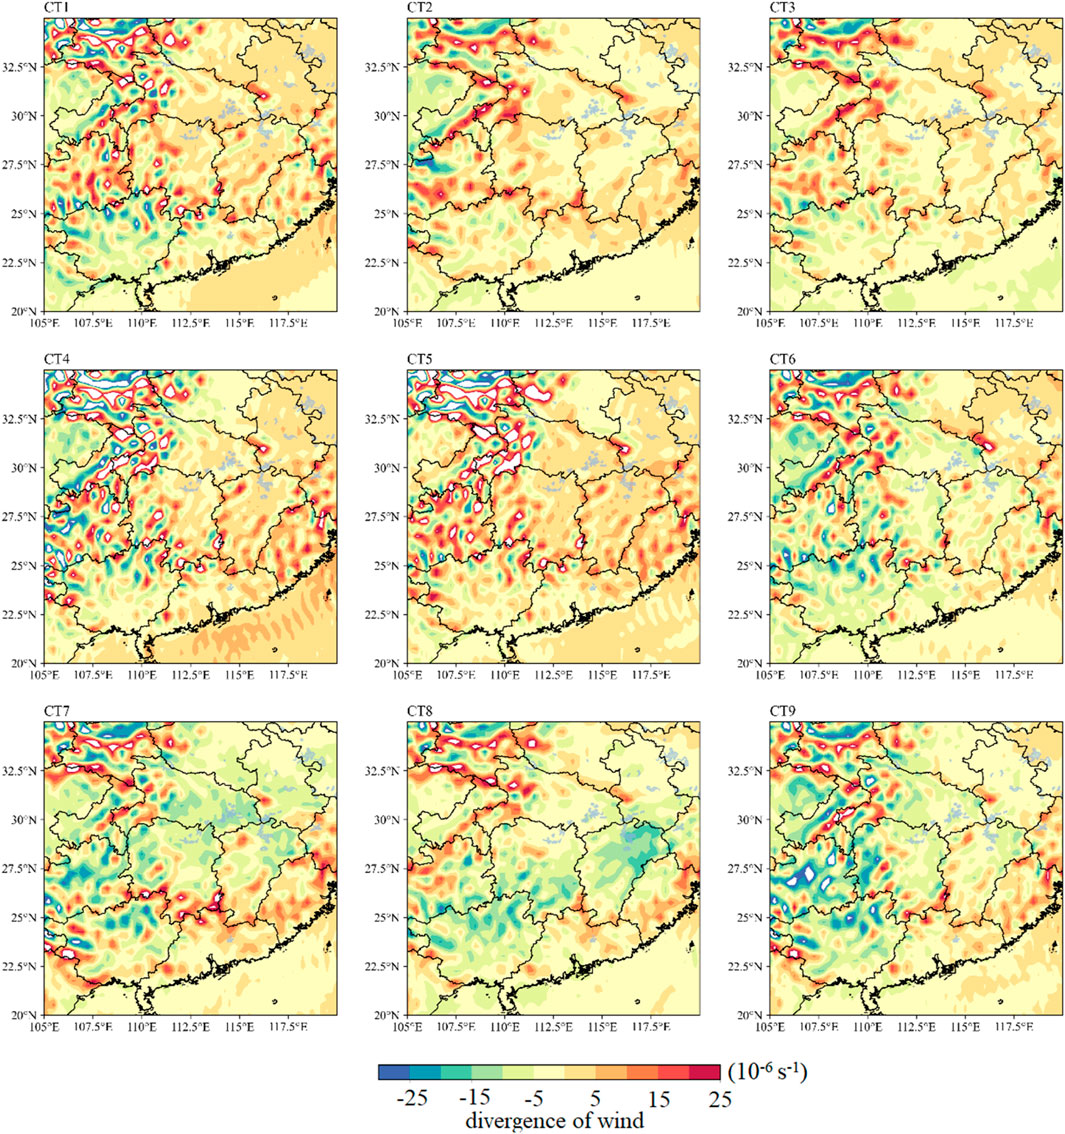
FIGURE 9. Average wind dispersion below 850 hPa under the nine CTs in the CZT region.
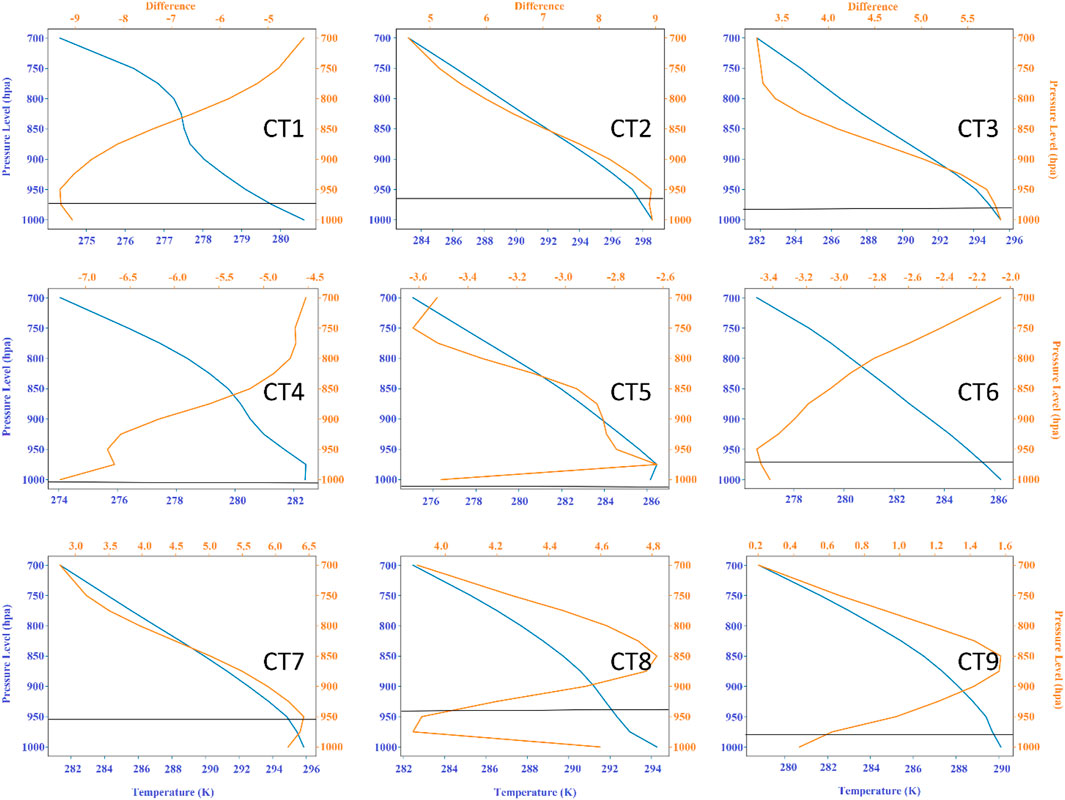
FIGURE 10. Vertical temperature profile and vertical temperature anomaly profile under the nine CTs in the CZT region.
Figure 7C shows the distribution of the recirculation index, R, in the CZT region under the nine CTs. Figure 11 shows the two-dimensional scatter plot of the kernel density distribution showing the relationship between the recirculation index, R, and PBLH under the nine CTs in the CZT region. From Figures 7B,C, Figure 11, and Table 1, it can be seen that under the control of CT4 and CT5, the value of R in the CZT area is larger (the average value of the index, R, is 0.43 and 0.33, respectively) and PBLH is lower (the average PBLH is 121.06 and 89.01 m, respectively). In this case, the local wind field is dominated by the recirculation type wind field, which is not conducive to the horizontal diffusion of pollutants. Further, the value of PBLH is low, which enables the pollutants to easily accumulate in the surface layer. Thus, the concentration of PM2.5 is higher (average PM2.5 concentrations are 76.21 μg/m³ and 78.49 μg/m³). Under the control of CT7 and CT8, the value of R for the CZT region is also larger (the average value of R is 0.36 and 0.31, respectively), but the PBLH value is generally higher than that under the control of other CTs, and the average PBLH is 497.04 and 504.14 m, respectively. Although the local wind field is dominated by the recirculation wind field, which is not conducive to the horizontal transportation of pollutants, due to the high boundary layer, the pollutants can easily diffuse to high altitudes, which is conducive to vertical transportation, thereby reducing the concentration of the particulate matter. Thus, the PM2.5 concentrations are lower under CT7 and CT8 (average PM2.5 concentrations are 41.41 μg/m³ and 25.39 μg/m³, respectively).
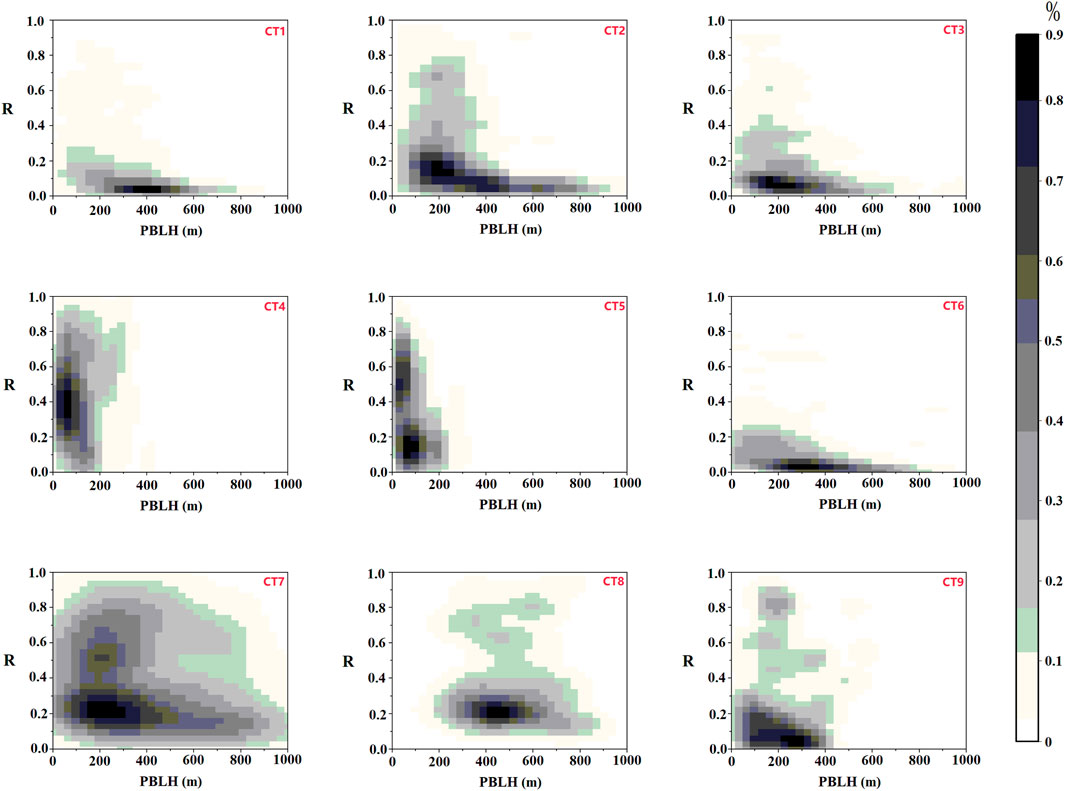
FIGURE 11. Scatter plot of the two-dimensional kernel density distribution of the recirculation index R and PBLH under the nine CTs in the CZT region.
To summarize, we have found that under the control of CT4, CT5, CT7, and CT8, the return index, R, is larger and the horizontal wind field is not conducive to the diffusion of pollutants. However, CT7 and CT8 have high boundary layer heights, strong convective activities, and good vertical diffusion conditions. Thus, it is not easy to cause pollutant accumulation under the control of these two circulation patterns. However, under the control of CT4 and CT5, the height of the boundary layer is low, which is not conducive to the vertical diffusion of pollutants. Under the control of CT4 and CT5, the severe weather conditions in the horizontal and vertical directions lead to a large amount of accumulation of pollutants.
There are many recirculation processes in the CZT as it shows in Section 3.2, but not all recirculation processes lead to high pollution events. In order to further clarify the influence of the boundary layer structure and horizontal recirculation wind field on the variation of particulate matter concentration, we screened two typical recirculation processes in Changsha from hundreds of recirculation processes in order to perform a comparative analysis. Figures 12, 13 show the time series of the meteorological parameters and the time series of the pollutant concentration changes for the two recirculation events from December 4–9, 2016, and August 8–14, 2017. The recirculation event in December 2016 was considered as R1, and that in August 2017 was considered as R2.
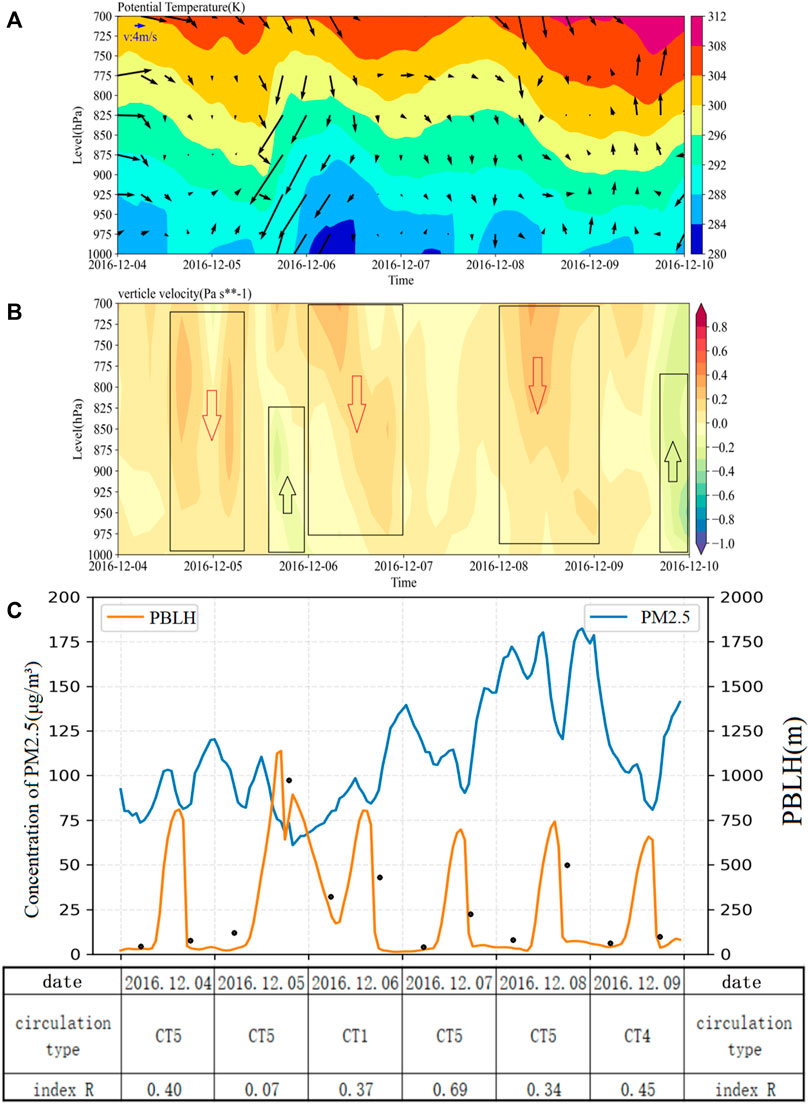
FIGURE 12. Plots showing a recirculation process that occurred in Changsha in December 2016. (A) Time series of the vertical geopotential temperature profile and the horizontal wind field in the Changsha area during the recirculation process. (B) Time series of the vertical wind speed profile in the Changsha area during the recirculation process, in which the red arrows represent downdraft, and black arrows represent updraft. (C) Time-dependent changes of the boundary layer height and PM2.5 concentration, as well as daily circulation patterns and R values in Changsha during the reflow process. Black dots represent the PBLH observed from the sounding data. The boundary layer height, geopotential temperature, horizontal wind field, and vertical wind speed in the figure have been obtained from the output of the WRF model.
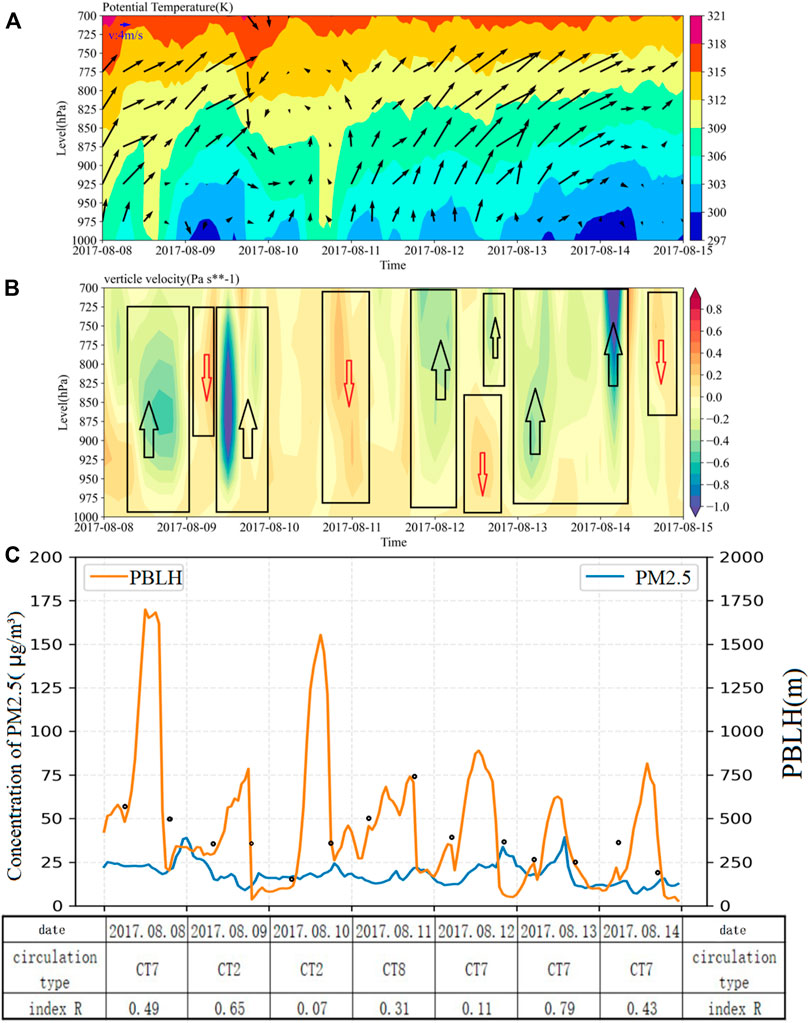
FIGURE 13. Plots showing a recirculation process that occurred in Changsha in August 2017. (A) Time series of the vertical geopotential temperature profile and the horizontal wind field in the Changsha area during the recirculation process. (B) Time series of the vertical wind speed profile in the Changsha area during the recirculation process, in which the red arrows represent downdraft, and black arrows represent updraft. (C) Time-dependent changes of the boundary layer height and PM2.5 concentration, as well as daily circulation patterns and R values in Changsha during the reflow process. Black dots represent the PBLH observed from the sounding data. The boundary layer height, geopotential temperature, horizontal wind field, and vertical wind speed in the figure have been obtained from the output of the WRF model.
From December 4 to 9, 2016, the Changsha area experienced a serious pollution incident. The hourly PM2.5 concentration was almost always high or close to the national secondary air quality standard of 75 μg/m³. From Figure 12C, it can be seen that the pollutant concentration fluctuated up and down between December 4 and 5 and showed a decreasing trend, reaching the lowest value (less than 75 μg/m³) on the evening of December 5. Then, from December 6 to 8, the pollutant concentration showed a fluctuating upward trend, reaching a peak (higher than 175 μg/m³) on the evening of December 8 and decreasing to ∼ 75 μg/m³ after December 9. During the R1 period, the pollutant concentration first decreased and then increased, which has the distinct characteristics of serious pollution events caused by the recirculation wind field.
It can be seen from Figures 12A–C that PBLH in the Changsha area exhibits obvious periodic changes during R1. The PBLH is very low at night and peaks at noon. In addition, the change in PBLH is exactly the opposite of the change in the PM2.5 concentration. During the R1 stage, the Changsha area was always affected by the high-pressure system and the downdraft airflow, and the CT changed from CT5 to CT1, then to CT5, and finally to CT4. From the night of December 5 to December 6, the northeast cold air mass affected the Changsha area, making the boundary layer structure stable, and the wind direction changed from southwest to northeast, causing a recirculation process. From December 6 to 8, the stable boundary layer structure and the strong downdraft brought by the northern cold high pressure confined the pollutants in the lower layers and caused continuous pollution. From December 7 to 8, the surface wind changed from southwesterly to northerly, causing a second recirculation. After December 9, the cold air mass in the Changsha area was controlled by CT4 to move eastward, the temperature increased, the increase in the boundary layer was conducive to the diffusion of pollutants, the surface wind field turned southeasterly, and the air quality improved.
From August 8 to 14, 2017, a “pseudo-recirculation” process occurred in the Changsha area. It can be seen from Figure 13C that the concentration of PM2.5 first increased and reached its peak on the night of 8 August 2017 (about 35 μg/m³, the national first-level air quality standard), and then its concentration continued to remain below 25 μg/m³. The PM2.5 concentration increased slightly on the evening of August 12, reached a peak ( ∼ 35 μg/m³) at noon on August 13, and then decreased to a level below 10 μg/m³. During the R2 period, the PM2.5 concentration first increased, then decreased, and increased again, which has the characteristics of a general recirculation process. However, the pollutant concentration has never exceeded 50 μg/m³, and thus we defined the R2 process as a “pseudo-recirculation” process.
From Figures 13A–C, it can be seen that the value of PBLH in the Changsha area also showed obvious periodic changes during the R2 stage, and the PBLH remained at a high level during this period (peak value max 1,500 m, min ∼100 m). During the R2 stage, Changsha was always affected by the southwest vortex, and the circulation pattern changed from CT7 to CT2, then to CT8, and finally to CT7. On the night of August 8, the temperature dropped, the boundary layer structure changed from vigorous activity to stable behavior, the surface wind changed from southwest to northwest, and a recirculation occurred. From the evening of August 9 to the evening of August 12, the temperature rose, the development of the boundary layer led to strong vertical convection, the vertical diffusion of the pollutants improved, and the continuous southwest airflow brought clean air. In addition, the lower R index (0.07 on the 10th, 0.31 on the 11th, and 0.11 on the 12th) made the horizontal diffusion conditions better. On August 13, the surface wind field changed from southwest wind to northeast wind, causing recirculation. At this time, the temperature decreased, the boundary layer became stable, and the vertical diffusion conditions deteriorated. After August 14, the ground temperature rose again under the control of CT7, the development of the boundary layer made the vertical convection strong, the vertical diffusion conditions improved, and the pollutant concentration remained low.
Figures 14A–D show the particle center movement trajectory, particle center height variation curve, particle swarm horizontal dispersion degree of variation curve, and the particle swarm vertical dispersion variation curve for each day from August 8 to 14, 2017. It can be seen from Figure 14A that the trajectory of the particle center of mass on August 8 exhibits a “C” shape. The particle center of mass first moved to the northwest and then turned to the southwest. This was the first recirculation. On August 12, the particle center of mass first moved to the northeast and then to the southeast, and the trajectory was arc-shaped. On August 13, the particle trajectory first turned to the northeast, then turned to the northwest, and then turned back to the southwest. This means that between August 12 and 13, the second recirculation occurred in the Changsha area. From Figure 14B, it can be seen that the height of the particle center of mass changed significantly in 7 days, and the height gradually increased from the initial release position (∼300 m) (the highest value was greater than 1,000 m), then fluctuated, and finally decreased (to a minimum of 600 m). This proves that the particle movement was significantly affected by convective activities during the 7 days, and the updraft carried the particles to the upper atmosphere.
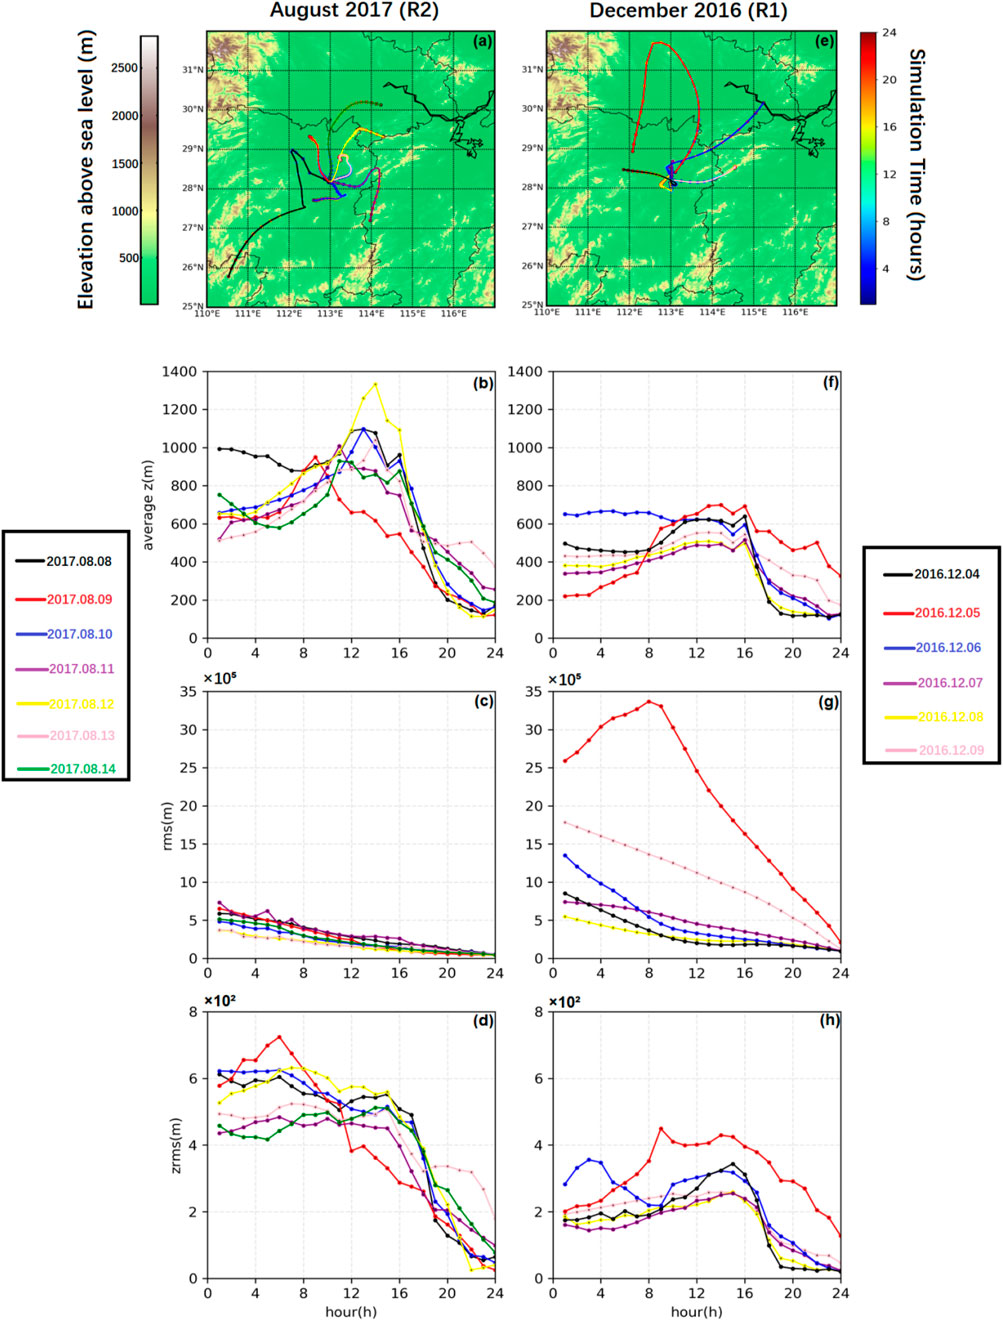
FIGURE 14. Simulation of R1 and R2 process, (A) the particle center of mass movement trajectory during R2, (B) the height variation curve of the particle mass center during R2, (C) the horizontal dispersion variation curve (rms) during R2, (D) the vertical dispersion variation curve of the particle swarm (zrms) during R2, (E–H) the same as (A–D) but for R1 process.
Figures 14E–H show the particle center of mass movement trajectory, the height variation curve of the particle mass center, the vertical dispersion variation curve, and the horizontal dispersion variation curve of the particle swarm for each day from December 4 to 9, 2016. From Figure 14E, it can be seen that the trajectory from December 5–6 has an “L” shape and the particles mainly come from the northeast, which proves that a recirculation occurred from December 5 to 6. For December 7, the particle trajectory exhibits a “U” shape. The particle center of mass first moves northward and then bends to the southwest. On December 8, the particle center of mass moves southward and then turns back northward. The trajectory is connected with that of December 7, which proves that the second recirculation occurred from December 7 to 8. From Figure 14F, it can be seen that the height of the particle center of mass did not change significantly in 6 days, the initial height of the release was about 300 m, and the height of the center of mass gradually increased to ∼600 m after 24 h of backward simulation. This proved that the movement of the particle swarm within 6 days was mainly affected by the downdraft airflow control.
From Figures 14C,D and Figures 14G,H, it can be seen that the vertical dispersion of particles is very large during R2, and the degree of vertical motion diffusion is significantly stronger than that during the R1 process. In the mean while, as the simulation time progresses, the horizontal dispersion of particles increases significantly during R1, whereas the change of the horizontal dispersion of particles is much smaller during R2. It proves that the particle movement is dominated by the horizontal dispersion during R2, and the vertical dispersion is low. While, during R1, the particle movement is dominated by the vertical dispersion, and the horizontal dispersion is low.
By comparing the above two processes, we found that the R1 process was mainly affected by CT5, CT1, and CT4. From Figure 6, we found that the CZT under these CTs is mainly located in the center of a weak high-pressure region or at the rear of the high-pressure region, and the movement of particles is affected by the downdraft airflow. The AW method predicts that the recirculation index, R, is large in this case, the horizontal recirculation effect is more obvious, and the vertical diffusion movement is not obvious. Therefore, the occurrence of two horizontal recirculation processes is the main reason for the continuously high PM2.5 concentration. The CZT region is mainly affected by CT7, CT2, and CT8 during the R2 process. It can be seen from Figure 6 that the CZT region is significantly affected by the southwest vortex under these CTs. Particles have a larger degree of vertical diffusion and a smaller degree of horizontal diffusion. Although it is calculated by the AW method that the value of R is large in this case (greater than the average value of 0.245 in Changsha), the phenomenon of recirculation is not obvious. This implies that the effect of horizontal recirculation on particulate pollution is weak. However, during the R2 process, the boundary layer rises, the convection develops vigorously, and the strong vertical diffusion movement is the main reason the PM2.5 concentration has been maintained at a very low level.
We calculated the daily index R of four major cities (Changsha, Hengyang, Yueyang, and Changde) in the CZT region using the AW wind field classification method. The PBLH of the above four cities at 8:00 (BJT) and 20:00 (BJT) were determined by the Richardson number method combined with the ERA5 boundary layer height variable. The relationship between R, PBLH, and the PM2.5 concentration was analyzed. The 925 hPa geopotential height in the CZT region was divided into nine types using the T-PCA circulation classification method. In this study, for the first time, the circulation pattern combined with the recirculation index R and the PBLH were used to comprehensively analyze the impact of the meteorological conditions on the change in the PM2.5 concentration in the CZT region. Finally, two recirculation processes were numerically simulated using the FLEXPART-WRF model. The following conclusions can be drawn from these simulations:
1. In the CZT, when the value of R is large, recirculation as well as the “pseudo-recirculation” occurs, and the proportion is balanced. When recirculation occurs, the PM2.5 concentration is high, and PBLH is low, whereas when “pseudo-recirculation” occurs, the PM2.5 concentration is low, and PBLH is high.
2. Under the control of CT4, CT5, CT7, and CT8, the horizontal wind recirculation index in the CZT region is very large. Among them, under the control of CT4 and CT5, the value of PBLH is very low, the vertical motion is weak. In addition, the diffusion of pollutants is mainly affected by horizontal recirculation, the diffusion ability is poor, and the concentration of PM2.5 is higher. Under the control of CT7 and CT8, the value of PBLH is high, the vertical movement is stronger, and the pollutant diffusion ability in the vertical direction is better, resulting in a lower PM2.5 concentration.
3. The FLEXPART-WRF model was used to analyze two recirculation events in the CZT region, and it is found that when using the AW horizontal wind field classification method to screen out the weather with high R, the boundary layer height must be introduced, combined with the CTs, in order to truly distinguish the recirculation phenomenon from the “pseudo-recirculation”. Only then can we judge whether there is polluted weather depending on the meteorological conditions.
The original contributions presented in the study are included in the article/Supplementary Material, further inquiries can be directed to the corresponding author.
Data curation, JZ; Methodology, JZ; Project administration, CZ; Software, HD; Visualization, HD; Writing—original draft, TW; Writing—review and editing, CZ and ZZ.
This research was funded by National Natural Science Foundation Committee of China (grant number 41875181, 41475021, 41375154 and 41405146), National Key R&D Program of China (grant number 2018YFC0213600) and Chinese Prime Minister Fund (grant number DQGG0104).
The authors declare that the research was conducted in the absence of any commercial or financial relationships that could be construed as a potential conflict of interest.
All claims expressed in this article are solely those of the authors and do not necessarily represent those of their affiliated organizations, or those of the publisher, the editors and the reviewers. Any product that may be evaluated in this article, or claim that may be made by its manufacturer, is not guaranteed or endorsed by the publisher.
Allwine, K. J., and Whiteman, C. D. (1994). Single-station integral measures of atmospheric stagnation, recirculation and ventilation. Atmos. Environ. 28, 713–721. doi:10.1016/1352-2310(94)90048-5
Ash, R., Porter, R., and Summers, T. (2012). China, the EU and China's twelfth five-year programme[M]. London: Europe China Research and Advice Network.
Bei, N., Liang, J., Li, X., and Wang, R. (2022). Worsening summertime ozone pollution in the Guanzhong Basin, China from 2014 to 2018: Impacts of synoptic conditions and anthropogenic emissions. Atmos. Environ. 274, 118974. doi:10.1016/j.atmosenv.2022.118974
Brioude, J., Arnold, D., Stohl, A., Cassiani, M., Morton, D., Seibert, P., et al. (2013). The Lagrangian particle dispersion model FLEXPART-WRF version 3.1. Geosci. Model. Dev. 6 (6), 1889–1904. doi:10.5194/gmd-6-1889-2013
Cao, Z., Sheng, L., Liu, Q., Yao, X., and Wang, W. (2015). Interannual increase of regional haze-fog in North China Plain in summer by intensified easterly winds and orographic forcing. Atmos. Environ. 122, 154–162. doi:10.1016/j.atmosenv.2015.09.042
Chen, F., Tewari, M., Kusaka, H., and Warner, T. (2006). “Current status of urban modeling in the community Weather Research and Forecast (WRF) model,” in paper presented at Joint Session with Sixth Symposium on the Urban Environment and AMS Forum: Managing our Physical and Natural Resources: Successes and Challenges, the 86th AMS Annual Meeting, 28 January–3 February (Atlanta, Georgia: AMS).
Chen, Z. H., Cheng, S. Y., Li, J. B., Guo, X., Wang, W., and Chen, D. (2008). Relationship between atmospheric pollution processes and synoptic pressure patterns in northern China. Atmos. Environ. 42 (24), 6078–6087. doi:10.1016/j.atmosenv.2008.03.043
Compagnucci, R. H., and Richman, M. B. (2008). Can principal component analysis provide atmospheric circulation or teleconnection patterns? Int. J. Climatol. 28 (6), 703–726. doi:10.1002/joc.1574
Davy, R. (2018). The climatology of the atmospheric boundary layer in contemporary global climate models. J. Clim. 31 (22), 9151–9173. doi:10.1175/jcli-d-17-0498.1
Dudhia, J. (1989). Numerical study of convection observed during the winter monsoon experiment using a mesoscale two-dimensional model. J. Atmos. Sci. 46, 3077–3107. doi:10.1175/1520-0469(1989)046<3077:nsocod>2.0.co;2
Eshel, G., and Bernstein, J. (2006). Relationship between large-scale Atmospheric states, subsidence, static stability and ground-level ozone in Illinois, USA. Water Air Soil Pollut. 171 (1–4), 111–133. doi:10.1007/s11270-005-9021-x
Feng, H., Zou, B., and Tang, Y. (2017). Scale- and region-dependence in landscape-pm2.5 correlation: Implications for urban planning. Remote Sens. 9 (9), 918. doi:10.3390/rs9090918
Ghude, S. D., Kumar, R., Jena, C., Debnath, S., Kulkarni, R. G., Alessandrini, S., et al. (2020). Evaluation of PM2.5 forecast using chemical data assimilation in the WRF-chem model: A novel initiative under the ministry of earth sciences air quality early warning system for Delhi, India. Curr. Sci. 118, 1803. doi:10.18520/cs/v118/i11/1803-1815
Gong, S., Liu, Y., He, J., Zhang, L., Lu, S., and Zhang, X. (2022a). Multi-scale analysis of the impacts of meteorology and emissions on PM2. 5 and O3 trends at various regions in China from 2013 to 2020 1: Synoptic circulation patterns and pollution[J]. Sci. Total Environ. 815, 152770. doi:10.1016/j.scitotenv.2021.152770
Gong, S., Zhang, L., Liu, C., Lu, S., Pan, W., and Zhang, Y. (2022b2022). Multi-scale analysis of the impacts of meteorology and emissions on PM2.5 and O3 trends at various regions in China from 2013 to 2020 2. Key weather elements and emissions. Sci. Total Environ. 824, 153847. doi:10.1016/j.scitotenv.2022.153847
Guo, J., Miao, Y., Zhang, Y., Liu, H., Li, Z., Zhang, W., et al. (2016). The climatology of planetary boundary layer height in China derived from radiosonde and reanalysis data. Atmos. Chem. Phys. 16 (20), 13309–13319. doi:10.5194/acp-16-13309-2016
Han, Y., Qi, M., Chen, Y., Shen, H., Liu, J., Huang, Y., et al. (2015). Influences of ambient air PM2. 5 concentration and meteorological condition on the indoor PM2. 5 concentrations in a residential apartment in Beijing using a new approach. Environ. Pollut. 205, 307–314. doi:10.1016/j.envpol.2015.04.026
Hersbach, H., Bell, B., Berrisford, P., Hirahara, S., Horányi, A., Muñoz-Sabater, J., et al. (2020). The ERA5 global reanalysis. Q. J. R. Meteorol. Soc. 146 (730), 1999–2049. doi:10.1002/qj.3803
Hong, S. Y., Dudhia, J., and Chen, S. H. (2004). A revised approach to ice microphysical processes for the bulk parameterization of clouds and precipitation. Mon. Weather Rev. 132, 103–120. doi:10.1175/1520-0493(2004)132<0103:aratim>2.0.co;2
Huang, S. (2018). Air pollution and control: Past, present and future. Chin. Sci. Bull. 63 (10), 895–919. (in Chinese). doi:10.1360/n972017-01271
Huth, R., Beck, C., Philipp, A., Demuzere, M., Ustrnul, Z., Cahynova, M., et al. (2008). Classifications of atmospheric circulation patterns. Ann. N. Y. Acad. Sci. 1146, 105–152. doi:10.1196/annals.1446.019
Janjic, Z. I. (2001). Nonsingular implementation of the mellor-yamada level 2.5 scheme in the NCEP meso model. National Centers for Environmental Prediction, 437. Office Note.
Jena, C., Ghude, S. D., Kulkarni, R., Debnath, S., Kumar, R., Kumar Soni, V., et al. (2020). Evaluating the sensitivity of fine particulate matter (PM 2.5) simulations to chemical mechanism in Delhi[J]. Atmos. Chem. Phys. Discuss., 1–28.
Jena, C., Ghude, S. D., Kumar, R., Debnath, S., Govardhan, G., Soni, V. K., et al. (2021). Performance of high resolution (400 m) PM2.5 forecast over Delhi. Sci. Rep. 11 (1), 4104. doi:10.1038/s41598-021-83467-8
Ji, D. S., Wang, Y. S., Wang, L. L., Chen, L., Hu, B., Tang, G., et al. (2012). Analysis of heavy pollution episodes in selected cities of northern China. Atmos. Environ. 50, 338–348. doi:10.1016/j.atmosenv.2011.11.053
Jiang, N., Hay, J., and Fisher, G. (2005). Synoptic weather types and morning rush hour nitrogen oxides concentrations during Auckland winters. Weather Clim. 25, 43. doi:10.2307/26169678
Kain, J. S. (2004). The Kain fritsch convective parameterization: An update. J. Appl. Meteor. 43, 170–181. doi:10.1175/1520-0450(2004)043<0170:tkcpau>2.0.co;2
Kalnay, E., Kanamitsu, M., Kistler, R., Collins, W., Deaven, D., Gandin, L., et al. (1996). The NCEP/NCAR 40-year reanalysis project. Bull. Am. Meteorol. Soc. 77, 437–471. doi:10.1175/1520-0477(1996)077<0437:tnyrp>2.0.co;2
Kumar, R., He, C., Bhardwaj, P., Lacey, F., Buchholz, R. R., Brasseur, G. P., et al. (2022). Assessment of regional carbon monoxide simulations over Africa and insights into source attribution and regional transport. Atmos. Environ. 277, 119075. doi:10.1016/j.atmosenv.2022.119075
Levy, I., Dayan, U., and Mahrer, Y. (2008b). A five-year study of coastal recirculation and its effect on air pollutants over the East Mediterranean region. J. Geophys. Res. 113, D16121. doi:10.1029/2007jd009529
Levy, I., Dayan, U., and Mahrer, Y. (20102010). Differing atmospheric scales of motion and their impact on air pollutants. Int. J. Climatol. 30, 612–619. doi:10.1002/joc.1905
Levy, I., Dayan, U., and Mahrer, Y. (2008a). Studying coastal recirculation with a simplified analytical land-sea breeze model. J. Geophys. Res. 113, D03104. doi:10.1029/2007jd008628
Li, J., Liao, H., Hu, J., and Li, N. (2019). Severe particulate pollution days in China during 2013–2018 and the associated typical weather patterns in Beijing-Tianjin-Hebei and the Yangtze River Delta regions. Environ. Pollut. 248, 74–81. doi:10.1016/j.envpol.2019.01.124
Li, Tingyuan, Deng, Xuejiao, Fan, Shaojia, Wu, Dui, Fei, Li, Deng, Tao, et al. (2012). [Study on air quality and pollution meteorology conditions of Guangzhou during the 2010 Asian games]. Environ. Sci. 33 (09), 2932–2938.
Li, X., Miao, Y., Ma, Y., Wang, Y., and Zhang, Y. (2021a). Impacts of synoptic forcing and topography on aerosol pollution during winter in Shenyang, Northeast China. Atmos. Res., 262105764. doi:10.1016/j.atmosres.2021.105764
Li, Y., Liu, J., Han, H., Zhao, T., Zhang, X., Zhuang, B., et al. (2019). Collective impacts of biomass burning and synoptic weather on surface PM2.5 and CO in Northeast China. Atmos. Environ. 213, 64–80. doi:10.1016/j.atmosenv.2019.05.062
Li, Y., Miao, Y., Che, H., and Liu, S. (2021b2021). On the heavy aerosol pollution and its meteorological dependence in Shandong province, China. Atmos. Res. 256, 105572. doi:10.1016/j.atmosres.2021.105572
Liu, N., Zhou, S., Liu, C., and Guo, J. (20192019). Synoptic circulation pattern and boundary layer structure associated with PM2.5 during wintertime haze pollution episodes in Shanghai. Atmos. Res. 228, 186–195. doi:10.1016/j.atmosres.2019.06.001
Liu, T., Marlier, M. E., DeFries, R. S., Westervelt, D. M., Xia, K. R., Fiore, A. M., et al. (2018). Seasonal impact of regional outdoor biomass burning on air pollution in three Indian cities: Delhi, Bengaluru, and pune. Atmos. Environ. X. 172, 83–92. doi:10.1016/j.atmosenv.2017.10.024
Luan, T., Guo, X., Guo, L., and Zhang, T. (2018). Quantifying the relationship between PM2.5 concentration, visibility and planetary boundary layer height for long-lasting haze and fog–haze mixed events in Beijing. Atmos. Chem. Phys. 18 (1), 203–225. doi:10.5194/acp-18-203-2018
Luo, T., Yuan, R., and Wang, Z. (2014). Lidar-based remote sensing of atmospheric boundary layer height over land and ocean. Atmos. Meas. Tech. 7 (1), 173–182. doi:10.5194/amt-7-173-2014
Ma, T., Duan, F., He, K., Qin, Y., Tong, D., Geng, G., et al. (2019). Air pollution characteristics and their relationship with emissions and meteorology in the Yangtze River Delta region during 2014–2016. J. Environ. Sci. 83, 8–20. doi:10.1016/j.jes.2019.02.031
Mao, F., Zang, L., Wang, Z., Pan, Z., Zhu, B., Gong, W., et al. (2020). Dominant synoptic patterns during wintertime and their impacts on aerosol pollution in central China. Atmos. Res. 232 (Feb.), 104701. doi:10.1016/j.atmosres.2019.104701
Miao, Y., Liu, S., Guo, J., Yan, Y., Huang, S., Zhang, G., et al. (2018). Impacts of meteorological conditions on wintertime PM2.5 pollution in Taiyuan, North China[J]. Environ. Sci. Pollut. Res. 25 (22), 21855–21866. doi:10.1007/s11356-018-2327-1
Miao, Y., Guo, J., Liu, S., Liu, H., Li, Z., Zhang, W., et al. (2017). Classification of summertime synoptic patterns in Beijing and their associations with boundary layer structure affecting aerosol pollution. Atmos. Chem. Phys. 17, 3097–3110. doi:10.5194/acp-17-3097-2017
Mlawer, E. J., Taubman, S. J., Brown, P. D., Iacono, M. J., and Clough, S. A. (1997). Radiative transfer for inhomogeneous atmospheres: RRTM, a validated correlated-k model for the longwave. J. Geophys. Res. 102, 16663–16682. doi:10.1029/97jd00237
Nakanishi, M., and Niino, H. (2006). An improved mellor–yamada level-3 model: Its numerical stability and application to a regional prediction of advection fog. Bound. Layer. Meteorol. 119 (2), 397–407. doi:10.1007/s10546-005-9030-8
Nandi, I., Srivastava, S., Yarragunta, Y., Kumar, R., and Mitra, D. (2020). Distribution of surface carbon monoxide over the Indian subcontinent: Investigation of source contributions using WRF-Chem. Atmos. Environ. 243, 117838. doi:10.1016/j.atmosenv.2020.117838
Richman, M. B. (1981). Obliquely rotated principal components: An improved meteorological map typing technique. J. Appl. Meteor. 20, 1145–1159. doi:10.1175/1520-0450(1981)020<1145:orpcai>2.0.co;2
Russo, A., Gouveia, C., Levy, I., Dayan, U., Jerez, S., Mendes, M., et al. (2016). Coastal recirculation potential affecting air pollutants in Portugal: The role of circulation weather types. Atmos. Environ. 135, 9–19. doi:10.1016/j.atmosenv.2016.03.039
Russo, A., Gouveia, C. M., Soares, P. M., Cardoso, R. M., Mendes, M. T., Trigo, R. M., et al. (2018). The unprecedented 2014 legionnaires’ disease outbreak in Portugal: Atmospheric driving mechanisms. Int. J. Biometeorol. 62 (7), 1167–1179. doi:10.1007/s00484-018-1520-8
Russo, A., Trigo, R. M., Martins, H., and Mendes, M. T. (2014). NO2, PM10 and O3 urban concentrations and its association with circulation weather types in Portugal. Atmos. Environ. 89, 768–785. doi:10.1016/j.atmosenv.2014.02.010
Shu, L., Wang, T., Han, H., Xie, M., Chen, P., Li, M., et al. (2020). Summertime ozone pollution in the Yangtze River Delta of eastern China during 2013–2017: Synoptic impacts and source apportionment. Environ. Pollut. 257, 113631. doi:10.1016/j.envpol.2019.113631
Su, S., Song, M., Wu, C., Wu, X., Guangyuan, L., and Xingyu, C. (2015). The potential impact of temperature and wind speed in North China on the formation of winter haze [J]. Tech. Equip. Environ. Pollut. Control 9 (08), 3928–3936.
Sun, Z. B., Wang, H., Guo, C., Jin, W., Tiantao, C., and Zi-ming, L. (2019). Barrier effect of terrain on cold air and return flow of dust air masses. Atmos. Res. 220, 81–91. doi:10.1016/j.atmosres.2019.01.007
Sun, Z., Zhang, X., Zhao, X., Xia, X., Miao, S., Li, Z., et al. (2018). Oscillation of surface PM2.5 concentration resulting from an alternation of easterly and southerly winds in beijing: Mechanisms and implications. J. Meteorol. Res. 32 (002), 288–301. doi:10.1007/s13351-018-7064-3
Sun, Z., Zhao, X., Li, Z., Tang, G., and Miao, S. (2021). Boundary layer structure characteristics under objective classification of persistent pollution weather types in the Beijing area. Atmos. Chem. Phys. 21, 8863–8882. doi:10.5194/acp-21-8863-2021
Surkova, G. (2013). Air recirculation and ventilation in the coastal regions of the Black Sea. Open Geosci. 5 (2), 196–207. doi:10.2478/s13533-012-0126-7
Tang, X., Chen, X., and Tian, Y. (2017). Chemical composition and source apportionment of PM2.5–A case study from one year continuous sampling in the Chang-Zhu-Tan urban agglomeration[J]. Atmos. Pollut. Res. 8 (5), 885–899. doi:10.1016/j.apr.2017.02.004
Vogelezang, D. H. P., and Holtslag, A. A. M. (1996). Evaluation and model impacts of alternative boundary-layer height formulations. Bound. Layer. Meteorol. 81, 245–269. doi:10.1007/BF02430331
Wang, F., Peng, L., Zhou, X., Zeng, Q., and Luo, S. (2021). Typical sources of Cd to paddy fields in different contaminated areas and their impacts on Cd accumulation in topsoil and rice in Changzhutan, China. Environ. Res. 193, 110523. doi:10.1016/j.envres.2020.110523
Wang, T., Du, H., Zhao, Z., Russo, A., Zhang, J., and Zhou, C. (2022). The impact of potential recirculation on the air quality of Bohai Bay in China. Atmos. Pollut. Res. 13 (1), 101268. doi:10.1016/j.apr.2021.101268
Wang, X., Jiang, Y., Liu, H., and Zhang, N. (2016). Analysis of the characteristics of different weather condition impact on air quality in hangzhou by case studies. Environ. Monit. Early Warn. 8 (6), 1∼9. (in Chinese). doi:10.3969/j.issn.1674-6732.2016.06.001
Wang, X., Wang, Z., Tong, Y., and Gong, Y. (2009). Foreshowing of the Western Pacific tropical cyclone track to PM10 air pollution episode in the Beijing area. Sci. Bull. (Beijing). 54 (1), 830–835. (in Chinese). doi:10.1007/s11434-008-0562-4
Wang, Z., and Yang, L. (2015). Delinking indicators on regional industry development and carbon emissions: Beijing–Tianjin–Hebei economic band case. Ecol. Indic. 48, 41–48. doi:10.1016/j.ecolind.2014.07.035
Xu, T., Song, Y., Liu, M., Cai, X., Zhang, H., Guo, J., et al. (2019). Temperature inversions in severe polluted days derived from radiosonde data in North China from 2011 to 2016. Sci. Total Environ. 647, 1011–1020. doi:10.1016/j.scitotenv.2018.08.088
Xu, Y., Xue, W., Lei, Y., Huang, Q., Zhao, Y., Cheng, S., et al. (2020). Spatiotemporal variation in the impact of meteorological conditions on PM2.5 pollution in China from 2000 to 2017[J]. Atmos. Environ. 223, 117215. doi:10.1016/j.atmosenv.2019.117215
Yan, Y., Cai, X., Miao, Y., and Yu, M. (2022). Synoptic condition and boundary layer structure regulate PM2.5 pollution in the Huaihe River Basin, China[J]. Atmos. Res. 269, 106041. doi:10.1016/j.atmosres.2022.106041
Yan, Y., Wang, X., Qu, K., Li, X., Shi, W., Peng, Z., et al. (2021). Impacts of synoptic circulations on summertime ozone pollution in Guanzhong Basin, northwestern China. Atmos. Environ. 262, 118660. doi:10.1016/j.atmosenv.2021.118660
Yang, Y., Zheng, X., Gao, Z., Wang, H., Wang, T., Li, Y., et al. (2018). Long-term trends of persistent synoptic circulation events in planetary boundary layer and their relationships with haze pollution in winter half-year over Eastern China. J. Geophys. Res. Atmos. 123, 10,991–11,007. doi:10.1029/2018JD028982
Ye, X., Song, Y., Cai, X., and Zhang, H. (20162016). Study on the synoptic flow patterns and boundary layer process of the severe haze events over the North China Plain in January 2013. Atmos. Environ. 124, 129–145. doi:10.1016/j.atmosenv.2015.06.011
Yin, Z., Wang, H., and Guo, W. (2015). Climatic change features of fog and haze in winter over North China and Huang-Huai Area. Sci. China Earth Sci. 58 (8), 1370–1376. doi:10.1007/s11430-015-5089-3
Zhai, L., Sun, Z., Li, Z., Yin, X., Xiong, Y., Wu, J., et al. (2019). Dynamic effects of topography on dust particles in the Beijing region of China. Atmos. Environ. 213, 413–423. doi:10.1016/j.atmosenv.2019.06.029
Zhan, C., Xie, M., Fang, D., Wang, T. j., Wu, Z., Lu, H., et al. (2019). Synoptic weather patterns and their impacts on regional particle pollution in the city cluster of the Sichuan Basin, China. Atmos. Environ. 208, 34–47. doi:10.1016/j.atmosenv.2019.03.033
Zhang, J. P., Zhu, T., Zhang, Q. H., Li, C. C., Shu, H. L., Ying, Y., et al. (2012b). The impact of circulation patterns on regional transport pathways and air quality over Beijing and its surroundings. Atmos. Chem. Phys. 12, 5031–5053. doi:10.5194/acp-12-5031-2012
Zhang, K., Chai, F., Zheng, Z., Yang, Q., Li, J., Wang, J., et al. (2014). Characteristics of atmospheric particles and heavy metals in winter in Chang-Zhu-Tan city clusters, China. J. Environ. Sci. 26 (1), 147–153. doi:10.1016/s1001-0742(13)60391-5
Zhang, Q., Ma, X., Tie, X., Huang, M., and Zhao, C. (2009). Vertical distributions of aerosols under different weather conditions: Analysis of in-situ aircraft measurements in Beijing, China. Atmos. Environ. 43 (34), 5526–5535. doi:10.1016/j.atmosenv.2009.05.037
Zhang, Y., and Jiang, W. (2018). Pollution characteristics and influencing factors of atmospheric particulate matter (PM2.5) in chang-zhu-tan area[C]//IOP conference series: Earth and environmental science. IOP Conf. Ser. Earth Environ. Sci. 108 (4), 042047. doi:10.1088/1755-1315/108/4/042047
Zhang, Y., Guo, Y., Li, G., Zhou, J., Jin, X., Wang, W., et al. (2012a). The spatial characteristics of ambient particulate matter and daily mortality in the urban area of Beijing, China. Sci. Total Environ. 435, 14–20. doi:10.1016/j.scitotenv.2012.06.092
Zhao, Z., Xi, H., Russo, A., Du, H., Gong, Y., Xiang, J., et al. (2019). The influence of multi-scale atmospheric circulation on severe haze events in autumn and winter in Shanghai, China. Sustainability 11 (21), 5979. doi:10.3390/su11215979
Zhao, Z., Zhou, Z., Russo, A., Du, H., Xiang, J., Zhang, J., et al. (2021b). Impact of meteorological conditions at multiple scales on ozone concentration in the Yangtze River Delta. Environ. Sci. Pollut. Res. 28, 62991–63007. doi:10.1007/s11356-021-15160-2
Zhao, Z., Zhou, Z., Russo, A., Xi, H., Zhang, J., Du, H., et al. (2021a). Comparative analysis of the impact of weather conditions and human activities on air quality in the Dongting and Poyang Lake Region during the COVID-19 pandemic. Atmos. Pollut. Res. 12 (5), 101054. doi:10.1016/j.apr.2021.101054
Zhou, C. J., Wei, G., Xiang, J., Zhang, K., Li, C., and Zhang, J. (2018). Effects of synoptic circulation patterns on air quality in Nanjing and its surrounding areas during 2013–2015. Atmos. Pollut. Res. 9, 723–734. doi:10.1016/j.apr.2018.01.015
Zhou, C., Wei, G., Zheng, H., Russo, A., Li, C., Du, H., et al. (2019). Effects of potential recirculation on air quality in coastal cities in the Yangtze River Delta. Sci. Total Environ. 651, 12–23. doi:10.1016/j.scitotenv.2018.08.423
Zhou, N., He, G., and Williams, C. (2012). China's development of low-carbon eco-cities and associated indicator systems[R]. Berkeley, CA (United States): Lawrence Berkeley National Lab.(LBNL.
Zhu, Y. F., Gao, J., and Liao, J. Y. (2019). Characteristics of a continuous haze process in the chang-zhu-tan region of China and its influencing factors[J]. Appl. Ecol. Environ. Res. 17 (6), 14847–14858. doi:10.15666/aeer/1706_1484714858
Keywords: changsha-zhuzhou-xiangtan urban agglomeration, t-mode PCA, particulate matter, AW wind field classification method, boundary layer structure, FLEXPART-WRF model
Citation: Wang T, Du H, Zhao Z, Zhang J and Zhou C (2022) Collective influences of boundary layer process and synoptic circulation on particulate pollution: A new study in changsha-zhuzhou-xiangtan urban agglomeration of central china. Front. Environ. Sci. 10:939147. doi: 10.3389/fenvs.2022.939147
Received: 08 May 2022; Accepted: 01 July 2022;
Published: 19 July 2022.
Edited by:
Tirthankar Banerjee, Banaras Hindu University, IndiaReviewed by:
Cheng Liu, University of Science and Technology of China, ChinaCopyright © 2022 Wang, Du, Zhao, Zhang and Zhou. This is an open-access article distributed under the terms of the Creative Commons Attribution License (CC BY). The use, distribution or reproduction in other forums is permitted, provided the original author(s) and the copyright owner(s) are credited and that the original publication in this journal is cited, in accordance with accepted academic practice. No use, distribution or reproduction is permitted which does not comply with these terms.
*Correspondence: Chengjun Zhou, bnVkdF96Y2pAZm94bWFpbC5jb20=
Disclaimer: All claims expressed in this article are solely those of the authors and do not necessarily represent those of their affiliated organizations, or those of the publisher, the editors and the reviewers. Any product that may be evaluated in this article or claim that may be made by its manufacturer is not guaranteed or endorsed by the publisher.
Research integrity at Frontiers
Learn more about the work of our research integrity team to safeguard the quality of each article we publish.