Abstract
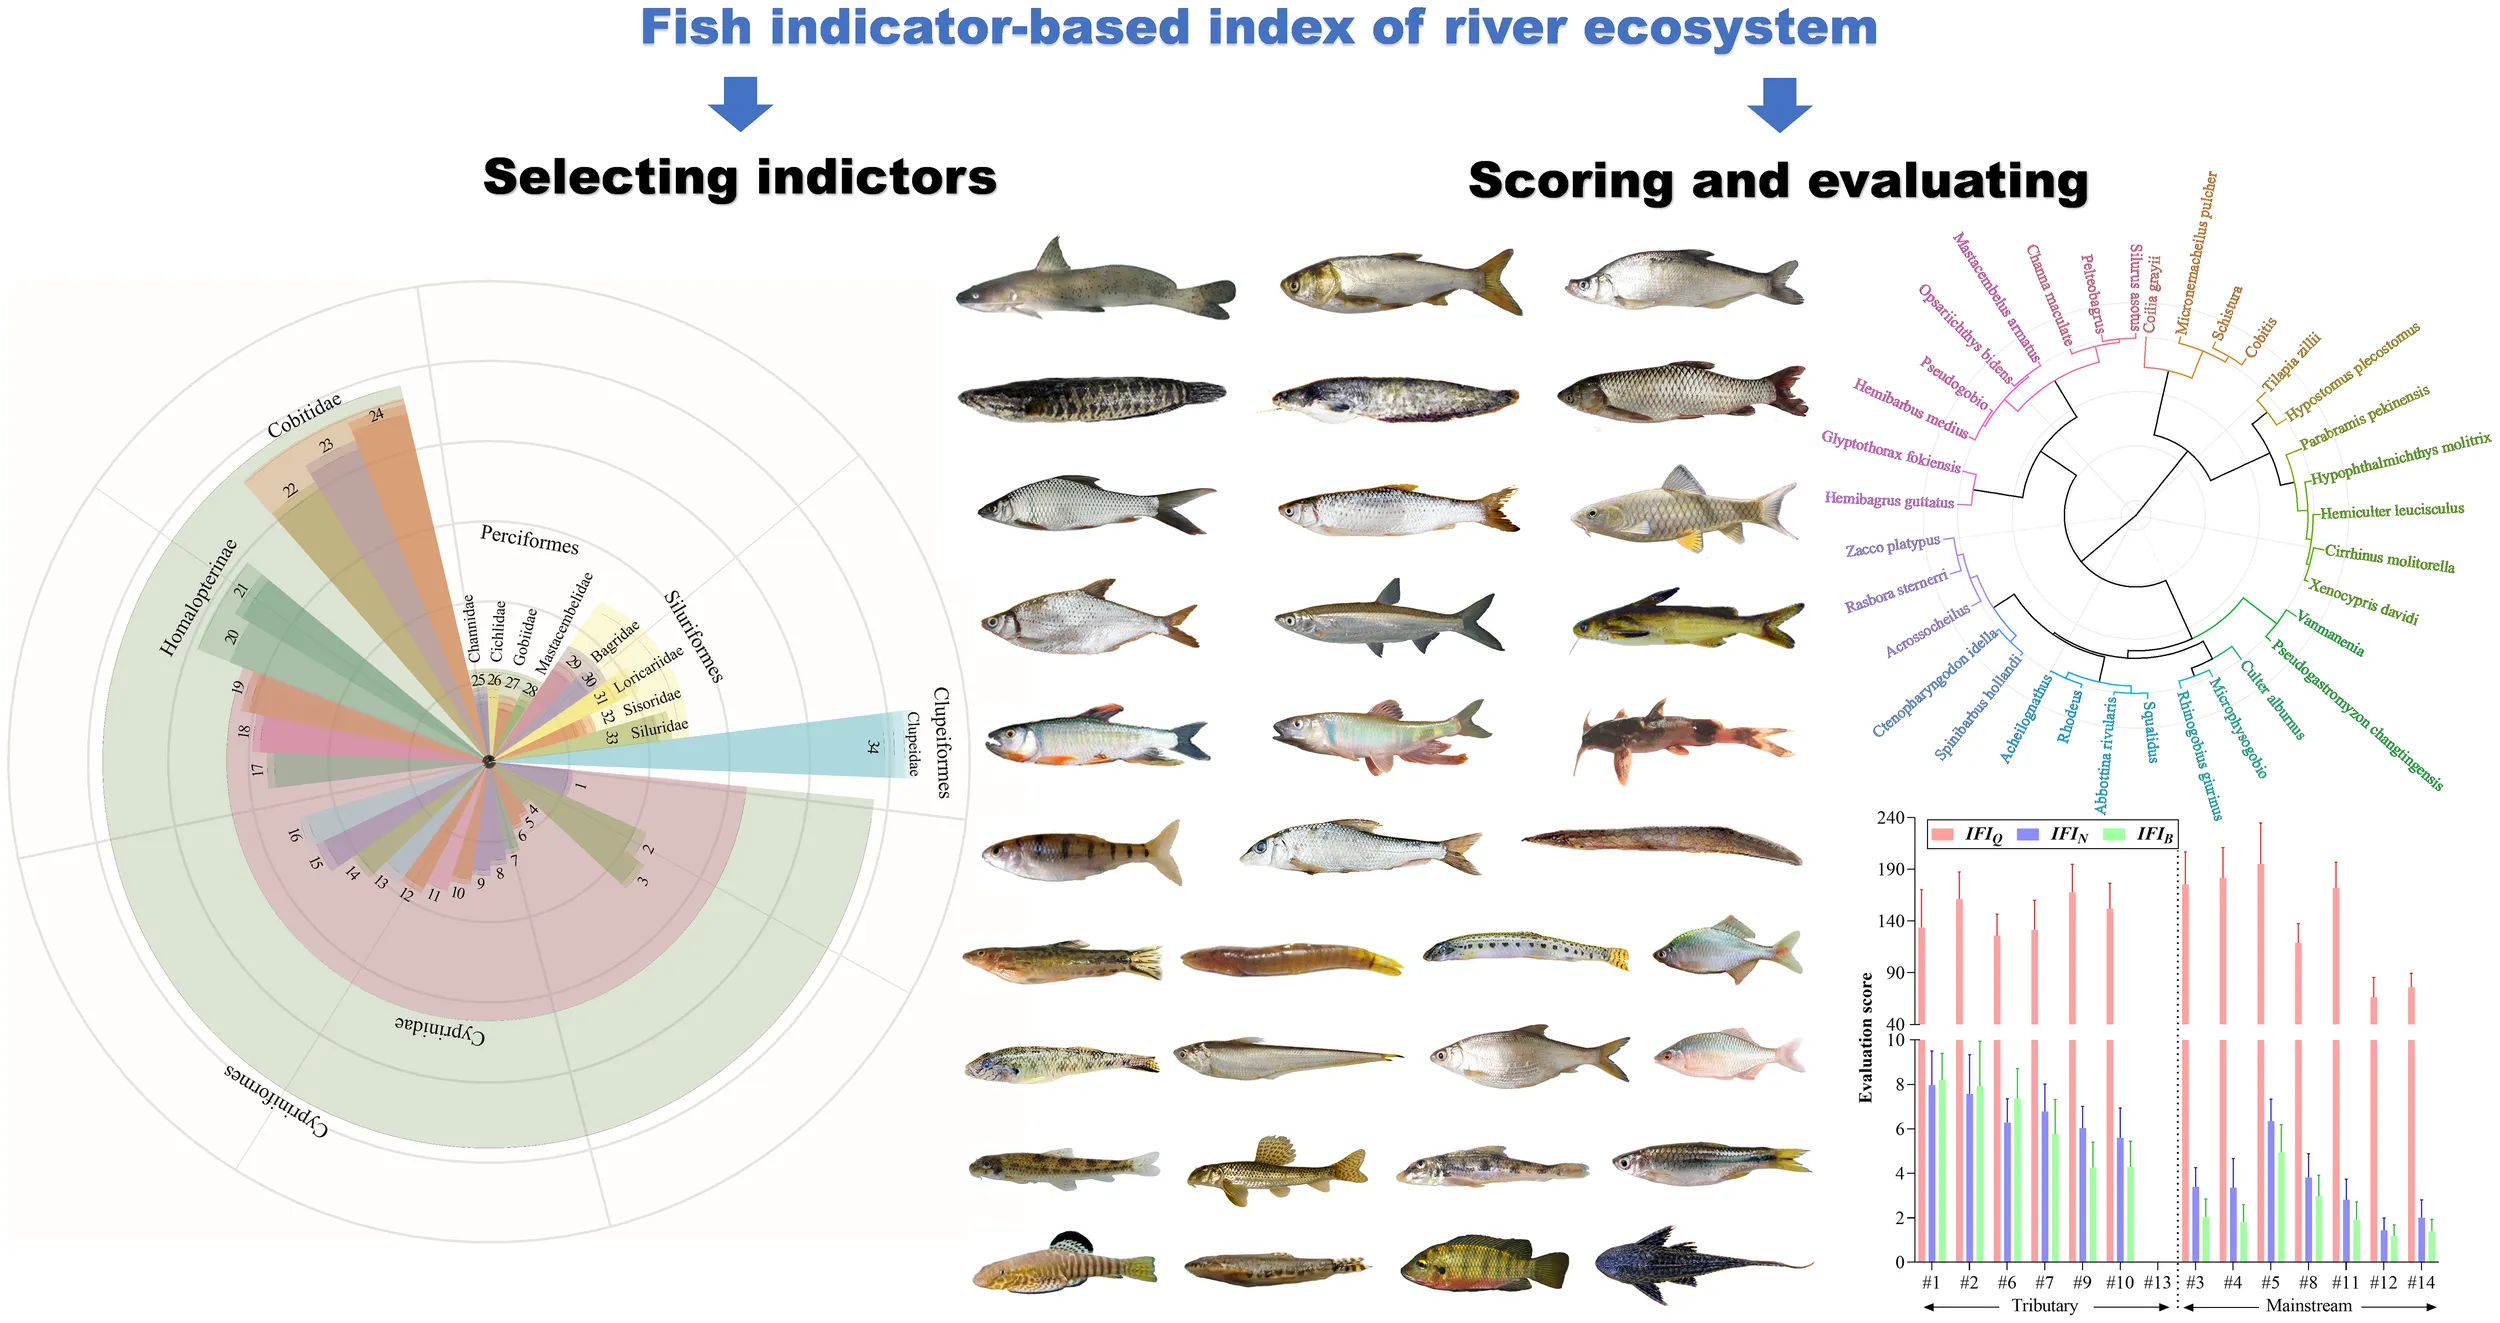
Rivers are constantly disturbed by anthropogenic stressors. Developing robust biotic indicators to assess river environments across large spatial scales is important. In the subtropical Liuxi River of China, 34 native fish indicators, including 4 genera and 30 species, were selected from 108 fish species by linear discriminant analysis. These indicators were grouped into 19 ecological items and assigned evaluation scores according to the roles they played in the food web (e.g., keystoneness and trophic level) and their positive feedback on the environment (e.g., requirements for feeding, spawning/nursing, and migrating). Three formulae for calculating the index of fish indicators (IFI) were developed based on the scoring of each indicator and weighted by relative abundance (individual number, i.e., IFIN) and relative biomass (wet weight, i.e., IFIB). Spearman correlation analysis showed that IFIB, which had positive (P< 0.05) correlations with elevation (m), dissolved oxygen (mg/L), flow velocity (cm/s), Shannon-Wiener diversity, benthic index of biotic integrity, exhibited a more powerful explanation of biodiversity and environmental factors than IFIN and unweighted IFI. Therefore, IFIB was most suitable for constructing a scoring system to evaluate ecological status (e.g., water and habitat quality). These results suggested that fish indicator-based scoring and evaluation system was effectively in not only assessing the site- or region-specific ecological status bot also reflecting the fluvial biodiversity and food web integrity. Further application and promotion of this indicator-based evaluation method may improve field investigation efficiency and contribute greatly to the conservation and management of river ecosystems.
1 Introduction
Rivers maintain unique biotic resources and provide critical water supplies to people, yet river systems are directly threatened by human activities and stand to be further affected by anthropogenic climate change (Dudgeon, 2000). Multiple environmental stressors, such as channelization, agricultural runoff, and alien species invasion, threaten river ecosystems (Wiens, 2002). These stressors endanger the biodiversity of 65% of the world’s river habitats, putting thousands of aquatic wildlife species at risk (Vörösmarty et al., 2010). Aquatic organisms, such as fish, phytoplankton, benthic flora (e.g., diatoms and macrophytes), and macroinvertebrates, are commonly used as indicators to reflect biological integrity and river health (Winemiller, 1990). Fish, with a more complex life history than invertebrates and plants, exhibit specific requirements for food resources, spawning/nursing ground, and migration pathways during their growth stages. Therefore, the spatial distribution of fish was closely associated with the longitudinal changes in river environment, especially for the river sections under human interference (Wang et al., 2020a, b).
Fish are favored by researchers and monitors to reflect comprehensive information on river ecology and environment (Mujiyanto et al., 2021). For example, given that fish with high food selectivity depend greatly on available resources, the appearance of insectivorous, periphytivorous, and molluscivorous fish could indicate a benthic community composed of aquatic insect larvae, epilithic diatoms, and demersal bivalves (Wang et al., 2018b, 2019). Such a community structure in river food web further indicated suitable environmental conditions, e.g., pristine riffle habitats with turbulent flows and pebble/sand substrate, that could support trophic linkages between fish predators and their prey. From the perspective of anthropogenic disturbance, the destruction of riparian zones caused by human activities (e.g., revetments, channelization, and land use change) can lead to the extinction of aquatic plants; as a result, fish laying viscous eggs on submerged/emergent hydrophytes sharply disappeared (Southerland et al., 2007; Souza and Vianna, 2020). In this context, the appearance and richness of fish with indicative function could reflect not only the community-level biodiversity (Wang et al., 2020a), but also the environmental conditions (e.g., water quality and habitat integrity) supporting local food webs (Wang et al., 2018a, 2021).
Despite the development of different fish indices (e.g., fish-based integrity/health index, see Jordan and Vaas (2000); Karr (1981), doubts concerning their suitability and sensitivity are still noted, and the need for further improvements to link pressures with index response has been claimed (Pérez-Domínguez et al., 2012). Some efforts have been employed through the European Union Water Framework Directive (EUWFD), which attributes ecological status to an aquatic ecosystem, but there is still a need for more studies (Souza and Vianna, 2020). Considering that these approaches have been developed primarily based on the biotic and abiotic features of temperate regions, the adequacy or adaptability of many indices in subtropical and tropical environments is still not clear (Boyero et al., 2009). This scenario is justified by the scarcity of studies assessing the efficacy of the many existing indices to the tropical reality (Pasquaud et al., 2013). Therefore, there is a need for robust monitoring tools, especially in developing countries in subtropical and tropical regions, as these areas are more susceptible to human-driven changes in the middle and lower river environments (Wang et al., 2023; Wang et al., 2024).
The assessment of biological indices has been an integral part of water quality monitoring and management programs for many years. However, most worldwide surveys were conducted according to the EUWFD, with fewer evaluation systems constructed based on regional river characteristics (Souza and Vianna, 2020). In particular, although using biological indicators to assess aquatic diversity and identify potential threats is important for rivers under human disturbance, there was no independent evaluation system for rivers in fast-developing Asia, especially in densely populated southeast Asia (Dudgeon, 2000). Therefore, developing robust fish indicators with a complete evaluation process, which includes selecting markable species, giving ecological scores, assessing current status, and diagnosing potential problems, is important for Asian rivers located in the tropics and subtropics (Butchart et al., 2011). Such tools are essential to support the establishment of proper management strategies for the preservation of these ecosystems.
Compared with other biomonitoring objects, fish are more sensitive indicators of water pollution, habitat degradation, migration barriers, and overall ecosystem productivity (Wang et al., 2018b). Our idea is that fish indicators with specific ecological requirements, especially for feeding, spawning/nursing, and migrating, could reflect not only river biodiversity, but also the environmental conditions. Given that an ecosystem assessment should be carried out as simply and effectively as possible, we tried to use a quantitative method based on fish indicators to reflect river ecological status. The core design of our fish-based index is using indicators’ accumulative positive feedback to evaluate river ecological status from the perspective of community biodiversity and food web attributes (e.g., trophic structure and energy flow pattern). The objectives of this study are to 1) select key freshwater fish species with environmental indicative functions along a subtropical river, 2) construct scoring and evaluation criteria that are effective in assessing river ecological status, especially for the river sections disturbed by human activities, and 3) explore the application of fish indicator-based environmental evaluation in biological conservation and river management.
2 Materials and methods
2.1 Study region and sampling sites
The Liuxi River is regarded as the mother river (of high cultural significance) of Guangzhou, the capital city of Guangdong Province in southern China. The study area has a typical subtropical monsoon climate. The mean annual precipitation of the watershed is 1800 mm, mostly occurring in April–September. The Liuxi River watershed (with an area of 2300 km2) is situated in the northeastern corner of the Pearl River Delta, which has experienced rapid development in the last two decades. The watershed spans four county-level districts (Huadu, Luogang, Baiyun, and Conghua), which occupy 70% of the watershed area (Figure 1). The water of the Liuxi River is used for a wide range of purposes, such as drinking water, agriculture, industry, and recreation. However, over the past several decades, the Liuxi River (especially the lower reaches) has experienced rapid agricultural, industrial, and urban development. The water quality and habitat integrity of river ecosystems are disturbed by rapid population growth and associated anthropogenic activities, leading to drastic extraneous interference from humans.
Figure 1
Fish specimens and water samples were collected concurrently from the headwaters to the lower reaches at the 14 sites along the Liuxi River (Figure 1). Site information (e.g., mainstream and tributary locations) and environmental data, including habitat characteristics and physicochemical parameters of water quality, were provided in Supplementary Table S1. Forests are the dominant land use type in the watershed, accounting for 55% of the total area. Approximately 33% of the watershed is used for agriculture, including orchards (20%), paddy rice fields (9%) and vegetable growing areas (4%). The remaining watershed is occupied by built-up areas (9%) and water (3%). The development in the watershed is spatially unbalanced. The upper reaches (sites #1–#4) are covered by dense forests, while agricultural activities are concentrated in the middle reaches (sites #5–#10). The area close to the lower reaches (sites #11–#14) is highly urbanized; in particular, site 13 was located in industrialized area where a large amount of sewage was discharged into the river.
2.2 Fish sampling
Fish samples were collected in 2022 from the headwaters to the lower reaches (sites #1–#14 in Figure 1) along the subtropical Liuxi River during the rainy (June to July) and dry (December) seasons. Each site was sampled two times over a season following the basic guidelines of Barbour et al. (1999) and Hauer and Lamberti (2007). Electrofishing equipment was used to effectively stun and collect fish (individual weight< 10 kg) in a 2 m wide × 2 m long × 3.5 m deep water column. Due to varying water levels, two electrofishing operations were conducted as follows: 1) At wadeable sites, single-pass backpack electrofishing was performed simultaneously by two operators moving in a zig-zag fashion. Electrofishing equipment was adjusted at low voltage and mixed frequency, and the walking speed was controlled to ensure a sampling effort of approximately 8 m2 min-1 over 30 min. 2) At nonwadeable sites, a 6-m-long welded hull boat was used for boat-electrofishing, and a bamboo quant was used to propel the boat to eliminate noise disturbance to fish. Electrofishing equipment was adjusted at a high voltage and main frequency, and the paddling speed was controlled to ensure a sampling effort of approximately 6 m2 min-1. Boat-electrofishing was conducted over a distance of 500 m, spanning both riverbanks at a depth of 1–3 m (Flotemersch et al., 2006). With the help of local fishermen, gill nets (mesh sizes of 10, 20, 30, 40 mm between adjacent nodes, high × long areas of 1.0 m× 60 m, 1.5 m × 100 m, 2.5 m × 150 m, 3.5 m × 200 m) and hoop nets (mesh sizes of 5, 10, 15 mm, volume of 0.25 m high × 0.35 m wide × 10 m long) were used as passive methods to supplement the requisite specimen in cases where the latter was precluded by high depth and large fish sizes.
2.3 Data analysis
All statistical analyses were conducted in R 4.0.5 with the primary packages cluster, factoextra, phyloseq, vegan, microeco, PerformanceAnalytics, and ggplot2. Cluster analysis for grouping spatial zones and scoring items relied on the Bray−Curtis dissimilarities of fish abundance (individual number) and indicators’ ecological properties, respectively. Statistically significant cluster groupings were identified using a bootstrap randomization technique in which the nonzero values were resampled and used to generate pseudovalues of Bray−Curtis dissimilarities under the null hypothesis. A frequency distribution of pseudovalues was generated from 1000 randomizations of the data matrix, and the 95th percentile was used as the critical value to determine between-group significance. Stepwise forward selection was performed to reduce the linearly correlated environmental factors, and the variables showed significant differences in their values.
Linear discriminant analysis effect size (LEfSe) is an algorithm for high-dimensional indicator discovery that identifies taxa by characterizing the differences between two or more biological conditions (Segata et al., 2011). LEfSe emphasizes both statistical significance and biological relevance, allowing researchers to identify discriminative features that are significantly different among biological classes. The nonparametric factorial Kruskal−Wallis sum-rank test is first used to detect features with significant differential abundance with respect to the class of interest. Second, LEfSe uses linear discriminant analysis to estimate the effect size of each differentially abundant feature and rank the feature accordingly (Liu et al., 2021). Spearman’s correlation analysis was used to measure the strength and direction of monotonic association between fish indicator scores and traditional biodiversity indices as well as environmental variables.
3 Results
3.1 Longitudinal variation in fish community structure along the river
One hundred thirteen species belonging to 10 orders, 32 families, and 83 genera were found along the Liuxi River, including 97 native species and 11 alien species (see details in Supplementary Table S2). Seven spatial zones (i.e., zones I to VII shown in Figure 2A) were grouped by clustering analysis based on the individual number of fish assemblages. Sites 1−2 in zone I were located in the headwaters (Figure 2B), where fish assemblages were dominated by Cyprinidae 62.7% (mainly composed of Danioninae 30.2% and Barbinae 24.8%), Gastromyzontidae (18.0%), and Gobiidae (11.6%). Sites 3−4 in zone II were located in the upper mainstream, where fish assemblages were dominated by Cyprinidae 68.6% (mainly composed of Cyprininae 14.2%, Rhodeinae 13.9%, Gobioninae 12.8%, and Culterinae 12.4%), Cichlidae 15.7%, and Cobitidae 9.1%. Sites 6−7 in zone III were located in the midstream tributaries, where fish assemblages were dominated by Cyprinidae 75.2% (mainly composed of Gobioninae 32.7% and Danioninae 31.4%), Cobitidae (8.1%), and Gobiidae (8.0%). Zone IV included mainstream site 5 and tributary sites 9−10, where fish assemblages were dominated by Cyprinidae 68.1% (mainly composed of Danioninae 28.7%, Gobioninae 11.0%, and Rhodeinae 8.9%), Gobiidae (13.7%), and Cobitidae (7.0%). Sites 8 and 11 in Zone V were located in the middle-lower mainstream, where fish assemblages were dominated by Cyprinidae 61.9% (mainly composed of Culterinae 23.0%, Labeoninae 8.2%, Cyprininae 6.5%, and Xenocyprininae 6.4%) and Cichlidae 18.4%. Sites 12 and 14 in Zone VI were located in the lower mainstream, where brackish fishes appeared and fish assemblages were dominated by Cyprinidae 54.5% (mainly composed of Culterinae 25.3% and Labeoninae 22.1%), Cichlidae 17.2%, Loricariidae 6.7%, and Engraulidae 5.8%. Site 13 in Zone VII was located in the downstream polluted tributary, where fish assemblages were dominated by Cichlidae 52.6%, Loricariidae 26.3%, and Clariidae 10.5%.
Figure 2
3.2 Selecting indicators from fish community by LEfSe method
The differences in spatial distribution of fishes in the Liuxi River are mainly reflected at the genus and species levels (Figure 3), suggesting that genus- and species-level indicators were effective in distinguishing fish assemblages in each zone. The difference at the family level was lower than that at the genus level because Cyprinidae contained more species than other families. LEfSe analysis results showed that the fish assemblages in Zone I were marked by Balitoridae, those in Zone III were marked by Cobitidae, those in Zone IV were marked by Cyprinidae, those in Zone V were marked by Mastacembelidae, those in Zone VI were marked by Engraulidae, and those in Zone VII were marked by Loricariidae. There were no family-level fish indicators in Zone II. At the genus and species levels, a total of 4 genera and 30 species were selected by LEfSe, including Pseudogastromyzon changtingensis, Vanmanenia (V. pingchowensis and V. gymnetrus), Acrossocheilus parallens, and Zacco platypus in Zone I; Rhodeus sinensis, Rasbora steineri, Hemiculter leucisculus, Acheilognathus barbatulus, Cobitis (C. sinensis and C. arenae), Channa maculata, and Pelteobagrus (P. fulvidraco, P. intermedius, and P. vachelli) in Zone II; Pseudogobio vaillanti, Microphysogobio (M. kiatingensis and M. fukiensi), Sarcocheilichthys nigripinnis, Opsariichthys bidens, Abbottina rivularis, Micronemacheilus pulcher, Rhinogobius giurinus, and Glyptothorax fokiensis in Zone III; Cirrhinus molitorella, Squalidus argentatus, and Hemibagrus guttatus in Zone IV; Culter alburnus, Parabramis pekinensis, Hemibarbus medius, Xenocypris davidi, Schistura fasciolatus, Mastacembelus armatus, and Silurus asotus in Zone V; Hypophthalmichthys molitrix, Ctenopharyngodon idella, and Coilia grayi in Zone VI; and Coptodon zillii and Hypostomus plecostomus in Zone VII.
Figure 3
3.3 Assigning scores to fish indicators based on their ecological properties
The core design of our fish-based index is to use indicators’ accumulative positive feedback to evaluate river ecological status and food web attributes (e.g., trophic structure, transfer efficiency, and network connectance). To assess the positive feedback of each fish indicator to local environment (i.e., environmentally indicative function), 6 focuses were set up for the evaluation criteria (see details in Supplementary Table S3): 1) prioritize rare, endangered, and protected species; 2) rheophilic species with specific feeding and spawning/nursing requirements for habitats (e.g., pristine floodplains and riparian zones), substrate types (e.g., pebble, grave, and sand), and flow regimes (e.g., riffles, pools, and runs); 3) migratory species that can indicate both lateral and longitudinal river connectivity; 4) keystone species occupying different trophic levels, which reflect the integrity and diversity of local food web; 5) top predators at high trophic levels since most of them have a long life history and are exposed to multiple stressors (e.g., water pollution, habitat degradation, and overfishing); and (6) alien species with strong tolerance (e.g., Cichlidae and Loricariidae in zone VII) are assigned a score of 0 due to their negative impacts on native aquatic communities. On this basis, the final evaluation score of each fish indicator was calculated as positive feedback level × trophic level, where positive feedback level = feeding score + spawning/nursing score +migrating score + keystone store + endangered/protected score (see scoring diagram in Figure 4).
Figure 4
Table 1
| No. | Fish indicator | Food resources | Environmental functioning | Trophic functioning | Score | |
|---|---|---|---|---|---|---|
| Target species | Alternative species | |||||
| 1 | 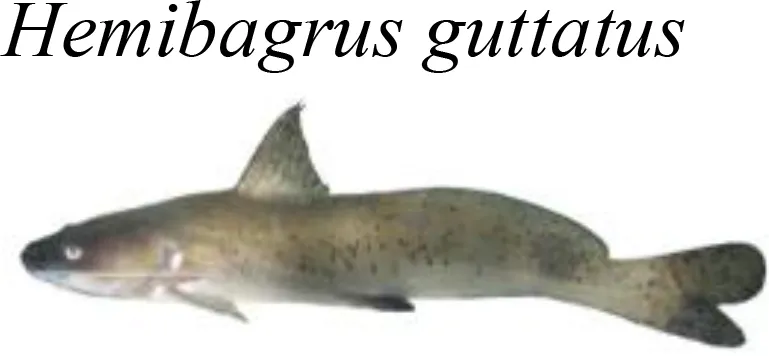 | 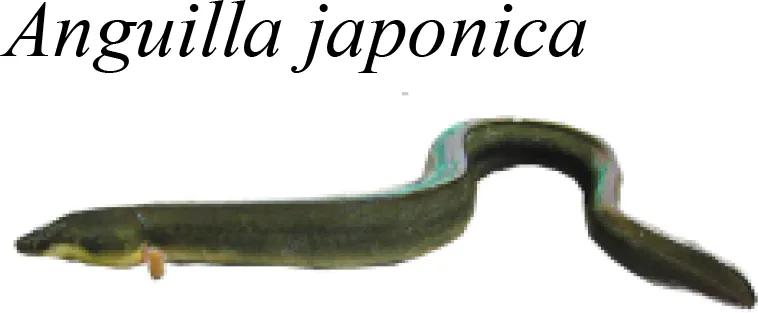 | Feed on aquatic insect larvae, crustaceans, and small- or medium-sized fish. | As migratory or semimigratory fish, these two species rely heavily on hydrological connectivity and habitat integrity along the migration channel. | M. guttatus is a national protected species and A. japonica is on the red list of endangered species. Their adults are benthic top predators in local food chains and indicate an integrated local food web structure. | 17.95–18.90 |
| 2 | 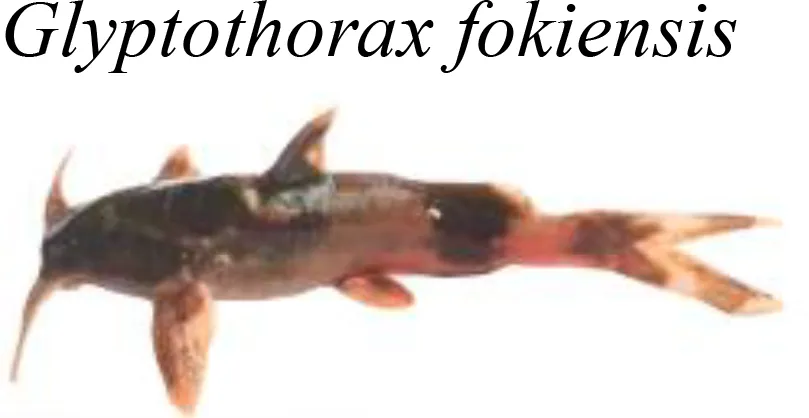 | 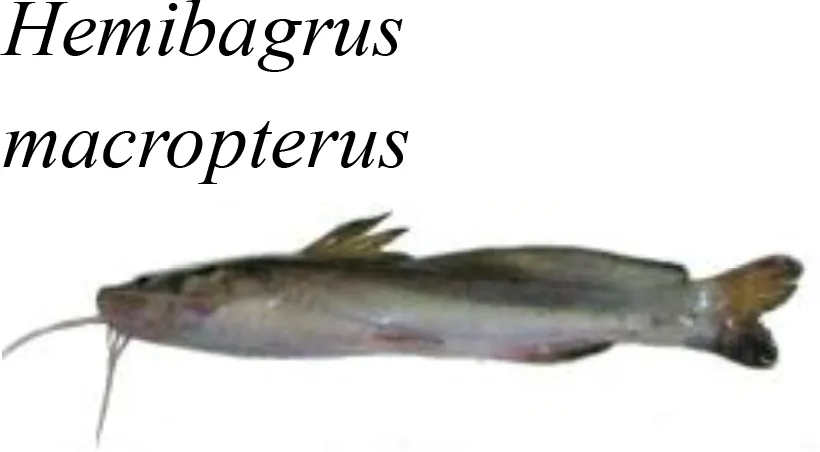 | Feed on aquatic insect larvae (mainly Ephemeroptera) and other small invertebrates. | Indicators of running water habitats with pebbles and bedrock; require high quality water and substrate environments in spawning grounds. | Require high density and diversity of benthic invertebrates due to their large consumption of food resources; indicate a typical invertivorous food chain. | 15.70–15.85 |
| 3 | 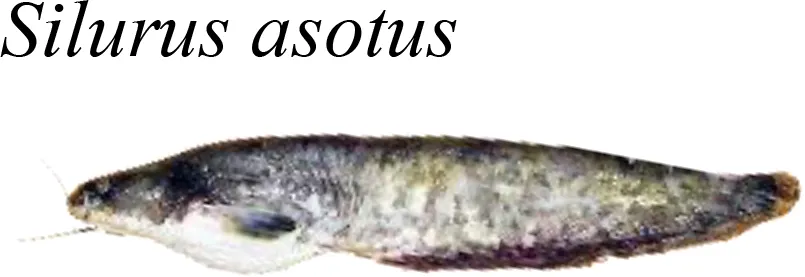 | 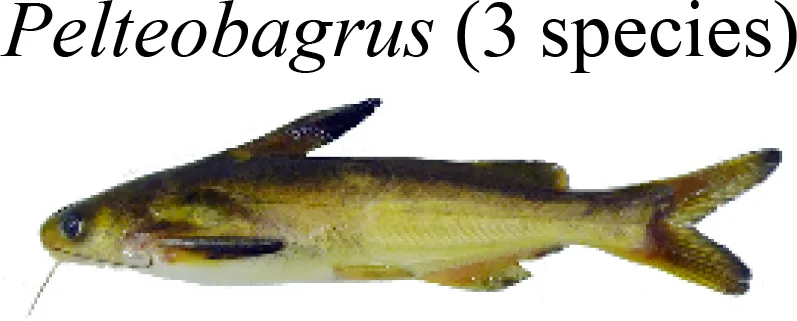 | Juveniles feed on small aquatic insect larvae and Caridina, while adults prey on Macrobrachium and insectivorous fish (e.g., Gobiidae, Cobitidae, and Nemacheilidae). | Indicators of clean running water and habitat with deep pools and submerged vegetation; prefer substrates with large pebbles and littoral bedrocks. | Benthic carnivorous fish at the top trophic level in the stream; indicate an integrated food web composed of insectivorous and periphytivorous food chains; improve the energy transfer from low to high trophic levels of the food web. | 11.01–11.13 |
| 4 | 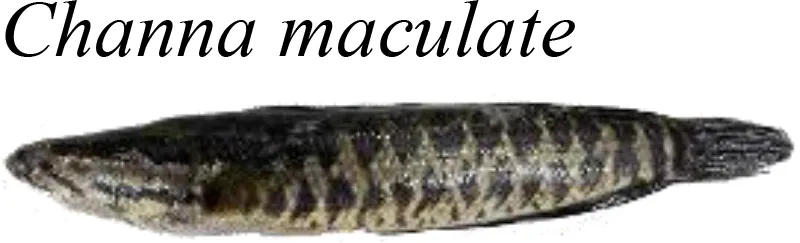 | 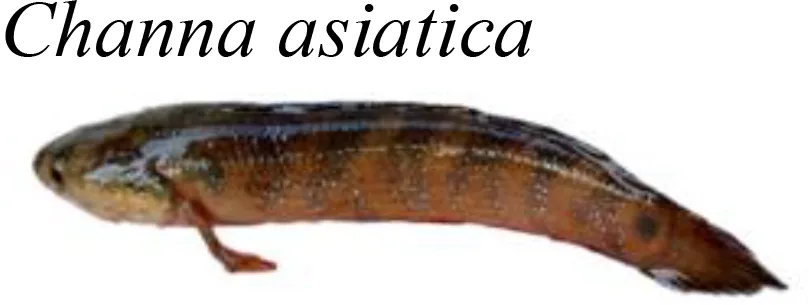 | 10.41–10.71 | |||
| 5 | 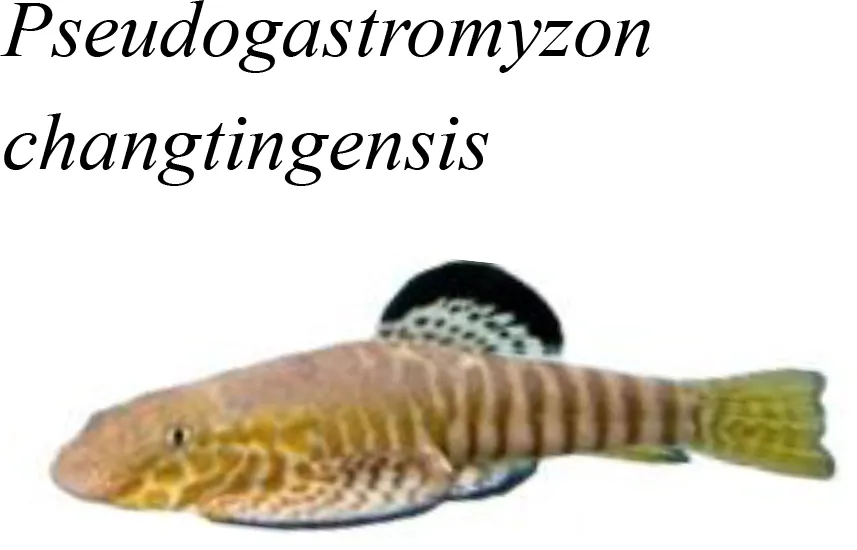 | 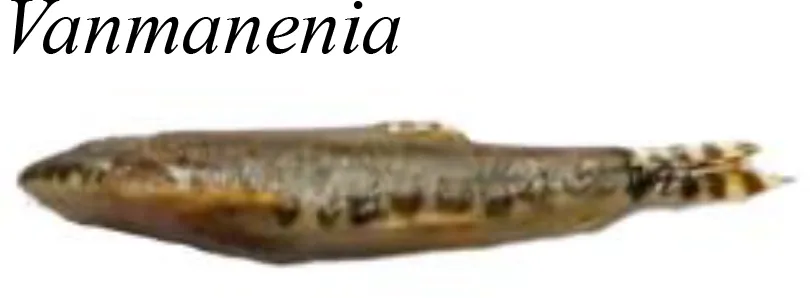 | Scrape-feed on biofilms dominated by epilithic diatoms. | The distribution range is narrow and only present in the upstream mountain streams; indicate high water quality and habitat with rapids and pebbles. | Require high abundance and diversity of epilithic diatoms; indicate a typical periphytivorous food chain. | 8.88–8.96 |
| 6 | 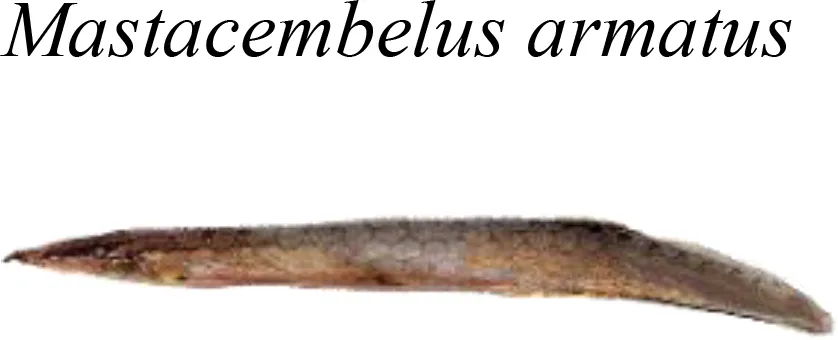 | 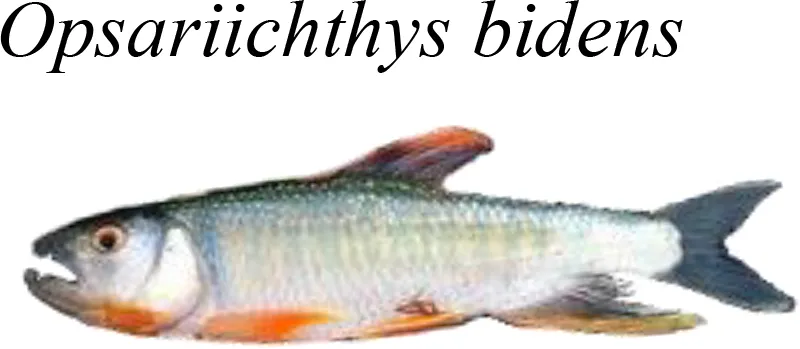 | Feed on aquatic insect larvae (Ephemeroptera and Odonata), Caridina, Macrobrachium, and small insectivorous fish. O. bidens prefer to eat terrestrial insects like locusts. | Indicators of running waters with riffles and vegetated riparian zones. Their populations are dense in submerged hydrophyte zones. | At high trophic levels of the stream food web; their appearance with other carnivorous fish indicates that the aquatic biodiversity in the river section is high and the food web structure is integrated. | 10.00-10.08 |
| 7 | 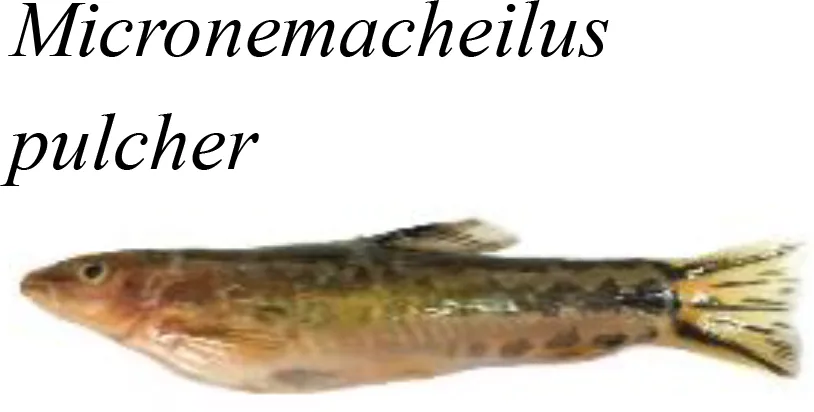 | 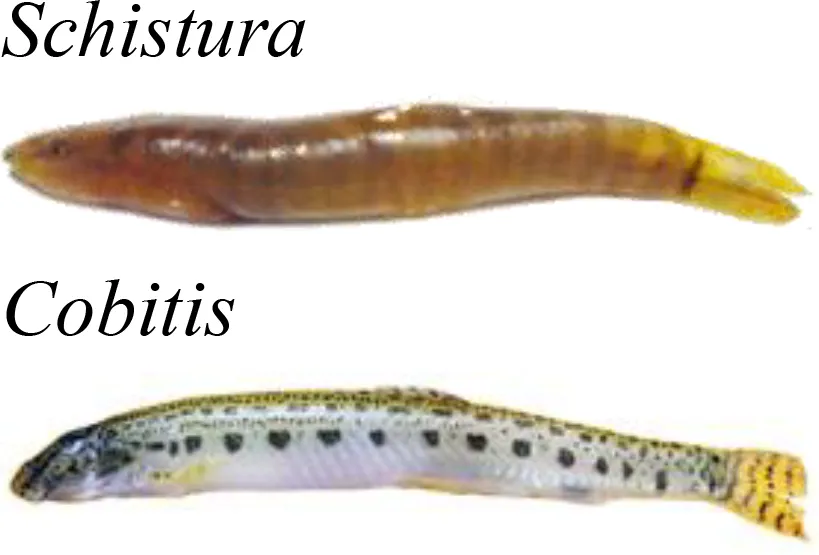 | Feed on small aquatic insect larvae, mainly Diptera and Ephemeroptera (Baetidae and Heptageniidae), and plant debris. | Distributed in streams with pebbles, coarse sandy substrate, and abundant riparian vegetation; require good water quality. | Indicators of insectivorous food chains; they are also the food resources for carnivorous fish like Silurus asotus and Channa maculate. | 5.70–5.76 |
| 8 | 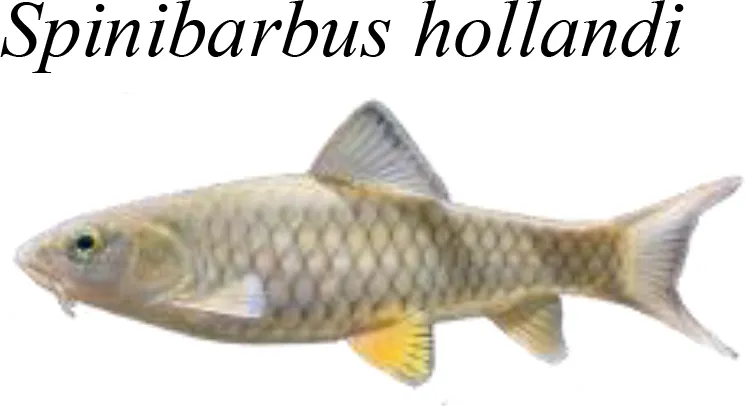 | 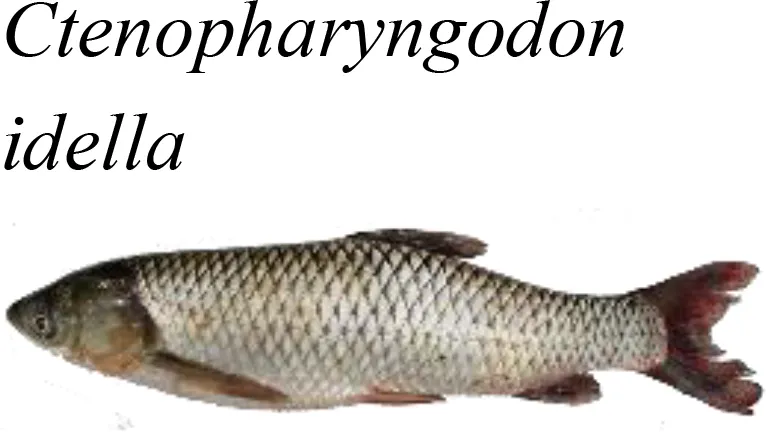 | Graze on submerged hydrophytes and plant detritus; migrate but the migration path is not long (from stream to lake). | Indicators of flowing water habitats with good water quality and littoral zones rich in submerged hydrophytes. | One of the few fish in tropical and subtropical rivers that eat aquatic plants; indicators of a grazing food chain that is a particular energy transmission pathway. | 7.71–7.80 |
| 9 | 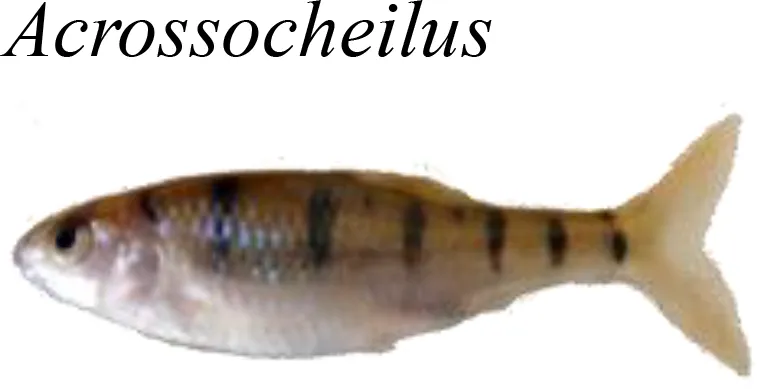 | 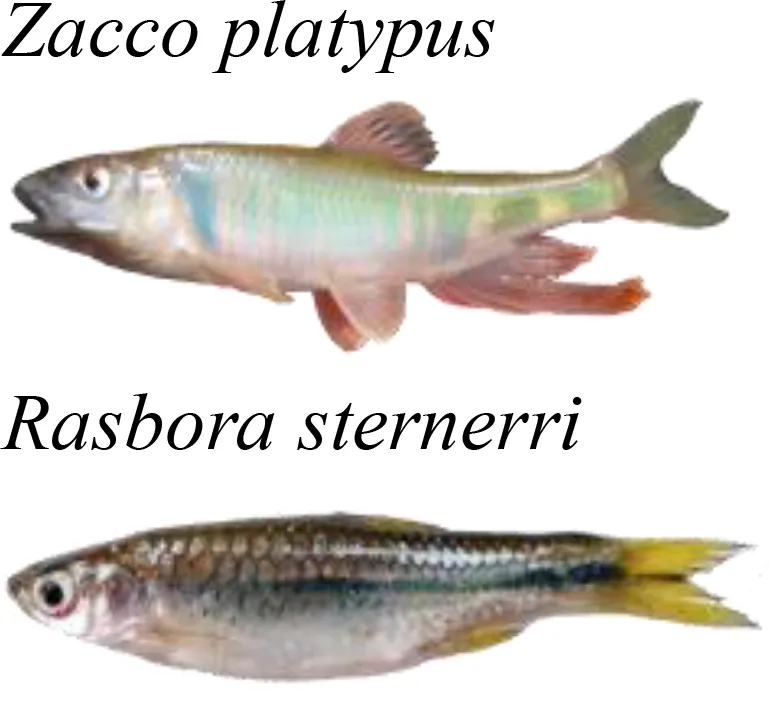 | Feed on epilithic diatoms, chironomids, and soft-shelled mollusks (e.g., Planorbis and Physa). | Usually live together with O. bidens and R. giurinus. Indicators of high water quality and habitats with submerged Hydrilla verticillata and Vallisneria spirals. | Indicators of periphytivorous, insectivorous, and omnivorous food chains; some of the few fish species in upper streams that eat soft-shelled mollusks. | 8.25–8.37 |
| 10 | 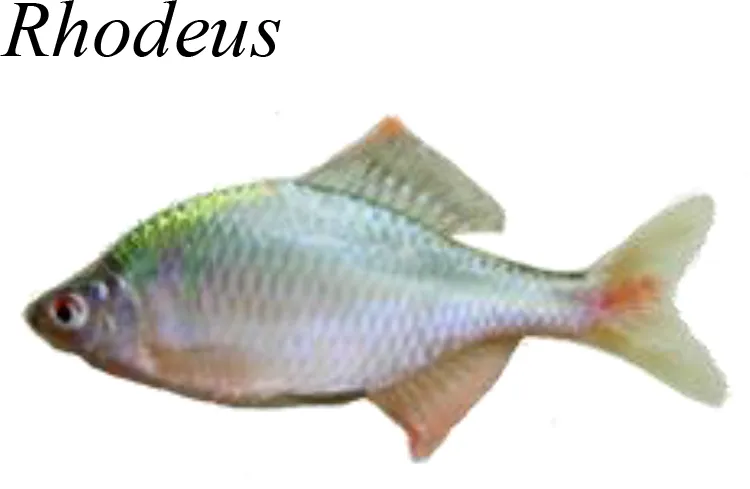 | 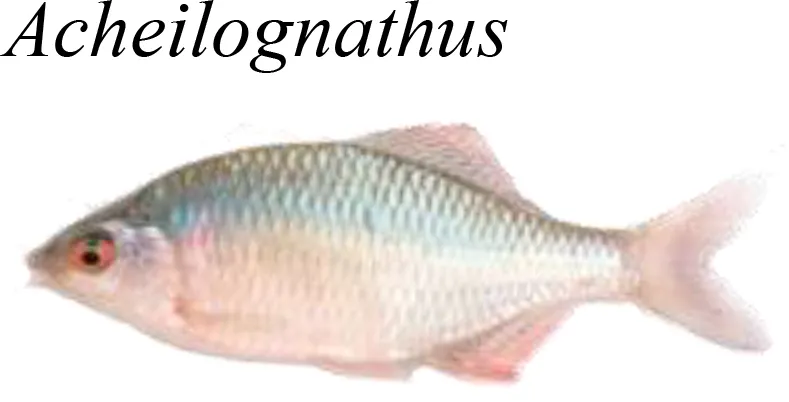 | Feed on diatom-dominated biofilms, plant debris, and some aquatic insect larvae (mainly Diptera). | Widely distributed in streams; not high requirements on water quality; indicators of substrates with coarse sand and some aquatic plants. | Stronger indicators of function than nutrition in the environment because their reproduction process relies on filter-feeding bivalves; and thus, they comprehensively reflect the “fish-bivalve” symbiotic conditions. | 7.44–7.53 |
| 11 | 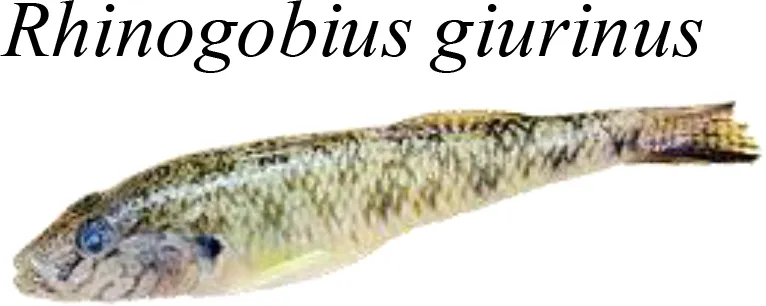 | 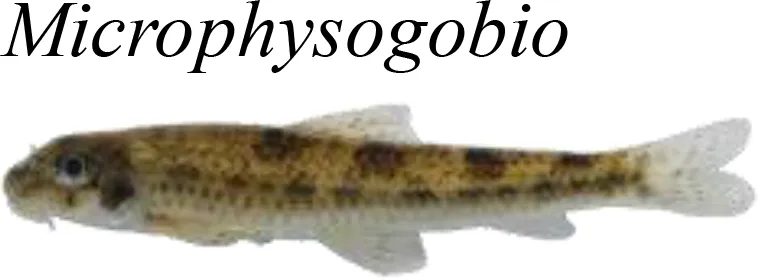 | Feed on a large number of aquatic invertebrates, especially insect larvae, and a few soft-shelled mollusk species. | Widely distributed in streams; do not have strong water quality requirements; weak environmental indicators, but important trophic indicators. | Occupy important node in predator‒prey links since they are both prey for carnivores and predators to invertebrates; exert “top-down” and “bottom-up” control effects in food web. | 5.14–5.18 |
| 12 | 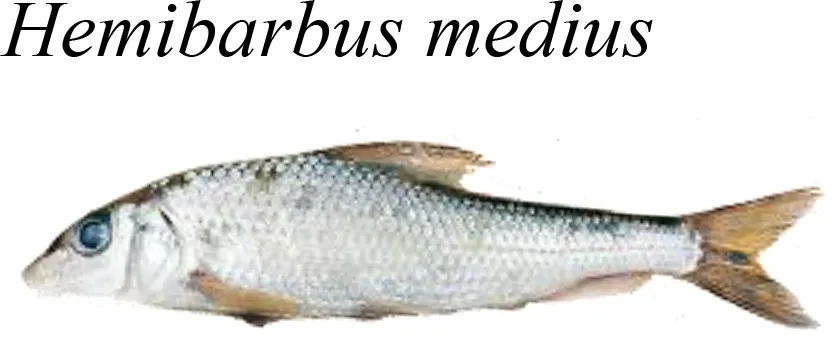 | 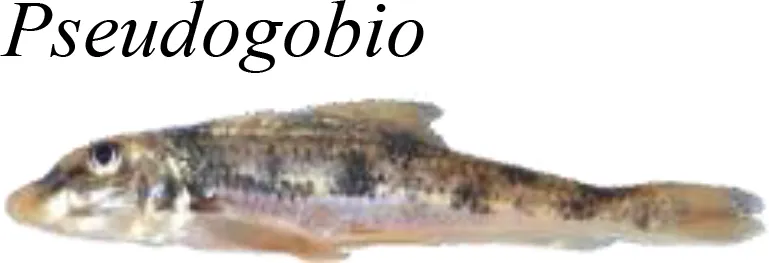 | Disturb river sediment to capture various aquatic invertebrates, such as insect larvae, mollusks and annelids; they also eat some plant detritus. | The dissolved oxygen at the river bottom must be sufficient to support a large number of benthic invertebrates; indicators of water environments with superior substrate conditions. | Trophic indicators similar to R. giurinus; they are prey for carnivores and prey on various benthic invertebrates; play important roles in maintaining energy flows from trophic level II to trophic levels III – IV. | 9.81–9.87 |
| 13 | 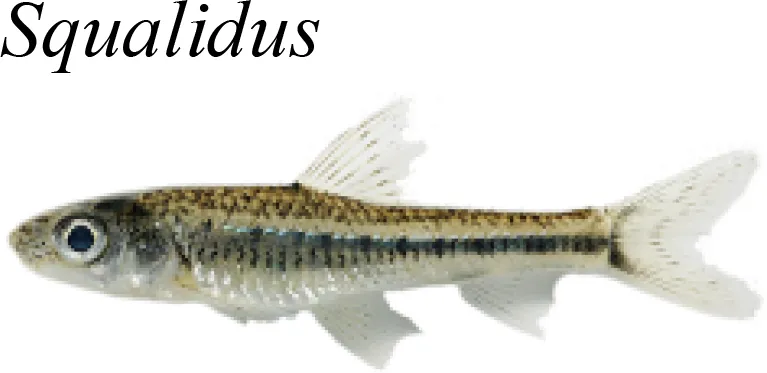 | 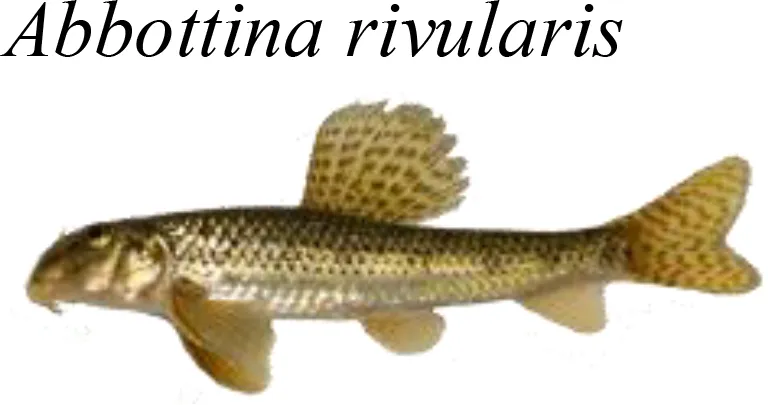 | 6.96–7.05 | |||
| 14 | 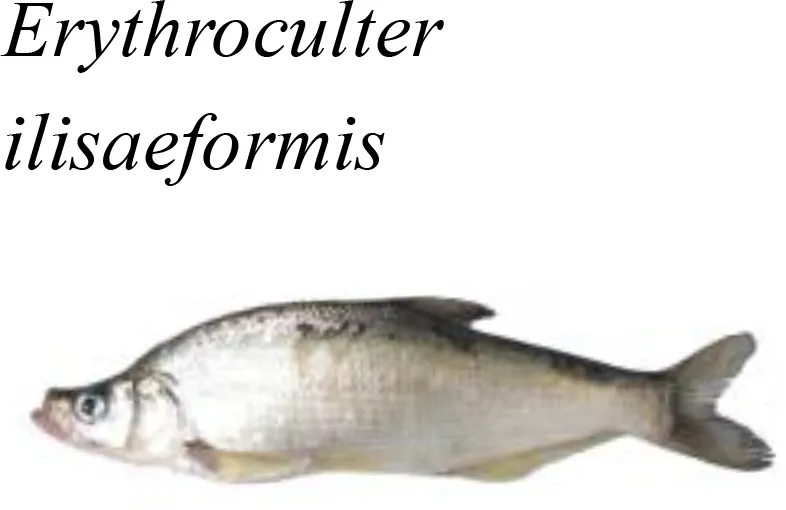 | 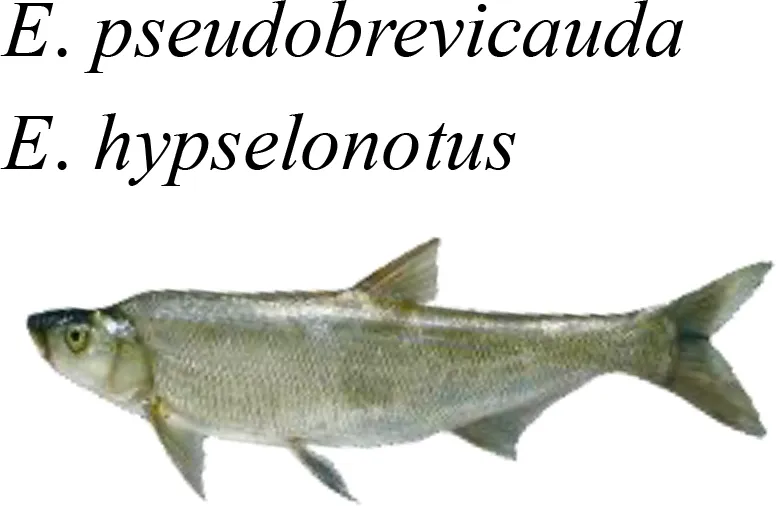 | Prey on Macrobrachium, odonate larvae, small fish, as well as grasshoppers and earthworms that fall into the water. | Indicators of deep water levels and good water quality; they need spawning ground with flowing water sources and integrated riparian zones. | Some of the few freshwater carnivorous fish that live in the middle-upper water layer; they require abundant fish and shrimp in feeding areas. | 6.20–6.28 |
| 15 | 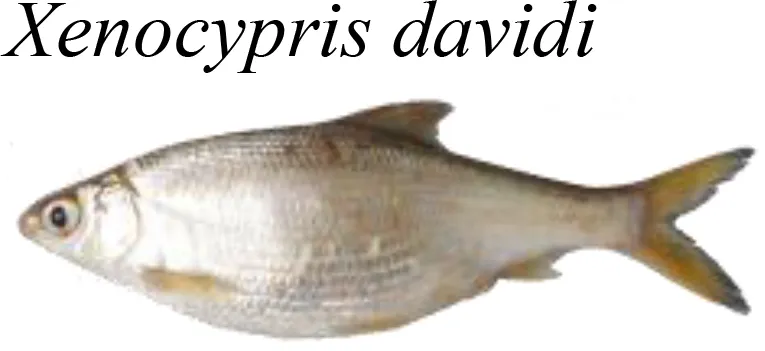 | 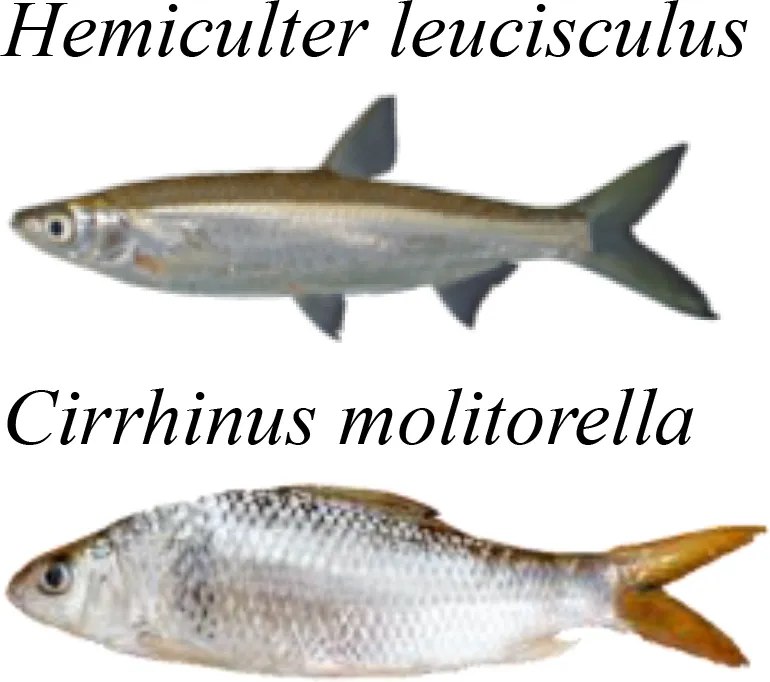 | Feed on plant debris, sedimentary organic matter, and demersal algae (mainly Diatom and Oscillatoria). | Indicators of a slow-flowing area, deep water level, and sandy substrate; they reproduce on riffles, sandbars, and aquatic plants. | Consume large amounts of detritus, indicating a detritivorous food chain; they play important roles in the energy recycling from detrital pool to high trophic levels in the food web. | 2.16–2.20 |
| 16 | 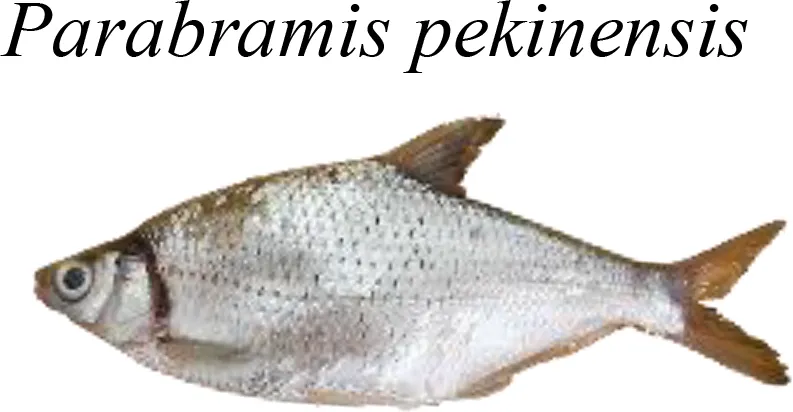 | 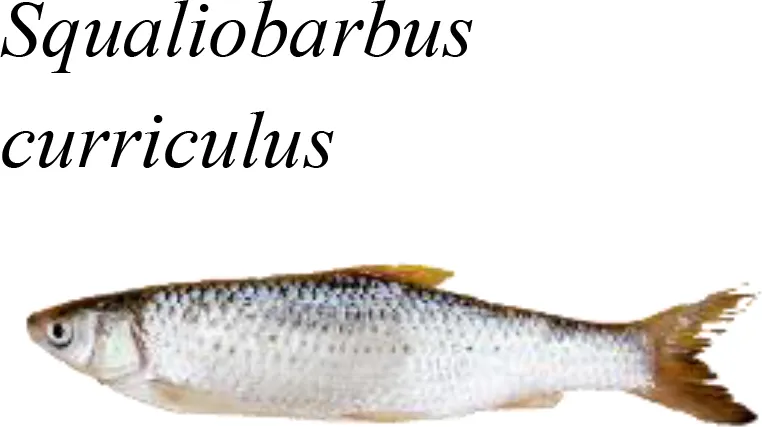 | Consume large amounts of bivalve larvae (Corbicula fluminea and Limnoperna lacustris), plant debris, and sedimentary organic matter. | Indicators of deep water levels in the middle and lower reaches and slow-flowing water areas with sediment mixed by silt and sand; they spawn in open water areas with littoral zones. | One of the few indicators of a molluscivorous food chain, which is an important energy pathway for trophic levels II to III. | 5.54–5.62 |
| 17 | 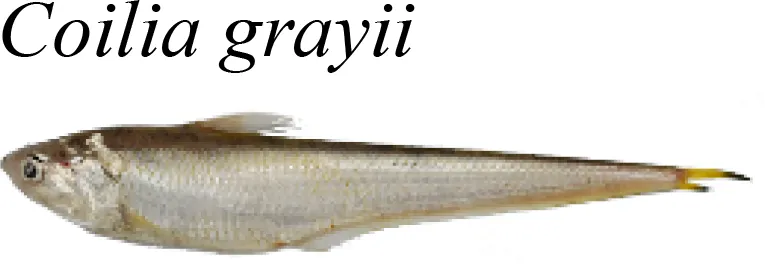 | 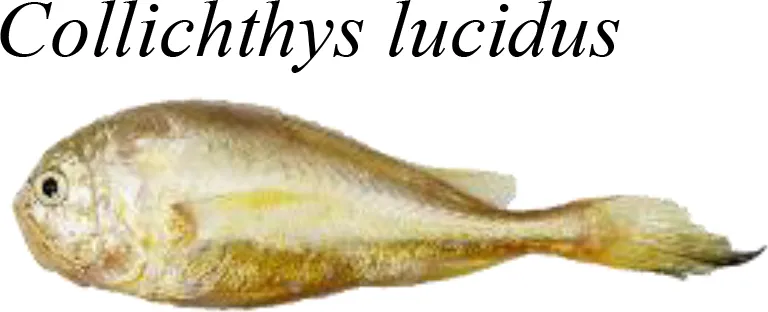 | Juveniles feed on zooplankton, while adults prey on pelagic crustaceans and small fish. | Indicators of an estuarine environment, such as increased salinity, water depth, channel width, and electrical conductivity. | As top predators in brackish waters, they are indicators of pelagic carnivorous food chains near the river mouth. | 3.30–3.37 |
| 18 | 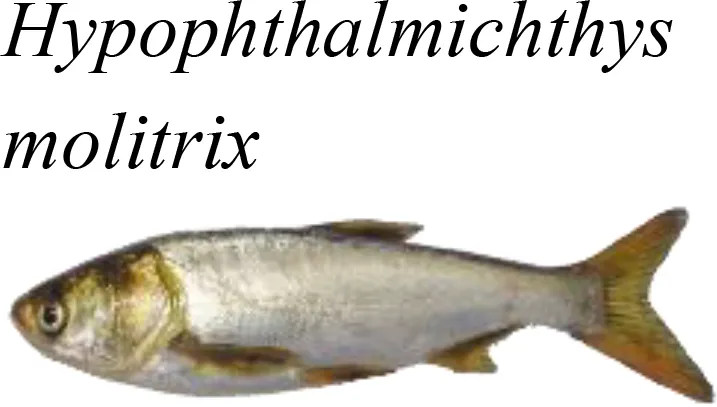 | 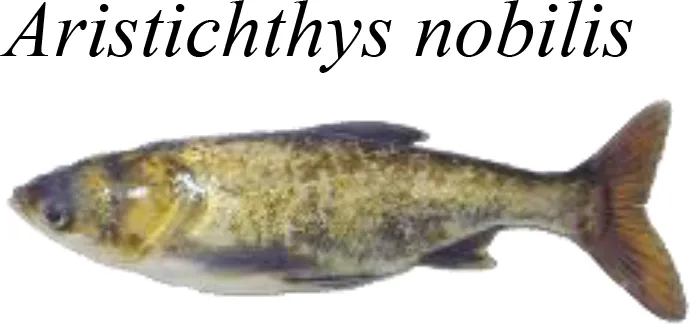 | Filter-feed on phyto-/zooplankton and suspended particulate matter. | Indicators of open and deep water bodies with slow-flowing or lentic areas; they semimigrate between river and lake. | Indicators of planktivorous food chains, which are important energy pathways from primary producers to consumers in river and lake food webs. | 2.32–2.35 |
| 19 | 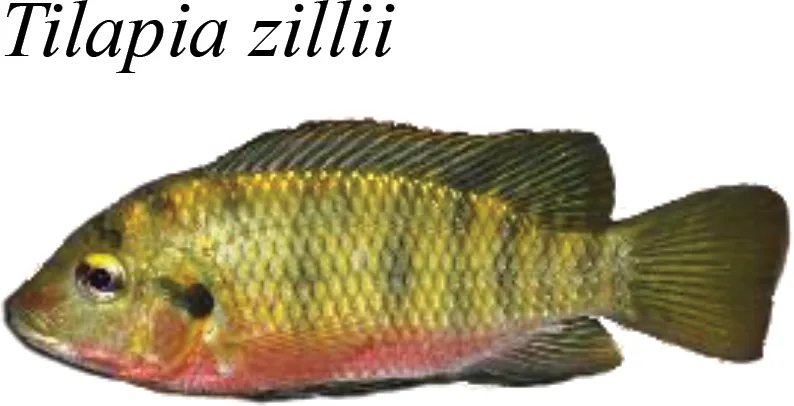 | 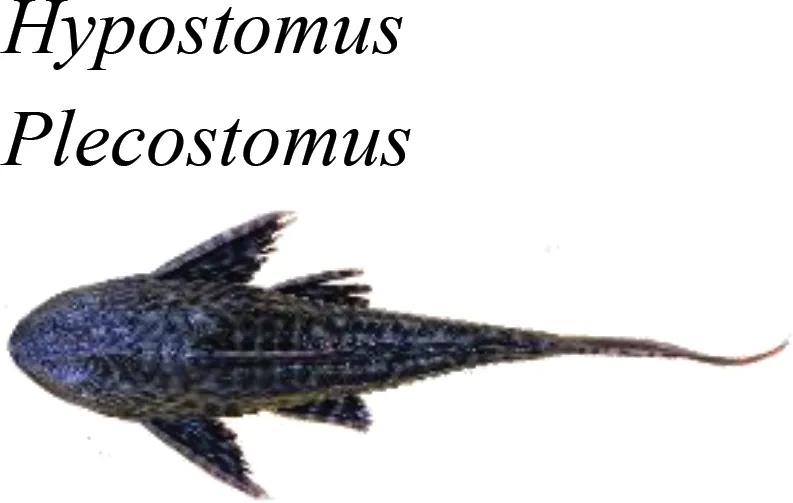 | Consume large amounts of organic detritus and periphyton; pose threats to native fish due to their encroachment on ecological (e.g., feeding and spawning) niches | Dominant alien species with higher tolerance than native species; poor indicative effects on environment since they can survive in polluted water and degraded habitats. | Extremely high biomass in tropical and subtropical rivers of China; their fast growth with few natural enemy leads to the population explosion and redundant energy flows in trophic level II; negative impacts on local food web. | 0 |
Evaluation score items of fish indicators based on their requirements for food resources, living environment, and trophic roles in the food web of Liuxi River.
For the composition of fish food resources, please refer to the research results of Wang et al. (2018a) on the feeding habits of fish in tropical and subtropical rivers in southern China. Small aquatic insect larvae refer to aquatic insect larvae except for the larvae of dragonflies of the suborder Anoptera, mainly of the order Diptera and Ephemera. The trophic functioning is based on the research results of Wang et al. (2018b) using the Ecopath with Ecosim model to study the structure and function of food webs in tropical and subtropical rivers.
3.4 Positive feedback of fish indicators to river environment
To clarify the environmentally indicative function, thirty-four fish indicators were clustered into 19 ecological patterns (Figure 5) according to their scores for environmental evaluation. Fish indicators with evaluation scores of 5 – 8 have two characteristics: 1) they are widely distributed and able to swim across lotic and lentic water bodies (e.g., from river to reservoir), such as Culter recurviceps and Z. platypus, and 2) they have a certain tolerance to the degradation of water and habitat, such as Rhodeus sinensis and Rhinogobius giurinus (Table 2). Fish indicators with scores > 10 were benthic top predators at high trophic levels (e.g., S. asotus, C. maculata, and Pelteobagrus), the appearance of which could indicate a long food chain and integrated food web. In particular, the native protected species (e.g., H. guttatus) and endangered species on the red list (e.g., Anguilla japonica) are not only species protected by the state but also important migratory species that indicate ‘stream – lake’ or ‘river − estuary’ connectivity; thus, they obtained the highest score of 15 – 19. Fish indicators with scores< 3 were those at low trophic levels and indicated short food chains, such as filter-feeding H. molitrix and scrape-feeding C. molitorella. C. zillii and H. plecostomus are dominant alien species in the tropics and subtropics of China (Wang et al., 2019), which compete with native species for limited resources. Given that fish species belonging to the same genus or subfamily commonly have analogous ecological characteristics and exhibit consistency in environmentally indicative functions, it is necessary to provide alternative species as candidates for the 34 target indicators, which not only enriches the evaluation system, but also facilitates field monitoring efficiency (see eight alternative species in Table 2).
Figure 5
Table 2
| IFIQ | IFIN | IFIB | Environmental status and food web attributes reflected by fish indicators' requirements for feeding, spawning, and migrating |
|---|---|---|---|
| 0–45 | 0–1.75 | 0–1.90 | There are no or only a few fish indicators in polluted or highly disturbed environments (e.g., engineering construction areas or restored river channels), where only exotic species like the strongly tolerant Cichlidae and Loricariidae can survive. The diversity of the local ecosystem and the level of development are extremely low. Except for a detritivorous food chain composed of invasive species, there is almost no food chain or food web. |
| 46–90 | 1.76–3.50 | 1.91–3.80 | There are some fish indicators in disturbed environments (e.g., urban areas with degraded riparian habitats), where the water might be polluted by domestic sewage with a high phosphorus concentration. The diversity of the local ecosystem is low and the level of development is in the middle-low stage. The food chain is short, and the food web structure is broken. |
| 91–135 | 3.51–5.25 | 3.81–5.70 | There are a certain amount of fish indicators in less disturbed environments (e.g., rural areas with agriculturalized riparian habitats), where the water might be polluted by aquaculture wastewater with a high nitrogen concentration. The diversity of the local ecosystem is moderate and the level of development is in the middle stage. The food chain is medium-length, and the food web structure is simple. |
| 136–180 | 5.26–7.00 | 5.71–7.60 | The number of fish indicators is high in streams located in remote areas. Human disturbance comes from nearby small villages. The water quality is high. There are riffle and pool habitats, pebble and gravel substrates, and integrated riparian zones. The diversity of the local ecosystem and the level of development are high. There should be piscivorous or carnivorous fish as top predators in the food web. |
| > 180 | > 7.00 | > 7.60 | There are abundant fish indicators in pristine environments (e.g., untraversed mountain streams). Both the water and habitat quality are high. There should be a certain amount of periphytivorous, insectivorous, and carnivorous fish that form the complex trophic network of the local food web. The diversity of the local ecosystem, the level of development, and the energy transfer efficiency measured by the Lindeman spine are high. |
The criteria for environmental evaluation based on the index of fish indicator (IFI) scores. IFIQ, qualitative IFI; IFIN, IFI weighted by fish individual number; IFIB, IFI weighted by fish biomass.
3.5 Constructing an evaluation system with fish indicators’ scores
According to the principle of ‘simple, quick, precise, and practical’, we proposed an index of fish indicator (IFI) to evaluate local environment based on the abovementioned scoring criteria. The evaluation on local environment was based on the accumulation of each fish indicator’s positive feedback to local environment. Thus, the higher the final indicator-based assessment score, the better the local environmental quality. Equations (1–3) were developed and compared to optimize the evaluation effects, including a qualitative method using indicators’ species abundance and two quantitative methods weighted by indicators’ individual number and biomass:
At a sampling site, IFI is the fish indicator-based environmental evaluation score. Ei and ni are the assigned ecological score (see Table 2 and Supplementary Table S3) and individual number of a single fish indicator i (i = 1 ~ m), respectively. N is the total individual number of sampled fish, including indicator and non-indicator species. IFIQis a qualitative index that equals the sum of the Ei value of each fish indicator species. IFIN and IFIB were two quantitative indexes, which were weighted by the relative contribution of fish indicators’ individual number (i.e., ) and by the relative contribution of fish indicators’ individual biomass (i.e., ), respectively. For example, if the number of fish indicators appearing at the sampling site is m, IFIN = + +… + . After calculating the IFI, the criteria for evaluating local environment from a perspective of food web properties, e.g., predator-prey linkages, food chain length, and energy flows in trophic network, were explored in Table 1.
3.6 Evaluation effects of IFI associated with environmental factors
Compared with the qualitative IFIQ, IFIN and IFIB weighted by individual number and biomass could more notably distinguished the ecological status between upstream and downstream as well as between tributary and mainstream (Figure 6). Generally, the environmental evaluation results showed higher scores in upper stream than in lower river and in tributaries than in mainstream. The highest evaluation scores of IFIN and IFIB were recorded at tributary sites #1–#2 and #6, whereas the highest evaluation scores of IFIQ were recorded at mainstream sites #3–#5. Evaluation score at site #13 was 0 since there was no indicator species with positive feedback. Spearman correlation coefficients between IFI and traditional ecological indices (e.g., Shannon‒Wiener diversity of fish community and benthic index of biotic integrity) as well as environmental factors were calculated to evaluate the practical application effect of IFI (Figure 7). The results showed that IFIQ, IFIN and IFIBexhibited significantly (p< 0.05) positive correlations with elevation (m), dissolved oxygen (mg/L), flow velocity (cm/s), Shannon‒Wiener diversity, and benthic index of biotic integrity and significantly negative correlations with total nitrogen (mg/L), NH3-N (mg/L), and electronic conductivity (μS/cm). Generally, IFI calculated by a concise scoring formula could comprehensively reflect the relationships between biological properties and environmental conditions. Among the three indices, IFIB exhibited the best performance — significantly correlated with most biotic and environmental factors. Compared with IFIQ and IFIN, the greatest advantage of IFIB is its reasonable accounts for the composition of fish communities, especially for carnivorous and herbivorous fishes with large body sizes.
Figure 6
Figure 7
4 Discussion
4.1 Spatial distribution of fish indicators and their feedback to local environment
In the longitudinal gradient, the 34 fish indicators selected along the Liuxi River could reflect not only the aquatic fauna diversity and community structure but also the basic structure of river food web (e.g., predator-prey linkages and trophic energy flows). Moreover, the indicator-based evaluation scores could notably distinguished the differences in ecological status along the upper, middle, and lower reaches as well as the differences between the mainstream and tributaries (Petry and Schulz, 2006). For example, fish in zones I and III (e.g., Danioninae and Barbinae) indicated wadable mountain headwaters that had higher elevation and lower water temperature than zones located in downstream plains (Wang et al., 2018b). In a subtropical monsoon climate, perennial rainfall, fast flowing velocity, high dissolved oxygen, and scattered riffle and pebble substrates provide favorable conditions for benthic algae and invertebrates (Dudgeon, 2008). These food resources are the main energy supply for periphytivorous and insectivorous food chains, which could be indicated by rheophilic Vanmanenia, O. bidens, Z. platypus, and M. pulcher.
Rheophilic species in small streams are vulnerable to human disturbance, especially for those in rural areas with developed tourism (e.g., agritainment) and intensive livestock breeding (e.g., duck industry) (Wang et al., 2020a). For example, although the water quality at sites #7 and #9 were as good as headwaters #1 and #2, the original pebble-strewn substrates with coarse sand in midstream tributaries are illegally extracted or buried during agricultural land expansions (Lasne et al., 2007). The reduction in pebble coverage area led to the homogenization of the substrate type, leading to the loss of Nemacheilidae (Micronemacheilus and Schistura) and Botiidae feeding on aquatic insects and Gobioninae (Hemibarbus and Pseudogobio) hidden under sand (Wang et al., 2018a, b). Vanmanenia and Rhinogobius, which crawl on pebble surfaces, were also threatened. Moreover, because Rhinogobius are important food resources for carnivorous fish, their population decrease had negative impacts on top predators (e.g., S. asotus and C. maculata), thus affecting the whole food web through trophic cascading (Wang et al., 2019). This is the reason why evaluation scores for sites #7 and #9 were much lower than for sites #1 and #2.
At mainstream sites #11 and #12 with low evaluation scores, the subfluvial pebbles were removed or buried due to channel reconstruction, and some were piled up on the bank for the manufactured landscape. In addition, tributaries in the lower urban reach have been subjected to severe anthropogenic modification (Wang et al., 2021). The reinforced bank led to a separation between the riparian zone and river channel, which destroyed the aquatic vegetation that was necessary for fish reproduction (Sosa-López et al., 2005). In particular, due to the discharge of domestic sewage, extremely high CODMn and low DO were recorded at tributary site #13 in zone VII, where only invasive alien species (e.g., C. zillii, H. plecostomus, and Pangasius sutchi) resistant to pollution survived, with no native fish indicators observed. The spawning process of H. guttatus and A. japonica requires a certain migration distance, which is totally dependent on hydrologic and hydrodynamic connectivity (Petry and Schulz, 2006). However, water conservancy projects destroyed the original fluvial morphology and obstructed the migratory route, leading to a decline in migratory fish stocks (Southerland et al., 2007).
4.2 The advantages of constructing scoring criteria for environmental evaluation
The purpose of constructing this scoring system is to overcome some deficiencies of traditional ecological indices, such as Shannon‒Wiener diversity and the fish index of biotic integrity (Souza and Vianna, 2020). In terms of calculation, traditional indices often underestimate the environmental conditions in upstream tributaries, where the diversity of the fish community is low but water quality and habitat integrity are quite high (Carignan and Villard, 2002). For example, in headwater zone I, fish species richness was limited by harsh physical conditions (e.g., high velocity and shallow water); however, local environment remained pristine since there was little external interference (Wang et al., 2018b). Thus, the environmental evaluation results for zone I should be high, which used to be underestimated by traditional ecological indices (Bal et al., 2018). The advantage of our scoring and evaluation system is to imbue ecological significance (e.g., fishes’ living requirements) to mathematical statistics, through which abiotic conditions can be indicated by biotic feedback (Wang et al., 2023). Such a scoring method can be modified to meet the evaluation needs of various rivers and in different scales (e.g., regional, provincial, or national).
The successive presence of upstream fish indicators feeding on aquatic insects, periphyton, and gastropods; midstream indicators feeding on hydrophytes, bivalves, odonate larvae, shrimp, and fish; and downstream indicators feeding on plankton, polychaetes, crabs, and seaweeds are three key processes accounting for the spatial distribution of fish assemblages (Wang et al., 2018a, b). It could be expected that the cumulative addition of indicators that had already appeared in the tributaries of upper reaches would lead to peak richness of indicator species in the mainstreams of mid-lower reaches (Welcomme et al., 2006; Eick and Thiel, 2014). This is the reason why IFIQ-based evaluation scores reached the highest at mainstream sites #3–#5. However, IFIQ failed to reflect the relative importance of fish indicators in community composition and could not avoid the bias caused by sampling occasionality. For example, since invasive cichlids and loricariids were dominant in most tropical and subtropical rivers of China, the evaluation score would be overestimated if only the species richness rather than the community composition was considered. Our scoring method intended to provide a realistic judgement on ecological status by using IFIN and IFIB. These two quantitative indices weighted by fish indicators’ relative contribution performed better than qualitative IFIQ in revealing the practical conditions of the local environment, which provides evidence for managers to make decisions on river conservation (Mujiyanto et al., 2021).
4.3 Optimized and extended application of indicator-based environmental evaluation
The spatial distribution and population dynamics of fish with specific feeding and reproductive requirements carry the comprehensive information about water quality (e.g., flow velocity, dissolved oxygen, and nutrient contents), substrate types (e.g., sand, gravel, and pebble), and habitat characteristics (e.g., riffle, pool, and run), which are critical environmental factors determining the fluvial biodiversity (Lasne et al., 2007; Souza and Vianna, 2020). In addition, the fish indicators selected in this study occupied different trophic levels and represented important trophic nodes within predator‒prey relationships (Wang et al., 2018b), which can indicate the integrity of food chains occurring in heterogeneous habitats. Thus, the contribution (e.g., individual number and biomass) of these fish indicators to community composition has great impacts on the structure and energy flows of local food web (Bal et al., 2018), which is important for maintaining health and functioning of aquatic ecosystem.
Notably, although endangered or national protected fishes are can be indicators of multiple functions in river environments, it is difficult for filed investigators to gather their information due to their limited distribution, low population density, and legal protection (Southerland et al., 2007). Therefore, we recommend that the monitoring of protected species be achieved in two ways: 1) substitution by using other species with similar environmentally indicative functions, e.g., using Hemibagrus macropterus to indicate habitat areas where H. guttatus (national second-class protected animals) is likely to occur, and 2) using environmental DNA technology to conduct long-term monitoring in areas where protected species may occur (Wang et al., 2023). The scoring and evaluation system constructed in this study are suitable not only for traditional ecological data (e.g., individual number and biomass) but also for operational taxonomic unit abundance obtained by high-throughput sequencing.
5 Conclusion
At present, most studies focus on river monitoring in field often underestimated the biological feedback of aquatic indicators to local environment. Compared with other biomonitoring indicators, fish are more favored by researchers because of their easy collection, handling, and identification, as well as wide social attention. In this study, we provided a quantitative method to select fish indicators, construct associated scoring criteria, and obtain final evaluation scores by calculating IFI. Such an IFI-based evaluation system can be easily used by environmental technicians and is conducive to improving the efficiency of field monitoring and the rationality of ecological conservation. With the functioning of fish indicators as the basis and the evaluation system as a guiding principle, managers could not only assess local biodiversity and community structure but also the current status and potential threats to river environment.
Statements
Data availability statement
The original contributions presented in the study are included in the article/Supplementary Material. Further inquiries can be directed to the corresponding author.
Author contributions
SW: Conceptualization, Data curation, Formal analysis, Funding acquisition, Investigation, Methodology, Project administration, Software, Supervision, Validation, Visualization, Writing – original draft, Writing – review & editing. Y-JG: Data curation, Formal analysis, Investigation, Methodology, Writing – review & editing. D-HW: Conceptualization, Data curation, Formal analysis, Investigation, Methodology, Software, Writing – original draft, Writing – review & editing. D-LX: Data curation, Formal analysis, Investigation, Methodology, Writing – original draft, Writing – review & editing, Conceptualization. T-TW: Data curation, Formal analysis, Investigation, Methodology, Writing – original draft, Writing – review & editing, Conceptualization, Funding acquisition, Project administration, Software, Supervision. S-DF: Data curation, Formal analysis, Investigation, Methodology, Writing – original draft, Writing – review & editing. E-NW: Data curation, Investigation, Writing – original draft, Writing – review & editing, Formal analysis, Methodology. Y-DS: Data curation, Writing – original draft, Writing – review & editing, Formal analysis, Investigation. H-JZ: Data curation, Writing – original draft, Writing – review & editing, Formal analysis, Investigation. G-PF: Data curation, Writing – original draft, Writing – review & editing, Formal analysis, Investigation. Z-BC: Conceptualization, Data curation, Investigation, Writing – original draft, Writing – review & editing. LM: Data curation, Investigation, Writing – original draft, Writing – review & editing. YZ: Data curation, Investigation, Writing – original draft, Writing – review & editing. Z-LM: Data curation, Investigation, Writing – original draft, Writing – review & editing.
Funding
The author(s) declare financial support was received for the research, authorship, and/or publication of this article. This research was financially supported by Key Research and Development Project of Hainan Province (Nos. ZDYF2022SHFZ034, ZDYF2022SHFZ032, and ZDYF2021SHFZ064), National Natural Science Foundation of China (Nos. 42367054 and 42067051), National Key Research and Development Program of China (No. 2022YFD2401301), Hainan Provincial Natural Science Foundation of China (Nos. 421QN196, 421QN195, and 322QN227), Open Project of State Key Laboratory of Marine Resource Utilization in South China Sea (Nos. MRUKF2023005 and MRUKF2023002), Collaborative Innovation Center Project of Hainan University (No. XTCX2022HYC11), and Hainan University Start-up Funding for Scientific Research (Nos. KYQD[ZR]-21015 and KYQD[ZR]-21033).
Conflict of interest
Author H-JZ was employed by the company Hainan Qingxiao Environmental Testing Co., Ltd. Author YZ was employed by the company Shenzhen Guanghuiyuan Environment Water Co., Ltd. Author Z-LM was employed by the company China Water Resources Pearl River Planning Surveying & Designing Co., Ltd.
The remaining authors declare that the research was conducted in the absence of any commercial or financial relationships that could be construed as a potential conflict of interest.
Publisher’s note
All claims expressed in this article are solely those of the authors and do not necessarily represent those of their affiliated organizations, or those of the publisher, the editors and the reviewers. Any product that may be evaluated in this article, or claim that may be made by its manufacturer, is not guaranteed or endorsed by the publisher.
Supplementary material
The Supplementary Material for this article can be found online at: https://www.frontiersin.org/articles/10.3389/fevo.2024.1377508/full#supplementary-material
References
1
BalP.TullochA. I.AddisonP. F.McDonald-MaddenE.RhodesJ. R. (2018). Selecting indicator species for biodiversity management. Front. Ecol. Environ.16, 589–598. doi: 10.1002/fee.1972
2
BarbourM. T.GerritsenJ.SnyderB.StriblingJ. (1999). Rapid bioassessment protocols for use in streams and wadeable rivers (Washington, USA: USEPA).
3
BoyeroL.RamirezA.DudgeonD.PearsonR. G. (2009). Are tropical streams really different? J. North Am. Benthological Soc.28, 397–403. doi: 10.1899/08-146.1
4
ButchartS. H. M.WalpoleM.CollenB.Van StrienA.ScharlemannJ. P. W.AlmondR. E. A.et al. (2011). Global biodiversity: Indicators of recent declines. Science328, 1164–1168. doi: 10.1126/science.1187512
5
CarignanV.VillardM.-A. (2002). Selecting indicator species to monitor ecological integrity: a review. Environ. Monit. Assess.78, 45–61. doi: 10.1023/A:1016136723584
6
DudgeonD. (2000). The ecology of tropical Asian rivers and streams in relation to biodiversity conservation. Annu. Rev. Ecol. Systematics31, 239–263. doi: 10.1146/annurev.ecolsys.31.1.239
7
DudgeonD. (2008). Tropical stream ecology (USA: Elsevier).
8
EickD.ThielR. (2014). Fish assemblage patterns in the Elbe estuary: guild composition, spatial and temporal structure, and influence of environmental factors. Mar. Biodiversity44, 559–580. doi: 10.1007/s12526-014-0225-4
9
FlotemerschJ. E.StriblingJ. B.PaulM. J. (2006). Concepts and approaches for the bioassessment of non-wadeable streams and rivers (Cincinnati, Ohio, USA: Office of Research and Development, USEPA).
10
HauerF. R.LambertiG. A. (2007). Methods in stream ecology (London, UK: Academic Press).
11
JordanS.VaasP. (2000). An index of ecosystem integrity for Northern Chesapeake Bay. Environ. Sci. Policy3, 59–88. doi: 10.1016/S1462-9011(00)00028-9
12
KarrJ. R. (1981). Assessment of biotic integrity using fish communities. Fisheries6, 21–27. doi: 10.1577/1548-8446(1981)006<0021:AOBIUF>2.0.CO;2
13
LasneE.BergerotB.LekS.LaffailleP. (2007). Fish zonation and indicator species for the evaluation of the ecological status of rivers: example of the Loire basin (France). River Res. Appl.23, 877–890. doi: 10.1002/rra.1030
14
LiuC.CuiY.LiX.YaoM. (2021). microeco: an R package for data mining in microbial community ecology. FEMS Microbiol. Ecol.97, fiaa255. doi: 10.1093/femsec/fiaa255
15
MujiyantoSyamA. R.NastitiA. S. (2021). Composition of reef fish as a success indicator of the bio-transplants method in Tunda Island, Serang Regency, Banten Province. E3S Web Conf.322, 01027. doi: 10.1051/e3sconf/202132201027
16
PasquaudS.CourratA.FonsecaV. F.GamitoR.GonçalvesC. I.LobryJ.et al. (2013). Strength and time lag of relationships between human pressures and fish-based metrics used to assess ecological quality of estuarine systems. Estuarine Coast. Shelf Sci.134, 119–127. doi: 10.1016/j.ecss.2013.02.002
17
Pérez-DomínguezR.MaciS.CourratA.LepageM.BorjaA.UriarteA.et al. (2012). Current developments on fish-based indices to assess ecological-quality status of estuaries and lagoons. Ecol. Indic.23, 34–45. doi: 10.1016/j.ecolind.2012.03.006
18
PetryA.SchulzU. (2006). Longitudinal changes and indicator species of the fish fauna in the subtropical Sinos River, Brazil. J. Fish Biol.69, 272–290. doi: 10.1111/j.1095-8649.2006.01110.x
19
SegataN.IzardJ.WaldronL.GeversD.MiropolskyL.GarrettW. S.et al. (2011). Metagenomic biomarker discovery and explanation. Genome Biol.12, 1–18. doi: 10.1186/gb-2011-12-6-r60
20
Sosa-LópezA.MouillotD.Do ChiT.Ramos-MirandaJ. (2005). Ecological indicators based on fish biomass distribution along trophic levels: an application to the Terminos coastal lagoon, Mexico. ICES J. Mar. Sci.62, 453–458. doi: 10.1016/j.icesjms.2004.12.004
21
SoutherlandM. T.RogersG. M.KlineM. J.MorganR. P.BowardD. M.KazyakP. F.et al. (2007). Improving biological indicators to better assess the condition of streams. Ecol. Indic.7, 751–767. doi: 10.1016/j.ecolind.2006.08.005
22
SouzaG. B. G.ViannaM. (2020). Fish-based indices for assessing ecological quality and biotic integrity in transitional waters: A systematic review. Ecol. Indic.109, 105665. doi: 10.1016/j.ecolind.2019.105665
23
VörösmartyC. J.McIntyreP. B.GessnerM. O.DudgeonD.PrusevichA.GreenP.et al. (2010). Global threats to human water security and river biodiversity. Nature467, 555–561. doi: 10.1038/nature09440
24
WangS.LuoB.-K.QinY.-J.ZhaoJ.-G.WangT.-T.StewartS. D.et al. (2020a). Fish isotopic niches associated with environmental indicators and human disturbance along a disturbed large subtropical river in China. Sci. Total Environ.750, 141667. doi: 10.1016/j.scitotenv.2020.141667
25
WangS.SuL.-H.LuoB.-K.QinY.-J.StewartS. D.TangJ.-P.et al. (2020b). Stable isotopes reveal effects of natural drivers and anthropogenic pressures on isotopic niches of invertebrate communities in a large subtropical river of China. Environ. Sci. pollut. Res.27, 36132–36146. doi: 10.1007/s11356-020-09252-8
26
WangS.TangJ.-P.SuL.-H.FanJ.-J.ChangH.-Y.WangT.-T.et al. (2019). Fish feeding groups, food selectivity, and diet shifts associated with environmental factors and prey availability along a large subtropical river, China. Aquat. Sci.81, 31. doi: 10.1007/s00027-019-0628-1
27
WangS.WangL.ChangH.-Y.LiF.TangJ.-P.ZhouX.-A.et al. (2018a). Longitudinal variation in energy flow networks along a large subtropical river, China. Ecol. Model.387, 83–95. doi: 10.1016/j.ecolmodel.2018.08.019
28
WangS.WangT.-T.LinH.-J.StewartS. D.ChengG.LiW.et al. (2021). Impacts of environmental factors on the food web structure, energy flows, and system attributes along a subtropical urban river in southern China. Sci. Total Environ.794, 148673. doi: 10.1016/j.scitotenv.2021.148673
29
WangS.WangT.-T.TangJ.-P.WangL.YangY.LinH.-J.et al. (2018b). Longitudinal variation in fish prey utilization, trophic guilds, and indicator species along a large subtropical river, China. Ecol. Evol.8, 11467–11483. doi: 10.1002/ece3.4577
30
WangS.WuD.-H.SongY.-D.WangT.-T.FanS.-D.WuE.-N.et al. (2024). Application of environmental DNA metabarcoding to identify fish community characteristics in subtropical river systems. Ecology and Evolution14 (5), e11214.
31
WangT.-T.WangX.-D.WangD.-Y.FanS.-D.WangS.ChenZ.-B.et al. (2023). Aquatic invertebrate diversity profiling in heterogeneous wetland habitats by environmental DNA metabarcoding. Ecol. Indic.150, 110126. doi: 10.1016/j.ecolind.2023.110126
32
WelcommeR. L.WinemillerK. O.CowxI. G. (2006). Fish environmental guilds as a tool for assessment of ecological condition of rivers. River Res. Appl.22, 377–396. doi: 10.1002/rra.914
33
WiensJ. A. (2002). Riverine landscapes: taking landscape ecology into the water. Freshw. Biol.47, 501–515. doi: 10.1046/j.1365-2427.2002.00887.x
34
WinemillerK. O. (1990). Spatial and temporal variation in tropical fish trophic networks. Ecol. Monogr.60, 331–367. doi: 10.2307/1943061
Summary
Keywords
biomonitoring, environmental evaluation, human disturbance, resource availability, biodiversity, food web
Citation
Wang S, Gao Y-J, Wu D-H, Xu D-L, Wang T-T, Fan S-D, Wu E-N, Song Y-D, Zhang H-J, Fu G-P, Chen Z-B, Mo L, Zhang Y and Ma Z-L (2024) Using a new fish indicator-based index with scoring and evaluation criteria to assess the ecological status in a disturbed subtropical river of China. Front. Ecol. Evol. 12:1377508. doi: 10.3389/fevo.2024.1377508
Received
27 January 2024
Accepted
08 May 2024
Published
07 August 2024
Volume
12 - 2024
Edited by
Arnaldo Marín, University of Murcia, Spain
Reviewed by
Lei Zhou, South China Agricultural University, China
Andres Millan, University of Murcia, Spain
Updates
Copyright
© 2024 Wang, Gao, Wu, Xu, Wang, Fan, Wu, Song, Zhang, Fu, Chen, Mo, Zhang and Ma.
This is an open-access article distributed under the terms of the Creative Commons Attribution License (CC BY). The use, distribution or reproduction in other forums is permitted, provided the original author(s) and the copyright owner(s) are credited and that the original publication in this journal is cited, in accordance with accepted academic practice. No use, distribution or reproduction is permitted which does not comply with these terms.
*Correspondence: Tuan-Tuan Wang, ttwang@hainanu.edu.cn
Disclaimer
All claims expressed in this article are solely those of the authors and do not necessarily represent those of their affiliated organizations, or those of the publisher, the editors and the reviewers. Any product that may be evaluated in this article or claim that may be made by its manufacturer is not guaranteed or endorsed by the publisher.