 Li Yuan
 Mao Zhong yuan1
95% of researchers rate our articles as excellent or good
Learn more about the work of our research integrity team to safeguard the quality of each article we publish.
Find out more
ORIGINAL RESEARCH article
Front. Ecol. Evol. , 26 July 2024
Sec. Conservation and Restoration Ecology
Volume 12 - 2024 | https://doi.org/10.3389/fevo.2024.1404424
This article is part of the Research Topic Regeneration Mechanisms and Tradeoffs of Ecosystem Function after Drastic Environmental Changes View all 7 articles
Background: In recent decades, the Loess Plateau is one of the regions in China that urgently needs ecological governance due to the severe situation of soil erosion and land desertification. Due to the impact of climate change and human activities, the threat to the ecological space security of the Loess Plateau has intensified. This paper reveals the time lag effect of ecological engineering construction on the changes in the ecosystem service capacity index of the Loess Plateau, providing a scientific basis and decision-making reference for the sustainable development of the study area and improving the quality and management of ecological engineering construction, which is of great significance for building a solid ecological security barrier on the Loess Plateau.
Methods: Based on the hierarchical analysis method, quantitative indicator method, spatial correlation analysis method and two-way fixed effect model, this paper analyzes the temporal and spatial changes of the ecosystem service capacity index of the Loess Plateau under the background of ecological engineering implementation.
Results: The results showed that: 1) the vegetation coverage of the Loess Plateau increased with the increase of the area of ecological engineering construction, and showed a fluctuating growth distribution characteristic from southeast to northwest in space; 2) the water conservation capacity index, wind and sand fixation capacity index, biodiversity capacity index and comprehensive service capacity index of the Loess Plateau from 2000 to 2020 all showed exponential growth, which were highly coupled with the growth and change of vegetation coverage area in time and space; 3) the cold spots and hot spots of the ecosystem service capacity index of the Loess Plateau showed a step-by-step decrease of "hot in the south and cold in the north" in spatial distribution; the hot spots and sub-hot spots showed a reciprocating cycle from aggregation to fragmentation in time and space; the cold spots and sub-cold spots were mainly distributed in the northwest region. 4) The changes in the ecosystem service capacity index of the Loess Plateau were mainly affected by factors such as the cumulative project implementation area, urbanization rate and precipitation.
Conclusion: The construction of ecological engineering on the Loess Plateau has achieved remarkable results. The growth of vegetation coverage area and ecosystem service capacity index on the Loess Plateau from 2000 to 2020 has promoted the recovery of ecosystem functions. Therefore, we should actively promote the construction of ecological projects to provide scientific decision-making references for solving regional ecological security issues.
A coupled human-land system is a complex mega-system formed by the coupling of natural ecosystems and human society (Defries, 2008; Franzke et al., 2022). Natural ecosystems are the basis for human survival and development, providing the necessary material foundation for human survival and development (Costanza et al., 1997; Reid et al., 2005). With the rapid development of human society, the lack of protection of natural ecosystems has exacerbated the destruction of the structure and function of natural ecosystems, triggering a series of ecological and environmental problems (Yang et al., 2022; Bouzekri et al., 2023; Hao et al., 2023). The maintenance and growth of ecological functions such as soil and water conservation, carbon sequestration, and biodiversity can only be realized by restoring vegetation (Halik et al., 2019). Countries around the world are actively carrying out ecosystem restoration, and have carried out a number of ambitious ecological projects, such as: the former Soviet Union “Stalin’s program to transform nature”, the United States “Roosevelt Project”, Canada “Green Plan”, Africa “Green Plan”, and the United States “Roosevelt Project”. Plan”, “Five-color Dam Project” in Africa, “Greening Plan” in South Korea, “Greening Plan” in Japan, “Natural Forest Protection Project” in China, and “Natural Forest Protection Project” in China. “Natural Forest Protection Project”, “Returning Cultivated Land to Forests Project” and “Three-North” Protective Forest Project” in China (Saunders, 1980; Darier, 1996; Brain, 2011; Mcdonald, 2012; Li, 2022; Yan et al., 2022; Zhai et al., 2023). Meanwhile, the study of vegetation restoration on ecological services has become a research hotspot in the field of ecology (Xue et al., 2023).
Vegetation restoration is an important indicator for evaluating the implementation of ecological projects, and NDVI has good correlation with NPP and vegetation cover, which are widely used in regional studies on forest cover assessment, evaluation of the effectiveness of vegetation restoration programs, and monitoring and analysis of vegetation growth (Li P. et al., 2021; Li, 2022). In recent years, several studies have found that vegetation restoration projects have positively contributed to the response of ecosystem service function recovery in the Karst region of southwestern China (Ma et al., 2022), the Three-North Protective Forest Planning Area (Gong et al., 2023), the lower reaches of the Tarim River in northwestern China (Halik et al., 2019), and the Iranian Northeast China (Emamian et al., 2021), and the northern Adriatic dune region of Italy (Fabbri et al., 2021) fully confirmed that ecological engineering significantly contributed to the spatial-temporal growth changes of NDVI and NPP, which was mainly a study of spatial-temporal dynamics changes of ecosystem services, and lacked the study of changes in ecosystem service indices.
Climate change and human activities have been recognized as major factors influencing regional ecosystem changes (Yu et al., 2023). Most researchers believe that natural factors such as temperature, precipitation, and solar radiation are important for ecosystem vegetation changes, and their relationship with ecosystem vegetation is highly spatially heterogeneous (Fang et al., 2021; Li R. et al., 2021a). Whether climate change or anthropogenic impacts are determinants of ecosystem change in the region under the influence of different geographic location factors remains to be thoroughly investigated (Qu et al., 2020). In the past, principal component analysis (PCA), regression analysis (RA), geographic detector model (GDM), and geographically weighted regression (GWR) have been used in driver analysis (Wu, 2020; Xu et al., 2020; Zhao et al., 2020; Dong et al., 2021). In this paper, we used the fixed effect model (FEM) for regression analysis, which enriches the analysis of driver studies by including fixed effects that may produce changes over time or with individual heterogeneity within the scope of examination (Amaliah et al., 2020).
Therefore, this paper starts from the perspective of the impact of vegetation restoration results of ecological engineering implementation on the ecosystem service index and the diagnosis of obstacles to ecological engineering construction. The changes in the ecosystem service capacity index since the implementation of the ecological engineering in the Loess Plateau are taken as the research object. Based on the normalized difference vegetation index (NDVI) and net primary productivity (NPP), its activity characteristics are qualitatively and quantitatively analyzed. The temporal and spatial changes of the ecosystem service index in the Loess Plateau from 2000 to 2020 under the background of ecological engineering construction and vegetation coverage growth (Sun et al., 2019) are explored, its obstacle factors are diagnosed, and our ability to predict changes in the ecosystem service index is improved, so as to provide theoretical basis and policy guidance for regional ecological and environmental protection. The specific objectives of this study are: (1) to evaluate the impact of changes in net primary productivity and normalized difference vegetation index on the ecosystem service index after the implementation of ecological engineering from 2000 to 2020; (2) to reveal the spatiotemporal gradient changes of the ecosystem service index; (3) to identify the multiple influences of the persistence of changes in the ecosystem service index from a spatial perspective; and (4) to diagnose the obstacles of different influencing factors to the changes in the ecosystem service index.
The Loess Plateau is located at 33°41′-41°16′N, 100°52′-114°33′E, with a total area of about 648,700 km2, accounting for 6.76% of the total area of China. The Loess Plateau region spans the provinces and autonomous regions of Inner Mongolia, Henan, Shaanxi, Shaanxi, Gansu, Qinghai and Ningxia. The Loess Plateau has a high northwest and low southeast topography (Figure 1). The Loess Plateau has a temperate continental monsoon climate, with cold, dry and sandy springs and winters, hot summers and autumns with torrential rains, average annual temperatures ranging from 6 to 14°C, and average annual rainfall ranging from 200 to 700 mm. The population of the study area of the Loess Plateau increased from 11,213,000 people to 130,510,000 people in the period of 2000–2020, an increase of 16.39% in the past 20 years; The urbanization rate of the study area increased from 30% to 57%, an increase of 89.86% in 20 years. The gross regional product of the study area increased from 639 billion yuan to 1305.1 billion yuan between 2000 and 2020, an increase of 1,199.92% in 20 years; the total forestry output value of the study area increased from 5.9 billion yuan to 28.2 billion yuan between 2000 and 2020, an increase of 373.45% in 20 years.
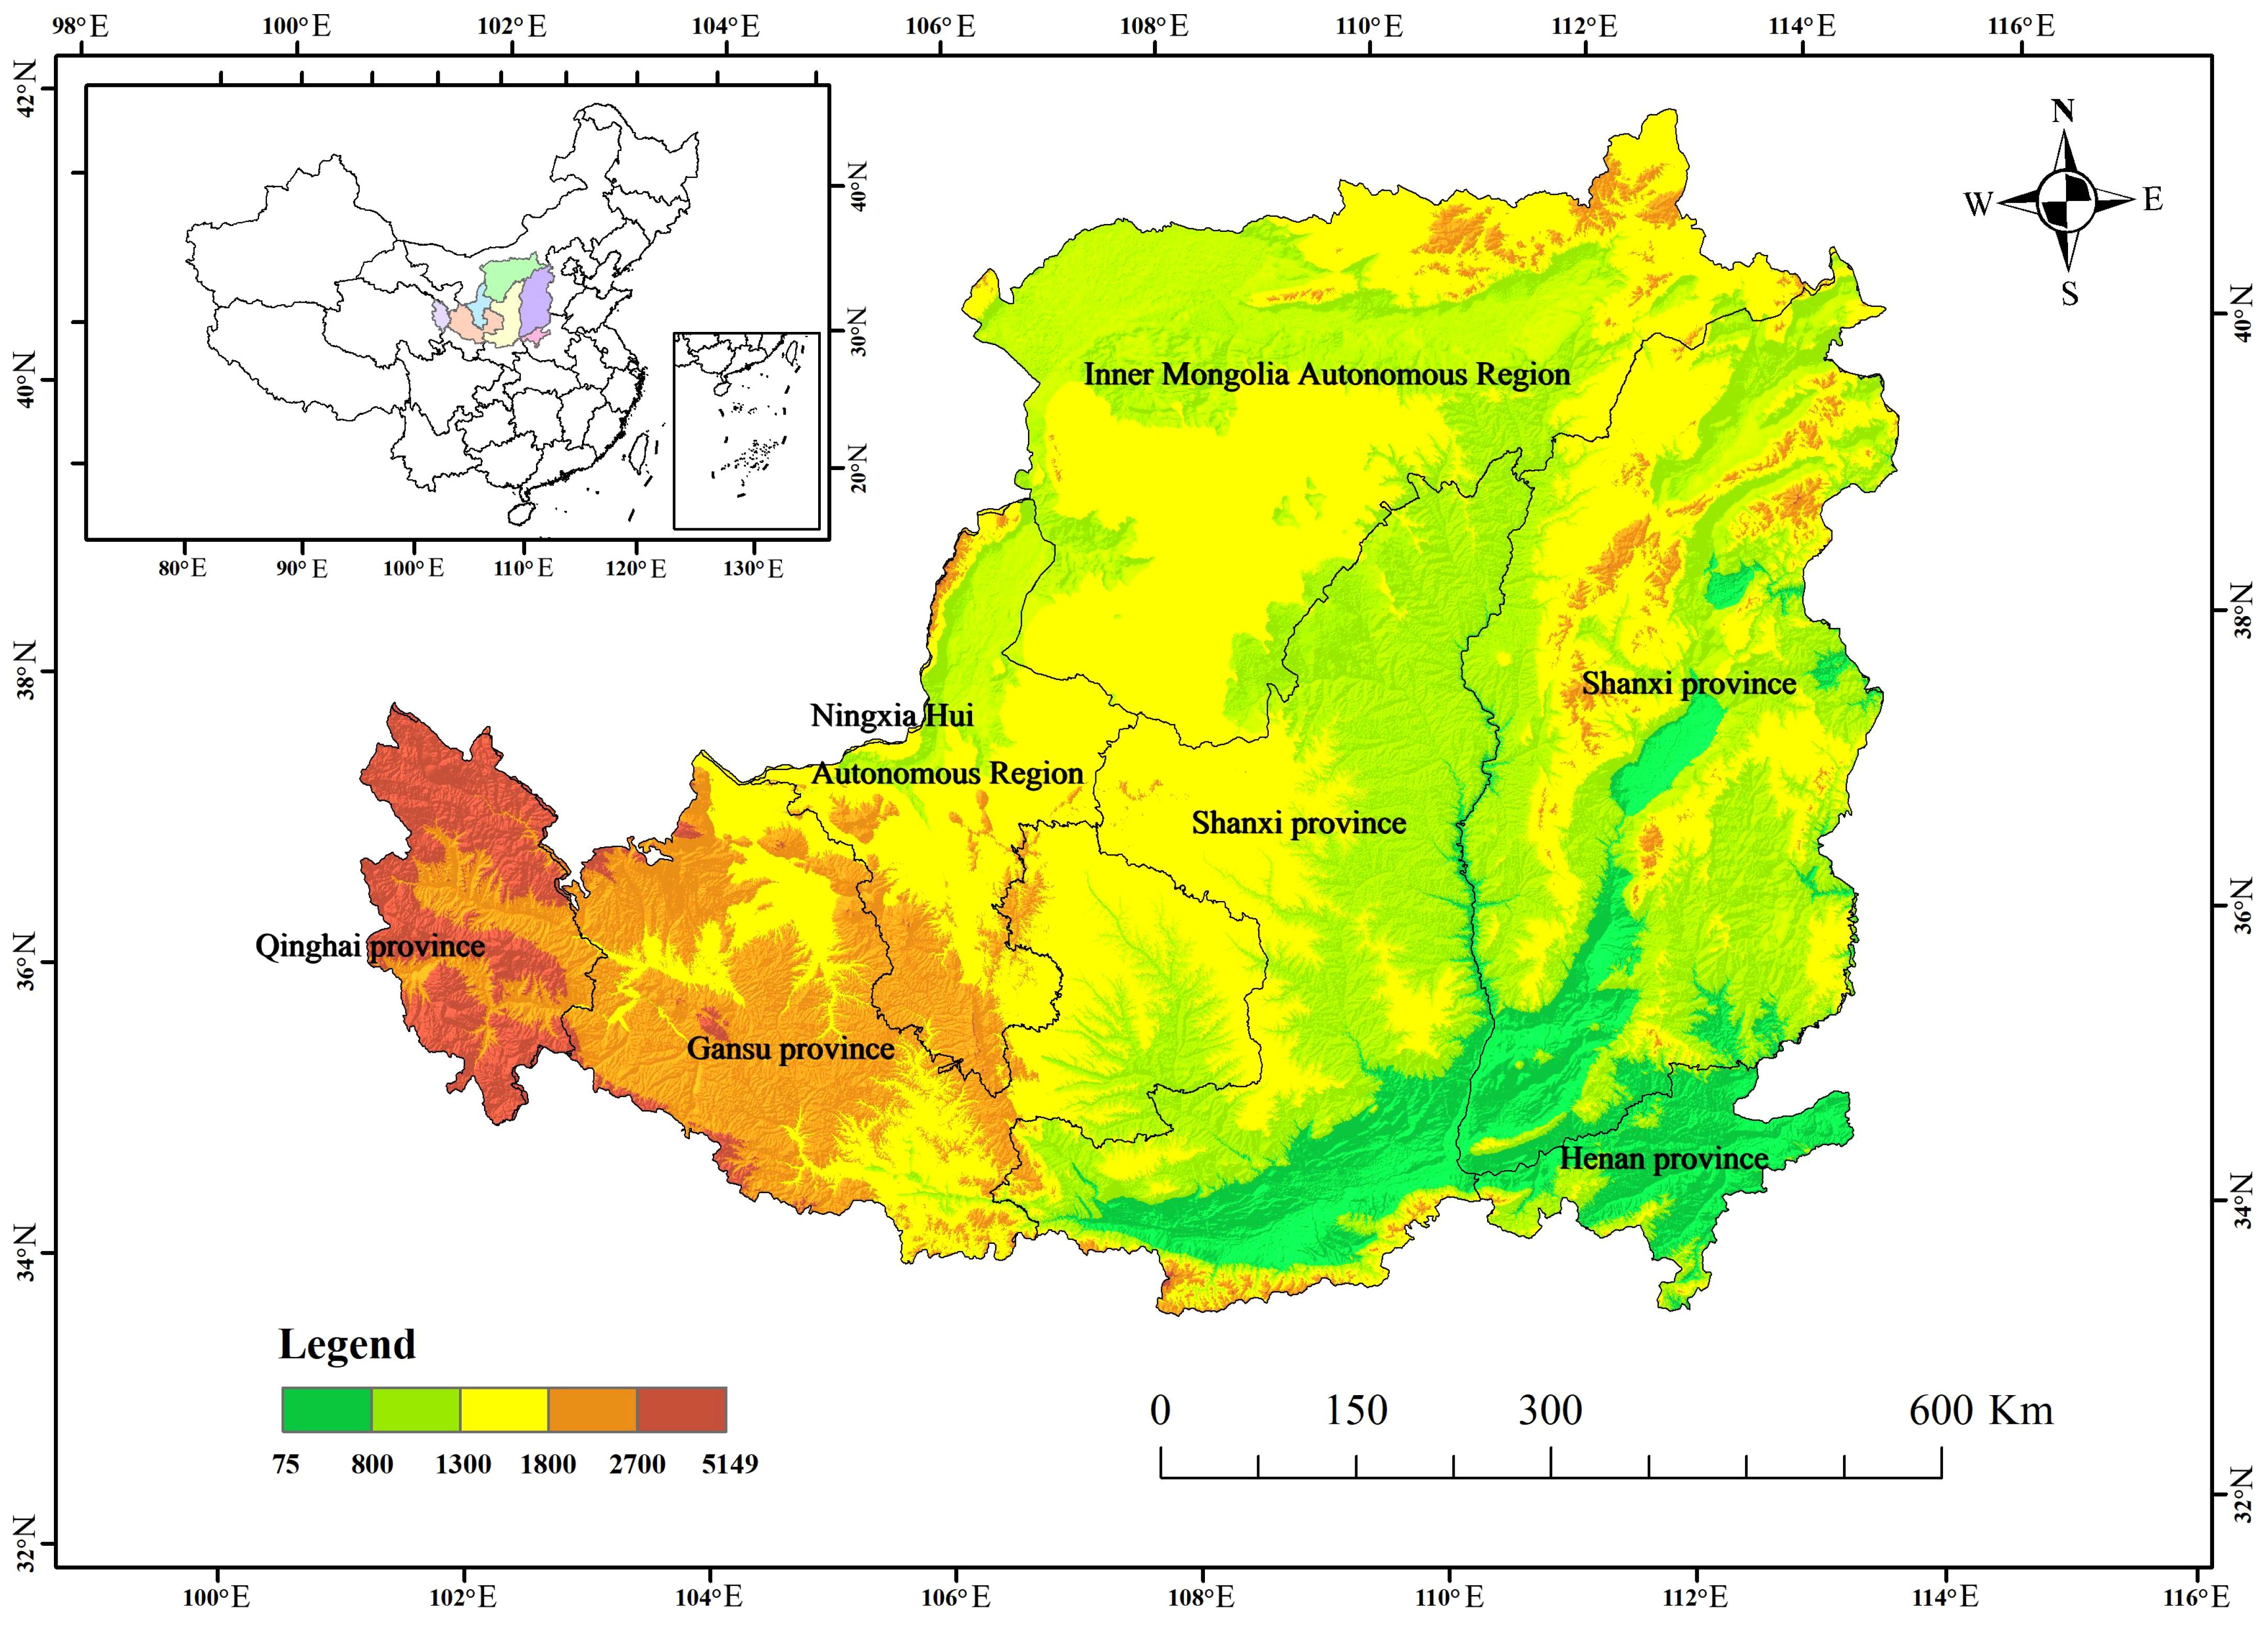
Figure 1 Geographical location and elevation of the study area.
Normalized Vegetation Index (NDVI), net primary productivity (NPP) data was derived from MODIS MOD17A3 data product with a spatial resolution of 500 m resolution vegetation index 16-day synthetic product. Meteorological data and remote sensing data of 30m land use data in 2000–2020 are derived from China Meteorological Data Service Network and Resource and Environment Science and Data Center of Chinese Academy of Sciences; Digital elevation model (DEM) data; geospatial data are derived from the National Ice and Desert Scientific Data Center; impact factor data are derived from the provincial Statistical Yearbook and municipal Statistical Yearbook and China Forestry Statistical Yearbook on the Loess Plateau.
Based on the Regional Ecological Quality Evaluation Method (Sheng et al., 2022), combined with the Ecological Protection Red Line Guidelines (Fan et al., 2018), previous research results and reference evaluation indicators, this paper selects five indicators, including water conservation (Morris and Arbuckle, 2021), soil and water conservation (Huang and Zhang, 2020), windbreak and sand fixation (Lian Hugang et al., 2023), biodiversity (Weiskopf et al., 2020) and comprehensive service capacity (Ma et al., 2021), to construct the Loess Plateau ecosystem service capacity index model. The basic model formula is as follows:
In Equation 1, is the evaluation index of the Loess Plateau ecosystem service capacity; are respectively five categories: water source conservation, soil and water conservation, wind prevention and sand fixation, biodiversity maintenance, and comprehensive service capabilities. Service capability index; is the weight coefficient of various indicators.
In Equation 2, WR is the water conservation service capacity index, and are the average annual vegetation net primary productivity, soil seepage, average annual precipitation, and slope, respectively.
In Equation 3, Spro is the soil and water conservation service capacity index, and K represents soil erodibility.
In Equations 4–7, Sws is the wind protection and sand fixation service capacity index, u1 and u2 represent the wind speed at heights z1 and z2 respectively, Fq, ETPi, Pi, d, Ti ri, D, and θ are respectively the average annual climate erosion power, monthly Potential evaporation, precipitation, number of days in the month, average temperature, average relative humidity, surface roughness, and arc.
In Equation 8, Sbio is the biodiversity maintenance service capability index, Ftem and Falt are the annual average temperature and altitude respectively.
Comprehensive service capacity refers to the ecosystem’s ability to provide habitat conditions for animals and plants through self-regulating functions based on ecological quality. There is a positive relationship between vegetation coverage and comprehensive service capacity. Therefore, vegetation coverage is chosen to represent comprehensive services. Service capabilities. The calculation formula of comprehensive service capacity based on NDVI is as follows;
In Equation 9, Fc is the comprehensive service capability index, NDVI is the MOD13A1 500m resolution vegetation index, NDVIsoil and NDVIveg are the non-vegetation coverage area and pure vegetation pixel values respectively.
The hotspot analysis (Getis-ordG) tool can analyze and obtain the locations where high-value or low-value features cluster in space (Li et al., 2020). Hot spots should have high values and be surrounded by other features with high values. Cold spots are the opposite. The calculation formula is as follows:
In Equation 10, wi is the attribute value of element j; wi, the spatial weight between j elements i and j; n is the total number of elements; X-' is the mean index score; S is the standard deviation of the index score; Statistical Z-score for the output.
Select the influencing factors in Table 1, use STATA16 to analyze the panel data of 45 cities in the Loess Plateau from 2000 to 2020, use the “big N small T” balanced short panel data, and conduct analysis based on the fixed effect model, targeting the research space. Differences may include “individual effects” leading to “time effects” (Kim, 2019). This study establishes a two-way fixed effects model with the following formula:
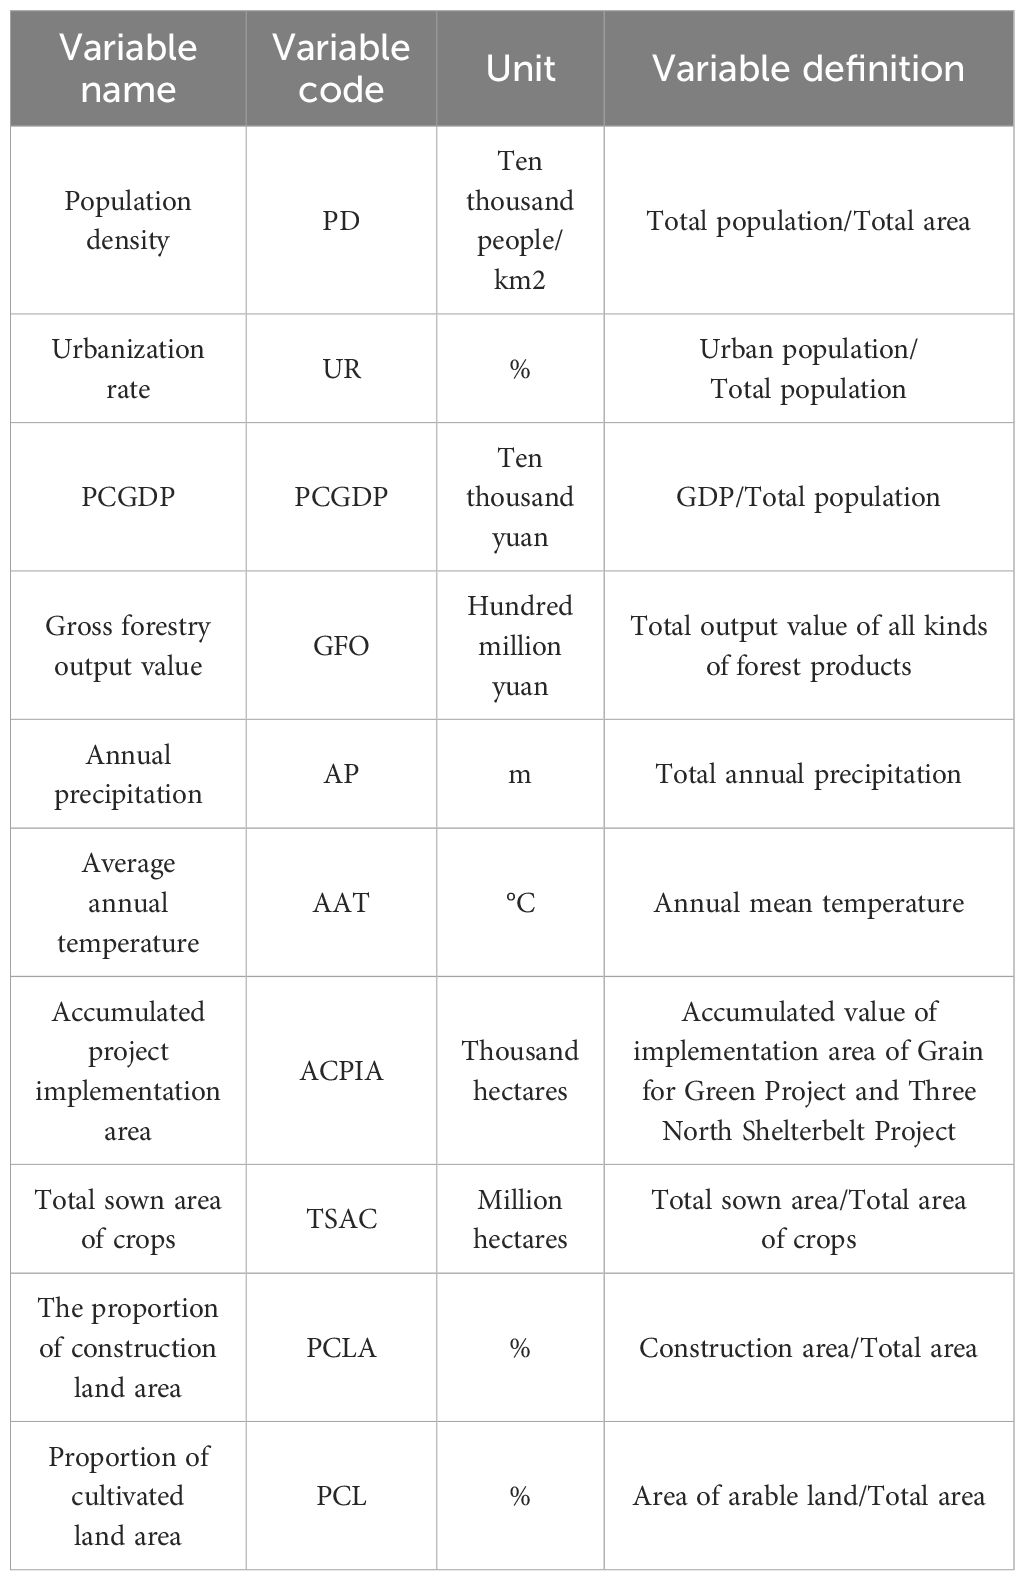
Table 1 Description of the impact factors of the ecosystem service capacity index.
In Equation 11, Yit represents the explained variable, that is, the ecosystem service capacity of the Loess Plateau; β0 represents the intercept term, Xit represents each explanatory variable, βr is the estimated coefficient of each explanatory variable, σt represents the time effect, μi represents the individual effect, and εit is Random error term. The subscript i indicates different regions, and t indicates different times.
The spatial distribution of vegetation cover on the Loess Plateau from 2000 to 2020 shows a decreasing spatial distribution pattern from southeast to northwest. Areas with high vegetation cover are mainly concentrated in the southeastern part of the Loess Plateau in Yangquan, Changzhi, Jincheng, and Jiyuan in Shanxi Province; Luoyang, Zhengzhou, and Sanmenxia in Henan Province; Xi’an, Baoji, and Tongchuan in Shaanxi Province; and Xining and Huangnan Tibetan Autonomous Prefecture in Qinghai Province. The areas with low vegetation cover are mainly distributed in Lanzhou, Baiyin, Zhongwei and Wuzhong in Gansu Province; Ordos, Baotou, Bayannur and Ulanqab in Inner Mongolia Autonomous Region. 2000–2020, under the influence of economic development and the construction of fallow farmland forests and grasslands, the vegetation cover of the Loess Plateau in the study area is overall stable, showing a fluctuating growth. Stable, showing a fluctuating growth trend, the growth rate of vegetation cover increases with the increase in the area of the implementation of the policy project of returning farmland to forests and grasses (Figure 2).
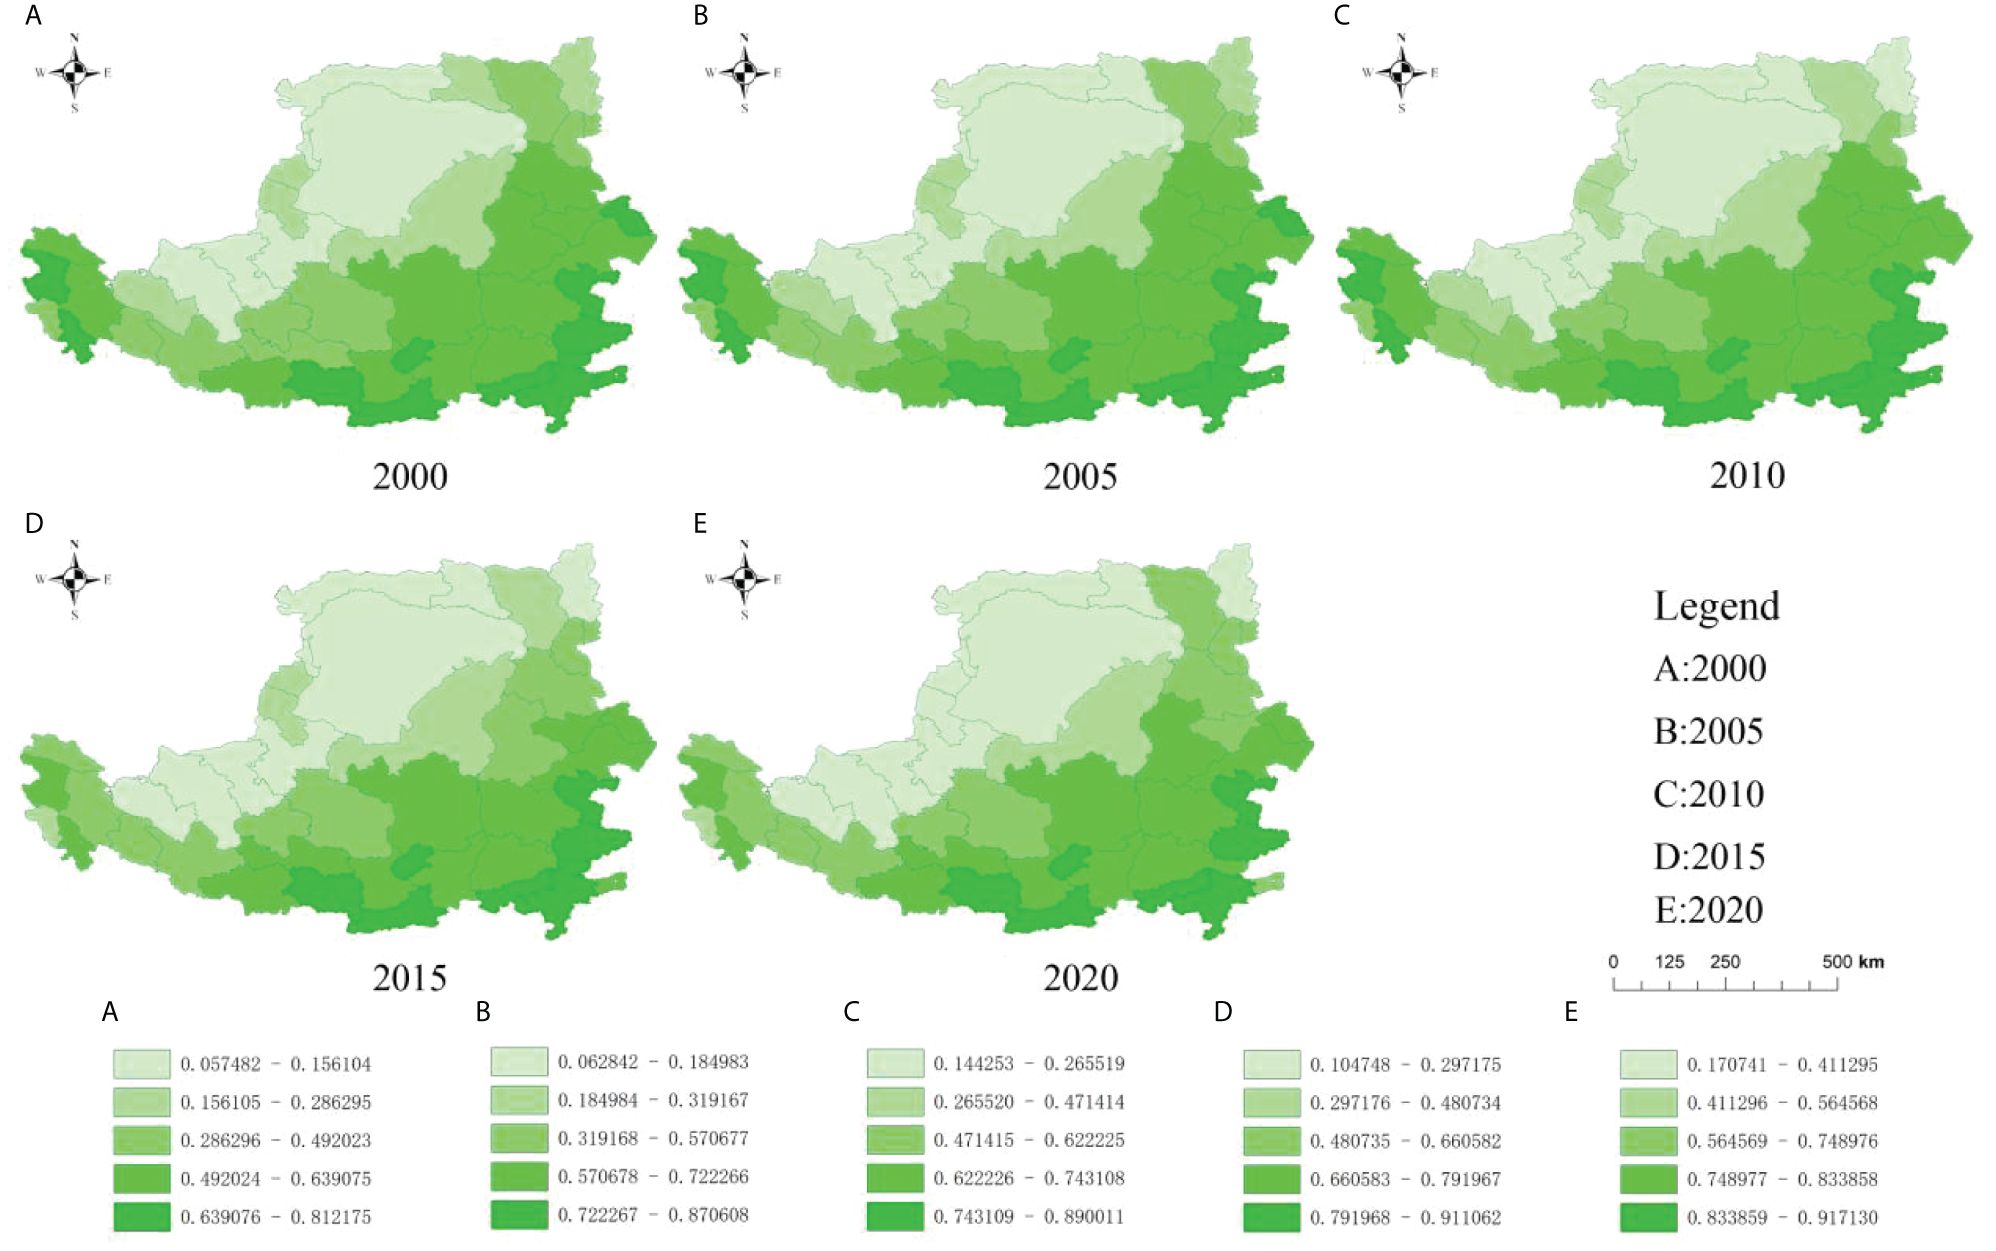
Figure 2 Spatial distribution of vegetation coverage on the Loess Plateau.
From 2000 to 2020, the water conservation service capacity of the Loess Plateau increased by 96.33%, showing a trend of “substantial increase - small increase - substantial increase”. 2000 - 2020, the water conservation capacity of the Loess Plateau showed an overall spatial distribution of high in the southeast and low in the northwest. In 2000–2020, the water conservation capacity of the Loess Plateau in terms of spatial distribution, on the whole, presents the spatial distribution of high in the southeast and low in the northwest, and the trend of decreasing from the southeast to the northwest in a stepwise manner. In the spatial distribution of Luoyang City, Zhengzhou City, Sanmenxia City, Xi’an City, Baoji City and Tianshui City, etc., the water conservation capacity is stronger. In the early stage of the construction of the 2000–2005 fallow farmland reforestation project, a large number of arable land was converted to forested land, and the water-source containment service capacity was increased; the decline in the growth rate of the area of the implementation of the fallow farmland reforestation project in 2005–2015 and the lack of effective management in the mid- and late stages of the project led to a decrease in the water-source containment service capacity of the Loess Plateau; and it may be that the large-scale ecological projects to introduce vegetation restoration, the Loess Plateau has experienced large-scale deep soil drying that exacerbated water vapor transpiration (Wang et al., 2024) and ecological projects of plantation forests with soil water storage capacity and soil porosity as well as nutrient characteristics lower than that of the natural secondary forests (Wang et al., 2023). From 2015 to 2020, the A new round of returning farmland to forest (grass) project construction began to be implemented, which scientifically and effectively solved the ecological problems left over from the first round of the project, and its water-holding capacity was again improved. However, the drying of deep soil after large-scale artificial vegetation construction may lead to the problem of plant succession obstacles that deserves attention (Figure 3).

Figure 3 Spatial distribution of water conservation service capacity in the Loess Plateau.
The soil and water conservation service capacity of the Loess Plateau was increased by 52.50% during the period of 2000–2020, and the improvement of soil and water conservation service capacity alleviated and improved the historical problem of serious soil erosion in the Loess Plateau. During the study period, the soil and water conservation service capacity of the Loess Plateau region, in the early stage of the implementation of ecological policies, the conversion of agricultural land and other land categories to ecological land categories, soil and water conservation service capacity enhancement effect is significant; with the gradual promotion of ecological management in the later stage, the land-use pattern gradually tends to be stabilized, and the ecological carrying capacity of the ecological land categories gradually tends to be stabilized. 2000–2020 In the spatial distribution of soil and water conservation service capacity on the Loess Plateau, the soil and water conservation service capacity of Yuncheng City, Luoyang City, Zhengzhou City, Sanmenxia City, Xi’an City, Baoji City and Tianshui City in the southern region of the Loess Plateau; Hohhot City, Ordos City, Yulin City and Yan’an City in the north-central region; Xining City and Huangyu Tibetan Autonomous Prefecture in the western region is stronger than that in the other districts and municipalities (Figure 4).
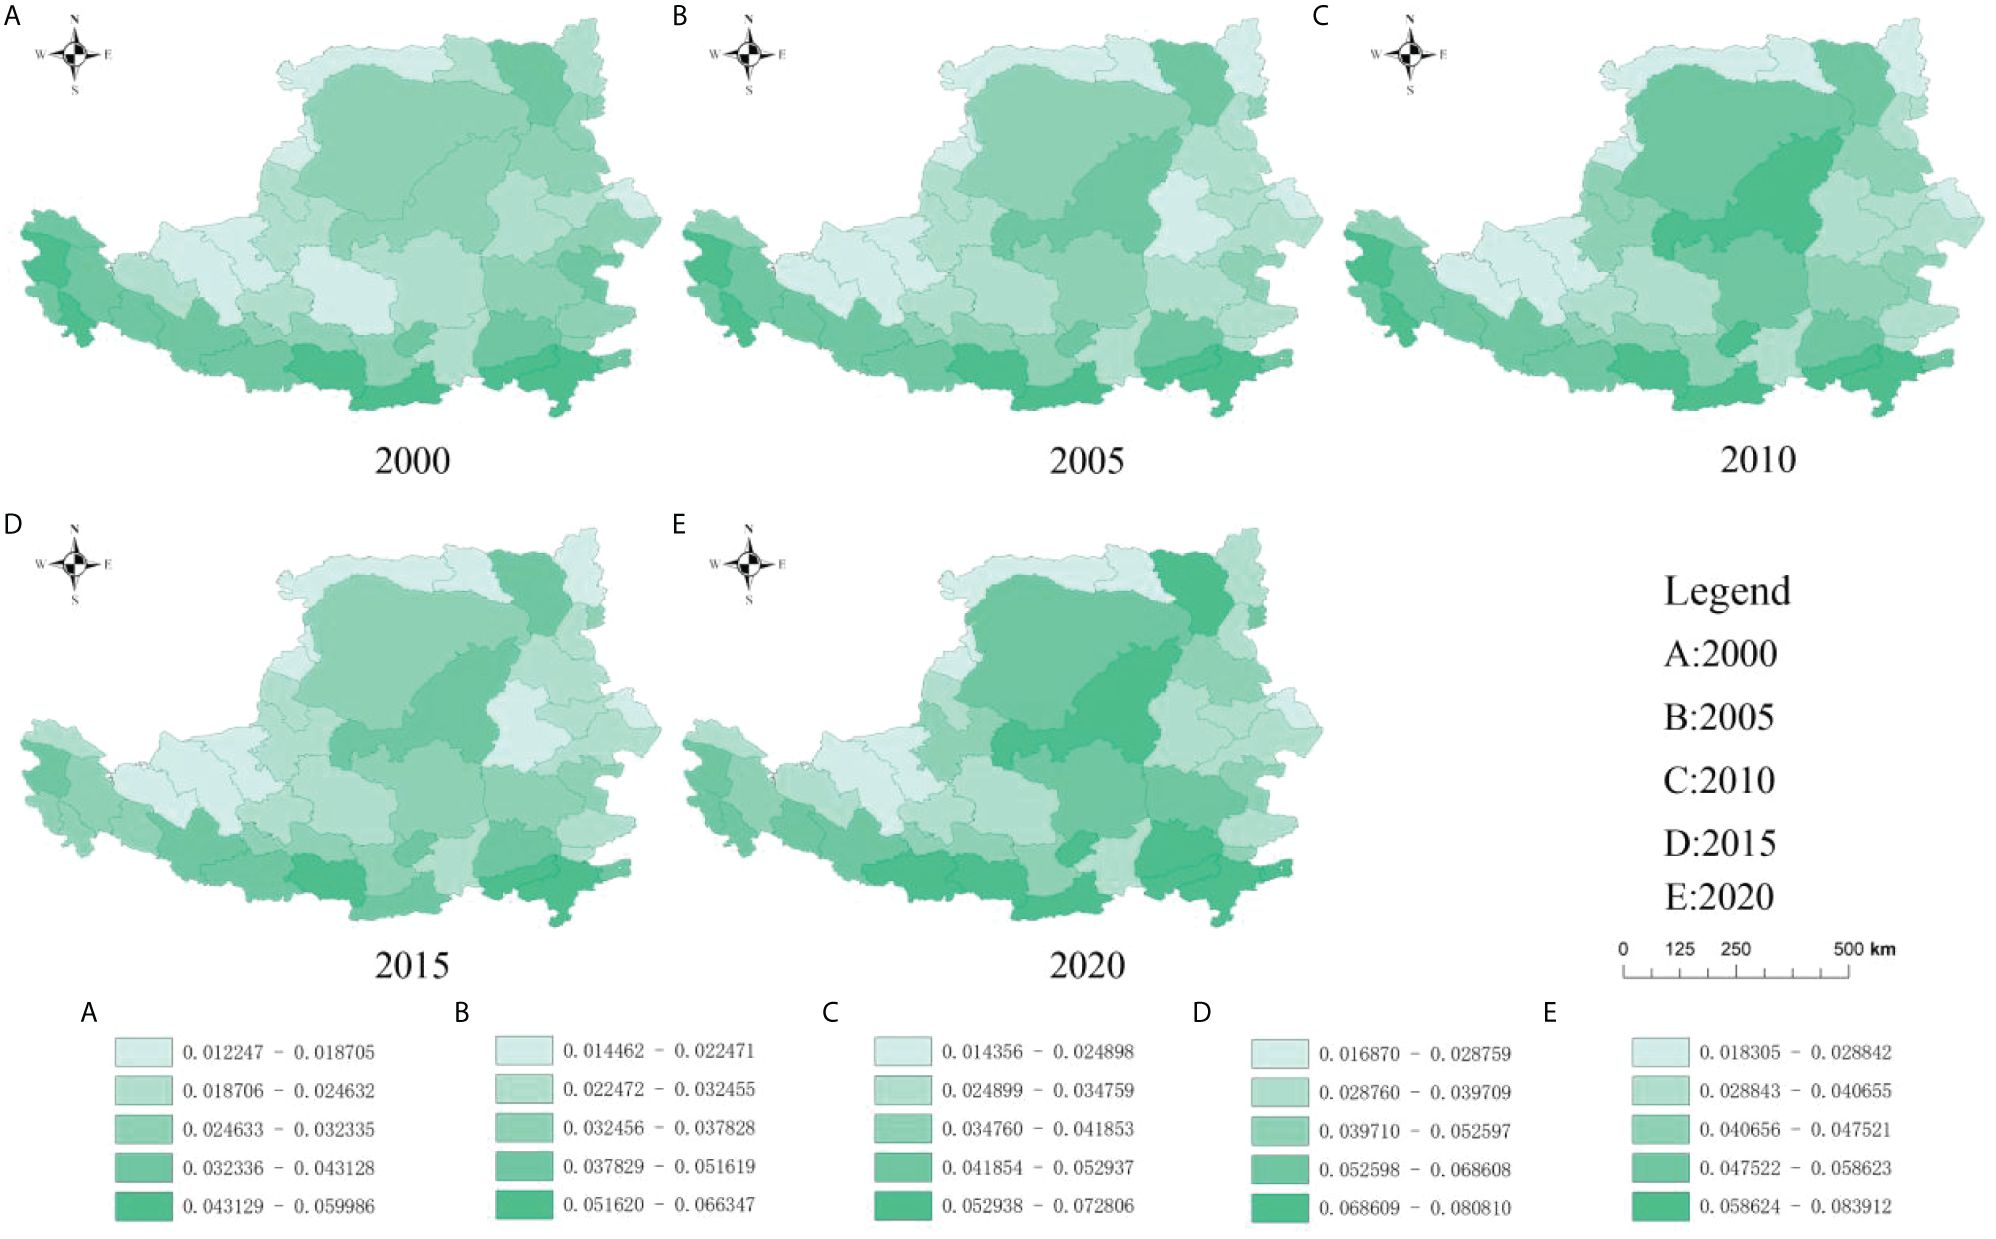
Figure 4 Spatial distribution of soil and water conservation service capacity in the Loess Plateau.
The windproof and sand-fixing capacity of the Loess Plateau increased by 24.10% from 2000 to 2020. The desertified area of the Loess Plateau is 79,200 km2, accounting for about 11% of the area of the Loess Plateau. Wind and sand conservation is also one of the main functions of the ecosystem of the Loess Plateau, and it is one of the ecological problems that need to be solved urgently. 2000–2005, when the ecological policy of returning farmland to forests and grasslands began to be implemented, the capacity of wind and sand conservation was limited; 2005–2010, when the effect of the construction of the project of returning farmland to forests and grasslands became obvious, and the capacity of wind and sand conservation was In 2010–2015, there was a degradation of the windproof and sand-fixing capacity; in 2015–2020, with the implementation of a new round of ecological protection policies such as returning farmland to forests and the scientific management of the previous farmland to forests and grassland projects, the windproof and sand-fixing capacity will be improved again. 2000–2020, the windproof and sand-fixing capacity of the Loess Plateau will be improved again. -In the spatial distribution of the wind and sand conservation capacity of the Loess Plateau from 2000 to 2020, the scope of wind and sand conservation on the Loess Plateau shifted from the southwest to the south and central regions, and the wind and sand conservation belt in the central region was formed with Lvliang City, Yan’an City, Qingyang City, Guyuan City and Pingliang City as the main ones; and in the southern region, the sand conservation belt with Jincheng City, Luoyang City, Sanmenxia City, Xi’an City, Baoji City and Tianshui City as the main ones has gradually formed a regionalized belt. In the south, the belt is formed by Jincheng City, Sanmenxia City, Xi’an City, Baoji City and Tianshui City, gradually forming a regionalized and integrated wind and sand control belt (Figure 5).
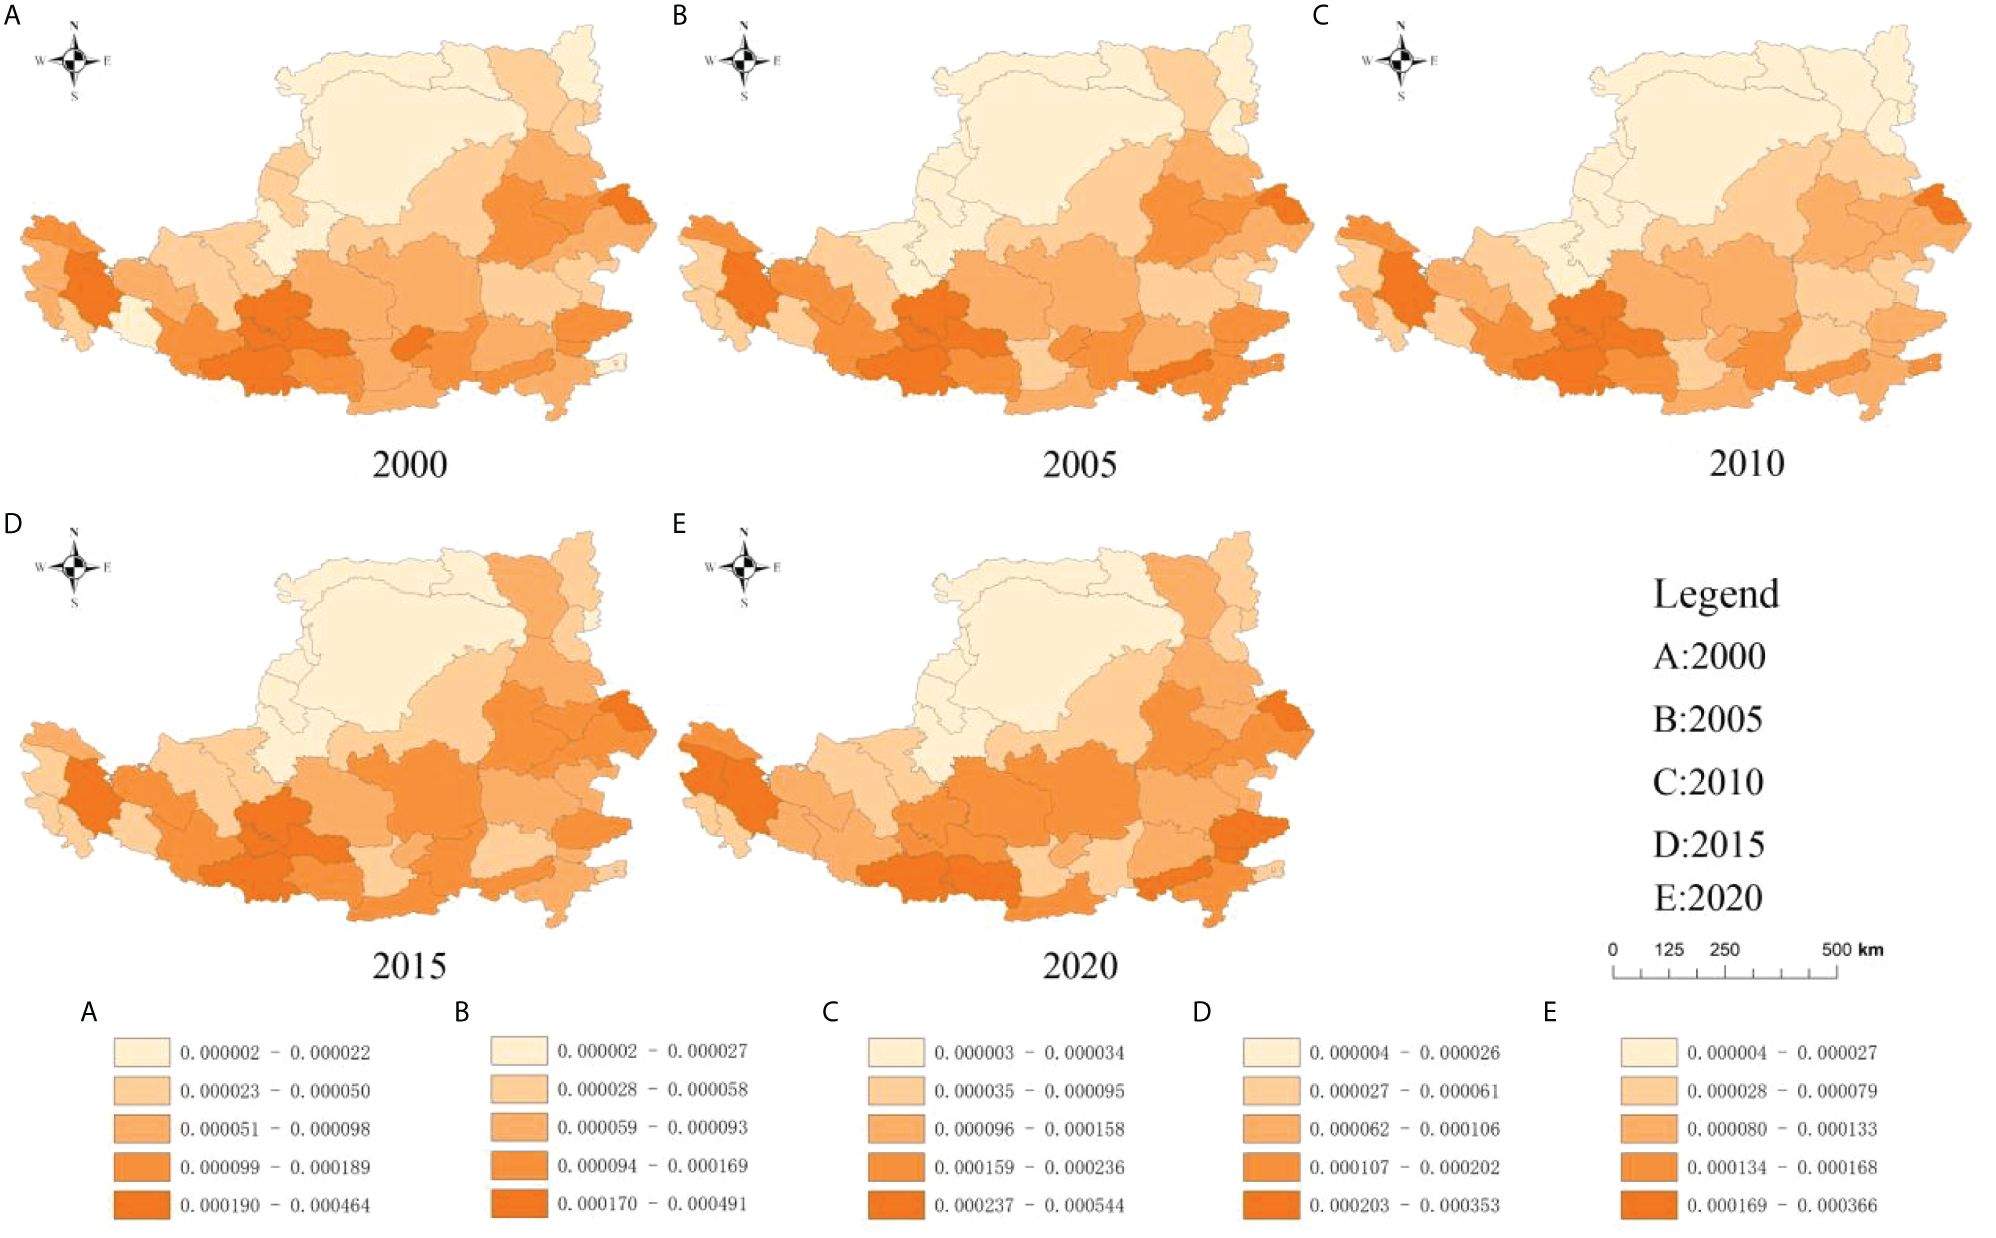
Figure 5 Spatial distribution of wind prevention and sand fixation service capacity on the LoessPlateau.
From 2000 to 2020, the biodiversity capacity of the Loess Plateau region increased by 103.24%, and the biodiversity of the Loess Plateau increased significantly. During the study period, the biodiversity level of the Loess Plateau region showed a trend of “significant increase - small increase - large increase”, with the biodiversity capacity of the Loess Plateau increasing gradually from 2000 to 2005, and then slowing down from 2005 to 2015 as the habitat condition recovered. From 2005 to 2015, the recovery of habitat conditions tended to be stable, and the increase of biodiversity capacity slowed down; after 2015, with China’s ecological civilization and green development concepts put forward, the biodiversity capacity of the Plateau has been further promoted. From 2000 to 2020, the biodiversity capacity of the Plateau was spatially distributed. The southern part of the Loess Plateau has a stronger biodiversity capacity than other regions, showing a decreasing trend from the south to the north. 2000 is better in Yangquan, Changzhi, Jincheng, Jiyuan, Yuncheng, Zhengzhou, Luoyang, Sanmenxia, Weinan, Tongchuan, Xianyang, Xi’an, Baoji and Tianshui cities, etc. The index of the biodiversity capacity in the central part of the plateau, such as Jinzhong, Linfen, and Yan’an City, is higher. 2020 adds Jinzhong, Pingliang and other cities in the central part of the plateau, and Pingliang and other cities in the central part of the plateau, Pingliang City and other cities in the central region, the biodiversity capacity index increases from south to north (Figure 6).
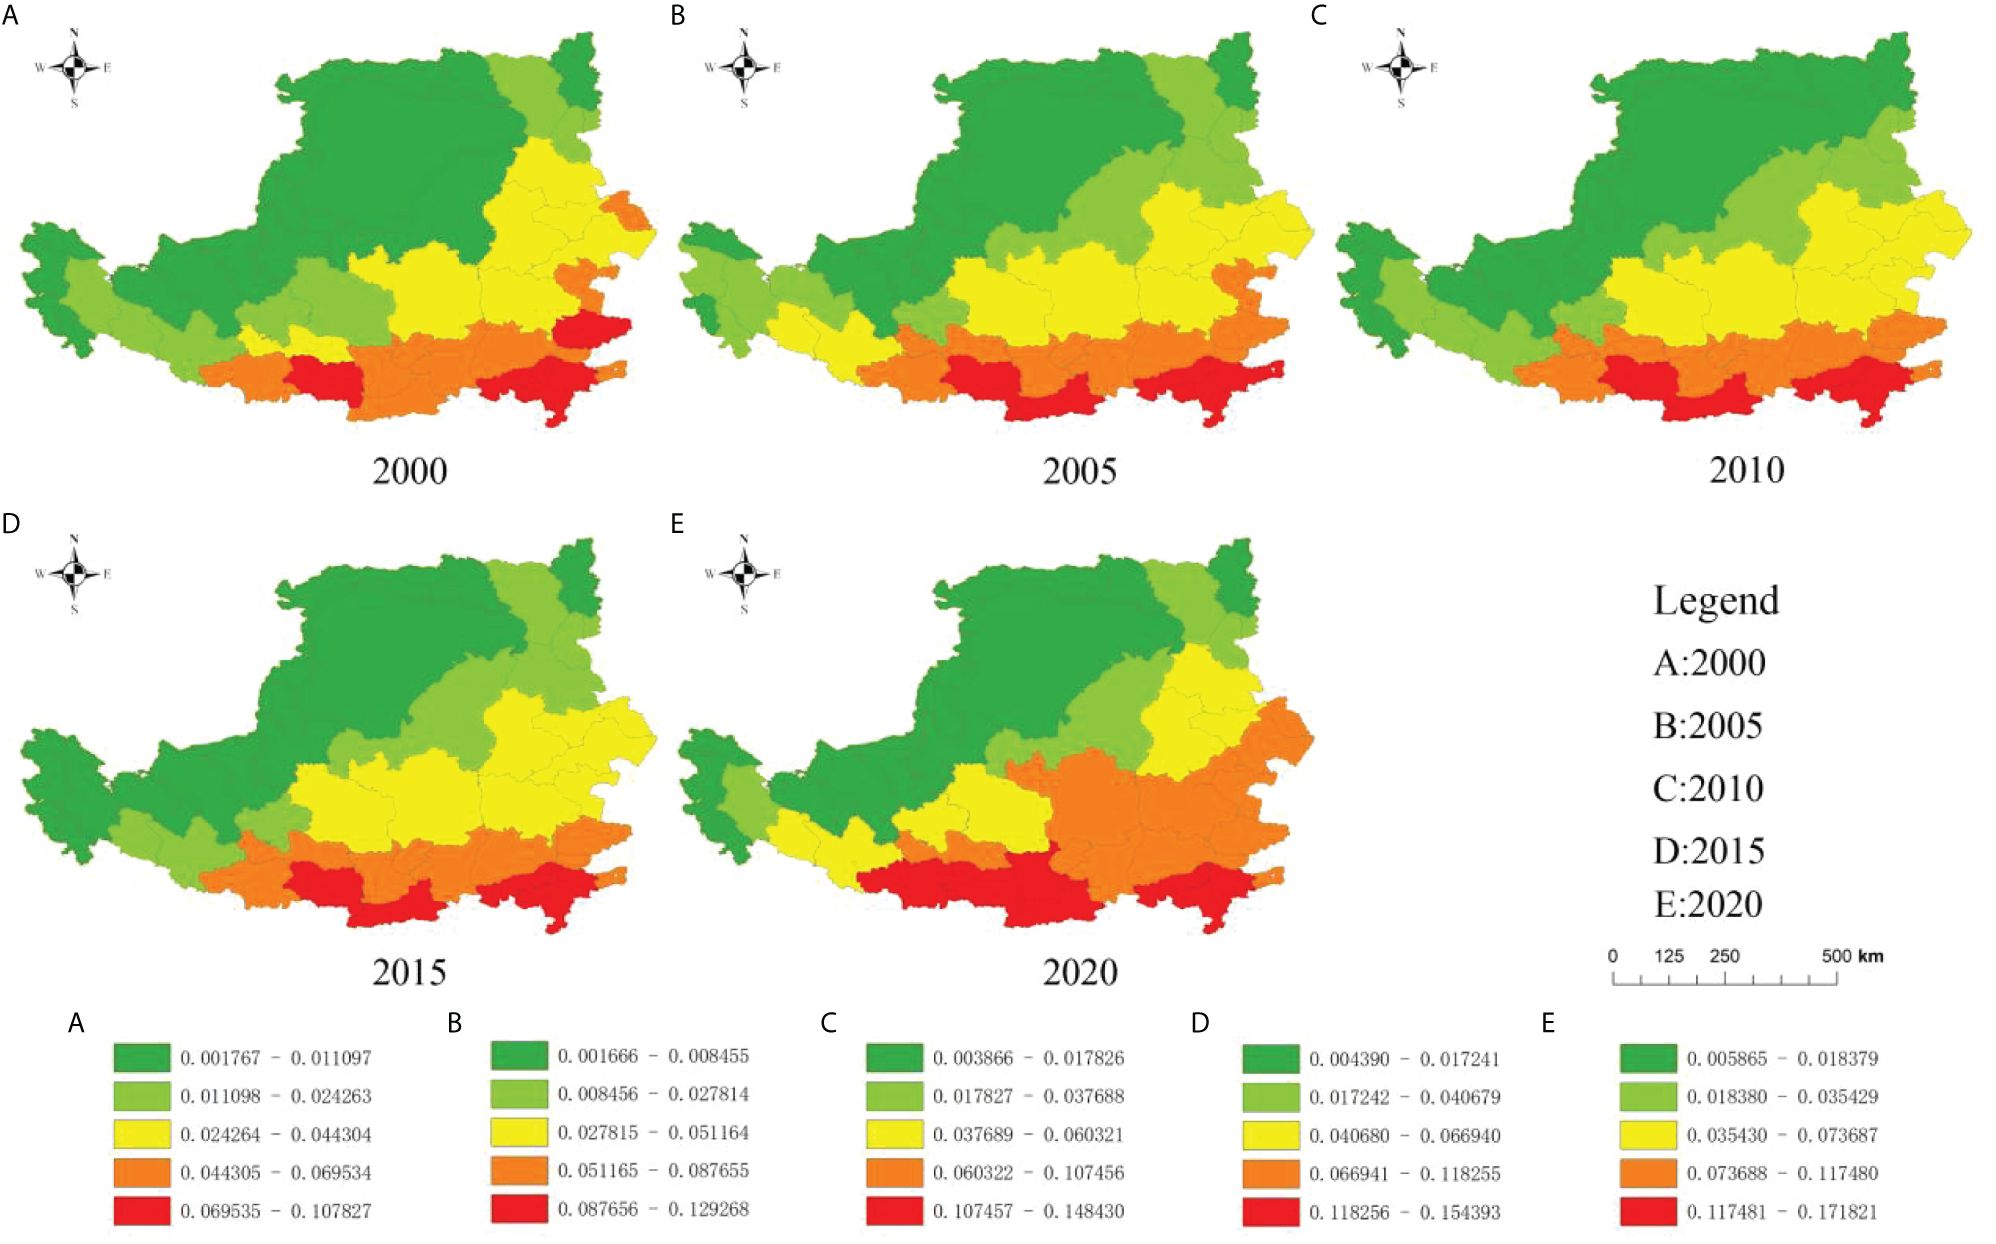
Figure 6 Spatial distribution of biodiversity index in the Loess Plateau.
From 2000 to 2020, the comprehensive service capacity index of the Loess Plateau increased steadily, by 34.81%. The comprehensive service capacity of the Loess Plateau shows the development trend of “improving-declining and improving again”, and the areas with better comprehensive service capacity of the Loess Plateau ecosystem in 2000 are mainly located in the southeast and a few western areas; from 2005 to 2020, the comprehensive service capacity of the Loess Plateau has gradually improved, and the coverage has developed from strip-like to regionalized. From 2005 to 2020, the biodiversity capacity of the Loess Plateau will be gradually improved, and the coverage will develop from strip-like to regionalized. The hotspots of the integrated ecosystem service capacity index are mainly distributed in Changzhi City, Jincheng City, Jiyuan City, Zhengzhou City, Luoyang City, Sanmenxia City, Xi’an City, Baoji City and Tongchuan City, etc. The spatial distribution of the biodiversity capacity index of the Loess Plateau from 2000 to 2020 shows that the integrated ecosystem service capacity index of the southeastern Loess Plateau region is stronger than that of other regions. With the proposal of China’s green development strategy and the gradual implementation of ecological engineering construction, the biodiversity capacity index of the southeastern and central regions of the Loess Plateau has been improved, showing a development trend of gradual expansion to the northwest and north (Figure 7).
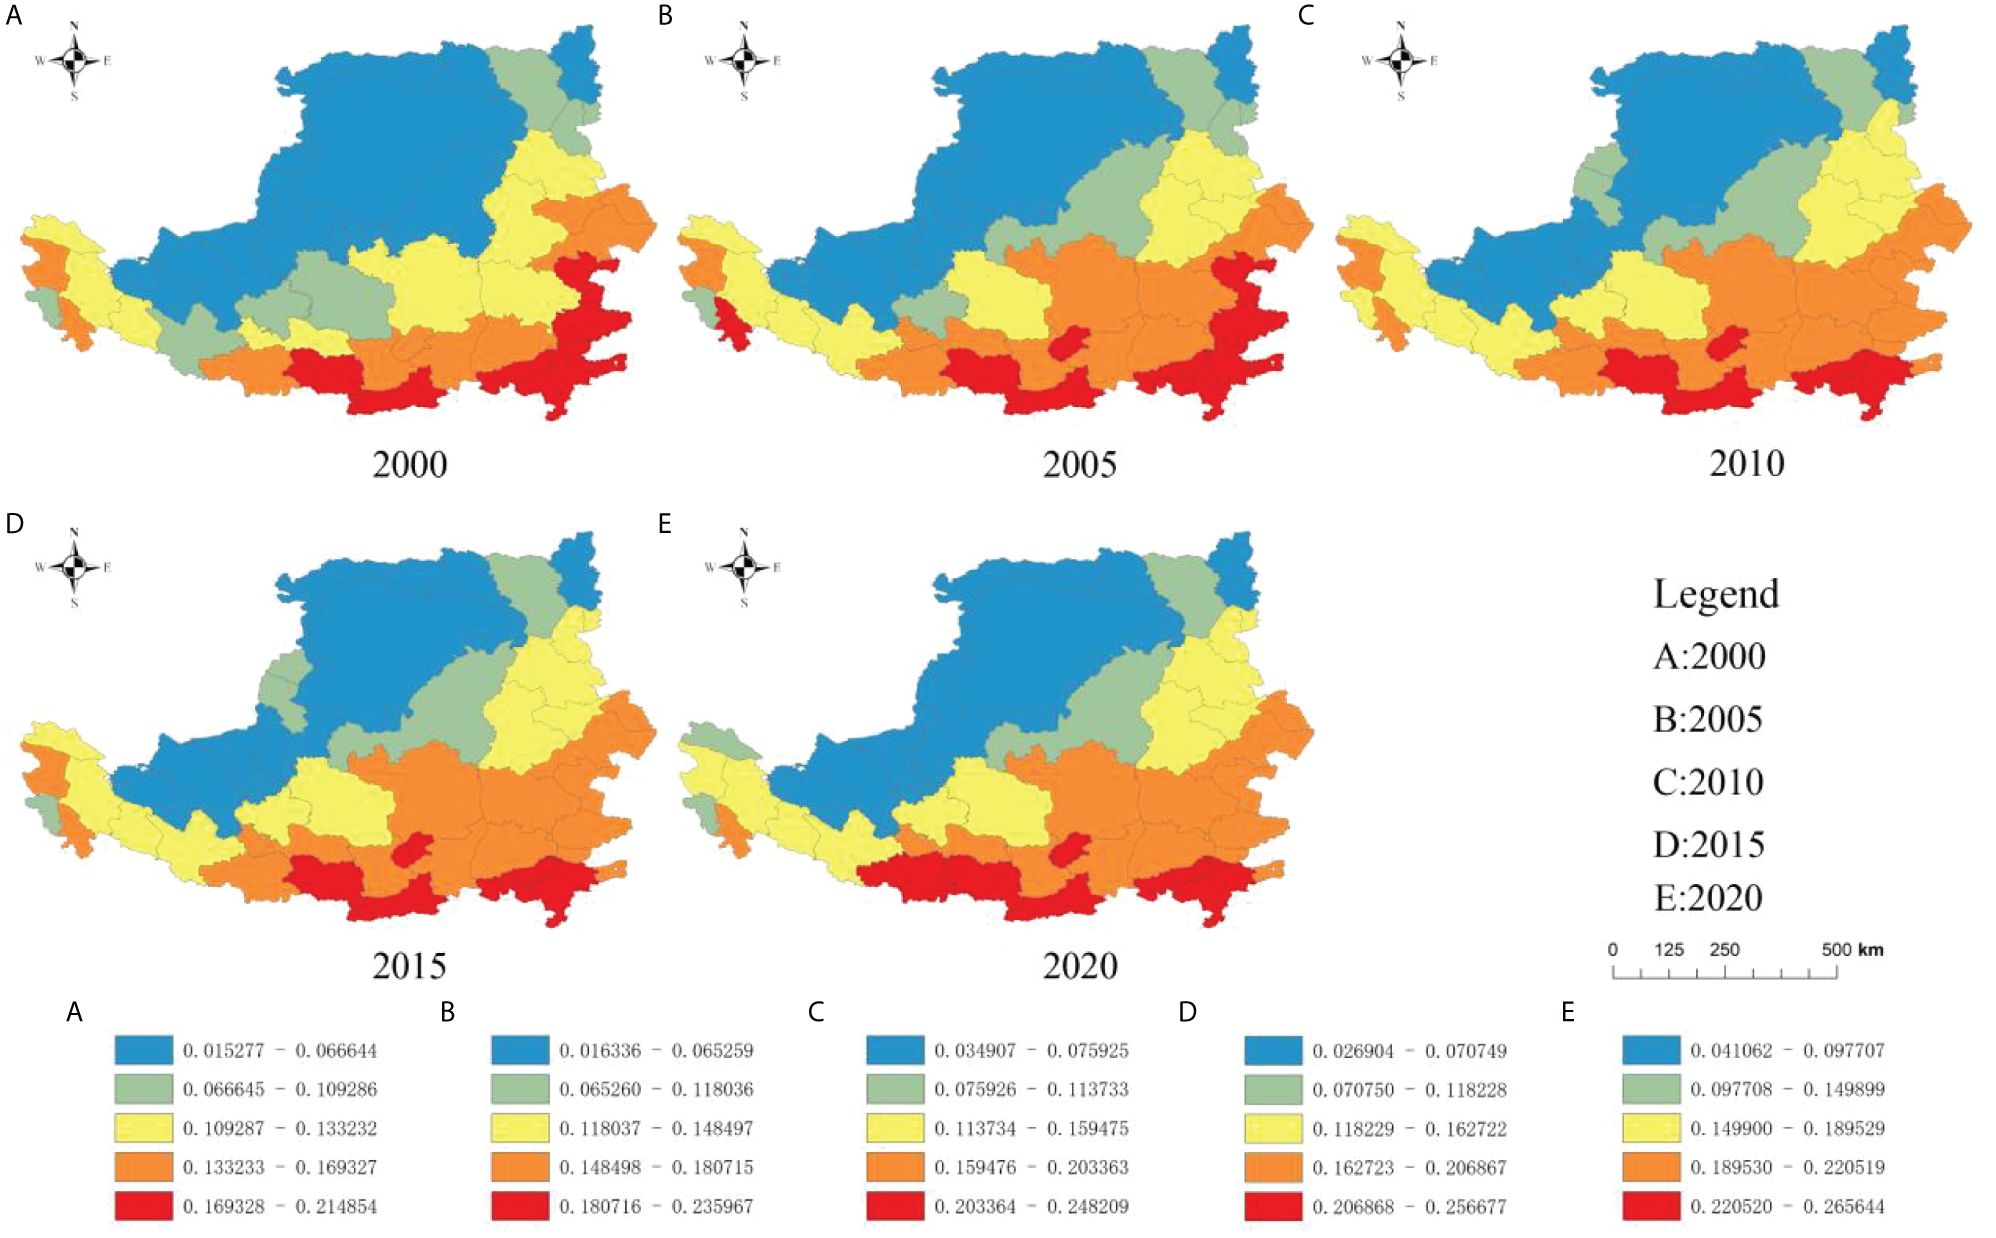
Figure 7 Spatial distribution of comprehensive service capacity of the Loess Plateau ecosystem.
Local spatial autocorrelation analysis of the Loess Plateau can further test the spatial dependence of the distribution of ecosystem service capacity indices and the spatial and temporal change characteristics of spatial heterogeneity. Using ArcGIS software, the hotspots were classified into five levels by using the natural intermittent classification method: cold spot zone, sub-cold spot zone, insignificant zone, sub-hot spot zone, and hot spot zone. Figure 7 shows the spatial and temporal changes of cold hotspots of various indices of ecosystem services in the Loess Plateau from 2000 to 2020. In 2000–2020, the hot and cold spots of the comprehensive service capacity index of the Loess Plateau showed a spatial pattern of hot in the south and cold in the north, and the hot spot areas developed from fragmentation to banded regionalization, which were distributed in Henan, Shaanxi and Shanxi Provinces in 2000, and were extended to Gansu Province, Inner Mongolia Autonomous Region and Ningxia Hui Autonomous Region, etc. in 2015; and the hot spots and sub-hotspots in Henan, Shaanxi and Shanxi Provinces It shows a spatial aggregation trend. Cold spots are mainly located in Inner Mongolia Autonomous Region and Ningxia Hui Autonomous Region, and the number of cold spots and sub-hot spots is gradually decreasing, and the number of insignificant areas is gradually decreasing.
The cold hotspot areas of the Loess Plateau water conservation capacity index show a spatial distribution of “hot in the south and cold in the north”, and the hotspot areas and sub-hotspot areas cycle from aggregation to fragmentation, with the hotspot areas and sub-hotspot areas spreading over the entire provinces of the Loess Plateau in 2000 and 2015; and the non-significant areas mainly focusing on Shanxi Province, northern Shaanxi and Inner Mongolia Autonomous Region in the central and eastern regions. The cold spots and sub-cold spots are located in the northern Inner Mongolia Autonomous Region and Gansu Province. The hot and cold spots of the Loess Plateau Biodiversity Capacity Index show a spatial variation of “hot in the south and cold in the north”, with hot spots and sub-hot spots accounting for the majority of the area; from 2010 to 2020, a strip-shaped ecological barrier will be formed in the southern part of the plateau, and sub-hot spots in the east-central part of the plateau will form an ecological barrier in the middle part of the plateau. In 2010–2020, the construction of ecological projects has begun to bear fruit, and the number of cold spots and insignificant zones is rapidly decreasing.
Loess Plateau windbreak and sand fixation capacity index, the hot spot area in Inner Mongolia Autonomous Region and Gansu Province, showing the spatial distribution of hot in the south and cold in the north. The hotspot areas are mainly concentrated in Gansu Province and scattered in Shanxi Province and Ningxia Hui Autonomous Region; the insignificant areas in 2000 and 2020 are concentrated in the central, western and southern regions, and the results of the ecological engineering construction from 2005 to 2015 show that the hotspot and sub-hotspot areas of the index of wind and sand conservation capacity of the Loess Plateau have increased, and the coldspot area and sub-coldspot area have decreased. The soil and water conservation capacity index of the Loess Plateau did not have drastic spatial and temporal changes under the influence of ecological engineering implementation. Hot spots and sub-hot spots were distributed in Shaanxi Province, Gansu Province, Shanxi Province and parts of Ningxia Hui Autonomous Region; cold spots and sub-cold spots were mainly distributed in Gansu Province, Ningxia Hui Autonomous Region and Shanxi Province (Figure 8).
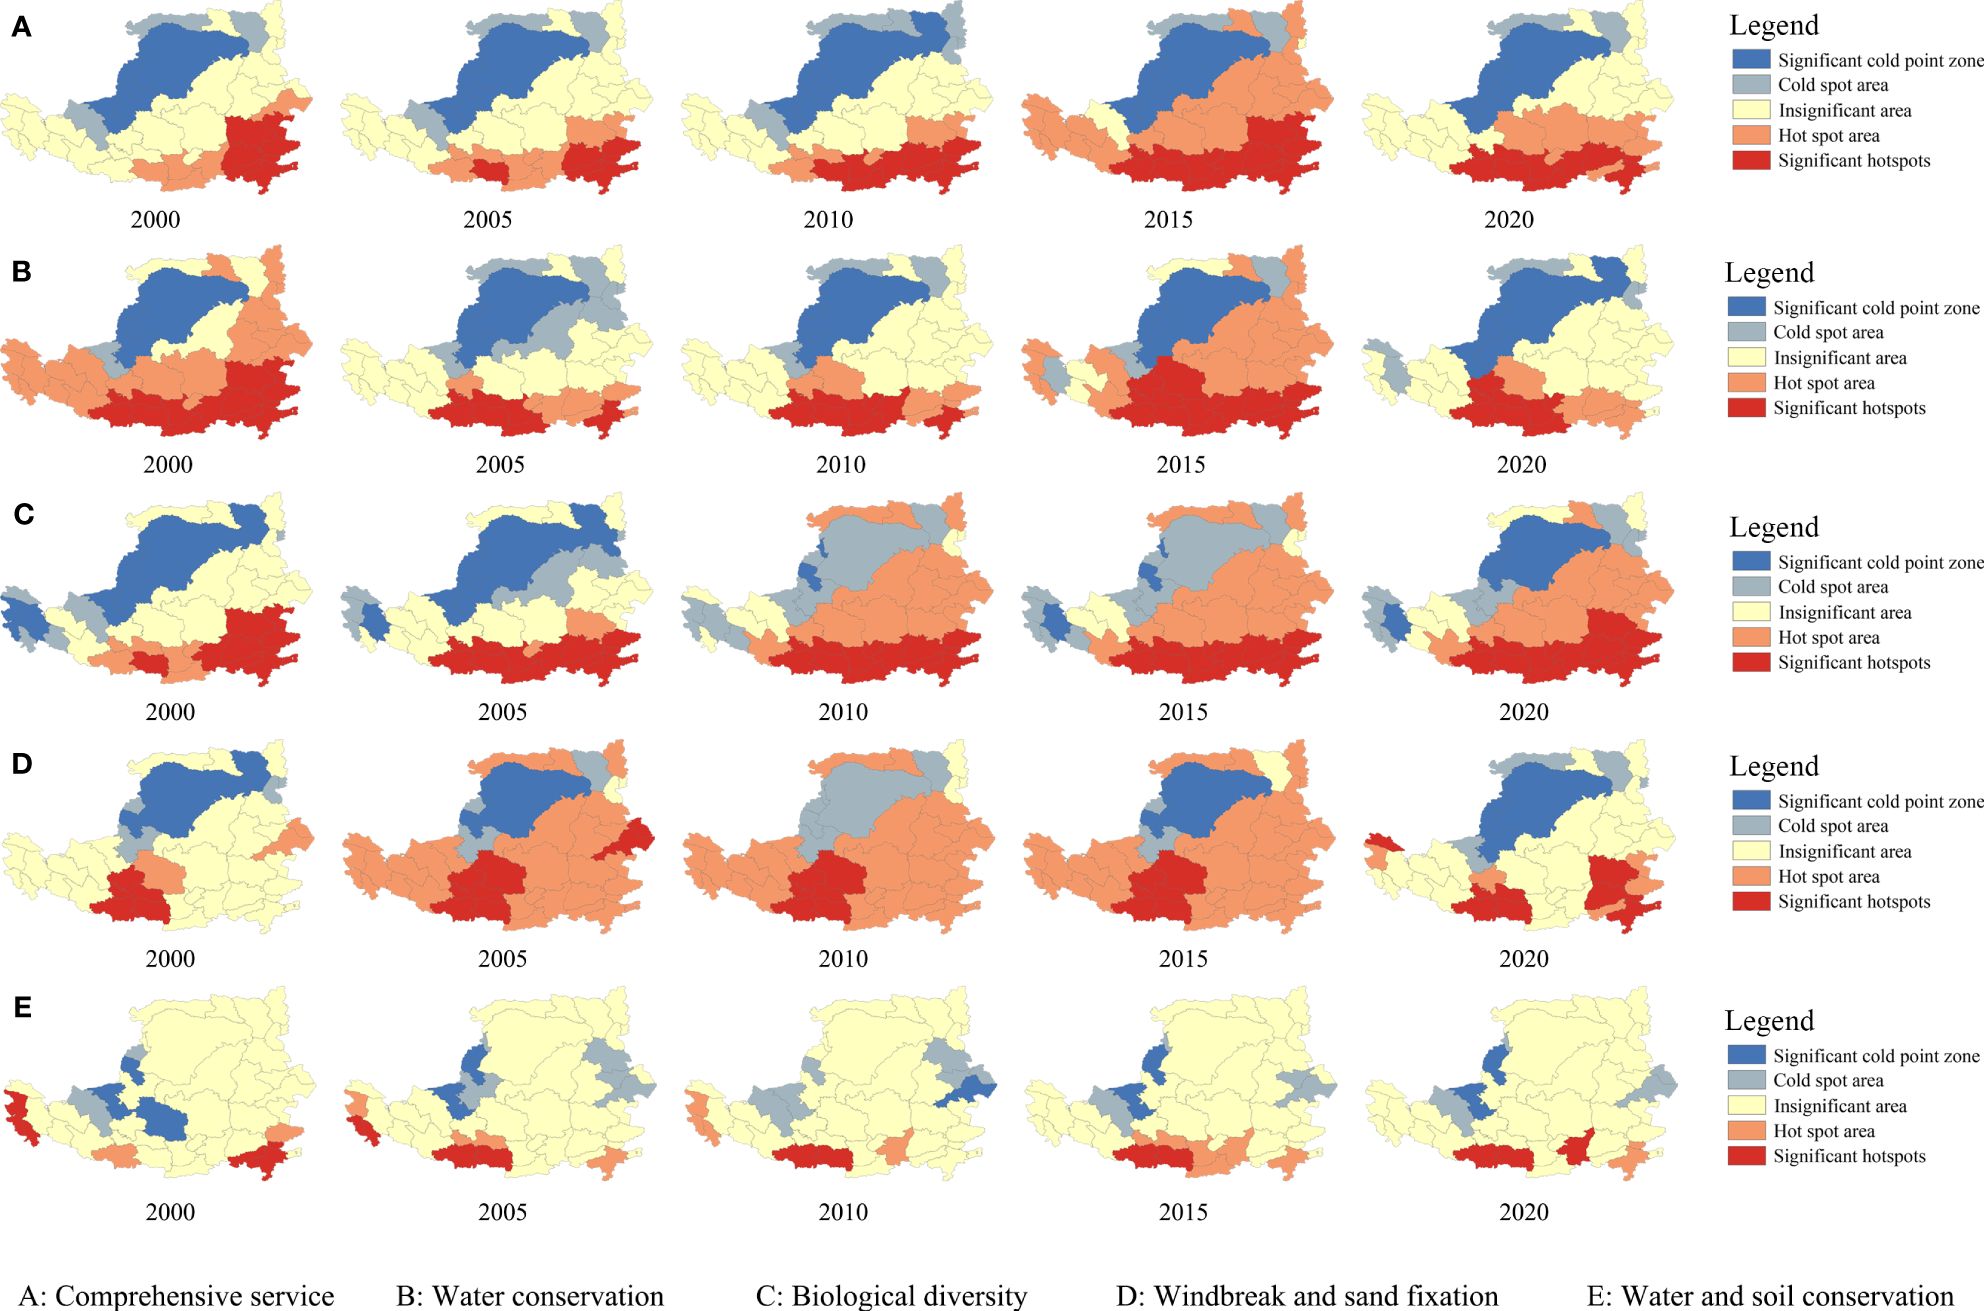
Figure 8 Cold and hot spots of the Loess Plateau ecosystem service capability index.
This paper analyzes the influencing factors of the ES capacity index of the Loess Plateau based on the two-way fixed-effects model, and the results are shown in Table 2: For every 1% increase in cumulative area of project implementation, urbanization rate and annual precipitation, its ecosystem service capacity will be increased by 0.0157%, 0.03%, and 0.0651% correspondingly, which has a positive impact on the improvement of the ecosystem service capacity index. For every 1% increase in population density and per capita Gross Domestic Product (GDP), the ecosystem service capacity of the Loess Plateau would decrease by 0.3159%, 0.0079% correspondingly, with a negative impact on its ecosystem service capacity index. Factors such as average annual temperature, total sown area of crops, and the proportion of cultivated area did not have a significant effect on the ecosystem service capacity of the study area. Changes in the ecosystem service capacity index of the Loess Plateau are influenced by the interaction of natural, social, economic and policy factors.
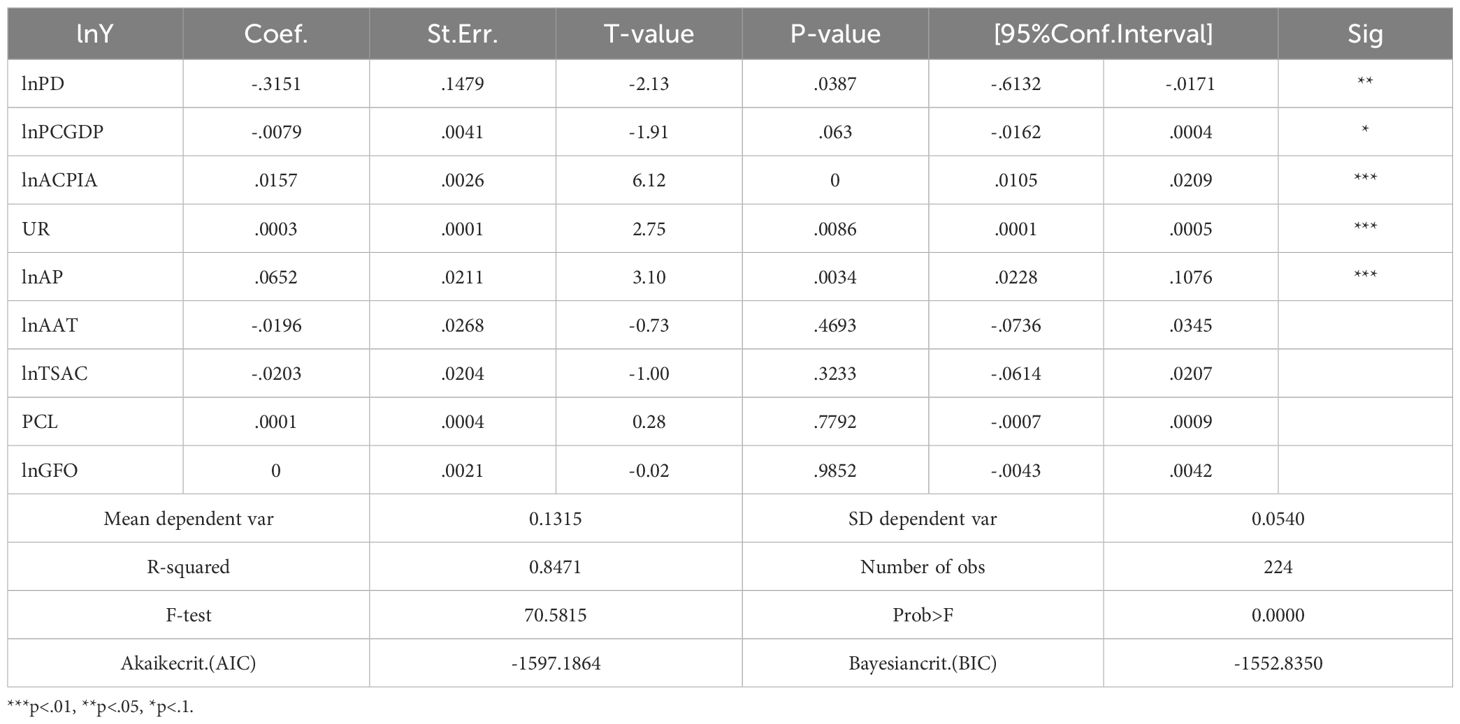
Table 2 Analysis results of bidirectional fixed effects.
After the implementation of the ecological project, the vegetation cover of the Loess Plateau has increased rapidly, and the ecological effect has been remarkable. during the period from 2000 to 2020, the ecosystem service capacity index of the Loess Plateau has increased by 43.02% as a whole, among which the indexes of water conservation, soil and water conservation, windbreak and sand stabilization, biodiversity and comprehensive service capacity have increased by 96.33%, 52.50%, 24.10%, 103.24% and 34.81%, respectively. 34.81%.
The implementation of ecological engineering is conducive to the enhancement of the value of ecosystem services and the scarcity value of ecosystem services; it reduces soil erosion and soil erosion and maintains the stability of various ecosystem service functions; spatially, ecological engineering directly or indirectly contributes directly and indirectly to more than 50% of the driving force of the ecological function in the study area from the local improvement to the overall optimization, which is fully proved by the previous studies (He et al., 2022; Hu et al., 2023), which provides a reference for the next step of ecological project implementation advancement. However, due to the rapid population growth in the Loess Plateau before 1999, before the implementation of the ecological project, the region had long been under the development strategy of “grain cultivation as the core”, and was engaged in deforestation and grassland reclamation, which led to ecological damage and habitat quality degradation (Xiu et al., 2021). Since 1999, the Chinese government has implemented the Natural Forest Conservation Program (NFCP) and the Green Program for Returning Farmland to Forests and Grasslands (GFGP) on the Loess Plateau, which have changed the approach to development and implemented a strategy of economic development and ecological conservation, and these ecological restoration activities have achieved positive ecological benefits. Since 2000 the Chinese government has implemented a new development strategy policy to reduce deforestation and lower grazing intensity, restore damaged natural ecosystems, combat desertification and improve environmental restoration of ecosystems by indigenous forest and grass plantations adapted to local conditions (Niu et al., 2019). In summary, the ecological project is a major ecological restoration program implemented in China on the Loess Plateau, including the two major ecological projects of the Natural Forest Conservation Program (NFCP) and the Returning Farmland to Forests and Grassland Program (GFGP), which has transformed the regional economic development model to liberate the surplus labor from the primary industry to the secondary and tertiary industries, and has promoted economic development and protected the ecological environment, but it may also exist in the Natural Forest Conservation Areas (NFCAs) and the However, there may also be problems such as population hollowing out and labor shortage in the areas where the GFGP is implemented, which deserve our in-depth study.
This paper analyzes the factors influencing the ecosystem service capacity index of the Loess Plateau, and the results show that for every 1% increase in cumulative project area, urbanization rate or annual precipitation, its ecosystem service capacity will be increased by 0.0157%, 0.03% and 0.0651% correspondingly. For every 1% increase in population density and per capita Gross Domestic Product (GDP), the ecosystem service capacity of the Loess Plateau will decrease by 0.3159%, 0.0079%.
Natural conditions such as climate, topography and soil type are important for vegetation growth. after 2000, rainfall and soil moisture in most parts of the Loess Plateau showed a positive increase, and the study area gradually became wetter, and the improvement of moisture conditions was favorable for vegetation growth, which well explains the sharp change in vegetation cover of the Loess Plateau in the face of the gradual increase in the area of cumulative project implementation (Similarly, the spatial heterogeneity of ecosystem services on the Tibetan Plateau is also affected by precipitation, temperature, DEM, slope and NDVI (Jia et al., 2023). With the increase in the cumulative area of ecological projects implemented, the increase in the area of vegetation cover promoted the ecosystem service capacity index of the Loess Plateau under suitable climatic conditions (He et al., 2022). In addition to climatic conditions, our results also showed that the urbanization rate of the Loess Plateau significantly affected multiple ecosystem service capacity indices in the region. This is consistent with previous studies that the implementation of two major ecological projects, natural forest protection (NFCP) and returning farmland to forest and grassland (GFGP), has reduced jobs in rural areas, forcing the transfer of surplus rural labor, and the ability of urbanization to absorb population transfer and employment in rural areas and surrounding counties, which has played an important role in driving rapid economic development (Zhang et al., 2023; Li R. et al., 2021b). In summary, this suggests that the increase in urbanization rate promotes the ecological function and habitat quality of non-urban areas to a certain extent, but the expansion of construction land use has changed the structure of ecological land use and agricultural land use, and reduced regional carbon sequestration and food supply. But the conversion of other land use types to construction land will be difficult to reverse the land type. Therefore, the expansion of construction land has long-term and cumulative negative impacts on the ecosystem.
In view of the special characteristics of the dry soil layer of the Loess Plateau, the influence of the weak soil water storage capacity of plantation forests, high soil porosity, low nutrient characteristics and single vegetation type, the construction of large-scale plantation vegetation leads to increased water vapor transpiration in the Loess Plateau, and the loss of soil moisture and the drying of the deeper soil layers may lead to the problem of obstacles to plant succession. Suggestions for future ecological projects are as follows; 1) the construction of artificial forests is based on local plants, which are highly adaptable and have a high survival rate; 2) the implementation of ecological projects should be fully demonstrated in terms of the feasibility of the local soil environment, so as to prevent large-scale restoration of introduced vegetation from causing secondary ecological damage; 3) the governmental departments should provide special funds for the maintenance of the vegetation and for the prevention of diseases and pests and the management of the vegetation; 4) to increase the income of residents in the areas of ecological projects and to strengthen publicity and education. (4) Improve the income of residents in the ecological project implementation area and strengthen publicity and education to prevent indiscriminate cutting and logging.
The implementation of ecological projects has contributed to the improvement of multiple ecosystem service capacity indices, including integrated services, wind and sand control, water conservation, biodiversity and soil and water conservation capacity indices. The success of ecological engineering implementation is attributed to climate change, urbanization and innovative ecological engineering system management that balances the requirements of targeted ecological security and socio-economic sustainability. In order to improve the actual performance of ecological restoration efforts to meet the needs of human development and protection of the natural environment, there is a need for an adaptive management paradigm that combines the “top-down” approach of governmental incentives with the “bottom-up” approach of local stakeholder incentives (Zhang et al., 2016).
(1) This paper estimates the ecosystem service capacity index of the Loess Plateau based on NPP data. There are differences in the measurement, transmission and acquisition of remote sensing data, and the results of the estimation are subject to certain errors. There is a relatively perfect theoretical method for ecosystem service assessment, but different ecosystem service assessment systems have not yet formed a unified assessment standard.
(2) This study analyzes the response of ecological engineering construction to the ecosystem service capacity index, but the Loess Plateau is vast, the ecosystem structure is complex, and the influence factors of the ecosystem service capacity index are obvious, so the influence factors selected in this paper cannot yet comprehensively and accurately reflect the change of the ecosystem service capacity index of the Loess Plateau, and the assessment of the ecosystem service capacity is only a relatively conservative estimate.
(3) This paper finds that after 2015, the impact of ecological engineering construction on the ecosystem service capacity index began to weaken, and the ecosystem service function of ecological engineering construction began to deteriorate after a certain period of vegetation growth, whether this trend will continue in the future, and the reasons for this trend are worth further in-depth study and discussion.
This paper constructs an ecosystem service capacity index model for the Loess Plateau from 2000 to 2020, analyzes the changes of its ecosystem service capacity index; analyzes the spatial changes of multiple ecosystem service capacity indices; and analyzes the influencing factors of the ecosystem service capacity index from the aspects of society, economy, nature and policy. It comprehensively assesses the changes of ecosystem service capacity index of the Loess Plateau, verifies the positive impact of ecological engineering construction on ecological restoration and ecosystem service capacity index enhancement in the Loess Plateau, verifies the necessity of adopting timely ecological engineering construction and ecological restoration by adaptive management methods, and at the same time draws the following conclusions of the study:
(1) The ecosystem service capacity of the Loess Plateau increased by 43.02% from 2000 to 2020, of which the water conservation service capacity increased by 96.33%, the soil and water conservation service capacity increased by 52.50%, the windbreak and sand fixation service capacity increased by 24.10%, the biodiversity maintenance service capacity increased by 103.24%, and the comprehensive service capacity increased by 34.81%.
(2) From 2000 to 2020, the ecosystem service capacity of each region of the Loess Plateau in each province is improved in the following magnitude: Ningxia > Inner Mongolia > Gansu > Shaanxi > Shanxi > Qinghai > Henan; from 2000 to 2005 and after 2015, the ecosystem service capacity index of the Loess Plateau is improved more.
(3) The improvement of the ecosystem service capacity index of the Loess Plateau is subject to the joint effect of natural ecology, socio-economic and policy-oriented factors, mainly the cumulative project implementation area, urbanization rate, annual precipitation and other factors have the greatest influence on the change of the ecosystem service capacity index.
(4) The vegetation cover of the Loess Plateau has been significantly increased by the impact of ecological engineering construction. On the basis of adhering to the red line of arable land and the two bottom lines of ecological safety, consolidating the results of ecological engineering construction and promoting the high-quality construction and management of ecological engineering in an orderly manner is the way to improve the ecosystem service capacity index of the Loess Plateau.
The original contributions presented in the study are included in the article/supplementary material. Further inquiries can be directed to the corresponding author.
LY: Formal analysis, Writing – original draft, Writing – review & editing, Data curation. MZy: Methodology, Writing – original draft, Writing – review & editing. XB: Funding acquisition, Writing – original draft, Writing – review & editing, Project administration. WYx: Conceptualization, Writing – original draft, Writing – review & editing.
The author(s) declare financial support was received for the research, authorship, and/or publication of this article. This research was funded by the central-level public welfare basic scientific research business funds (No.: CAFYBB2021ZB003).
The authors declare that the research was conducted in the absence of any commercial or financial relationships that could be construed as a potential conflict of interest.
All claims expressed in this article are solely those of the authors and do not necessarily represent those of their affiliated organizations, or those of the publisher, the editors and the reviewers. Any product that may be evaluated in this article, or claim that may be made by its manufacturer, is not guaranteed or endorsed by the publisher.
Amaliah E. N., Darnah D., Sifriyani S. (2020). Regresi data panel dengan pendekatan common effect model (cem), fixed effect model (fem) dan random effect model (rem)(studi kasus: persentase penduduk miskin menurut kabupaten/kota di kalimantan timur tahun 2015–2018). Estimasi: J. Stat Its Appl., 106–115. doi: 10.20956/ejsa.v1i2.10574
Bouzekri A., Alexandridis T. K., Toufik A., Rebouh N. Y., Chenchouni H., Kucher D., et al. (2023). Assessment of the spatial dynamics of sandy desertification using remote sensing in Nemamcha region (Algeria). The Egyptian J. Remote Sensing and Space Science 26 (3), 642–653. doi: 10.1016/j.ejrs.2023.07.006
Brain S. (2011). Song of the forest: Russian forestry and Stalinist environmentalism, 1905-1953. University of Pittsburgh Press.
Costanza R., d'Arge R., De Groot R., Farber S., Grasso M., Hannon B., et al. (1997). The value of the world’s ecosystem services and natural capital. Nature 387, 253–260. doi: 10.1038/387253a0
Darier É. (1996). Environmental governmentality: The case of Canada's green plan. Environmental Politics 5 (4), 585–606. doi: 10.1080/09644019608414294
DeFries R. (2008). Terrestrial vegetation in the coupled human-earth system: contributions of remote sensing. Annu. Rev. Environ. Resour. 33, 369–390. doi: 10.1146/annurev.environ.33.020107.113339
Dong Y., Yin D., Li X., Huang J., Su W., Li X., et al. (2021). Spatial–temporal evolution of vegetation NDVI in association with climatic, environmental and anthropogenic factors in the loess plateau, China during 2000–2015: quantitative analysis based on geographical detector model. Remote Sens. 13, 4380. doi: 10.3390/rs13214380
Emamian A., Rashki A., Kaskaoutis D. G., Gholami A., Opp C., Middleton N. (2021). Assessing vegetation restoration potential under different land uses and climatic classes in northeast Iran. Ecol. Indic. 122, 107325. doi: 10.1016/j.ecolind.2020.107325
Fabbri S., Grottoli E., Armaroli C., Ciavola P. (2021). Using high-spatial resolution UAV-derived data to evaluate vegetation and geomorphological changes on a dune field involved in a restoration endeavour. Remote Sens. 13 (10), 1987. doi: 10.3390/rs13101987
Fan X., Gao J., He P., Feng Y., Xu J., Hou P., et al. (2018). Ecological protection red line control plan based on ecological security issues. China Environmental Sci. (12), 4749–4754.
Fang L., Wang L., Chen W., Sun J., Cao Q., Wang S., et al. (2021). Identifying the impacts of natural and human factors on ecosystem service in the Yangtze and Yellow River Basins. J. Clean. Product. 314, 127995. doi: 10.1016/j.jclepro.2021.127995
Franzke C. L., Ciullo A., Gilmore E. A., Matias D. M., Nagabhatla N., Orlov A., et al. (2022). Perspectives on tipping points in integrated models of the natural and human earth system: cascading effects and telecoupling. Environmental Res. Letters 17 (1), 015004. doi: 10.1088/1748-9326/ac42fd
Gong H., Cao L., Duan Y., Jiao F., Xu X., Zhang M., et al. (2023). Multiple effects of climate changes and human activities on NPP increase in the Three-north Shelter Forest Program area. Forest Ecology and Management 529, 120732. doi: 10.1016/j.foreco.2022.120732
Halik Ü., Aishan T., Betz F., Kurban A., Rouzi A. (2019). Effectiveness and challenges of ecological engineering for desert riparian forest restoration along China’s largest inland river. Ecol. Eng. 127, 11–22. doi: 10.1016/j.ecoleng.2018.11.004
Hao C., Zhang X., Wang D., et al. (2023). Analysis of soil erosion change andinfluencing factors in the upper reaches of Beiluo River. Chin. Water Soil Conserv. Sci. (Chinese English) 21, 64–73.
He J., Jiang X., Lei Y., Cai W., Zhang J. (2022). Temporal and spatial variation and driving forces of soil erosion on the Loess Plateau before and after the implementation of the Grain-for-Green project: A case study in the Yanhe river basin, China. International J. Environmental Res. Public Health 19 (14), 8446. doi: 10.3390/ijerph19148446
He P., Ma J., Han Z., Shi M., Xu D., Zongjiu S., et al. (2022). Relationship between multi-scale climate factors and performance of ecological engineering on the Loess Plateau, China. J. Forestry Res. 33 (3), 789–800. doi: 10.1007/s11676-021-01343-7
Hu Y., Zhang S., Shi Y., Guo L. (2023). Quantifying the impact of the Grain-for-Green Program on ecosystem service scarcity value in Qinghai, China. Scientific Reports 13 (1), 2927. doi: 10.1038/s41598-023-29937-7
Huang W., Zhang Q. (2020). Selecting the optimal economic crop in minority regions with the criteria about soil and water conservation. Agricultural Water Management 241, 106295.
Jia Z., Wang X., Feng X., Ma J., Wang X., Zhang X., et al. (2023). Exploring the spatial heterogeneity of ecosystem services and influencing factors on the Qinghai Tibet Plateau. Ecol. Indic. 154, 110521. doi: 10.1016/j.ecolind.2023.110521
Kim D. (2019). Estimation of wealth and income effect utilizing two-way fixed effect model and policy implications. J. Housing Urban Finance 4 (2), 27–49.
Li C., Huang F. (2020). Analysis of the spatial and temporal evolution of PM2. 5 pollution in China during COVID-19 epidemic. In 2020 International Conference on Big Data, Artificial Intelligence and Internet of Things Engineering (ICBAIE) pp. 17–24. (IEEE).
Li P., Wang J., Liu M., Xue Z., Bagherzadeh A., Liu M. (2021). Spatio-temporal variation characteristics of ndvi and its response to climate on the loess plateau from 1985 to 2015. Catena 203, 105331. doi: 10.1016/j.catena.2021.105331
Li R., Shi Y., Feng C. C., Guo L. (2021a). The spatial relationship between ecosystem service scarcity value and urbanization from the perspective of heterogeneity in typical arid and semiarid regions of China. Ecol. Indic. 132, 108299. doi: 10.1016/j.ecolind.2021.108299
Li R., Zheng H., O’Connor P., Xu H., Li Y., Lu F., et al. (2021b). Time and space catch up with restoration programs that ignore ecosystem service trade-offs. Sci. Adv. 7, eabf8650. doi: 10.1126/sciadv.abf8650
Li S. (2022). World Key Ecological Project - Korea Mountain Greening Plan. Land Greening (11), 67–69.
Lian H. G., Qu Z. M., Liu C. F., He X. (2023). Spatio-temporal evolution of landscape pattern and its response to windbreak and sand fixation service in Hexi Corridor of northern sand-prevention belt. Chinese J. Applied Ecol. (09), 2518–2526.
Ma B., Jing J., Liu B., Xu Y., Dou S., He H. (2022). Quantitative assessment of the relative contributions of climate change and human activities to npp changes in the southwest karst area of China. Environ. Sci. Pollut. Res. 29, 80597–80611. doi: 10.1007/s11356-022-21433-1
Ma Z., Guo J., Li W., Cai Z., Cao S. (2021). Regional differences in the factors that affect vegetation cover in China. Land Degradation Development 32 (5), 1961–1969.
Mcdonald T. (2012). Song of the forest: Russian forestry and stalinist environmentalism 1905–1953. Environ. History 18, 223–225.
Morris C., Arbuckle J. G. (2021). Conservation plans and soil and water conservation practice use: Evidence from Iowa. J. Soil Water Conserv. 76 (5), 457–471.
Niu Q., Xiao X., Zhang Y., Qin Y., Dang X., Wang J., et al. (2019). Ecological engineering projects increased vegetation cover, production, and biomass in semiarid and subhumid northern China. Land Degrad. Dev. 30, 1620–1631. doi: 10.1002/ldr.3351
Qu S., Wang L., Lin A., Yu D., Yuan M. (2020). Distinguishing the impacts of climate change and anthropogenic factors on vegetation dynamics in the Yangtze River Basin, China. Ecol. Indic. 108, 105724. doi: 10.1016/j.ecolind.2019.105724
Reid W. V., Mooney H. A., Cropper A., Capistrano D., Carpenter S. R., Chopra K., et al. (2005). Ecosystems and human well-being - synthesis: a report of the millennium ecosystem assessment. Island Press.
Saunders P. R. (1980). A system for uniform recreation use monitoring and reporting on the Arapaho and Roosevelt National Forest and Pawnee National Grassland. A system for uniform recreation use monitoring and reporting on the Arapaho and Roosevelt National Forest and Pawnee National Grassland., (20).
Sheng J., Wang T. T., Kun C., et al. (2022). Take Yixing City, Jiangsu province as an example. Environ. Monit. early warn. 14, 82–87.
Sun R., Chen S., Su H., Hao G. (2019). Spatiotemporal variation of vegetation coverage and its response to climate change before and after implementation of Grain for Green Project in the Loess Plateau. In IGARSS 2019-2019 IEEE International Geoscience and Remote Sensing Symposium (IEEE). pp. 9546–9549.
Wang N., Bi H., Peng R., Zhao D., Liu Z. (2023). Disparities in soil and water conservation functions among different forest types and implications for afforestation on the Loess Plateau. Ecol. Indic. 155, 110935. doi: 10.1016/j.ecolind.2023.110935
Wang X., Zhang K., Li J., Li Q., Na W., Gao Y., et al. (2024). Response of soil water in deep dry soil layers to monthly precipitation, plant species, and surface mulch in a semi-arid hilly loess region of China. Agric. Water Manage. 291, 108612. doi: 10.1016/j.agwat.2023.108612
Weiskopf S. R., Rubenstein M. A., Crozier L. G., Gaichas S., Griffis R., Halofsky J. E., et al. (2020). Climate change effects on biodiversity, ecosystems, ecosystem services, and natural resource management in the United States. Sci Total Environment 733, 137782.
Wu D. (2020). Spatially and temporally varying relationships between ecological footprint and influencing factors in China’s provinces Using Geographically Weighted Regression (GWR). J. Clean. Product. 261, 121089. doi: 10.1016/j.jclepro.2020.121089
Xiu L., Yao X., Chen M., Yan C. (2021). Effect of ecological construction engineering on vegetation restoration: A case study of the loess plateau. Remote Sens. 13, 1407. doi: 10.3390/rs13081407
Xu B., Lin B. (2020). Investigating drivers of CO2 emission in China’s heavy industry: a quantile regression analysis. Energy 206, 118159. doi: 10.1016/j.energy.2020.118159
Xue Y., Liang H., Zhang H., Yin L., Feng X. (2023). Quantifying the policy-driven large scale vegetation restoration effects on evapotranspiration over drylands in China. J. Environmental Management 345, 118723. doi: 10.1016/j.jenvman.2023.118723
Yan K., Wang W., Li Y., Wang X., Jin J., Jiang J., et al. (2022). Identifying priority conservation areas based on ecosystem services change driven by natural forest protection project in Qinghai province, China. J. Clean. Productn. 362, 132453. doi: 10.1016/j.jclepro.2022.132453
Yang M., Chen L., Wang J., Msigwa G., Osman A. I., Fawzy S., et al. (2023). Circular economy strategies for combating climate change and other environmental issues. Environmental Chemistry Letters 21(1), 55–80.
Yu Q., Lu H., Yao T., Xue Y., Feng W. (2023). Enhancing sustainability of vegetation ecosystems through ecological engineering: a case study in the Qinghai-Tibet Plateau. J. Environ. Manage. 325, 116576. doi: 10.1016/j.jenvman.2022.116576
Zhai J., Wang L., Liu Y., Wang C., Mao X. (2023). Assessing the effects of China’s Three-North Shelter Forest Program over 40 years. Science Total Environment 857, 159354. doi: 10.1016/j.scitotenv.2022.159354
Zhang X., Liu Y., Wang Y., Yuan X. (2023). Interactive relationship and zoning management between county urbanization and ecosystem services in the Loess Plateau. Ecol. Indic. 156, 111021. doi: 10.1016/j.ecolind.2023.111021
Keywords: Loess plateau, ecosystem service capacity index, fixed effects model, cold and hot spot space analysis, spatial correlation analysis
Citation: Yuan L, Zhong yuan M, Bin X and Yu xuan W (2024) Analysis of changes in ecosystem capacity index and driving factors in the Loess Plateau under ecological engineering orientation. Front. Ecol. Evol. 12:1404424. doi: 10.3389/fevo.2024.1404424
Received: 21 March 2024; Accepted: 12 June 2024;
Published: 26 July 2024.
Edited by:
Kang Di, China West Normal University, ChinaReviewed by:
Huakun Zhou, Chinese Academy of Sciences (CAS), ChinaCopyright © 2024 Yuan, Zhong yuan, Bin and Yu xuan. This is an open-access article distributed under the terms of the Creative Commons Attribution License (CC BY). The use, distribution or reproduction in other forums is permitted, provided the original author(s) and the copyright owner(s) are credited and that the original publication in this journal is cited, in accordance with accepted academic practice. No use, distribution or reproduction is permitted which does not comply with these terms.
*Correspondence: Wan Yu xuan, d2FueXV4dWFuQGNhZi5hYy5jbg==
Disclaimer: All claims expressed in this article are solely those of the authors and do not necessarily represent those of their affiliated organizations, or those of the publisher, the editors and the reviewers. Any product that may be evaluated in this article or claim that may be made by its manufacturer is not guaranteed or endorsed by the publisher.
Research integrity at Frontiers
Learn more about the work of our research integrity team to safeguard the quality of each article we publish.