 Noah J. Hunt
 Thomas Ibanez
 Adam A. Pack
 Patrick J. Hart
- 1Hawai‘i Cooperative Studies Unit, University of Hawai‘i at Hilo, Hilo, HI, United States
- 2Listening Observatory for Hawaiian Ecosystems (LOHE) Laboratory, University of Hawai‘i at Hilo, Hilo, HI, United States
- 3AMAP, Univ Montpellier, CIRAD, CNRS, INRAE, IRD, Montpellier, France
- 4Department of Biology, University of Hawai‘i at Hilo, Hilo, HI, United States
- 5Department of Psychology, University of Hawai‘i at Hilo, Hilo, HI, United States
Birds use sound for conspecific communication. According to the acoustic niche hypothesis, they avoid signal competition with other species by partitioning sound in frequency and time. Others have observed introduced species changing the vocal behavior of native species; however, community-level effects of multiple introduced species remain unknown. Hawai‘i, with its legacy of bird extinctions followed by a surge of human introductions, offers a unique opportunity to study acoustic signal partitioning between native and introduced species. We predicted that communities with higher percentages of introduced birds would exhibit more acoustic overlap between members of different species due to shorter time frames to evolve signal partitioning. Using autonomous recording units, we recorded forest bird communities during the summer in montane primary and secondary forests as well as a low-elevation agricultural site. Random samples of recordings from each site were visualized as spectrograms, and all bird vocalizations ≥5 decibels above background noise were identified and labeled by species. Frequency range and the proportion of overlap with other species were compared between native and introduced species. We also used a null model which randomized the start time of each bird vocalization within a location over 500 iterations, then compared the amount of heterospecific signal overlap in the randomizations to that observed in the recordings. While native and introduced species generally used similar frequency ranges, native-native heterospecific species vocalization pairs had a significantly higher proportion of overlap than introduced-native and native-native pairs. Additionally, the incidence of signal overlap in the original recordings tended to be lower than in the null model randomizations, but this difference was not significant, and was not influenced by the percentage of introduced species vocalizations at the site. The lack of significant difference between observed and null model signal overlap occurrence suggests that native and introduced forest birds were not partitioning acoustic space either spectrally or temporally, and that introduced birds are not strongly influencing signal partitioning in forest bird communities of Hawai‘i. However, this may have been a consequence of recording during the non-breeding season, and future work should compare vocal activity in native and introduced birds throughout the year.
1 Introduction
Across the animal kingdom, species use acoustic signals for various functions, including attracting mates, defending territories, contacting family members, alarming conspecifics of danger, and finding food (Busnel, 1977; Bradbury and Vehrencamp, 2011). Sympatric species vocalizing in overlapping territories can, in theory, also overlap in their use of acoustic space, creating a potentially “noisy” soundscape, or acoustic environment, and complicating signal recognition (Busnel, 1977). Under the acoustic niche hypothesis, each vocalizing species avoids interference from other species within their soundscape by adjusting the frequency and/or timing of their signals (Krause, 1993). For example, in highly biodiverse assemblages of birds (Planqué and Slabbekoorn, 2008; Luther, 2009), frogs (Duellman and Pyles, 1983; Chek et al., 2003), fish (Ruppé et al., 2015), and insects (Sueur, 2002; Schmidt et al., 2012), signals with overlapping frequencies appear naturally selected to occur at different times, and those signals that occur simultaneously appear naturally selected to occupy different frequency bandwidths, presumably to avoid acoustic overlap between species.
Introducing novel sounds into these soundscapes, or acoustic environments, however, can disrupt this balance (Hopkins et al., 2022). Anthropogenic noise can induce changes in native species behaviors and potentially compromise their fitness if these changes reduce the quality of their signals (Slabbekoorn and Ripmeester, 2008). Similarly, vocalizing invasive species have been demonstrated to infiltrate native species’ acoustic niches, causing them to modify their natural vocalizations through changes in frequency, timing (Bleach et al., 2015), and/or loudness (Both and Grant, 2012; Tennessen et al., 2016; Medeiros et al., 2017). Such changes may have adverse effects, including compromising foraging opportunities, weakening territorial defense, and/or negatively impacting pairing success. Alternatively, failing to respond to invasive species signals may result in greater vulnerability to predation (Hopkins et al., 2022), or signal masking, which can also lead to reduced breeding success and survival (Bradbury and Vehrencamp, 2011, cited in Staniewicz et al., 2023).
Above all, negative impacts on native species’ reproductive success are among the most impactful consequences of invasive species noise (Both and Grant, 2012; Bleach et al., 2015; Tennessen et al., 2016; Medeiros et al., 2017; Hopkins et al., 2022). In Brazil’s Atlantic forest, for example, experimental playback of invasive American bullfrogs (Lithobates catesbeianus) caused native treefrogs (Hypsiboas albomarginatus) to increase their frequencies during and after playback calls, and decrease call duration following playback; changes that could compromise signaling of male quality vital to mate selection (Both and Grant, 2012). However, novel sound stimuli in general, rather than invasive species calls specifically, may be sufficient to induce similar behavioral responses (Hopkins et al., 2023). A later study found that four native Brazilian frog species changed their calls both in time and frequency from bullfrog, native frog, and white noise sounds, regardless of whether they spectrally overlapped with them or not (Medeiros et al., 2017). Similarly, in Australia, one native frog species altered its calling rate in response to introduced cane toad (Rhinella marina) playback, but also to native frog and lawn mower noise playback (Bleach et al., 2015). Green treefrogs (Hyla cinerea) in North America likewise decreased call length and increased amplitude in response to both invasive Cuban treefrog (Osteopilus septentrionalis) and white noise within the same frequency range, but not white noise beyond this range (Tennessen et al., 2016). Therefore, it may be the frequency bandwidth (Littlejohn and Martin, 1969; Tennessen et al., 2016), amplitude (Hopkins et al., 2023), and/or timing (Bleach et al., 2015) of introduced sounds, and less so their biotic or abiotic origin, that elicits an inhibitory response. Regardless, introduced sounds found to elicit changes in native male advertisement calls may compromise their attractiveness to females (Both and Grant, 2012; Bleach et al., 2015; Tennessen et al., 2016), and their inability to completely avoid overlap may compromise their signal clarity (Brumm et al., 2004; Bleach et al., 2015).
New vocal behaviors may also be energetically suboptimal (Both and Grant, 2012; Bleach et al., 2015), or reflect natural behaviors becoming suboptimal. When a native species must increase its amplitude to be heard above the noise, it may also decrease its call duration to compensate for additional energy expenditure (Tennessen et al., 2016). Alternatively, it may increase the calling rate between the calls of the invading species (Bleach et al., 2015). While animals appear to have some behavioral plasticity allowing them to adjust to novel noises in their environment, hard-wired species-specific strategies, such as decreasing the frequency of their vocalizations to optimize transmission through vegetation, can also result in increased overlap with other species (Medeiros et al., 2017) decreasing signal-to-noise ratio (Brumm et al., 2004).
When an invasive species becomes an abundant, loud, and dominant contributor to the soundscape, its potential for signal overlap with native species, and by extension, its potential impact on them, increases. For example, Farina et al. (2013) and Farina and Pieretti (2014) demonstrated that native Eurasian Blackcaps (Sylvia atricapilla) temporally shifted their songs in response to introduced Red-Billed Leiothrix (Leiothrix lutea) songs in Northern Italy. One might predict that native species in ecosystems having multiple acoustic invaders would face even more complex challenges, as the constraints of signal competition arise from different directions spectrally and temporally. However, to our knowledge, the simultaneous impacts of multiple introduced species on acoustic communities has so far not been investigated.
Hawai‘i presents a unique opportunity to explore whether introduced species influence native species communication, due to the collapse of its avian communities, and its menagerie of introduced bird species. Of its 87 known native forest bird species, only 26 remain today (Department of Land and Natural Resources, Division of Forestry and Wildlife: Wildlife Program, 2023). By the early 20th Century, the noticeable loss of bird song motivated government organizations and naturalization societies such as the Hui Manu to introduce exotic bird species to Hawai‘i, some specifically chosen for their hardiness and melodious songs (Berger, 1974; Foster, 2009, cited therein). While most failed to establish (Foster, 2009), Warbling White-eye (Zosterops japonicus), Northern Cardinal (Cardinalis cardinalis), House Finch (Haemorhous mexicanus), Red-Billed Leiothrix, and many others have become the most abundant bird species in Hawaiian lowland forests (Pratt, 1994; Spiegel et al., 2006; Pyle and Pyle, 2017; Kendall et al., 2023). Meanwhile, the few remaining Hawaiian forest bird species today face threats from invasive predators, avian malaria, and habitat degradation and fragmentation (Banko and Banko, 2009; Paxton et al., 2018). To date, there is no published information on whether introduced species are influencing native bird communication in Hawai‘i.
Recently, Hart et al. (2021) found that a high degree of frequency overlap among 10 forest bird species in Hawai‘i (both native and introduced) was compensated for by temporal partitioning of vocalizations, such that there was less simultaneous overlap in frequency and time than expected by chance. However, interactions between native and introduced species were not within the scope of their study. There is a noticeable gradient in representation of introduced bird species across Hawaiian communities, with generally the highest densities of introduced birds in lowland, non-forested habitats such as agricultural fields, and lower densities in high-elevation, contiguous native forest (Foster, 2009). In the present study, we sought to answer whether the representation of introduced bird species is associated with the degree of acoustic niche partitioning in avian communities on the windward slope of Mauna Kea, hosting the greatest diversity of native forest birds in the Hawaiian Islands, using autonomous recording units (ARUs). Few other studies have tested the acoustic niche hypothesis in communities with multiple introduced avian vocalists, despite the evidence of introduced birds influencing native bird communication (Farina et al., 2013). Azar and Bell (2016) observed differences in the dispersion of vocalization parameters between introduced and native New Zealand birds, based on Principal Component Analysis, however they did not evaluate acoustic niche partitioning in real time.
We defined acoustic niche partitioning as signals overlapping simultaneously in frequency and time less often than expected if the signals were delivered randomly. We tested this using a null model created from randomizing the start times of vocalizations. We expected to find the most acoustic overlap in the sites dominated by introduced species, due to the short time frame (within the last century, Pyle and Pyle, 2017) for introduced vocalists and native birds to evolve differences in their vocalization structures. Conversely, we expected the least amount of acoustic overlap in the native-dominant forest bird communities, given the longer timeframe (thousands to millions of years, Lerner et al., 2011) for acoustic partitioning to develop among native species. Alternatively, we could also observe birds sharing their use of frequency and timing, which would support the acoustic clustering hypothesis (Tobias et al., 2014; Kleyn et al., 2021) in which species in avian communities converge in signal structure due to shared constraints in the acoustic environment and interspecific interactions.
2 Methods
2.1 Song meter deployment and site characteristics
Sixteen Song Meter (SM4 Wildlife Acoustics Inc.) stations (Figure 1) were deployed across a variety of vegetation types at Hakalau Forest National Wildlife Refuge (hereafter, Hakalau, 19.832°N, 155.285°W) and a coffee (Coffea arabica, Rubiaceae) and cacao (Theobroma cacao, Malvaceae) orchard in Pauka‘a (19.765°N, 155.119°W) to capture a diversity in community composition with different percentages of introduced bird species. Hakalau stations were in closed ‘Ōhi‘a (Metrosideros polymorpha, Myrtaceae) wet forest, closed Koa (Acacia koa, Fabaceae)-‘Ōhi‘a wet forest, closed Koa-‘Ōhi‘a mesic forest, open Koa-‘Ōhi‘a wet forest, and open Koa-‘Ōhi‘a mesic forest, whereas Pauka‘a stations were among cultivated agriculture (Table 1) based on land classification data from the Hawai‘i Gap Analysis Project (2001 imagery, open access) and ground truthing. Recordings were collected from June 1 to August 31, 2022. Due to the limited number of Song Meters, some stations were on rotating two-week schedules with others and thus had staggered recording dates, whereas others recorded continuously. All devices recorded for a minimum of 22 days per station. Stations were spaced a minimum of 150 m from each other to avoid detecting the same vocalizations twice, except however, at Pauka‘a; due to limited space, some stations were placed only 75 m apart and were set to record on alternate two-week schedules from their nearest neighbors.
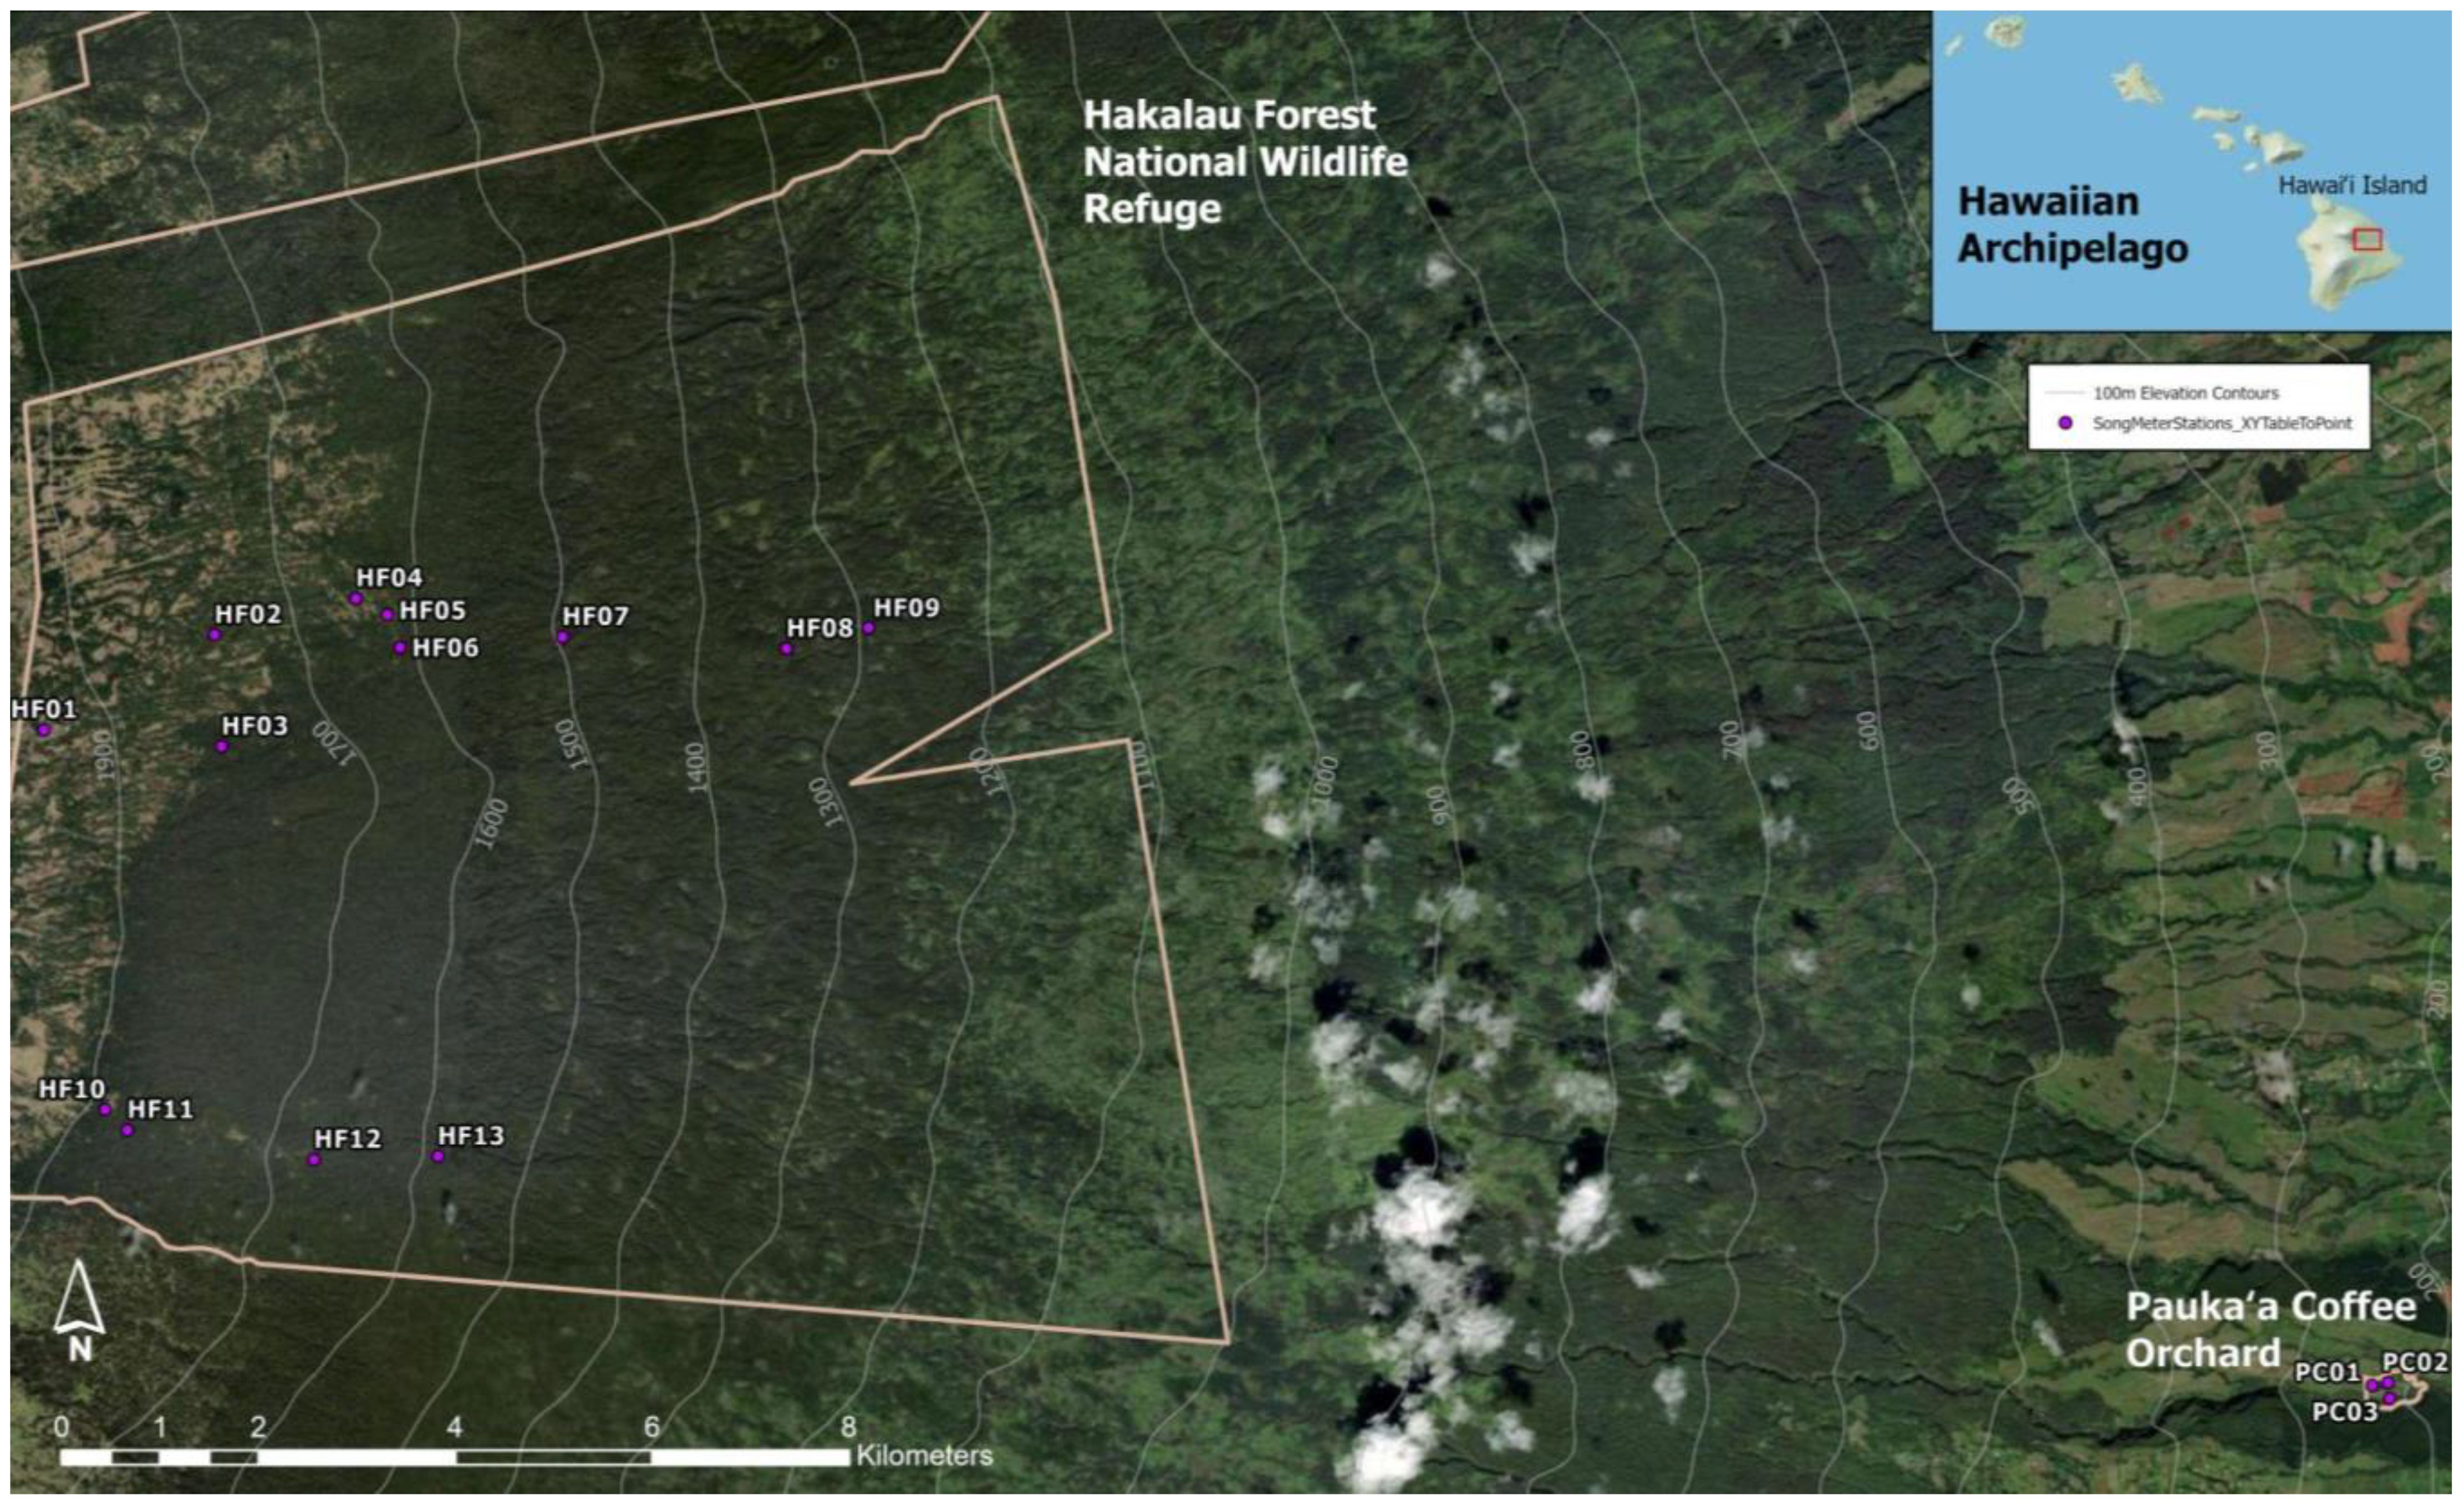
Figure 1. Map of Song Meter recording stations (circles) on the windward slope of Mauna Kea Volcano, Hawai‘i Island, within Hakalau Forest National Wildlife Refuge and Pauka‘a Coffee Orchard. Satellite imagery provided by Esri, Maxar, Earthstar Geographics, and the GIS User Community. Basemap: Copyright: © 2013 National Geographic Society, i-cubed.
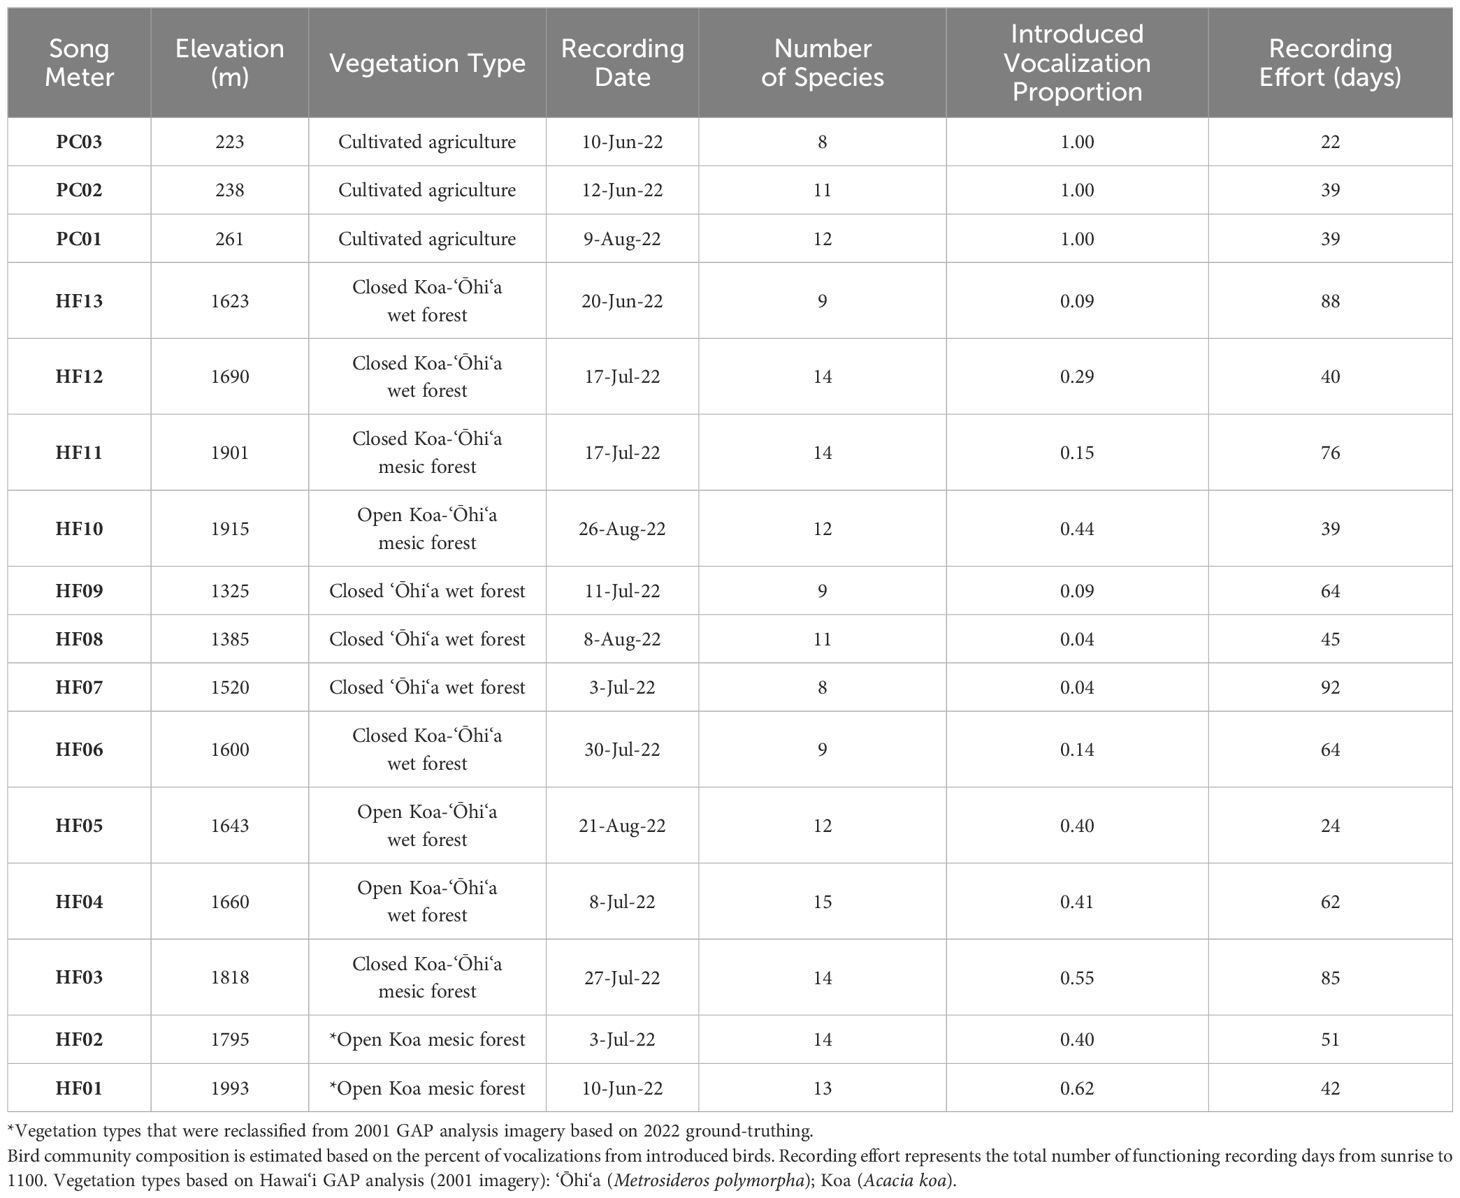
Table 1. Description of each Song Meter recording station: recording dates were randomly selected for analysis, excluding tracks with rain.
At each station, a Song Meter was placed 1–1.5 meters above the ground and programmed to record on a five-minute continuous duty cycle (i.e. recording for the initial five minutes followed by five minutes of no recording) from sunrise to 11:00 am, the time of peak vocal activity for Hawaiian forest birds (Hart et al., 2021). To increase the sample size, recordings from Song Meters of a different study at Hakalau were opportunistically used. These were similarly placed and located at the edges of primary or secondary forest, but had schedules of 5:00am to 8:00pm, recording 10 minutes on and 20 minutes off repeatedly (HF01) or 5 minutes on and 15 minutes off repeatedly (HF03, HF11, Figure 1). In these cases, only recordings that fell within the timeframe of the study and between sunrise and 11:00am were used. All recordings were made as.WAV files with a 44.1 kHz sampling rate.
Hakalau is largely a Hawaiian montane rainforest with an average annual temperature of 13.1°C and average annual rainfall of 3,550 mm (Giambelluca et al., 2014). There is no dry season, and wet months (>250 mm) can occur throughout the year. Annual cloud frequency is roughly 50% (Giambelluca et al., 2014). The canopy is dominated by Koa and ‘Ōhi‘a Lehua, although various tracts were deforested by agriculture and have since been reforested with Koa (Hart et al., 2020). Mid-canopy trees and shrubs include ‘Ōlapa (Cheirodendron trigynum, Araliaceae), Kāwa‘u (Ilex anomala, Aquifoliaceae) Kōlea (Myrsine lessertiana, Primulaceae), Pilo (Coprosma ochracea, Rubiaceae), and Pūkiawe (Leptecophylla tameiameiae, Ericaceae), as well as the tree fern Hāpu‘u Pulu (Cibotium glaucum, Cibotiaceae). In open areas ground cover has been taken over by a variety of pasture grasses (Poaceae), including: Pennisetum clandestinum and Ehrharta stipoides. Recently some tracts are becoming invaded with gorse (Ulex europaeus, Fabaceae) (pers. observation). The relief is gently sloped as one follows the drainages of Mauna Kea Volcano such as Honoli‘i Stream. Parent material is silty clay (Sato et al., 1973) >10,000 years old (Wolfe and Morris, 1996). Hakalau remains one of the most pristine montane rainforests in the Hawaiian Islands with the highest endemic forest bird diversity.
The Pauka‘a site is directly downslope of Hakalau and is mostly alien perennial grassland interspersed with agriculture, with an average annual temperature of 20.3°C and average annual rainfall of 4,950 mm (Giambelluca et al., 2014). Wet months span the entire year, and annual cloud frequency is roughly 66%. Hundreds of coffee and cacao trees grow in an orchard, with introduced shade trees such a Kukui (Aleurites moluccanus, Euphorbiaceae) and Common Guava (Psidium guajava, Myrtaceae) and some native ‘Ōhi‘a and Koki‘o Ke‘oke‘o (Hibiscus arnottianus, Malvaceae) interspersed among them. A grove of Strawberry Guava (Psidium cattleyanum, Myrtaceae) and African Tulip (Spathodea campanulata, Bignoniaceae) grow beside a stream, and upslope of the property a Rose Gum (Eucalyptus grandis, Myrtaceae) forest grows. The relief is gently sloped with steeper gulches descending into Honoli‘i Stream and its tributaries. Parent material is mostly alkalic and transitional basalt at least 65,000 years old (Wolfe and Morris, 1996). The bird community at this site is mostly introduced, although native ‘Io (Hawaiian Hawk; Buteo solitarius) and migratory Kōlea (Pacific Golden-Plover; Pluvialis fulva) frequent the area.
2.2 Acoustic annotation methods
Acoustic analysis was adapted from the methods of Hart et al. (2021). One of the recording days was randomly selected for each site. Of these, the earliest three to six consecutive tracks, recordings of five- to ten-minute length each, having birdsong but no rain (except occasional drops), were selected. All recordings were visualized and analyzed as spectrograms using the RavenPro Software version 1.4 (K. Lisa Yang Center for Conservation Bioacoustics, 2014). Within each track, a 0.5-second selection in the quietest part of the recording was made to measure the maximum power level of the background noise. Selection boxes were drawn around every vocalization ≥5 decibels (dB) above the background noise and identified to species (Figure 2). Juvenile begging calls were excluded from analysis with the assumption that their function does not fit into the context of sound partitioning (Tobias et al., 2014). For each selection, the “Add Measurements” feature in RavenPro was used to calculate the following acoustic parameters: begin and end time, low (minimum), high (maximum), and peak (having the greatest energy) frequencies, and maximum power level (Figure 2). Four-letter species code, vocalization type (call or song), and the presence of acoustic overlap from another bird (1 for yes, 0 for no) were added manually by annotators. Acoustic overlap was defined as two vocalization selection boxes occupying the same frequency and time. Additional comments were made as necessary, including presence of wind, insects, frogs, helicopters, raindrops, or other noises overlapping with a vocalization, although these were still marked “0” unless the noise came from another bird. To help with standardization, if there was a pause of 0.2 seconds or more between notes, these syllables were selected as different vocalizations rather than one. Likewise, when a vocalization had multiple harmonics, only those ≥ 5dB above background were selected. Finally, boxes were drawn as tightly as possible around notes or phrases while still preserving the parts ≥ 5dB above background. A primary annotator (author NJH) and two secondary annotators (research assistants SMC and JH) conducted the acoustic annotations. Secondary annotators were trained in annotation by the primary annotator and then calibrated to ensure that all three annotators were consistent in their judgements.
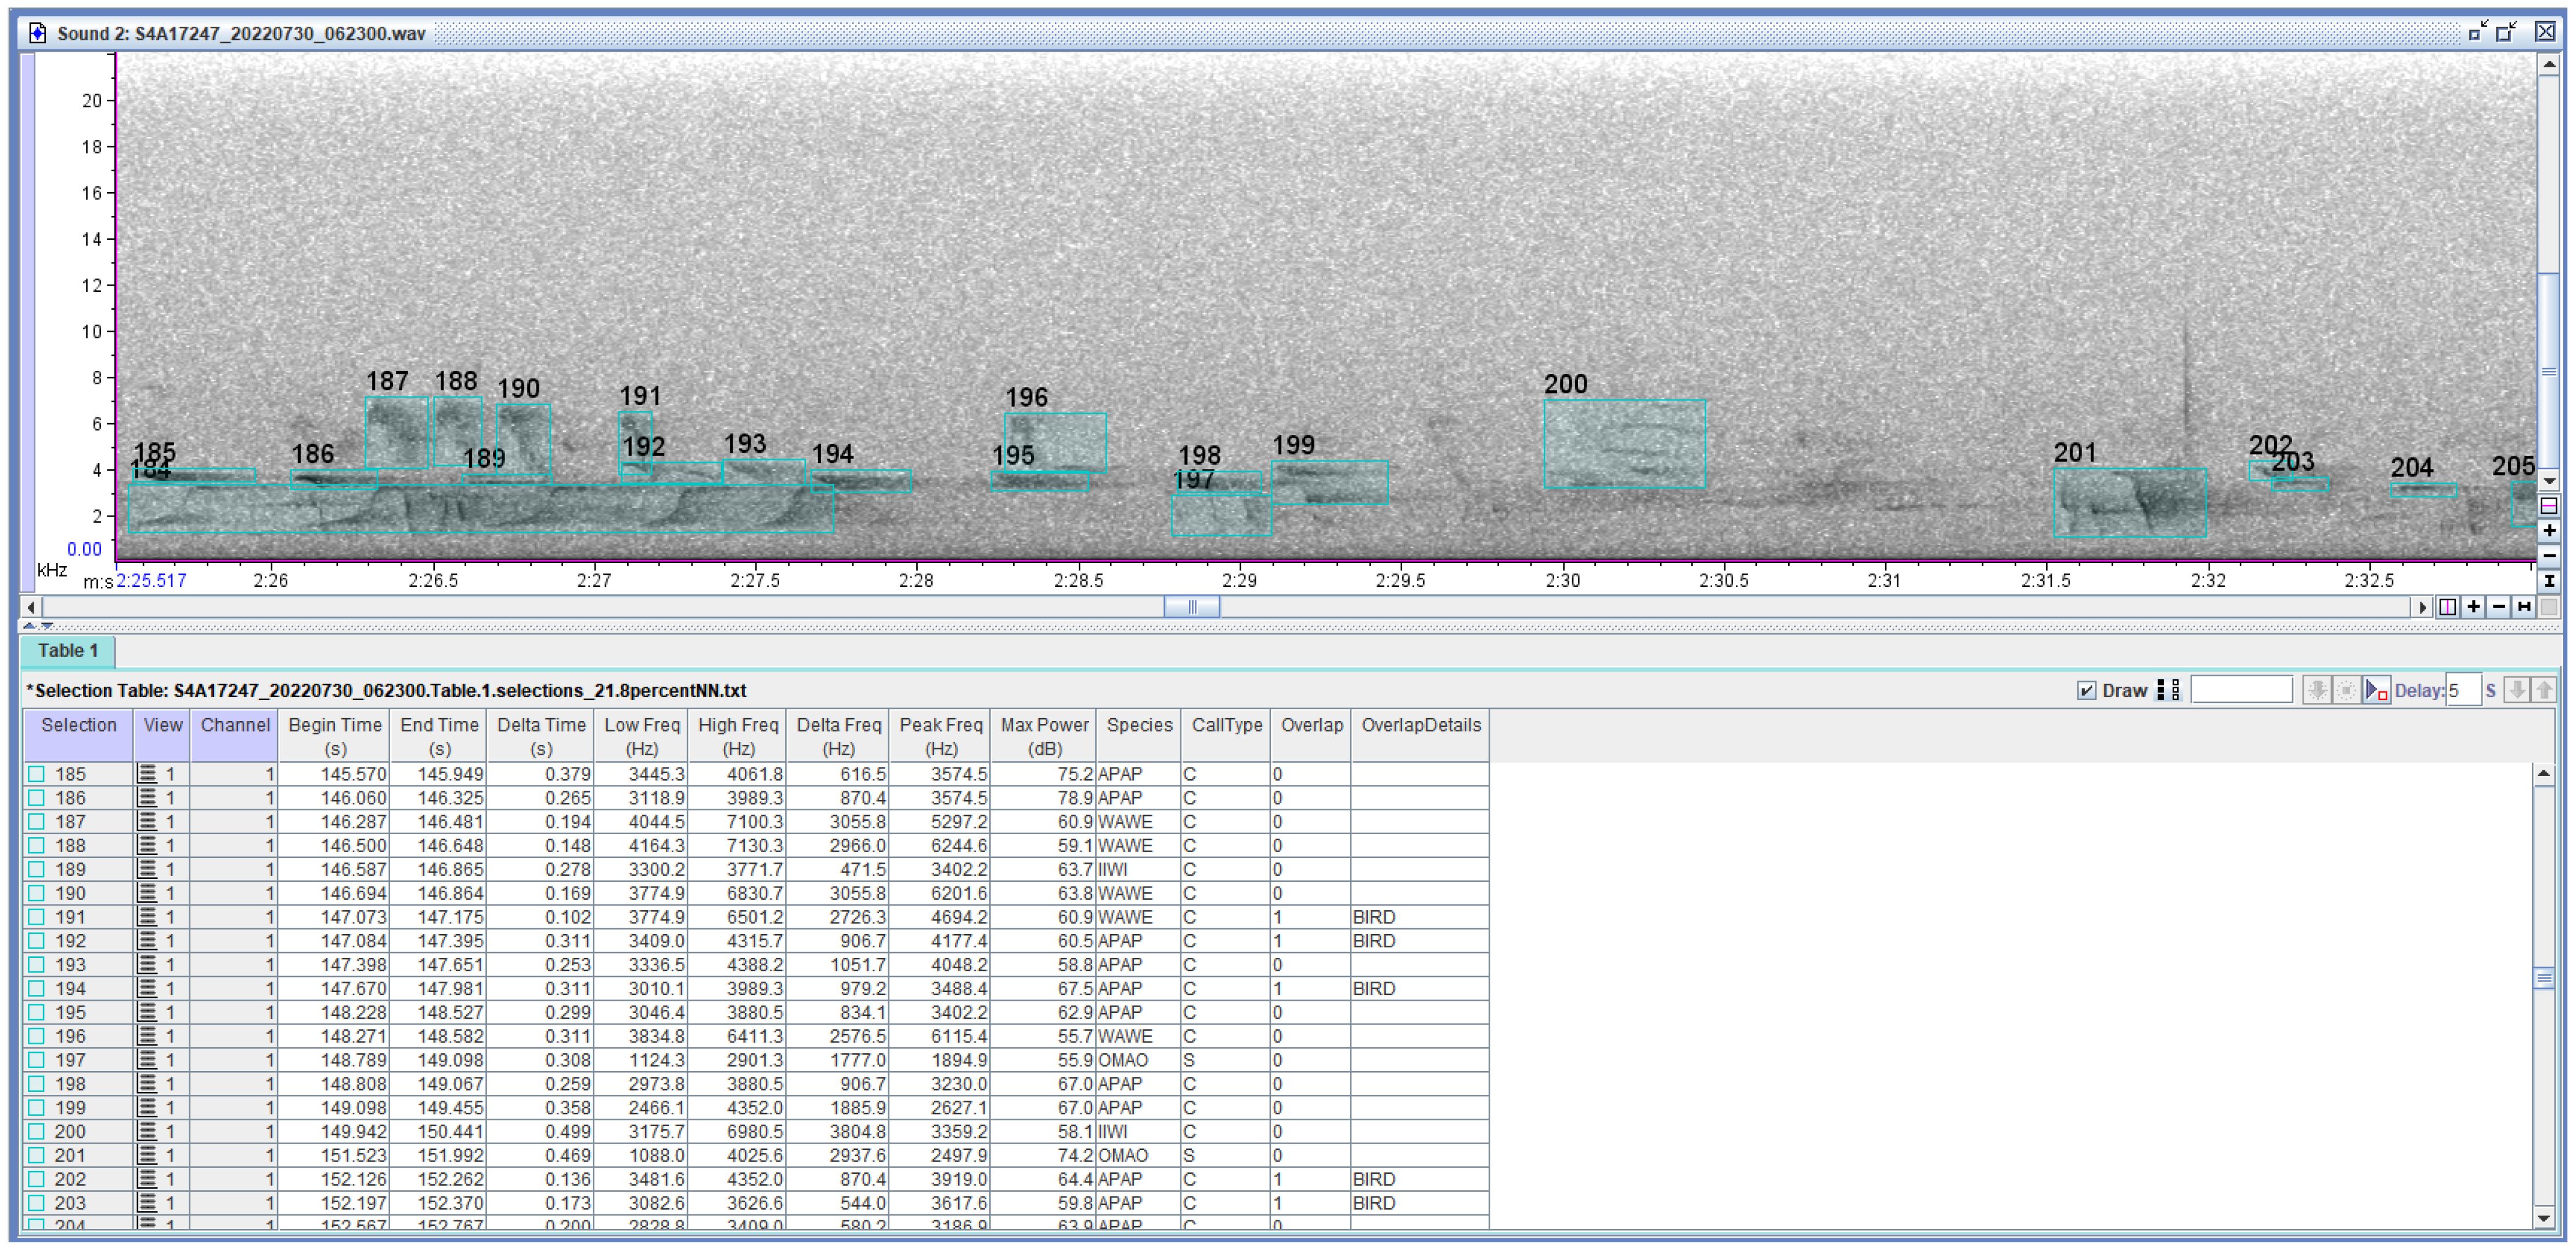
Figure 2. Example of selections made in RavenPro 1.4 (above) with relevant measurements added in the selection table (below). Species, call type, overlap, and overlap details specifying the source of a sound overlapping a vocalization were assigned by trained annotators. All other parameters were calculated using the RavenPro software. Delta time is the difference between the time on the track when a vocalization ends and the time it begins. Likewise, delta frequency is the difference between the highest and lowest frequencies of the vocalization. Peak frequency is the frequency having the greatest energy (power). Maximum power is the greatest energy (measured in decibels) of the vocalization. Species codes: APAP, ‘Apapane (Himatione sanguinea); IIWI, ‘I‘iwi (Drepanis coccinea); OMAO, ‘Ōma‘o (Myadestes obscurus); WAWE, Warbling White-eye (Zosterops japonicus). Boxes 191 and 192 enclose two vocalizations overlapping in both frequency and time.
2.3 Calibration
To test for any biases in annotation following training of the secondary annotators, all three annotators were calibrated using a standardized selection procedure that was created and distributed by the primary annotator. Annotators made selections from a one-minute recording, each blind to the others’ work. To check for differences in annotation style, a chi-square test for independence was performed on each secondary annotator’s number of selection overlaps and total number of selections relative to those made by the primary annotator. The secondary was recalibrated as needed.
A chi-squared test revealed that one of the two secondary annotators did not differ significantly from the primary annotator in their selection judgments (χ2 = 02.98, n1 = 76, n2 = 66, df = 1, p = 0.084) whereas the other secondary annotator did (χ2 = 34.14, n1 = 76, n2 = 61, df = 1, p < 0.001). Following further training in the form of recalibration and correction of their previous work, the other secondary annotator performed another one minute of selections, blind to the primary’s work, and this time their selected overlaps did not differ in number from the primary observer’s (χ2 = 1.32, n1 = 26, n2 = 44, df = 1, p = 0.25). Thus, by the end of the calibration process all three annotators were using uniform and equivalent methods for selection judgments within audio files.
2.4 Statistical analysis
All statistical analyses were performed in R Software version 4.1.1 (R Core Development Team, 2018). To compare frequency use between species, the complete frequency range was visualized for each species, measured as the minimum low frequency and the maximum high frequency observed for that species. Then, the mean low frequency and mean high frequency for each species were built into a matrix of species pair combinations for species observed at the same recording station. The proportion of the frequency range of the first species (Species 1) that was overlapped by the second species (Species 2) was calculated and built into this matrix. Each species pair occurred twice, but in a different order, such that each species had a calculated proportion of frequency overlap by the other. Next, these species pairs were classified as native-native, native-introduced, and introduced-introduced. Finally, the mean proportion of frequency overlap was calculated for each classification and compared using One-Way ANOVA and a Tukey’s honestly significant difference (HSD) test.
Additionally, the proportion of introduced species vocalizations relative to the total number of vocalizations was calculated for each track, then averaged across all tracks recorded from the same station. Proportions of introduced species vocalizations were used to compare community composition between stations and field sites (Table 1).
The null model approach used by Hart et al. (2021) was adapted to examine temporal partitioning of acoustic space. Within the 15- to 30-minute sampling periods at each site, the beginning of each vocalization was randomized, keeping its duration, frequency range, and maximum power level unchanged. This randomization was repeated 500 times to generate a null distribution of heterospecific overlap; i.e. the amount expected by chance. Overlap was defined as any overlap in both the frequency range and time of the selection boxes around vocalizations, and was only examined for heterospecific pairs of vocalizations. Within a population, male-male competition (Todt, 1981), pair duetting (Thorpe, 1963), and other behavioral circumstances generate overlap that may not be reflective of a species’ ability to partition sound; therefore we did not include conspecific overlap for this analysis.
The number of observed heterospecific pairs of overlapping vocalizations were compared against the null distribution generated by 500 randomizations. These comparisons were also segregated into native-native, native-introduced, and introduced-introduced heterospecific pairs and evaluated for differences in the amount of overlap. The proportion of overlapping vocalization pairs relative to the total number of vocalizations was also compared between vegetation types of the recording stations using One-Way ANOVA and a Tukey’s HSD, and between different proportions of introduced species vocalizations using Pearson correlation.
Next, the probability (P) of achieving the observed number of overlapping pairs, or more extreme numbers under the null model, was calculated using the pnorm function in R. If P was ≤ 0.025, significantly less overlap was observed than expected under the null model, supporting the ANH. If P was ≥ 0.975, there was significantly more overlap than expected under the null model, supporting the acoustic clustering hypothesis (Tobias et al., 2014; Hart et al., 2021). These differences, if any, between the observed acoustic overlaps and the departure of these observations from the null would be compared across Song Meter stations relative to the proportions of introduced species vocalizations at each station.
In addition to evaluating the likelihood of these observations relative to the null model, a sign test was performed to determine if there was an overall tendency for overlaps to occur more or less often than expected by random chance. A sign test is analogous to a coin flip, in which the total number of successes, i.e. the number of Song Meter stations exhibiting greater than the median number of overlaps from the null model, is evaluated against the total number of trials, in this case, the 16 recording stations. If the number of successes differ from half of the number of trials (8), this is interpreted as the outcome being more (>50%) or less (<50%) likely to occur than a one-in-two chance. This probability of success is reported with an associated p-value.
3 Results
Twenty-seven vocalizing bird species were detected from the recordings used in analysis across all sites: 18 from Hakalau and 15 from Pauka‘a, of which 6 were found at both locations. From a total of 23,942 selections amounting to 14,515 seconds, 9,699 vocalizations (40.5%) were from the 19 introduced species, and 14,243 vocalizations (59.5%) were from the 8 native species. Species richness based on vocalizations was generally higher at recording stations having greater proportions of introduced species.
The native and introduced bird species examined in this study utilized similar frequencies in their vocalizations (Figures 3A, B), however, when divided into species pairs which co-occurred at a recording station, native species had higher proportions of frequency overlap with one another than with introduced species (difference = 13.5% [9.49%, 17.4%], Figure 4), and had greater overlap compared with introduced species pairs (difference = 26.2% [21.7%, 30.7%]). There was no difference in the proportions of overlapping vocalization pairs between vegetation types. Neither was there a relationship between the proportion of overlaps and the percentage of introduced species.
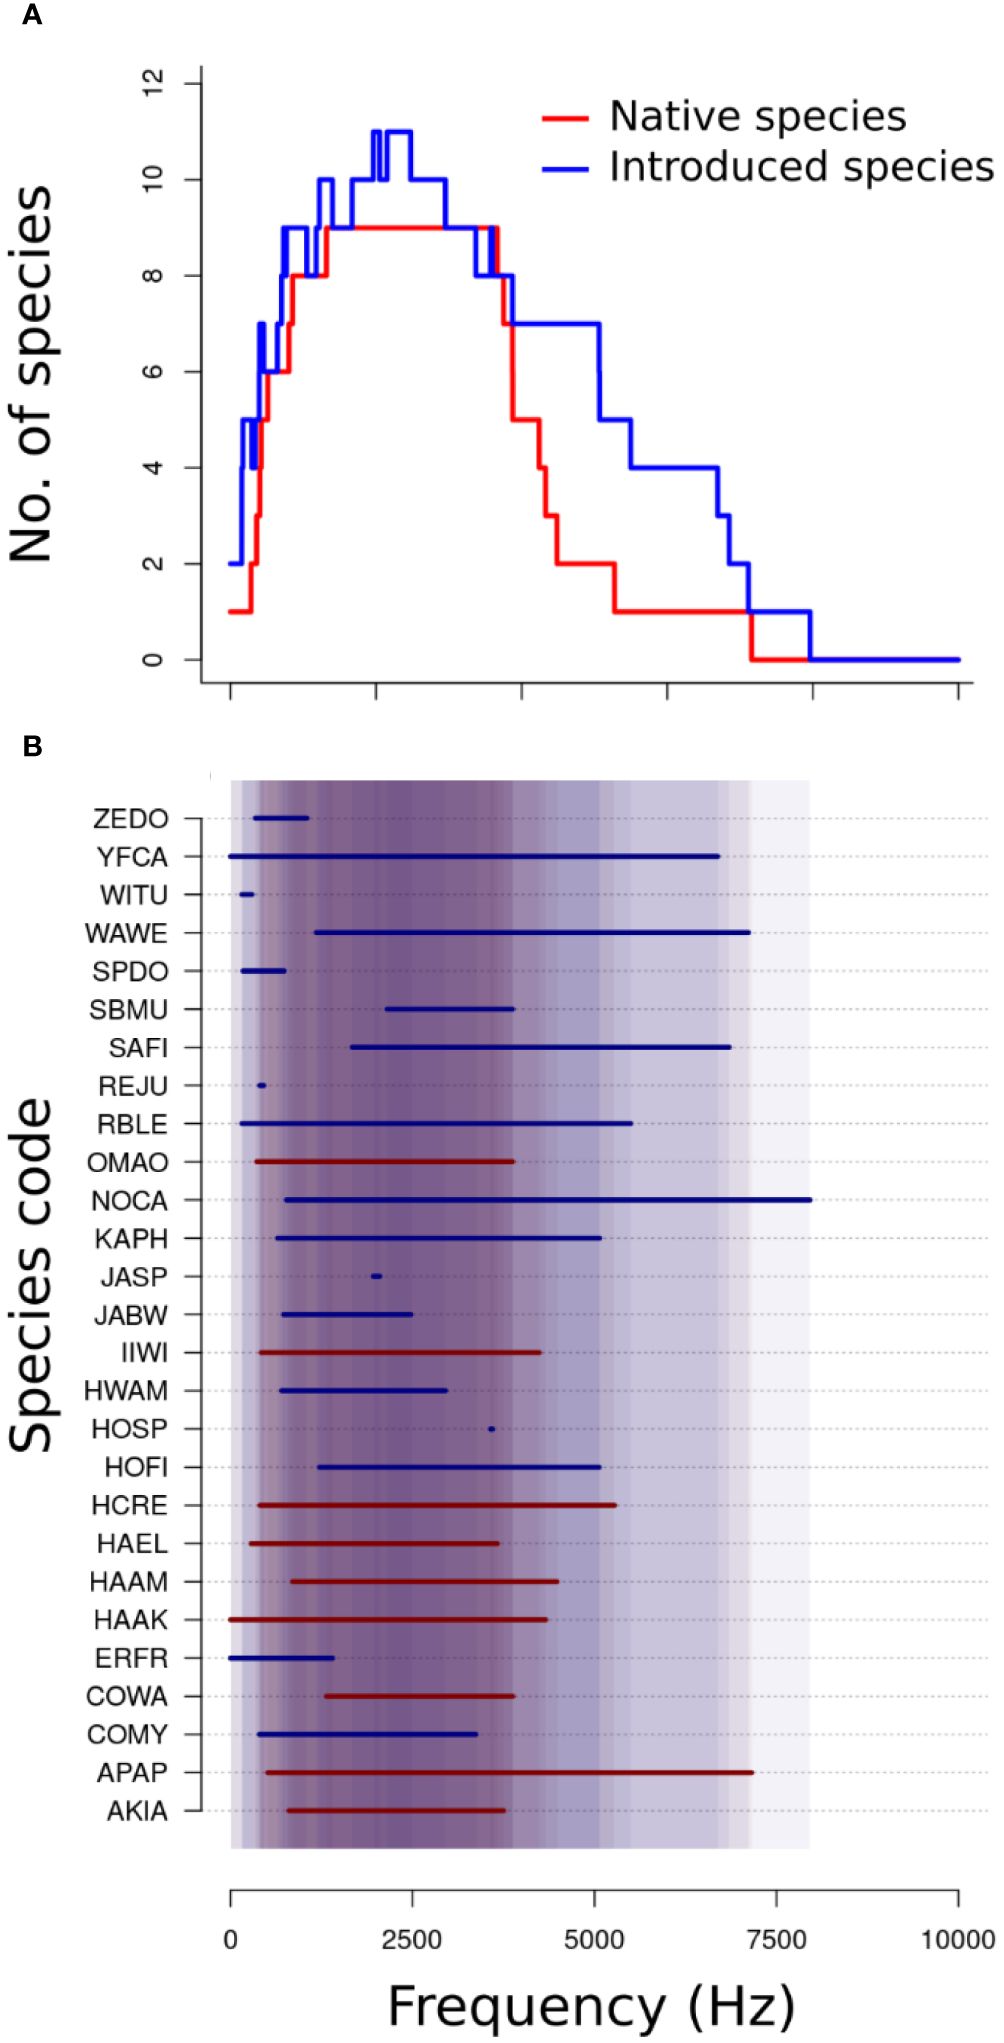
Figure 3. (A) Frequency use of native species (red) and introduced species (blue). (B) A list of all detected species with their observed vocalization frequency ranges. The shaded background represents frequency ranges used by multiple species; the darker the background, the higher the number of species using that frequency. Species codes: AKIA, ‘Akiapōlā‘au (Hemignathus wilsonii); APAP, ‘Apapane (Himatione sanguinea); COMY, Common Myna (Acridotheres tristis); COWA, Common Waxbill (Estrilda astrild); ERFR, Erckel’s Spurfowl (formerly Erckel’s Francolin; Pternistis erckelii); HAAK, Hawai‘i ‘Ākepa (Loxops coccineus); HAAM, Hawai‘i ‘Amakihi (Chlorodrepanis virens); HAEL, Hawai‘i ‘Elepaio (Chasiempis sandwichensis); HCRE, ‘Alawī (Hawai‘i Creeper; Loxops mana); HOFI, House Finch (Haemorhous mexicanus); HOSP, House Sparrow (Passer domesticus); HWAM, Chinese Hwamei (Garrulax canorus); IIWI, ‘I‘iwi (Drepanis coccinea); JABW, Japanese Bush Warbler (Horornis diphone); JASP, Java Sparrow (Padda oryzivora); KAPH, Kalij Pheasant (Lophura leucomelanos); NOCA, Northern Cardinal (Cardinalis cardinalis); OMAO, ‘Ōma‘o (Myadestes obscurus); RBLE, Red-billed Leiothrix (Leiothrix lutea); REJU, Red Junglefowl (Gallus gallus); SAFI, Saffron Finch (Sicalis flaveola); SBMU, Scaly-breasted Munia (Lonchura punctulata); SPDO, Spotted Dove (Spilopelia chinensis); WAWE, Warbling White-eye (Zosterops japonicus); WITU, Wild Turkey (Meleagris gallopavo); YFCA, Yellow-fronted Canary (Crithagra mozambica); ZEDO, Zebra Dove (Geopelia striata). Species with small observed frequency ranges represent small sample sizes and not the full frequency range of the species itself.
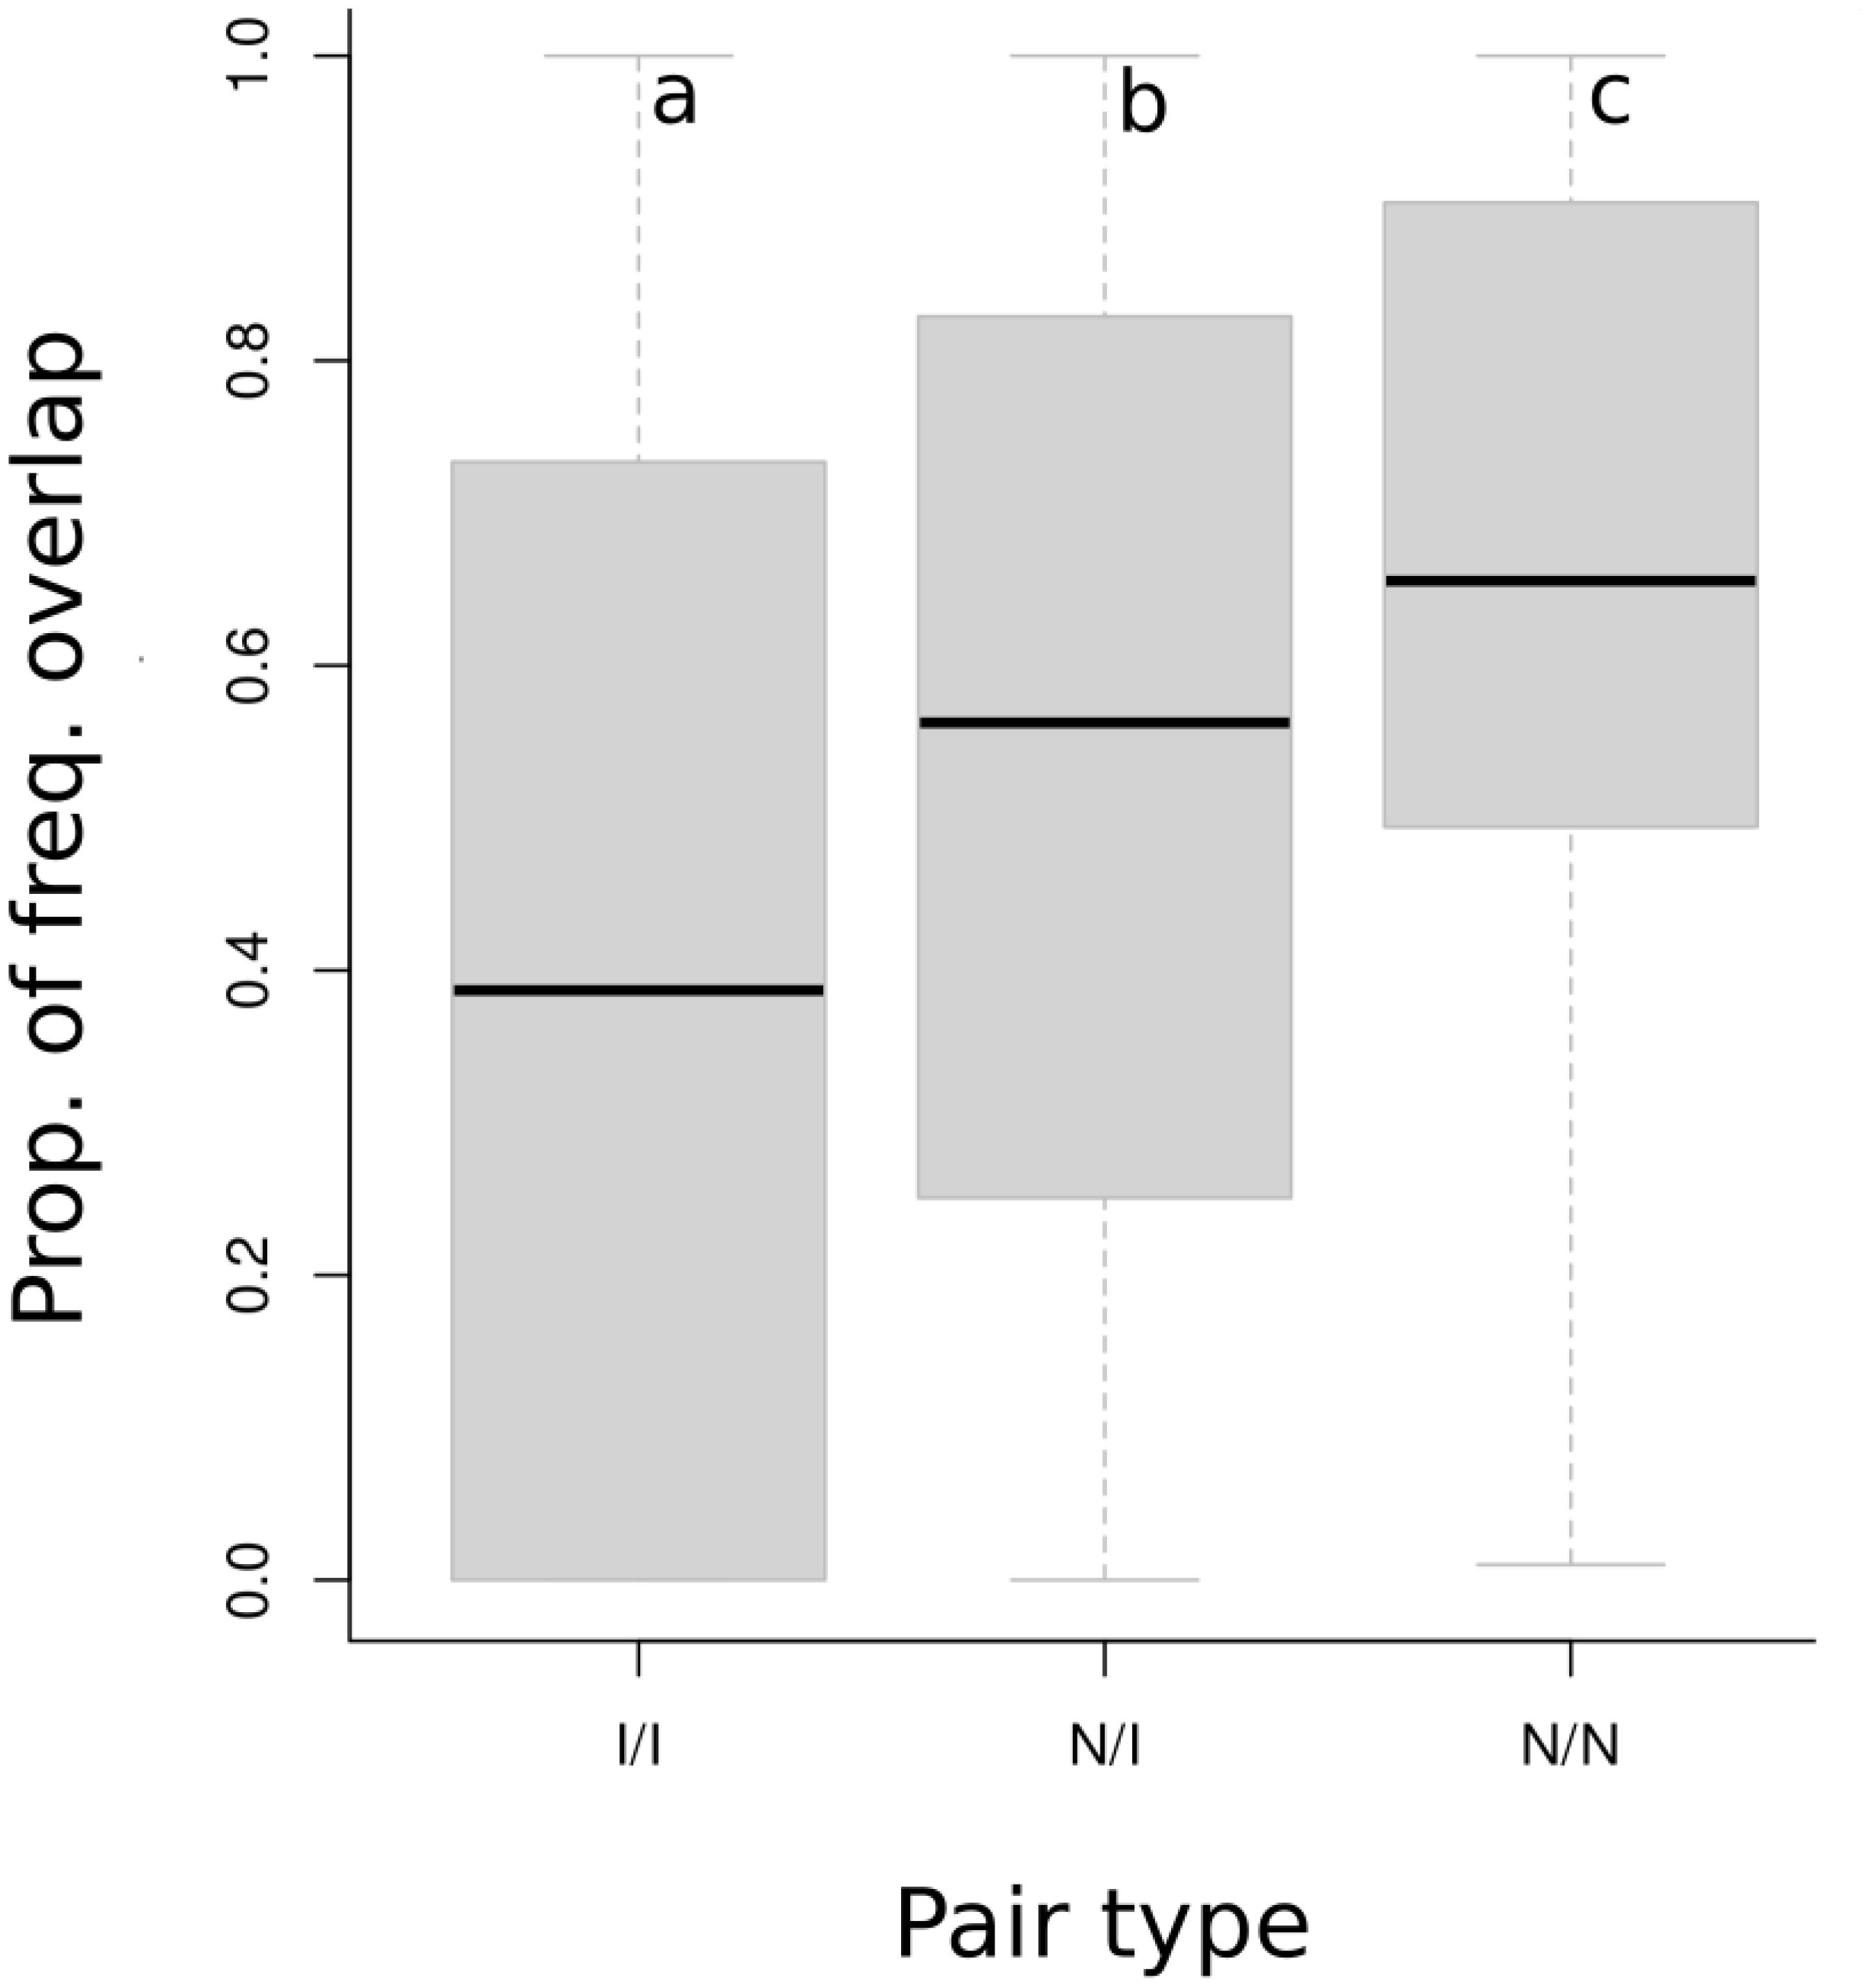
Figure 4. A comparison of the amount of the frequency ranges of all introduced (I) or native (N) species overlapped by the ranges of other introduced or native species. For each species, frequency range was calculated from the mean lowest and mean highest frequency. The mean proportion of frequency overlap between a pair type (Introduced/Introduced, Native/Introduced, Native/Native) was calculated from the proportion of each introduced or native species’ frequency range overlapped by an introduced or native species’ frequency range for all possible pairs, controlling for the species’ occurrence at the same Song Meter recording station. Shaded boxes represent first and third quartiles, brackets maximum and minimum values. Letters a, b, and c denote significantly different means (middle bars) based on One-Way ANOVA and a Tukey’s HSD test, α = 0.05. All three pair types significantly differed in their proportions of overlap.
Comparing the null model against the observed number of overlaps revealed no difference between the observations from each station with its null distribution (Pnorm values all >0.025, see Table 2; Figure 5). Native-native, native-introduced, and introduced-introduced heterospecific vocalization pairs all tended to have less overlap than the null distribution, but the differences were not significant, nor were there significant differences in the amount of overlap between native-native, native-introduced, and introduced-introduced species pairs (Figure 6). However, a sign test revealed that the observed numbers of overlaps were less than the median number of overlaps from the null distributions more often than by random chance (probability of success [i.e. having greater than the median value of overlaps] = 0.19, successes = 3, n = 16 trials, p = 0.02).
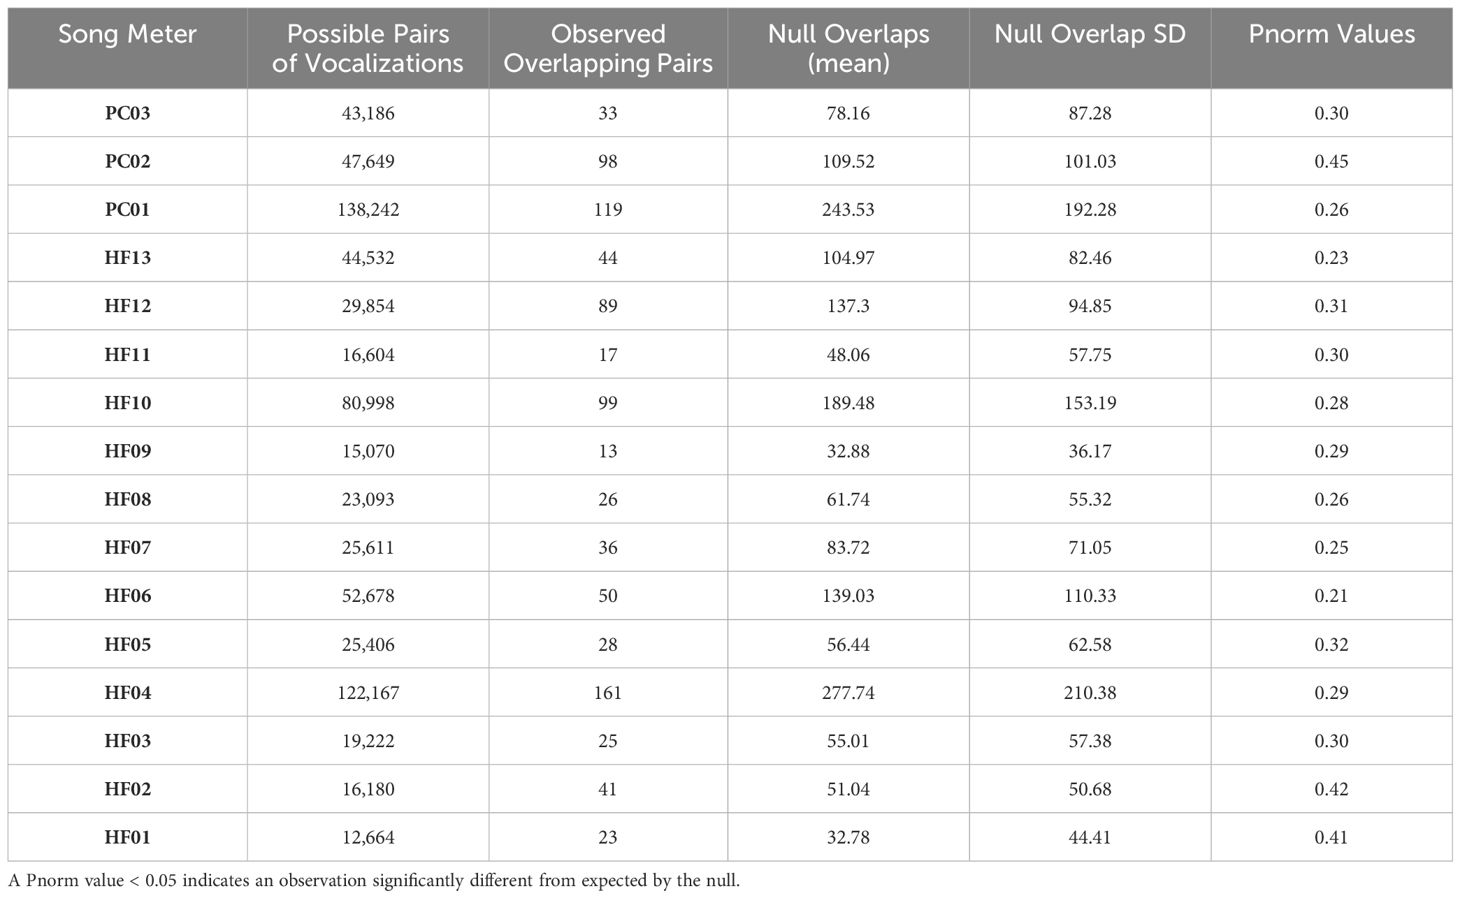
Table 2. Summary observations for each Song Meter station, including the number of possible vocalization pairs, the observed number of overlapping vocalizations, the mean of the null distribution of overlaps based on 500 randomizations of all vocalizations across consecutive tracks within each site, the standard deviations (SD) of these means, and the probability of obtaining the observed number of overlaps based on the null distribution of each randomization (Pnorm).
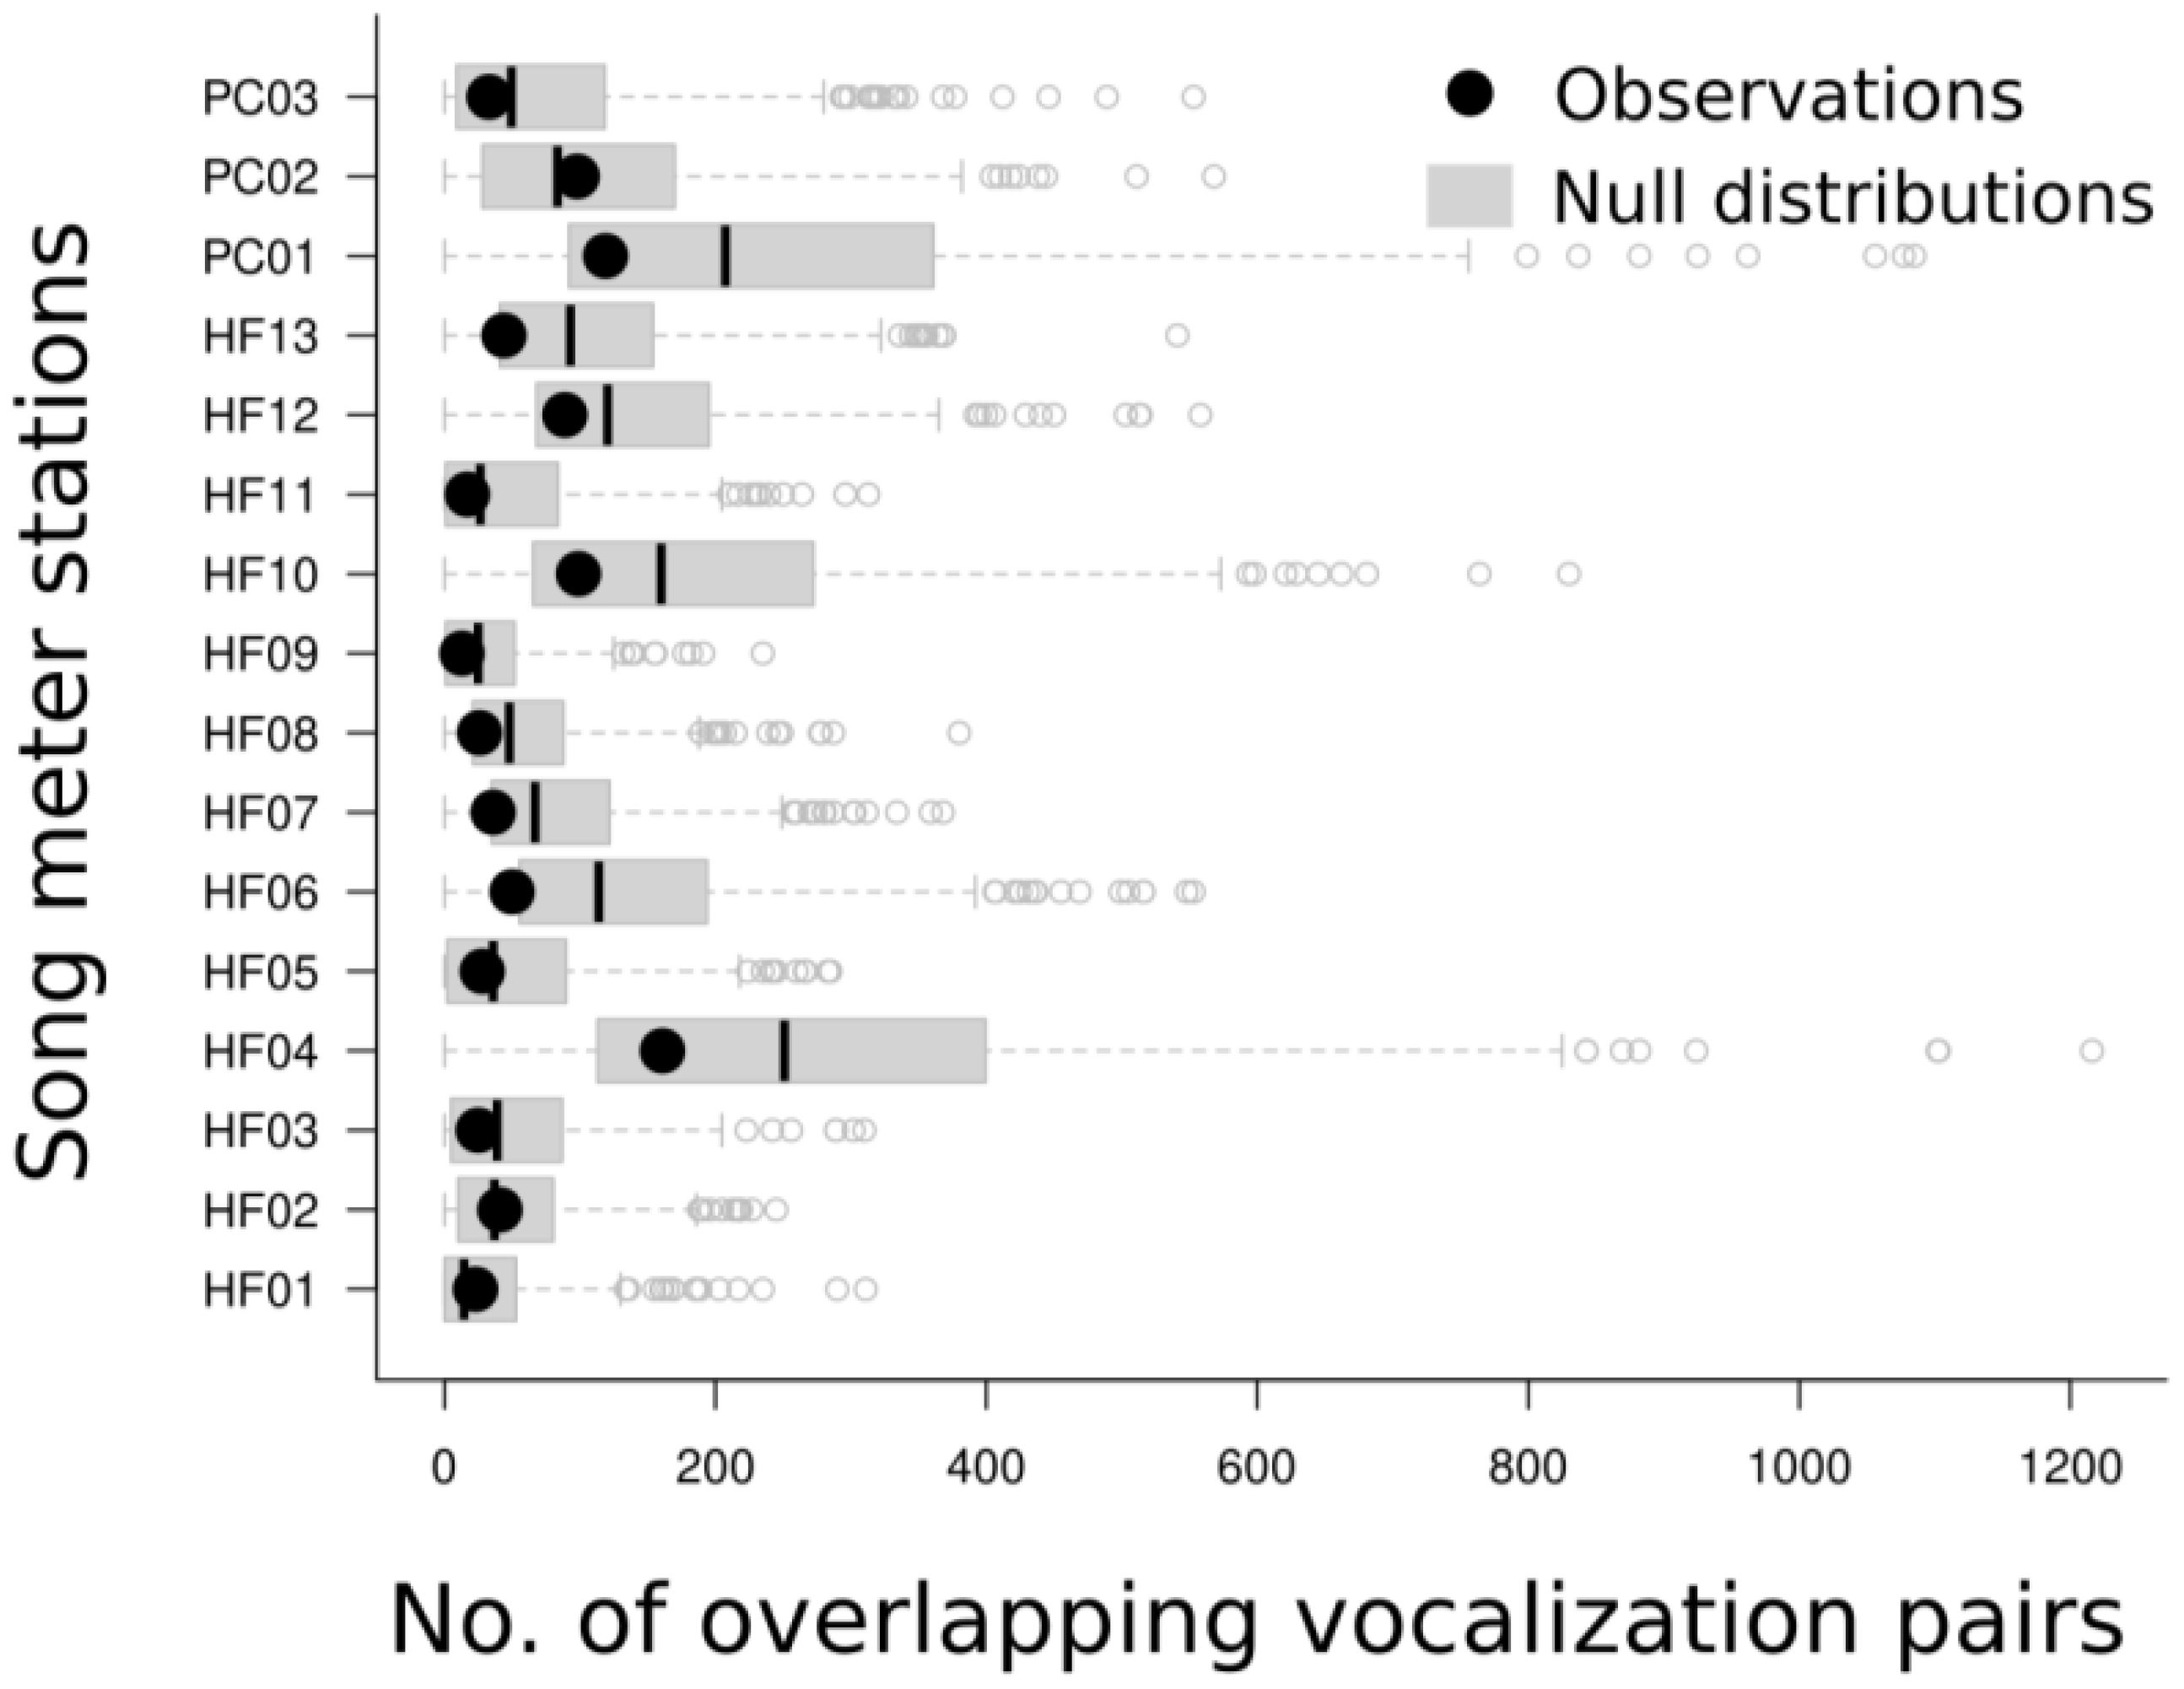
Figure 5. Boxplots representing the distributions of heterospecific vocalization overlap based on 500 randomizations of all vocalizations, occurring across consecutive tracks (15–30 minutes) within each station. Black dots are the observed number of overlaps, whereas boxplots represent the range, median, lower and upper quartiles of the null distributions. Open circles show outliers.
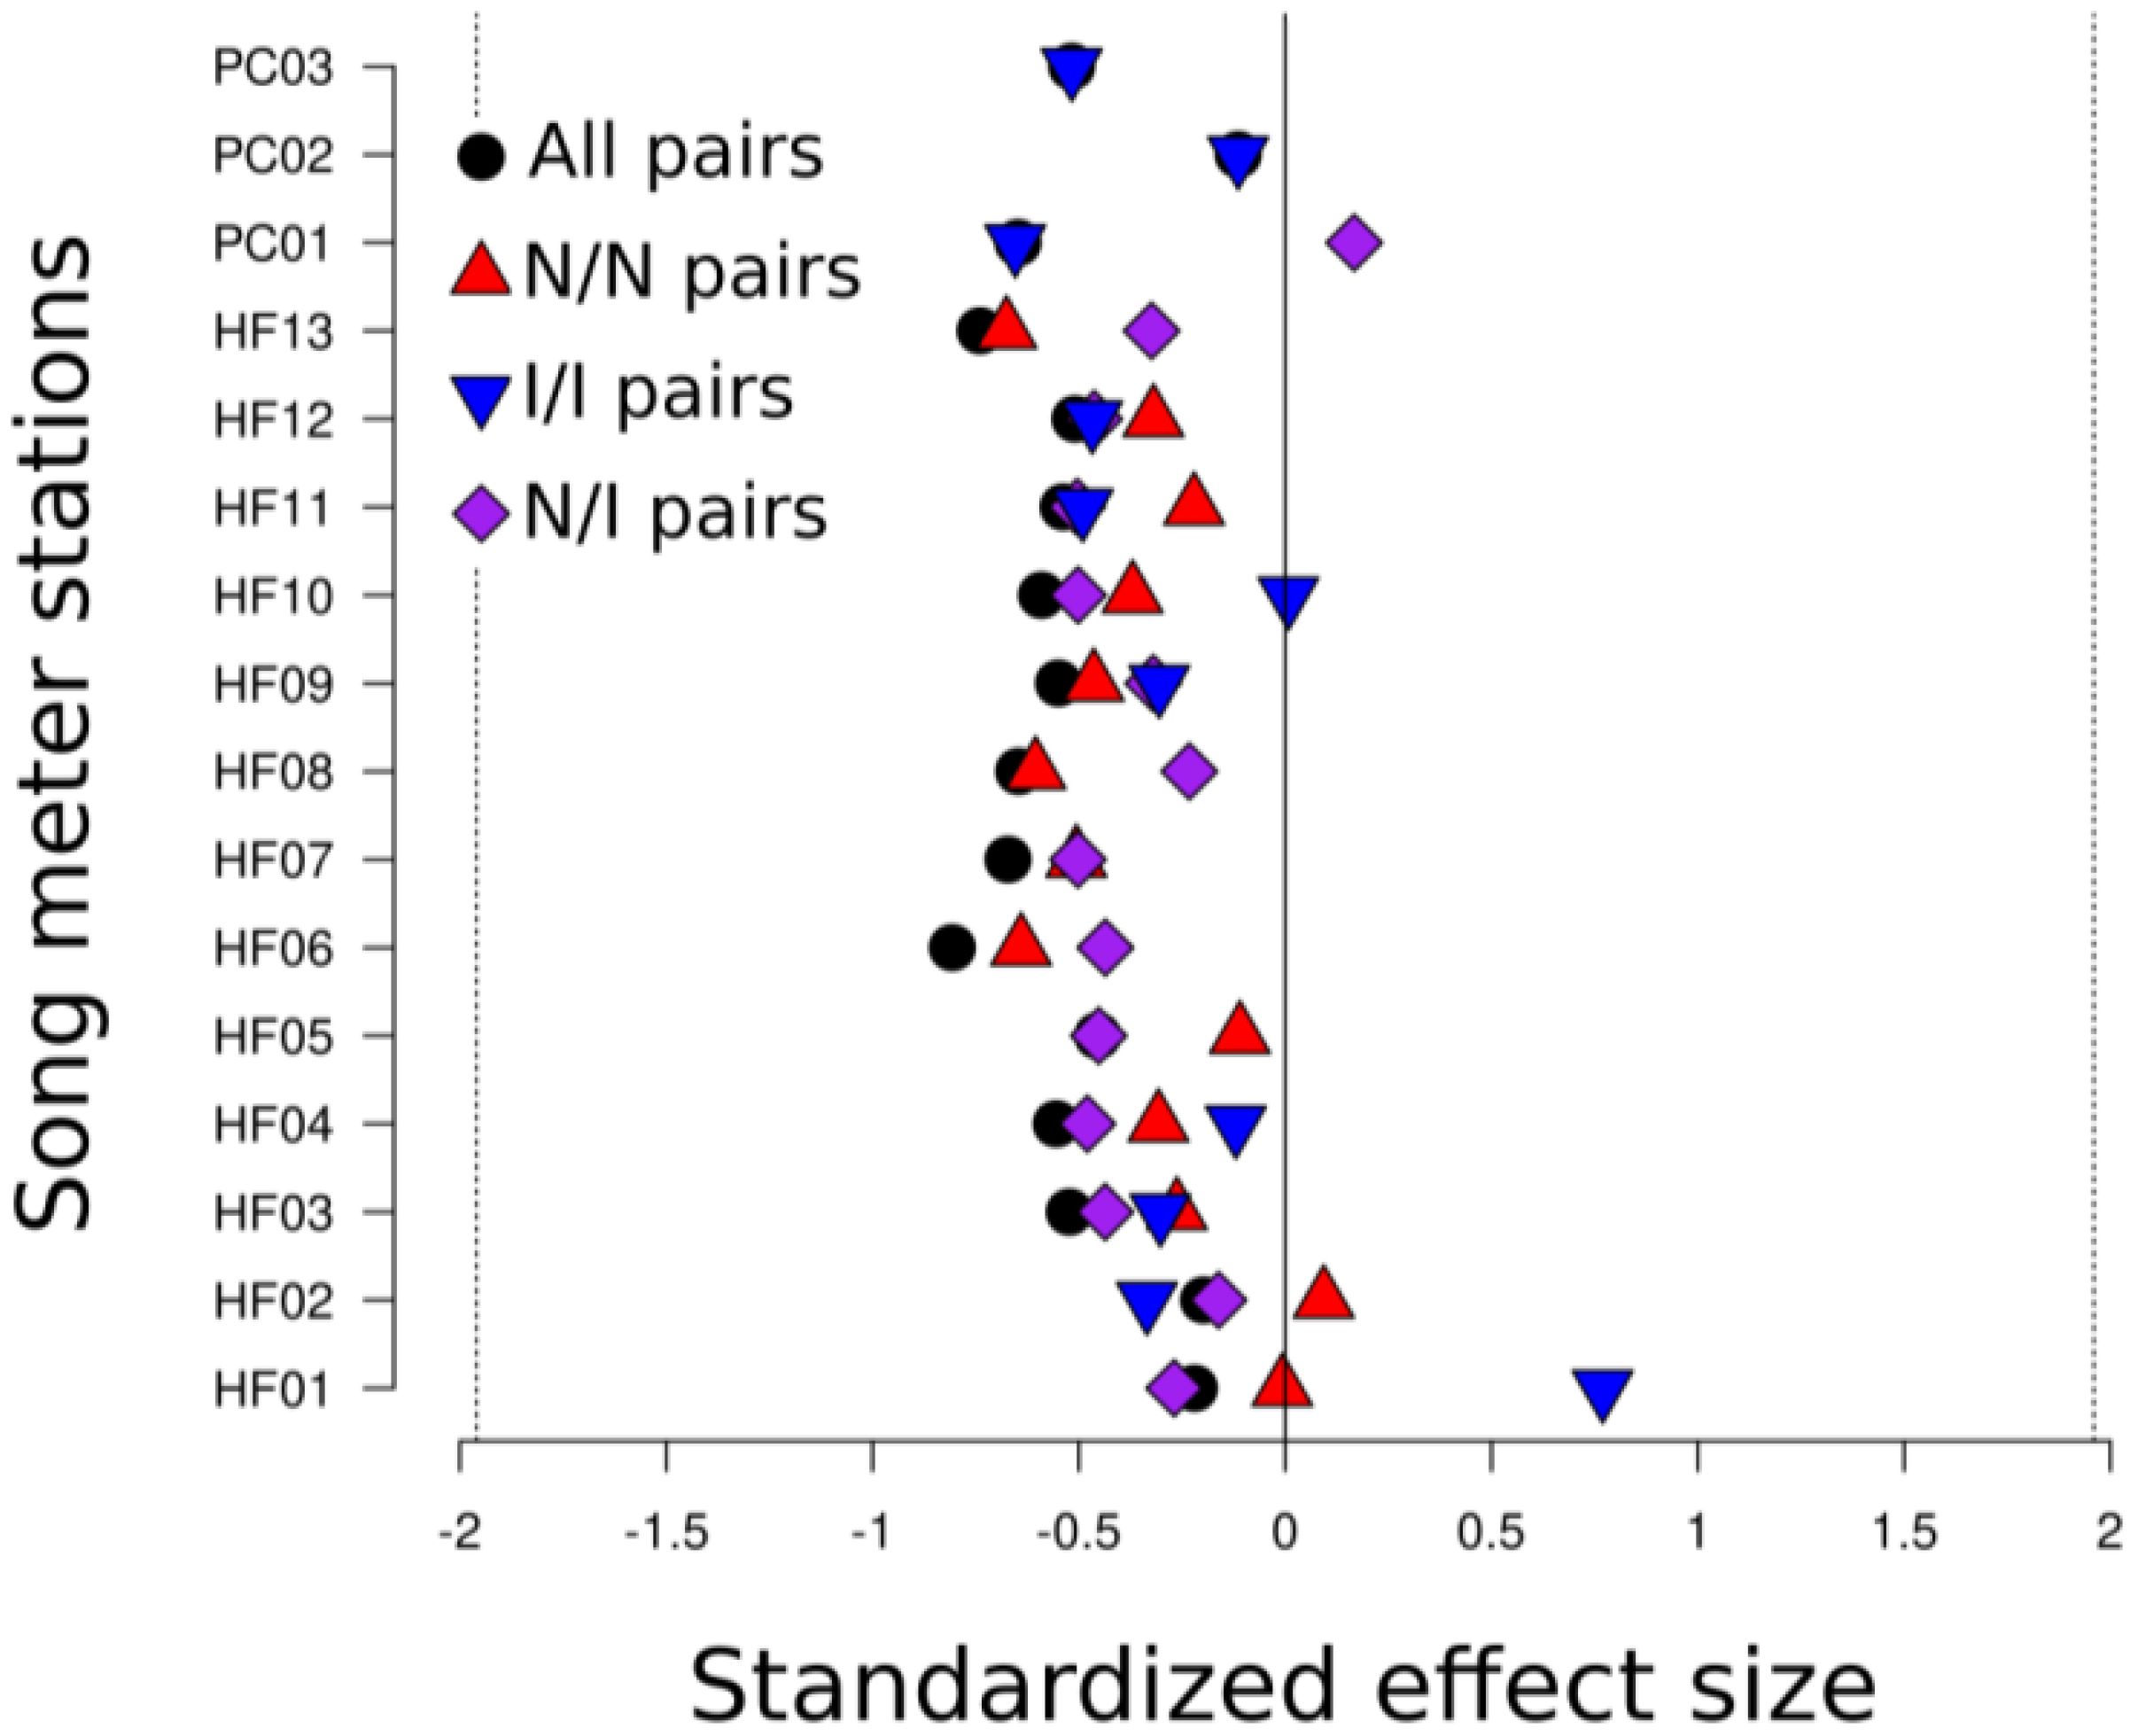
Figure 6. Standard effect sizes (SES) for 500 randomizations for all species vocalization pairs and all native/native (N/N), introduced/introduced (I/I), and native/introduced (N/I) species vocalization pairs, with consecutive 5-minute tracks at sites combined. SES shows no significant difference between the randomized null distribution and observations of overlap (SES of magnitude greater than ±1.96 represents significant departure from null).
4 Discussion
4.1 Summary
Our purpose in this study was to answer whether the representation of introduced bird species is associated with the degree of acoustic niche partitioning in avian communities on the windward slope of Mauna Kea, which hosts the greatest diversity of native forest birds in Hawai‘i. We observed native species and introduced species showing similar distributions of frequency range use, with ranges between 1–4 kHz being used the most (Figures 3A, B). This likely relates more to shared constraints of body size and the acoustic environment (Morton, 1975; Cardoso and Price, 2010; Memet et al., 2022) than phylogeny, as not all species are closely related. Greater frequency overlap seen between native species than native-introduced or introduced-introduced pairs (Figure 4), partially supports the acoustic clustering hypothesis (i.e. that species in avian communities converge in signal structure due to shared constraints in the acoustic environment and interspecific interactions; Tobias et al., 2014). It could also reflect intrinsic or extrinsic constraints, or relate to differences in behavioral response to heterospecific vocalists between native Hawaiian birds and introduced birds, particularly in the non-breeding season. Vocalizations, however, were not more clustered than expected based on random timing, regardless of native or introduced status (Figures 5, 6). Although the differences between the observed vocalization overlaps and the null distribution were insufficient to provide evidence of birds in these communities temporally partitioning their signals, there was evidence for a significant trend, based on the results of the sign test. Lack of evidence for acoustic partitioning may be a consequence of native species extinctions and population declines, which could effectively break down barriers reinforcing divergence in signal structure between species (Grant and Grant, 2010; Paxton et al., 2019). A limitation of our study was our inability to discriminate vocalizations from individual birds, which may have affected our analysis as individuals respond to stimuli differently. As the technology for individual recognition develops, future studies could control for individual vocalists in the randomization process.
4.2 Costs of extinctions and declines to vocal diversity
The lack of evidence for acoustic partitioning may represent a collapse in acoustic community structure following a significant number of avian extinctions. Divergence in morphological traits and frequency use between closely related bird species may be a consequence of, and maintained by, competitive exclusion (Grant and Grant, 2010; Krishnan and Tamma, 2016). When a species disappeared in Hawai‘i, the barriers reinforcing acoustic divergence through competitive exclusion with other, acoustically similar species would, in theory, break down. This would result in a competitive release in available signal space for the surviving species, unless competitive exclusion was replaced by a new species. Given that many of the Hawaiian bird extinctions preceded the wave of introductions occurring in the early 20th century by decades, and assuming that these new species were acoustically different from the extinct native species, there may have been sufficient time for such a relaxation of signal structure in surviving species to occur.
Another, and not mutually exclusive, explanation is population declines resulting in a loss of vocal diversity and higher vocal convergence between species. On Kaua‘i, the ‘Akeke‘e (Loxops caeruleirostris), Kau‘i ‘Amakihi (Chlorodrepanis stejnegeri), and ‘Anianiau (Magumma parva) have all begun to converge in signal structure due to the loss of signal complexity and/or lack of acoustic tutors available, negatively impacting cultural transmission (Paxton et al., 2019). While ‘Apapane (Himatione sanguinea) and ‘I‘iwi (Drepanis coccinea) calls often appeared convergent in pattern and structure and frequently overlapped (NJH, personal observation), it is more likely that these reflect shared evolutionary history rather than recent losses of vocal complexity, given that Hakalau populations of ‘I‘iwi and ‘Apapane have overall remained stable and increased, respectively, since 1989 (Kendall et al., 2023). Convergence would also be evidenced by decreases in vocalization diversity and complexity (Paxton et al., 2019), which was beyond the scope of this study. Future research might compare historical vocal complexity and diversity, as well as similarities between, ‘Apapane and ‘I‘iwi from archived recordings versus current populations.
Hawai‘i is a highly disrupted system and may not fit all of the assumptions of the acoustic niche hypothesis, which is based on an intact, biodiverse community. In comparison with a Costa Rican avian community, for example, a Hawaiian community had less partitioning in frequency and in time (Hart et al., 2021). Given Costa Rica’s high biodiversity, it likely better fits the assumptions of the acoustic niche hypothesis and therefore has a higher degree of sound partitioning.
4.3 Physiological constraints of body size on frequency use
Even within highly biodiverse systems, however, the evidence for acoustic partitioning can be obscured. Signal structure can be constrained by the structure and physiology of the phonatory organs (Busnel, 1977). Specifically, frequency use in birds is inversely correlated with body mass, and the distribution of body sizes in a community varies with geography when controlling for area (Memet et al., 2022). Frequencies associated with more common body sizes are, correspondingly, more commonly used in the soundscape. Evaluating frequency partitioning uniformly, with a null model that does not account for the physiological constraints of body mass, could therefore overlook non-random dispersion of frequencies within a localized cluster of body sizes. Therefore, Memet et al. (2022) used null models that randomized frequencies within the observed frequency range of an avian community, while also keeping the distribution of associated body masses conserved. These informed null distributions, when compared with the observed frequency distributions, showed more differences in evenness of frequency than uniform null models, and were therefore more powerful to detect frequency partitioning in three out of five neotropical bird communities. In contrast to such biodiverse communities, however, Hawai‘i is disharmonic and has lost much of its larger avifauna, which presumably produced lower frequency sounds, and therefore may not show as many differences between mass-informed and uniform null models of frequency use as neotropical soundscapes.
4.4 Effects of seasonality on vocal behaviors
One potential reason our results differ from Hart et al. (2021) is because they recorded during the peak breeding season (March–April) for Hawaiian forest birds, while we recorded primarily during the summer months (June–August) following peak breeding. Acoustic partitioning is possibly less important in summer than in spring when it is most needed for advertisement and territorial calls (Eddinger, 1970). Likewise, Farina et al. (2013) found that vocal activity of introduced Red-Billed Leiothrix in Italy varies throughout the year differently from native Italian birds. This suggests that introduced species in Hawai‘i may similarly prioritize signal partitioning, if at all, during different months from native birds. Future research might compare the amount of acoustic partitioning between seasons.
4.5 Other resource partitioning between native and introduced hawaiian forest birds
Similar to this study, evidence for resource competition among and between native and introduced forest birds in Hawai‘i (Moulton and Pimm, 1983; Moulton, 1985; Mountainspring and Scott, 1985; Foster, 2005; Freed and Cann, 2009) has largely been inconclusive. Moulton and Pimm (1983) observed that the probability of introduced bird species extinction increased with the number of species introductions, which they attributed to potential competition. A subsequent finding of extinction risk increasing between introduced bird species having similar bill size supported this more specifically as dietary niche competition (Moulton, 1985). These two studies suggest that lowland Hawaiian bird communities hosting a diversity of introduced species are saturated, suggesting increased competition for acoustic space, such as in a biodiverse community. If increased acoustic competition reinforces partitioning (see Grant and Grant, 2010), this may explain the lower frequency overlap we observed between introduced-introduced species pairs, as sites with the most introduced species were also the most species rich. Reciprocally, then, high-elevation communities may be relatively unsaturated. In support of this, positive population growth rates of three introduced species, Red-Billed Leiothrix, Warbling White-eye, and Japanese Bush Warbler (Horornis diphone), in native forest on Maui had no effect on the density of native ‘Alauahio (Paroreomyza montana), which shared dietary preferences with these species (Foster, 2005). Unsaturated montane forest bird communities would in theory have less acoustic competition, resulting in each species utilizing a broader range of the sound space.
In contrast, Mountainspring and Scott (1985), after controlling for habitat structure, found more positive associations between bird species than negative (76 versus 10), and found that native-introduced pairs had higher proportions of negative correlations than native-native or introduced-introduced species pairs. While we didn’t find any evidence for acoustic competition between introduced and native forest birds, future research could examine other resource partitioning, informed by more detailed understanding of species life histories, and with more thorough analysis than mere correlation. For example, sites of different community compositions could help to reveal whether limited food and nesting resources exhibit the same neutral effect we observed for acoustic space, or whether introduced birds present yet another pressure on native bird populations.
Future studies could use playback experiments with more common native species and with introduced species to determine their responses to native, introduced, and white-noise (as a control) playback. This would allow for an experimental approach to see how species may partition sound in real time, and, to our knowledge, this would be the first instance of doing so in a hybrid community of forest birds. Previous playback studies in frogs have demonstrated that, exposed to recordings of introduced species, native species will alter their frequencies, timing, and/or amplitude (Both and Grant, 2012; Bleach et al., 2015; Tennessen et al., 2016; Medeiros et al., 2017), in some cases, even if the native species calls in a different frequency range as the stimulus. However, native species also responded to other native species stimulus (Bleach et al., 2015; Medeiros et al., 2017; Hopkins et al., 2023) and white noise control (Tennessen et al., 2016; Medeiros et al., 2017). In a playback experiment between an introduced and native bird species, the native bird did not alter its frequency, but did adjust its timing to sing between the songs of the introduced bird (Farina and Pieretti, 2014). While playback studies are helpful in examining short-term behavioral responses of native birds to acoustic invaders, they are generally conducted within short time scales, and fail to capture lag responses in native species, long-term consequences, and evolutionary changes in a changing soundscape. Long-term monitoring of native species’ responses to introduced species across seasons and years is necessary for a more comprehensive understanding of competition for acoustic resources in rapidly changing bird communities. It could also confirm whether seasonality has a strong effect on acoustic partitioning and other vocal activity patterns, and whether this has contributed to the seemingly conflicting results surrounding the evaluation of the acoustic niche hypothesis.
Data availability statement
The raw data supporting the conclusions of this article will be made available by the authors, without undue reservation.
Ethics statement
Ethical approval was not required for the study involving animals in accordance with the local legislation and institutional requirements because no animals were captured, handled, housed, monitored, nor followed. No University IACUC permits were required for our study. Permission to conduct fieldwork was granted by landowners (Hakalau Forest National Wildlife Refuge and Paukaʻa Orchard landowners).
Author contributions
NH: Conceptualization, Data curation, Formal analysis, Funding acquisition, Investigation, Methodology, Project administration, Resources, Software, Supervision, Validation, Visualization, Writing – original draft, Writing – review & editing. TI: Conceptualization, Formal analysis, Investigation, Methodology, Project administration, Resources, Software, Supervision, Validation, Visualization, Writing – review & editing. AP: Investigation, Methodology, Project administration, Resources, Supervision, Writing – review & editing. PH: Conceptualization, Formal analysis, Funding acquisition, Investigation, Methodology, Project administration, Resources, Software, Supervision, Writing – review & editing.
Funding
The author(s) declare financial support was received for the research, authorship, and/or publication of this article. Funding provided by the US Army Engineer Research and Development Center, Award #W9132T-21-2-0002. N. Hunt was also supported in his first year of research by the Terrestrial Wildlife Meritorious Graduate Scholarship from the W.T. Yoshimoto Foundation.
Acknowledgments
We thank Hakalau Forest National Wildlife Refuge for granting access to field sites and permission to record. We gratefully recognize Saxony Charlot, Paulo Ditzel, Mackenzie Fugett, Kili Kawaiaea, Stephanie Mladonich, Dani Paulo, and Lauren Smith for assistance in collecting field recordings and/or distance observations of birds, and S. Charlot, M. Fugett, Jennifer Himmelman, and K. Kawaiaea for assistance in processing field recordings. We appreciate Ann Tanimoto-Johnson for troubleshooting Song Meter and Raven issues and Amanda Navine for her statistical consultation.
Conflict of interest
The authors declare that the research was conducted in the absence of any commercial or financial relationships that could be construed as a potential conflict of interest.
Publisher’s note
All claims expressed in this article are solely those of the authors and do not necessarily represent those of their affiliated organizations, or those of the publisher, the editors and the reviewers. Any product that may be evaluated in this article, or claim that may be made by its manufacturer, is not guaranteed or endorsed by the publisher.
References
Azar J. F., Bell B. D. (2016). Acoustic features within a forest bird community of native and introduced species in New Zealand. Emu-Austral Ornithology 116, 22–31. doi: 10.1071/MU14095
Banko W. E., Banko P. C. (2009). “Historic decline and extinction,” in Conservation Biology of Hawaiian Forest Birds: Implications for Island Avifauna. Eds. Pratt T. K., Atkinson C. T., Banko P. C., Jacobi J. D., Woodworth B. (Yale University Press, New Haven, CT), 25–58.
Berger A. J. (1974). “History of exotic birds in Hawaii,” in The ‘Elepaio (Honolulu, HI, USA: Hawaiʻi Audubon Society), vol. 35. , 60–65.
Bleach I. T., Beckmann C., Both C., Brown G. P., Shine R. (2015). Noisy neighbours at the frog pond: effects of invasive cane toads on the calling behaviour of native Australian frogs. Behav. Ecol. Sociobiology 69, 675–683. doi: 10.1007/s00265-015-1879-z
Both C., Grant T. (2012). Biological invasions and the acoustic niche: the effect of bullfrog calls on the acoustic signals of white-banded tree frogs. Biol. Lett. 8, 714–716. doi: 10.1098/rsbl.2012.0412
Bradbury J. W., Vehrencamp S. L. (2011). Principles of Animal Communication. 2nd ed (Sunderland, MA: Sinauer Associates, Inc).
Brumm H., Voss K., Koöllmer I., Todt D. (2004). Acoustic communication in noise: regulation of call characteristics in a New World monkey. J. Exp. Biol. 207, 443–448. doi: 10.1242/jeb.00768
Busnel R. (1977). “Acoustic communication,” in How animals communicate. Ed. Sebeok T. A. (Indiana University Press, Bloomington, IN), 233–251.
Cardoso G. C., Price T. D. (2010). Community convergence in birdsong. Evolutionary Ecol. 24, 447–461. doi: 10.1007/s10682-009-9317-1
Chek A. A., Bogart J. P., Lougheed S. C. (2003). Mating signal partitioning in multi-species assemblages: a null model test using frogs. Ecol. Lett. 6, 235–247. doi: 10.1046/j.1461-0248.2003.00420.x
Department of Land and Natural Resources, Division of Forestry and Wildlife: Wildlife Program (2023). Native Birds of Hawai‘i. Available online at: https://dlnr.hawaii.gov/wildlife/birds/ (Accessed November 10, 2023).
Duellman W. E., Pyles R. A. (1983). Acoustic resource partitioning in anuran communities. Copeia 1983, 639–649. doi: 10.2307/1444328
Eddinger C. R. (1970). A study of the breeding behavior of four species of Hawaiian honeycreeper (Drepanididae) (Honolulu (HI: Univ. of Hawai‘i, Honolulu).
Farina A., Pieretti N. (2014). Acoustic codes in action in a soundscape context. Biosemiotics 7, 321–328. doi: 10.1007/s12304-014-9213-0
Farina A., Pieretti N., Morganti N. (2013). Acoustic patterns of an invasive species: the Red-billed Leiothrix (Leiothrix lutea Scopoli 1786) in a Mediterranean shrubland. Bioacoustics 22, 175–194. doi: 10.1080/09524622.2012.761571
Foster J. T. (2005). Exotic bird invasion into forests of Hawaii: demography, competition, and seed dispersal (Urbana, (IL: University of Illinois at Urbana-Champaign).
Foster J. (2009). “The History and Impact of Introduced Birds,” in Conservation Biology of Hawaiian Forest Birds: Implications for Island Avifauna. Eds. Pratt T. K., Atkinson C. T., Banko P. C., Jacobi J. D., Woodworth B. (Yale University Press, New Haven, CT), 312–330.
Freed L. A., Cann R. L. (2009). Negative effects of an introduced bird species on growth and survival in a native bird community. Curr. Biol. 19, 1736–1740. doi: 10.1016/j.cub.2009.08.044
Giambelluca T. W., Shuai X., Barnes M. L., Alliss R. J., Longman R. J., Miura T., et al. (2014). Evapotranspiration of Hawai’i. Final report submitted to the U.S. Army Corps of Engineers—Honolulu District, and the Commission on Water Resource Management, State of Hawai’i. Available online at: http://evapotranspiration.geography.hawaii.edu/interactivemap.html.
Grant B. R., Grant P. R. (2010). Songs of Darwin’s finches diverge when a new species enters the community. Proc. Natl. Acad. Sci. 107, 20156–20163. doi: 10.1073/pnas.1015115107
Hart P. J., Ibanez T., Paxton K., Tredinnick G., Sebastián-González E., Tanimoto-Johnson A. (2021). Timing is everything: acoustic niche partitioning in two tropical wet forest bird communities. Front. Ecol. Evol. 9. doi: 10.3389/fevo.2021.753363
Hart P. J., Ibanez T., Uehana S., Pang-Ching J. (2020). Forest regeneration following ungulate removal in a montane Hawaiian wet forest. Restor. Ecol. 28, 757–765. doi: 10.1111/rec.13116
Hopkins J. M., Bower D. S., Edwards W., Schwarzkopf L. (2023). Effects of invasive toad calls and synthetic tones on call properties of native Australian Toadlets. J. Herpetology 57, 437–446. doi: 10.1670/23-004
Hopkins J. M., Edwards W., Schwarzkopf L. (2022). Invading the soundscape: exploring the effects of invasive species’ calls on acoustic signals of native wildlife. Biol. Invasions 24, 3381–3393. doi: 10.1007/s10530-022-02856-w
Kendall S. J., Rounds R. A., Camp R., Genz A. S., Cady T., Ball D. L. (2023). Forest bird populations at the Big Island National Wildlife Refuge Complex, Hawai’i. J. Fish Wildlife Manage 14, 410–432. doi: 10.3996/JFWM-22–035
Kleyn T., da Cruz Kaizer M., Passos L. F. (2021). Sharing sound: Avian acoustic niches in the Brazilian Atlantic Forest. Biotropica 53, 658–670. doi: 10.1111/btp.12907
K. Lisa Yang Center for Conservation Bioacoustics (2014). Raven Pro: Interactive Sound Analysis Software (Version 1.5) (Ithaca, NY: The Cornell Lab of Ornithology). Available at: http://ravensoundsoftware.com/.
Krause B. L. (1993). The niche hypothesis: a virtual symphony of animal sounds, the origins of musical expression and the health of habitats. Soundscape Newslett. 6, 6–10.
Krishnan A., Tamma K. (2016). Divergent morphological and acoustic traits in sympatric communities of Asian barbets. R. Soc. Open Sci. 3, 160117. doi: 10.1098/rsos.160117
Lerner H. R., Meyer M., James H. F., Hofreiter M., Fleischer R. C. (2011). Multilocus resolution of phylogeny and timescale in the extant adaptive radiation of Hawaiian honeycreepers. Curr. Biol. 21, 1838–1844. doi: 10.1016/j.cub.2011.09.039
Littlejohn M. J., Martin A. A. (1969). Acoustic interaction between two species of leptodactylid frogs. Anim. Behav. 17, 785–791. doi: 10.1016/S0003-3472(69)80027-8
Luther D. (2009). The influence of the acoustic community on songs of birds in a neotropical rain forest. Behav. Ecol. 20, 864–871. doi: 10.1093/beheco/arp074
Medeiros C. I., Both C., Grant T., Hartz S. M. (2017). Invasion of the acoustic niche: variable responses by native species to invasive American bullfrog calls. Biol. Invasions 19, 675–690. doi: 10.1007/s10530-016-1327-7
Memet E., Farrell B., Mahadevan L. (2022). An allometric prior enhances acoustic niche partitioning signal. J. R. Soc. Interface 19, 20220421. doi: 10.1098/rsif.2022.0421
Morton E. S. (1975). Ecological sources of selection on avian sounds. Am. Nat. 109, 17–34. doi: 10.1086/282971
Moulton M. P. (1985). Morphological similarity and coexistence of congeners: an experimental test with introduced Hawaiian birds. Oikos 44, 301–305. doi: 10.2307/3544703
Moulton M. P., Pimm S. L. (1983). The introduced Hawaiian avifauna: biogeographic evidence for competition. Am. Nat. 121, 669–690. doi: 10.1086/284094
Mountainspring S., Scott J. M. (1985). Interspecific competition among Hawaiian forest birds. Ecol. Monogr. 55, 219–239. doi: 10.2307/1942558
Paxton E. H., Laut M., Vetter J. P., Kendall S. J. (2018). Research and management priorities for Hawaiian forest birds. Condor 120, 557–565. doi: 10.1650/CONDOR-18-25.1
Paxton K. L., Sebastián-González E., Hite J. M., Crampton L. H., Kuhn D., Hart P. J. (2019). Loss of cultural song diversity and the convergence of songs in a declining Hawaiian forest bird community. R. Soc. Open Sci. 6, 190719. doi: 10.1098/rsos.190719
Planqué R., Slabbekoorn H. (2008). Spectral overlap in songs and temporal avoidance in a Peruvian bird assemblage. Ethology 114, 262–271. doi: 10.1111/j.1439-0310.2007.01461.x
Pratt D. H. (1994). Avifaunal changes in the hawaiian islands 1893–1993. Stud. Avian Biol. 15, 103–118.
Pyle R. L., Pyle P. (2017). The Birds of the Hawaiian Islands: Occurrence, History, Distribution, and Status. B.P. Bishop Museum, Honolulu, HI, U.S.A. Version 2. Available online at: http://hbs.bishopmuseum.org/birds/rlp-monograph (Accessed October 14, 2023).
R Core Development Team (2018). R: A Language and Environment for Statistical Computing (Vienna, Austria: R Foundation for Statistical Computing). Available at: https://www.R-project.org/.
Ruppé L., Clément G., Herrel A., Ballesta L., Décamps T., Kéver L., et al. (2015). Environmental constraints drive the partitioning of the soundscape in fishes. Proc. Natl. Acad. Sci. United States America 112, 6092–6097. doi: 10.1073/pnas.1424667112
Sato H. H., Ikeda. W., Paeth P., Smythe R., Takehiro M. (1973). Data from: Soil survey of the Island of Hawai’i, State of Hawai’i (Honolulu: United States Department of Agriculture, Soil Conservation Service, University of Hawai’i Agricultural Experiment Station).
Schmidt A. K., Römer H., Riede K. (2012). Spectral niche segregation and community organization in a tropical cricket assemblage. Behav. Ecol. 24, 470–480. doi: 10.1093/beheco/ars187
Slabbekoorn H., Ripmeester E. A. P. (2008). Birdsong and anthropogenic noise: implications and applications for conservation. Mol. Ecol. 17, 72–83. doi: 10.1111/j.1365-294X.2007.03487.x
Spiegel C. S., Hart P. J., Woodworth B. L., Tweed E. J., LeBrun J. J. (2006). Distribution and abundance of forest birds in low-altitude habitat on Hawai’i Island: evidence for range expansion of native species. Bird Conserv. Int. 16, 175–185. doi: 10.1017/S0959270906000244
Staniewicz A., Sokołowska E., Muszyńska A., Budka M. (2023). Competition for acoustic space in a temperate-forest bird community. Behav. Ecol. 34, 1043–1054. doi: 10.1093/beheco/arad075
Sueur J. (2002). Cicada acoustic communication: Potential sound partitioning in a multispecies community from Mexico (Hemiptera: Cicadomorpha: Cicadidae). Biol. J. Linn. Soc. 75, 379–394. doi: 10.1046/j.1095-8312.2002.00030.x
Tennessen J. B., Parks S. E., Tennessen T. P., Langkilde T. (2016). Raising a racket: invasive species compete acoustically with native treefrogs. Anim. Behav. 114, 53–61. doi: 10.1016/j.anbehav.2016.01.021
Thorpe W. H. (1963). Antiphonal singing in birds as evidence for avian auditory reaction time. Nature 197, 774–776. doi: 10.1038/197774a0
Tobias J. A., Planqué R., Cram D. L., Seddon A. N. (2014). Species interactions and the structure of complex communication networks. Proc. Natl. Acad. Sci. 111, 1020–1025. doi: 10.1073/pnas.1314337111
Todt D. (1981). On functions of vocal matching: effect of counter‐replies on song post choice and singing. Zeitschrift für Tierpsychologie 57, 73–93. doi: 10.1111/j.1439-0310.1981.tb01313.x
Keywords: acoustic niche hypothesis, acoustic overlap, birdsong, ecoacoustics, Hawai‘i, introduced species, signal partitioning
Citation: Hunt NJ, Ibanez T, Pack AA and Hart PJ (2024) Signal partitioning between native and introduced forest birds of Hawai‘i Island. Front. Ecol. Evol. 12:1399455. doi: 10.3389/fevo.2024.1399455
Received: 12 March 2024; Accepted: 15 July 2024;
Published: 08 August 2024.
Edited by:
Almo Farina, University of Urbino Carlo Bo, ItalyReviewed by:
Felipe N. Moreno-Gómez, Universidad Católica del Maule, ChileReiji Suzuki, Nagoya University, Japan
Copyright © 2024 Hunt, Ibanez, Pack and Hart. This is an open-access article distributed under the terms of the Creative Commons Attribution License (CC BY). The use, distribution or reproduction in other forums is permitted, provided the original author(s) and the copyright owner(s) are credited and that the original publication in this journal is cited, in accordance with accepted academic practice. No use, distribution or reproduction is permitted which does not comply with these terms.
*Correspondence: Noah J. Hunt, bmgzMkBoYXdhaWkuZWR1