- 1Division of Biological and Life Sciences, School of Arts and Sciences, Ahmedabad University, Ahmedabad, Gujarat, India
- 2Division of Mathematical and Physical Sciences, School of Arts and Sciences, Ahmedabad University, Ahmedabad, Gujarat, India
Introduction: Structural colour patterns and their functions in insect wings are less known. Wing interference patterns (WIPs) are colour patterns apparent when wings are viewed against black backgrounds; the angle of incident light and wing surface structures also influence the resulting wing colour pattern. To date, WIPs are correlated with mate attraction, while the impact of geography and environment on WIPs remains unexplored. We explore WIP variation in Drosophila melanogaster populations collected from three altitudes and also compare WIP variation in sibling species D. melanogaster and D. simulans reared at three different temperatures to understand if local selection pressures could also influence WIPs.
Methodology: Wings of D. melanogaster males were collected from three different altitudes, and D. melanogaster and D. simulans males reared at three different temperatures were imaged. Images were analysed for their relative red, green and blue content in the RGB colour space. In representative images, wing thickness was assessed using the Newton colour series.
Results: An altitudinal cline in WIPs was observed in the cosmopolitan D. melanogaster collected from the Western Himalayas. Relative RGB values and increase in altitudes were negatively correlated. Thermal responses in WIPs were parallel for both D. melanogaster and D. simulans. Relative RGB values were negatively correlated with rearing temperature. In both species, wing thickness measurements indicated that the wings of flies reared at low temperatures had greater blueness (cyan and magenta) compared to flies reared at moderate to high temperatures; the latter had more green and yellow content. Wing thickness pattern was also consistent for D. melanogaster flies collected from low versus higher altitudes.
Discussion: We find WIPs to be a plastic trait in response to temperature. WIP response to thermal variation corroborates with the temperature of the geographic origin in D. melanogaster. The adaptive significance of WIP variation and associated wing thickness remains unclear. Future studies could explore the underlying adaptive significance of structural colour patterning under different environmental conditions.
1 Introduction
Wing patterns in insects are diverse with some patterns being particularly captivating due to their vibrant colours. Vibrant colour patterns are an outcome of light interacting with refractive wing features for example veins, ridges, cross-ribs etc. Wing colour patterns have been extensively studied in the most visually striking insects’ viz. butterflies (Lloyd and Nadeau, 2021) and it is known that the thin laminar structure of butterfly wing scales produce bright, iridescent colours (Thayer et al., 2020). However, structural colouration of the non-iridescent nature is also common in several insect orders wherein only 20% of the light is reflected from the thin chitinous membrane (Kinoshita et al., 2008). Non-iridescent wing colouration is not as conspicuous as iridescent wing colours (Sun et al., 2013) since the former are apparent only under specific lighting conditions and when observed against certain backgrounds. Wing interference patterns (WIPs) are one such structural colour outcomes formed by thin-film interference when light striking on the transparent wing surface is refracted and reflected at a certain wavelength (Butterworth et al., 2021). WIP patterns are more visible and clear in darker versus brighter backgrounds (Katayama et al., 2014). Again, reflections could be affected by several morphological wing features, e.g., wing membrane thickness, presence of hairs, wing folds, or ridges, which could scatter light at different angles (Mason, 2002; Kinoshita et al., 2008). Additionally, the visibility of WIPs could be compromised against certain backgrounds and at acute geometries (Shevtsova et al., 2011).
WIPs have been noted to be a common phenomenon in several insects with clear wings and thin chitin layers (Sun et al., 2013). WIPs are prevalent in across Hymenoptera, Diptera, Odonata, and some Hemiptera as well (Shevtsova and Hansson, 2011; Simon, 2013; Brydegaard et al., 2018). However, WIPs still remain an ambiguous morphological trait and their role in insect life history is largely unknown (Shevtsova and Hansson, 2011; Conrow and Gelhaus, 2022). Since insects have an exceptional ability to perceive and discriminate colours (Hymenoptera (Peitsch et al., 1992); Diptera (Lunau, 2014), few studies suggest that WIPs function as species and sex-specific mating cues (Shevtsova and Hansson, 2011; Shevtsova et al., 2011; Buffington and Sandler, 2012; Simon, 2013). A study on blowflies suggested that WIPs could be involved in mate signalling, wherein males with certain WIPs were more preferred by females (Butterworth et al., 2021). It was also observed that WIPs differences in males were species-specific in that WIP mean colour and contrast varied among blowfly species (Butterworth et al., 2021). While WIPs could be a trait differentiating species, WIPs could also be an excellent trait to study mate choice and sexual selection under different light regimes (Denoël and Doellen, 2010). However, WIP studies are known from negligible proportion of insects ca. 0.01% (Butterworth et al., 2021).
The role of WIPs in mate signalling is corroborated by studies exploring the response of the WIPs to sexual selection under laboratory conditions in Drosophila species (Katayama et al., 2014; Hawkes et al., 2019). Mating signals and sexual selection have been widely studied in the popular Drosophila genera (Spieth, 1974; Markow, 1996; Taylor et al., 2007; Ingleby et al., 2013) but the biological role of WIPs other than mate attraction has not received much attention. In Drosophila simulans (Hawkes et al., 2019) males under sexual selection were found to be more attractive to females than males not exposed to sexual selection (Hawkes et al., 2019). Male attractiveness in this case was based on the luminance and contrast of the WIPs, which differed among males under and not under sexual selection regimes. Another study in the closely related, Drosophila melanogaster reports males with more magenta on their wings tend to be more attractive to the females than male wings which reflect more blue or yellow colour, further adding to the visual element of the mating array in Drosophila species (Katayama et al., 2014). Sexual dimorphism in WIP patterns has been observed in other insects too, e.g. crane flies (Conrow and Gelhaus, 2022), blowflies (Butterworth et al., 2021) and wasps (Hosseini et al., 2021). Yet, the characterization of WIPs using quantitative approaches has been less prevalent (Butterworth et al., 2021). Further, our current understanding of WIPs clearly lacks any influence of local geographical conditions and changing developmental temperatures. Temperature has often been found to be a key player in setting up varying colour patterns in Drosophila species (Gibert et al., 2017). Many insect populations are thermally plastic (i.e. trait response to different temperatures), which could be adaptive in adjusting to rapidly changing environmental conditions (Rodrigues and Beldade, 2020). The changing environment implies temperature fluctuations along with other environmental variables that can impact trait expression and trait evolution (Kaunisto et al., 2016; Westneat et al., 2019). If temperature affects wing functions in insects (Tsai et al., 2020), it is worth exploring if the WIPs respond to thermal changes and possible ecological implications.
Here, in this study we examine the recently collected natural populations of D. melanogaster for elevational differences in WIPs. To understand thermal plasticity of WIPs we reared two sibling species D. melanogaster and D. simulans at three growth temperatures (18°C, 23°C and 28°C). We observed significant variation in WIPs along elevations and at different growth temperatures.
2 Materials and methods
2.1 Stocks and maintenance
D. melanogaster adults were collected from Chandigarh (30.7333° N, 76.7794° E), Chamba (32.5534° N, 76.1258° E) and, Rohru (31.77° N, 77.80° E) (Figure 1) by either placing baits or directly with the help of an insect net. All field-collected females were placed in separate vials (in isolation) to set up isofemale genetic lines. All the lines were transported to the laboratory and maintained on standard fly media (Agar – Jaggery – Yeast – Maize flour) at 23°C temperature (12:12 hours light and dark cycle respectively). The vials were then checked every day for any eggs or larvae. The vials that showed the presence of eggs were kept while the rest were discarded. All viable isofemale lines were identified based on males with the help of taxonomic keys. At the end we had ten isofemale lines from Chandigarh, fifteen isofemale lines from Chamba, and eighteen isofemale lines from Rohru.
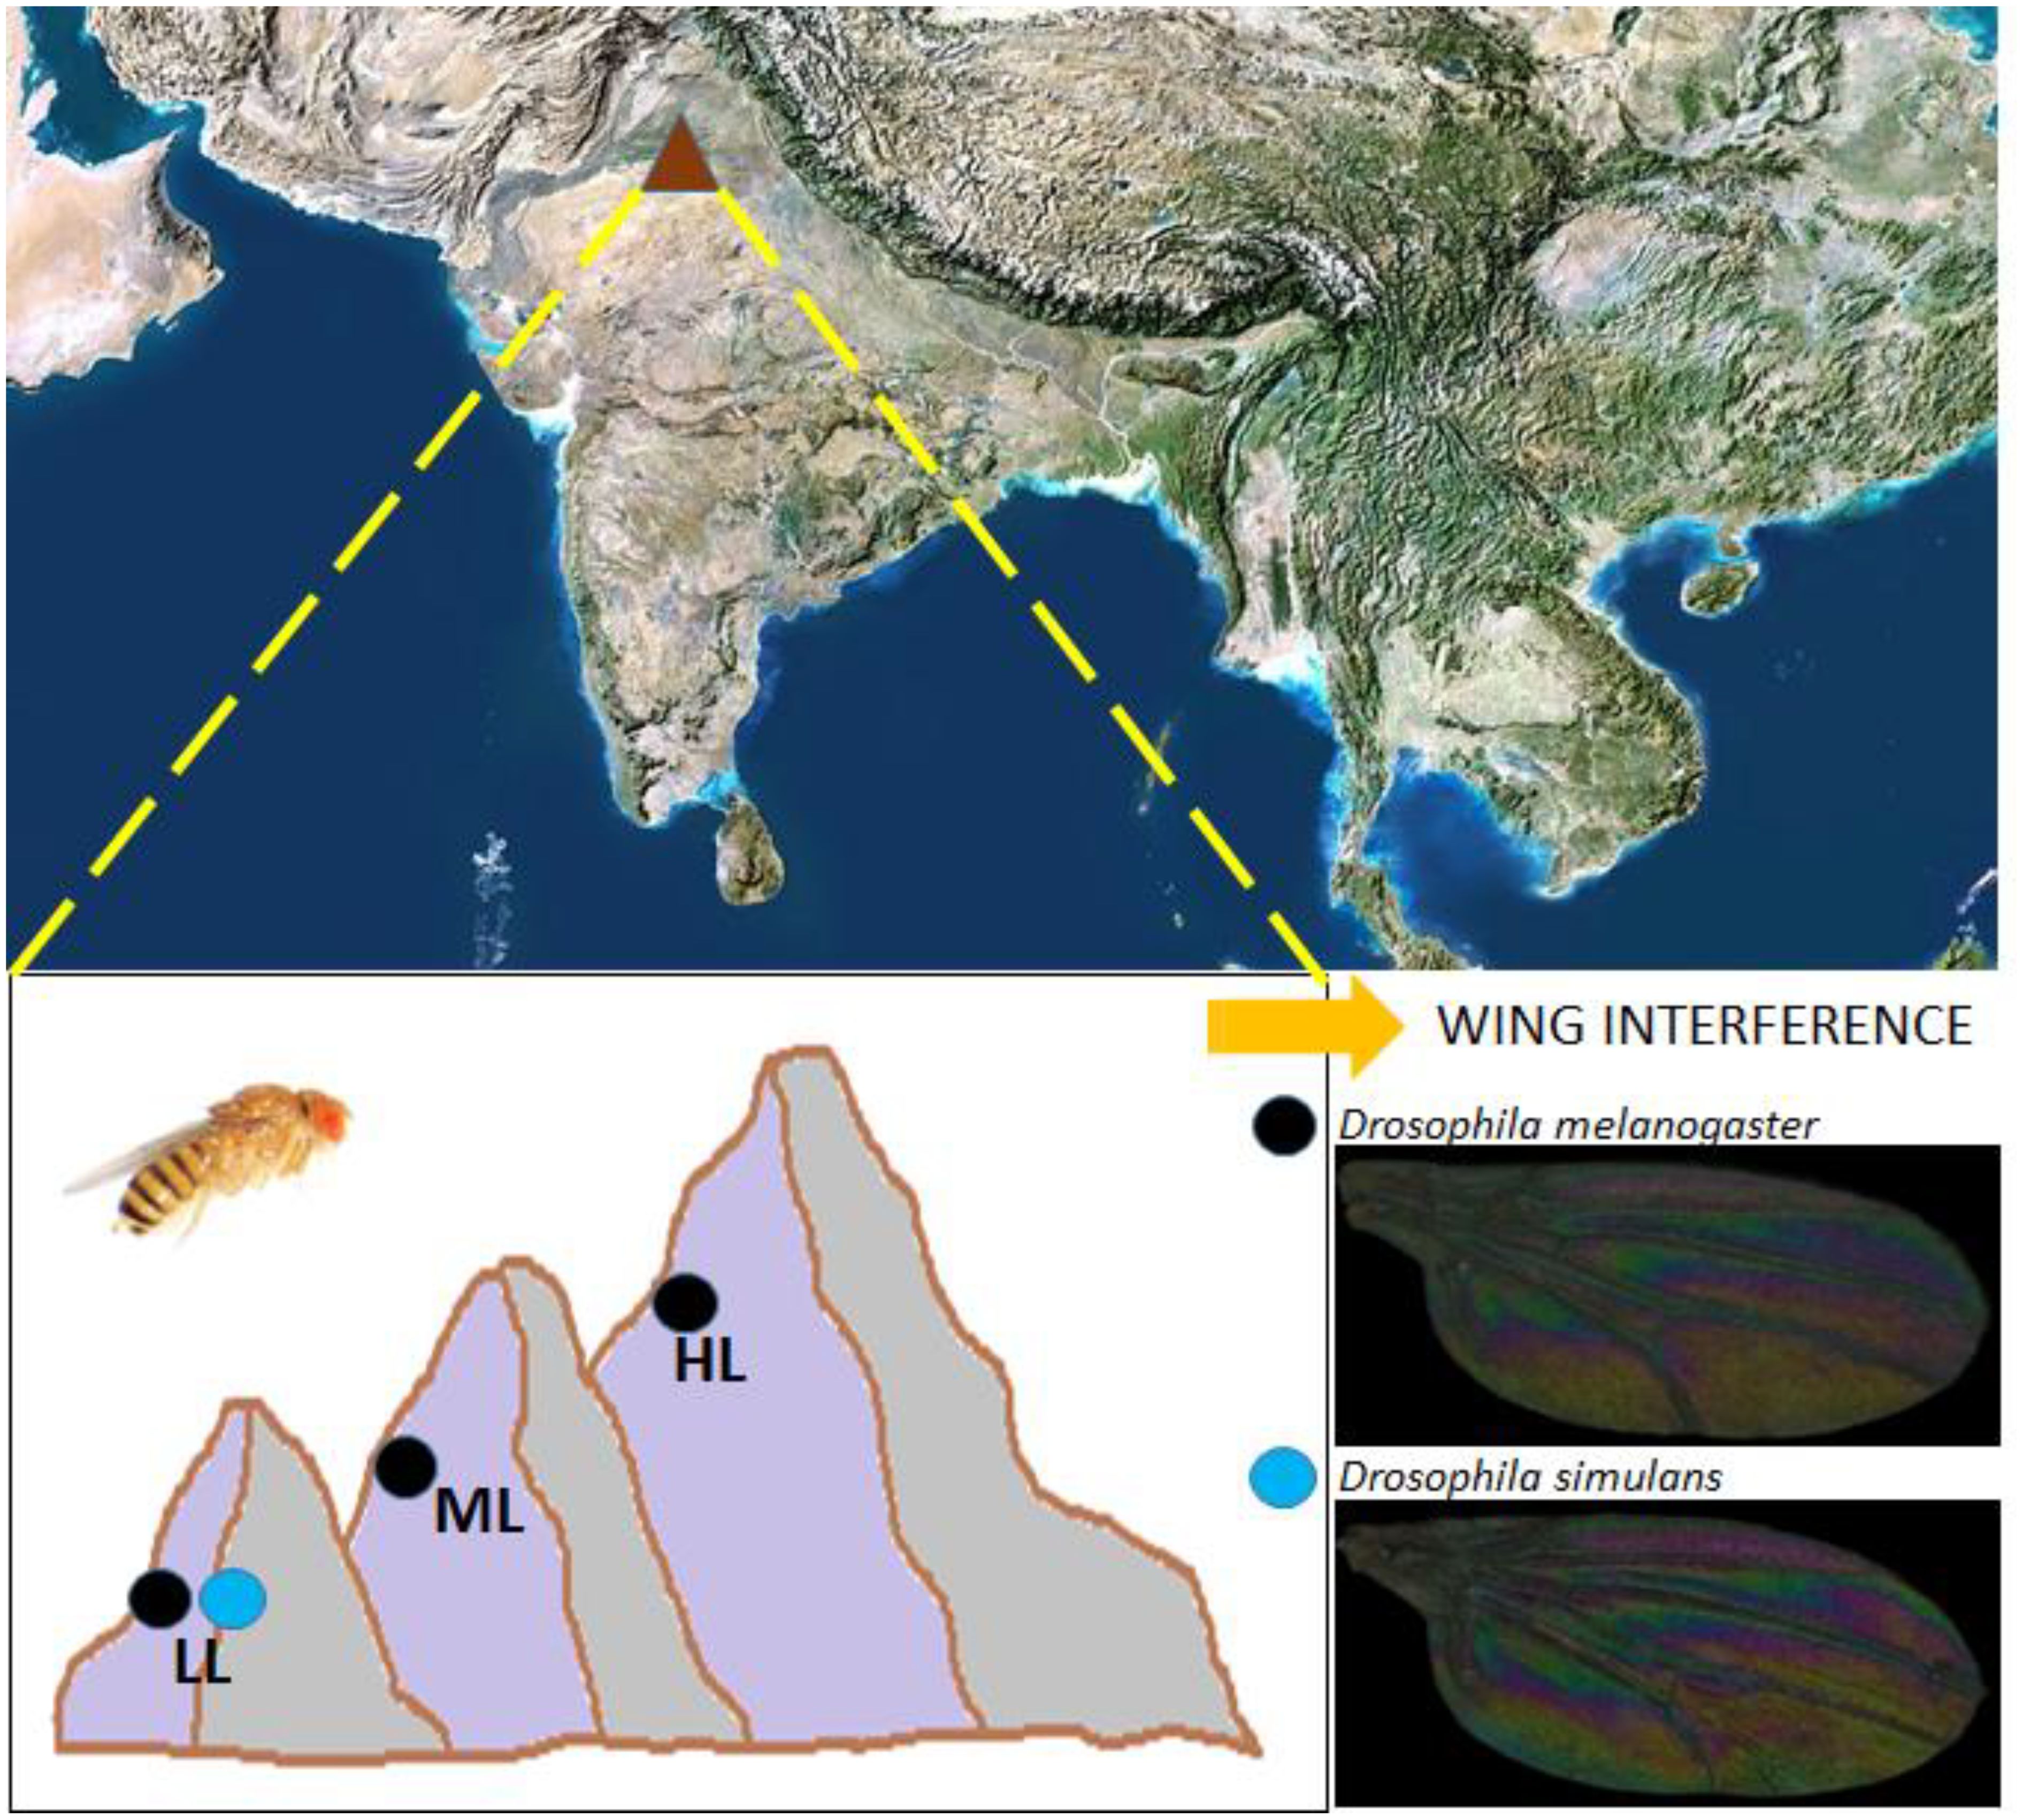
Figure 1. Sites of origin of collection of natural populations of D. melanogaster and D. simulans. D. melanogaster was collected from Chandigarh (30.7333° N, 76.7794° E), Chamba (32.5534° N, 76.1258° E), and Rohru (31.77° N, 77.80° E) whereas D. simulans comes from Chandigarh (30.7333° N, 76.7794° E). The elevations of these collections ranged from 321-2592 metres above sea level in the Western Himalayas.
2.2 Altitudinal variations
To study altitudinal variations in WIPs in D. melanogaster we randomly picked six isofemale lines from each of the elevation sites (Chandigarh: 321 m, Chamba: 996 m, Rohru: 2592 m) (Figure 1). Flies (10 mated females per line) were allowed to lay eggs in 30 ml vials for 12 hours. After 12 hours, the eggs were counted under a stereo zoom microscope and extra eggs (i.e. more than 30) were removed from each vial. Post-eclosion, adults were collected and placed in fresh vials for five days. Five adult males were randomly chosen per line on the sixth day, wings from these males were removed and mounted on a glass slide. In total, thirty wings per location were analysed i.e., six isofemale lines and five males per line.
2.3 Thermal plasticity
Ten isofemale lines of D. melanogaster and five isofemale lines of D. simulans, were randomly chosen for WIP thermal plasticity assays from the same altitude (Figure 1); Chandigarh. Eggs (around 30) were collected in triplicate and sorted into vials (30 eggs per vial) as explained above. Post egg collection vials were placed in three BOD incubators set at three temperatures (18°C, 23°C and 28°C) with 12:12 hour light and dark cycle settings. Post eclosion, adults were transferred to fresh food vials until they reached the age of five days. On the sixth day wings of five males from each isofemale line were removed and mounted on glass slides and were studied for thermal plasticity effect.
2.4 RGB characterization
Wings were imaged under a camera fitted within the stereo microscope (Leica S9i, Germany). Wing images were acquired under uniform light settings (using LED ring light- Amscope) and at 50X magnification with 19.5 exposure and 5 Gain. Images were processed using ImageJ software (Version 2.14) (Schneider et al., 2012) and the entire wing area was selected using the polygon function. RGB measurements of the entire wing were obtained from the inbuilt function “RGB measure” of the ImageJ software. We analysed variation in relative redness (RR), relative greenness (RG), and relative blueness (RB) across wings (Jin et al., 2023). Relative values of RR, RG, and RB were a ratio of either the red/green/blue colour divided by the average of red, green, and blue measurements (Jin et al., 2023). Since wings are smaller at high temperature compared to low temperatures (refer to “Total wing area” in Supplementary Tables 1, 2), we corrected for wing size in both the thermal plasticity and altitudinal population data by dividing the relative indices RR, RG and RB with the total wing area. All ratios were tested for normality with the Shapiro-wilk test for normality (Supplementary Tables 1, 2) through the R statistical software package (Team RC, 2000). The effect of geographic origin and temperatures on WIPs was tested on size-corrected ratios of RR, RG, and RB (relative RR, RG, and RB) for statistical differences by ANOVA. Relative RR, RG, and RB variation, across altitudes (Chandigarh: 321 m, Chamba: 996 m, Rohru: 2592 m) was assessed by Tukey’s HSD only in D. melanogaster. Similarly, relative RR, RG, and RB variation across three temperatures (18°C, 23°C, and 28°C) for D. melanogaster and D. simulans was assessed by Tukey’s HSD.
2.5 Thickness measurements of the wings
Wing thickness was indirectly measured using computer generated Newton series of colours in insects [as shown in (Shevtsova et al., 2011)]. The Newton colour series represents bands from the spectral to non-spectral range from 50 nm to 1500 nm (Shevtsova et al., 2011). The first three orders, i.e., up to 600 nm in the wing membrane, exhibit a comprehensive array of spectral colours with the exception of pure red. With increasing orders corresponding to increased wing thickness displaying a repetitive pattern of non-spectral colours, seen as magentas and greens, with a gradual transition to a uniformly pale grey. The second and third orders within this sequence are the most luminous. This systematic progression of colours allows for the reciprocal calculation and mapping of membrane thickness within the approximate range of 50 nm to 1500 nm when juxtaposed with a Newton colour series scale (Shevtsova et al., 2011). We extrapolated wing thickness measurements using the same Newton colour series (Shevtsova et al., 2011). In all we processed nine wings (three altitudes of D. melanogaster and three different temperatures of D. melanogaster and D. simulans, 3 each). Image choice for the wing thickness assessment was based on the median of the greenness (size corrected) channel (Supplementary Tables 1, 2). The wing images were colour-corrected using a Photoshop script which identifies the true blacks and adjusts the RGB curves accordingly. Using Python, the backgrounds from each one of these corrected images were removed using the rembg (Gatis, 2022) library, cropped appropriately using the PIL (Clark, 2015) library, and finally resized to a smaller scale for easier processing. For each pixel in the processed wing image, the closest matching RGB value from the Newtonian scale was identified. This closest match was used to assign a corresponding thickness value to the pixel, generating a thickness map.
3 Results
We use the RGB colour space to analyse our data. Accordingly, WIPs differ in their relative redness, greenness, and blueness in response to geographic origin and thermal variation experienced during growth. We find that relative RGB variation at lower temperatures mimics that at higher altitudes in Drosophila melanogaster indicating a strong influence of temperature on WIP. Thermal variation observed in D. melanogaster is also consistent in the sibling species, D. simulans.
3.1 Altitudinal differences in WIPs
WIPs varied among wings from altitudinal populations. We first compared the mean values of the sum of relative RGB colour channels corrected for wing size across three altitudes using ANOVA. Mean relative RGB values differed across all three altitudes (mean square = 3.129e-13, F = 43.25, P < 0.001) (Figure 2). Further, we compared relative mean values (size corrected) of individual R, G and B channels across altitudes. Accordingly, relative redness differed across the three altitudes (mean square = 1.338e-13, F = 23.08, P < 0.001) (Figure 2; Table 1). Pairwise comparisons indicated that redness is higher in low altitude compared to middle altitude (mean difference = -1.035e-07, P < 0.001) and high altitudes (mean difference = -1.298e-07, P < 0.001). However, redness was similar across middle and high altitudes (mean difference = -2.633e-08, P = 0.412). Further, wing greenness also differed across the three altitudes (mean square = 1.872e-13, F = 25.54, P < 0.001) (Figure 2). Pairwise comparisons indicated that greenness was lower at low altitude compared to middle altitude (mean difference = -1.221e-07, P < 0.001), and high altitudes (mean difference = -1.537e-07, P < 0.001) but greenness was similar across middle and high altitudes (mean difference = -3.16e-0, P = 0.376) (Table 1). Wing blueness differed across all altitudes (mean square = 3.952e-14, F = 13.64, P < 0.001) (Figure 2). Low and middle altitudes did not differ in their blueness (mean difference = -1.675e-08, P = 0.492) (Table 1). However, compared to high altitudes wing blueness was lower in both low altitude (mean difference = -7.165e-07, P < 0.001) as well as middle altitude (mean difference = -5.489e-08, P = 0.001) differing in their blueness respectively (Figure 2; Table 1).
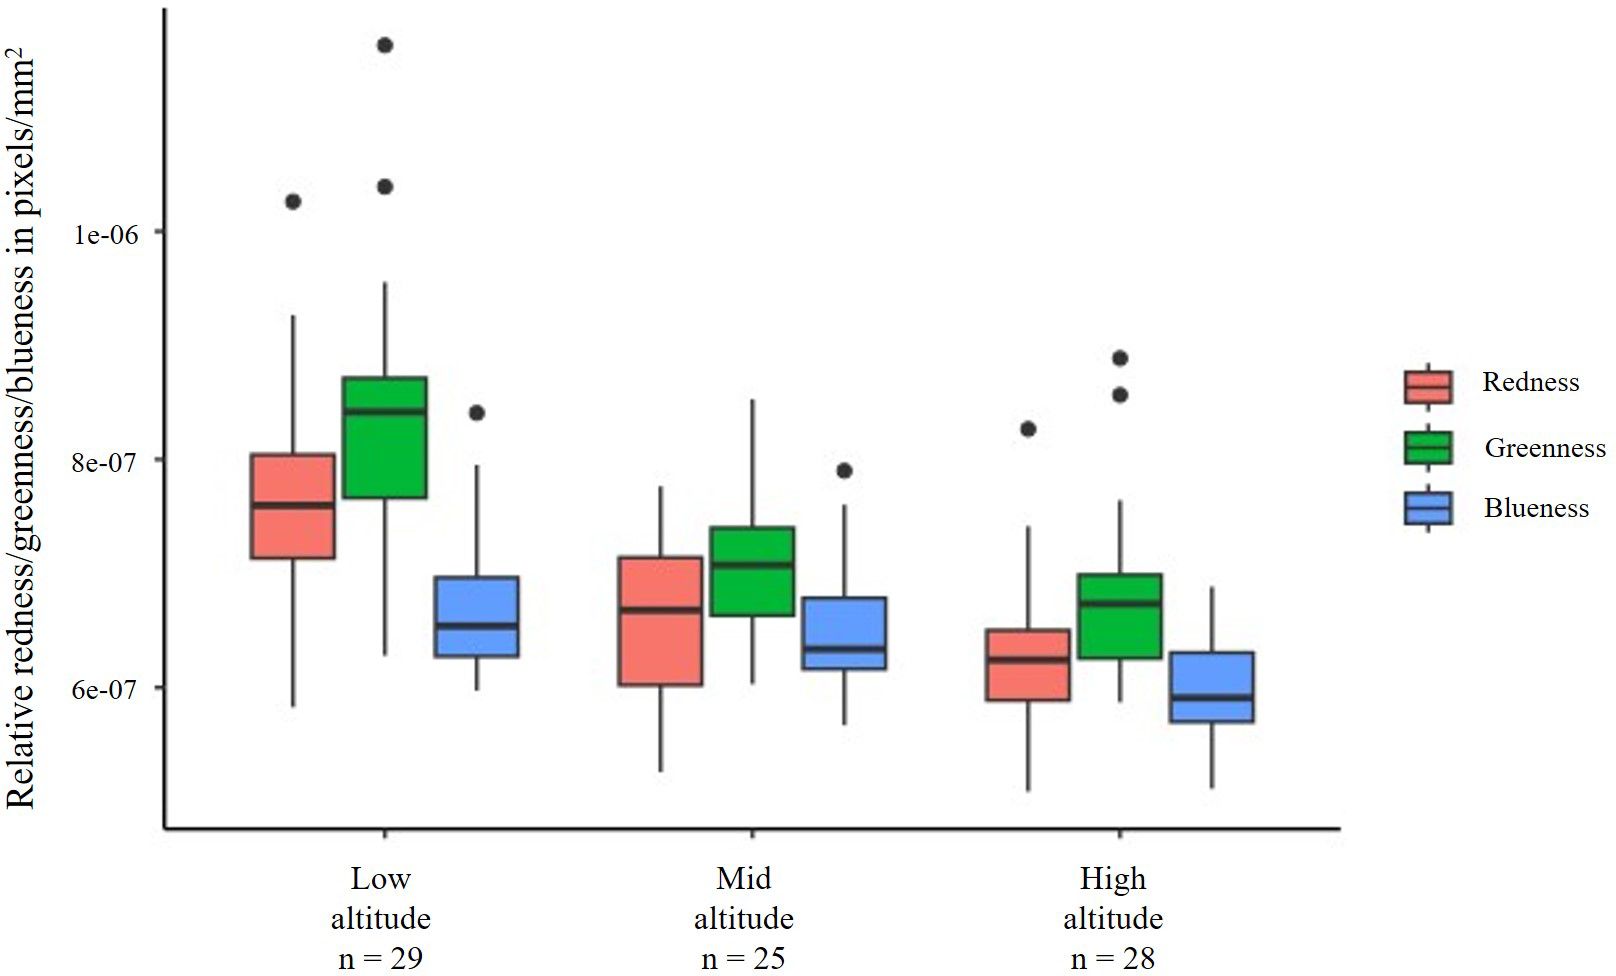
Figure 2. The box and whisker plot depicts the variations in the relative redness, greenness, and blueness in the wings of D. melanogaster (males only) collected from three different locations (Chandigarh, Chamba and Rohru). The central line in the box is the median, and the edges of the box are interquartile (Q1-Q3) range. Whiskers extend beyond the box edges and dots outside the whiskers are outliers. A clear trend is noted in relative RGB values of WIPs with respect to altitudes. Relative RGB values were lower in wings of flies from higher altitudes compared to lower altitudes. Lower RGB values imply darker colours and hence, wings of flies from higher altitude could be inferred to be darker in colouration than wings from lower altitude.
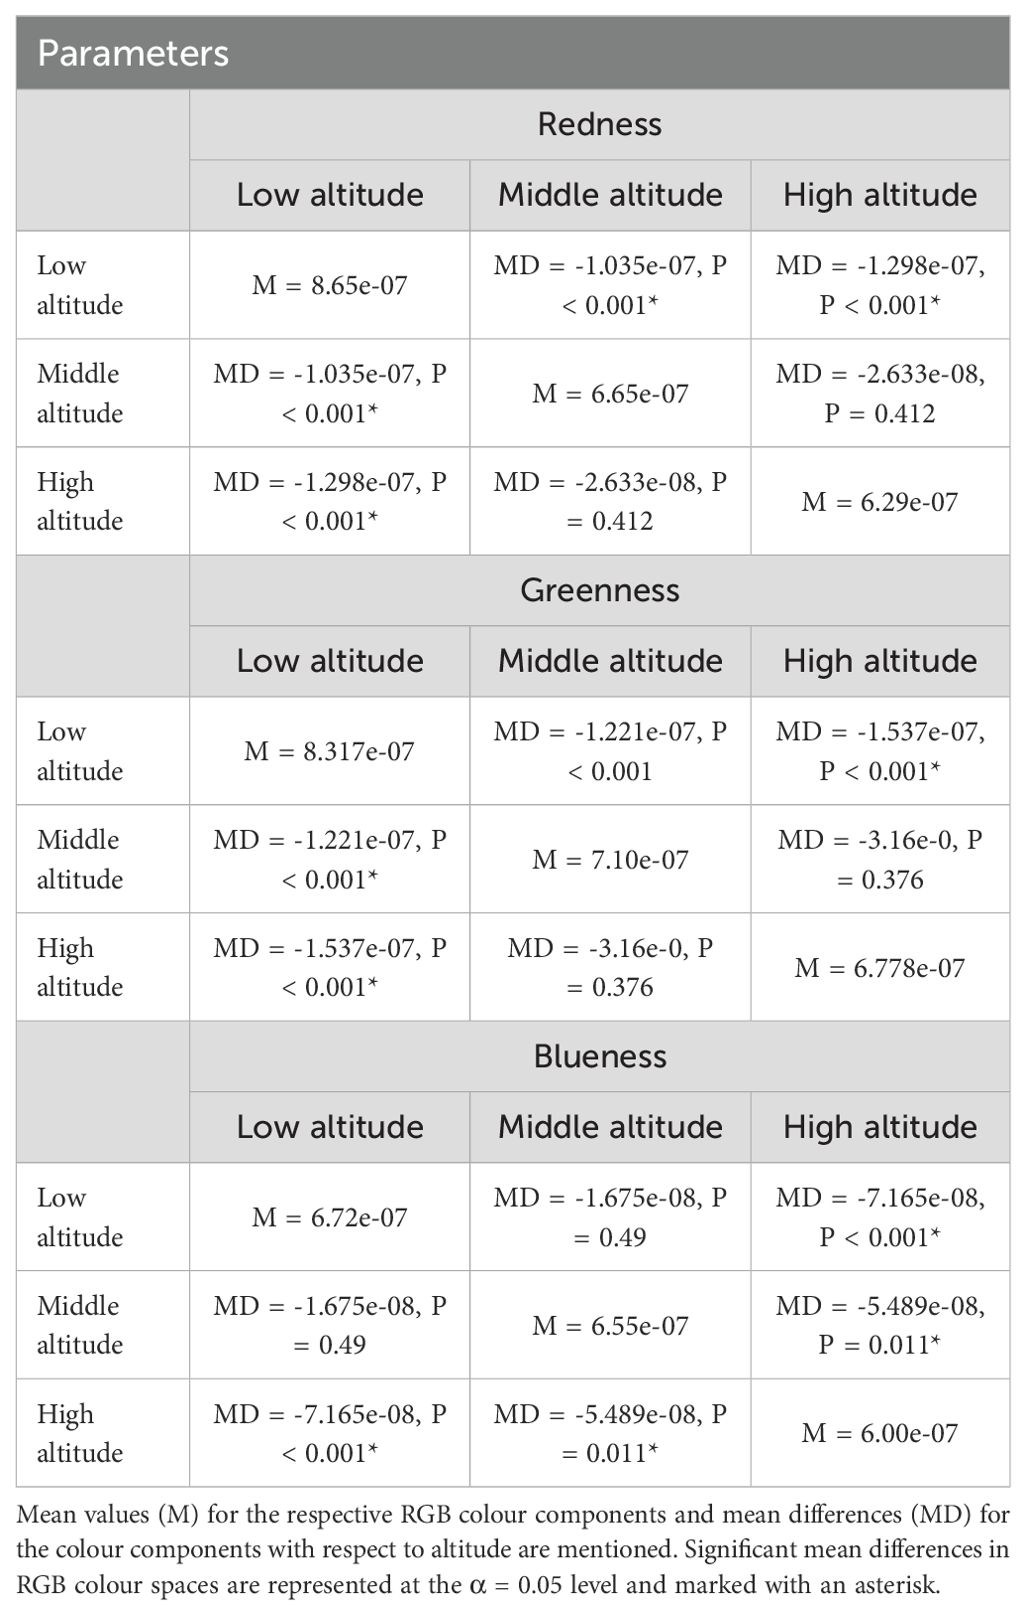
Table 1. Table represents variation in relative redness, greenness, and blueness values corrected for wing size of D. melanogaster across low, middle, and high altitudes.
3.2 Correlation of growth temperatures with WIPs
Developmental temperature was correlated with the relative RGB colouration of WIPs. In D. melanogaster, RGB colour channels combined and corrected for wing size differ across temperatures (mean square = 1.782e-12, F = 191.9, P < 0.001) (Figure 3). Further, comparing across RGB channels, redness differed (mean square = 6.544e-13, F = 161.8, P < 0.001) across all three temperatures (Figure 3). However, the wings of flies reared at 18°C had lower redness compared to the wing redness of flies reared at 23°C (mean difference = 5.842e-08, P < 0.001). Wing redness of flies reared at 28°C was higher than wing redness of 23°C reared flies (mean difference = 2.218e-07, P < 0.001) (Table 2). Further, wings of flies reared at 28°C had higher redness compared to those reared at 18°C (mean difference = 1.633e-07, P < 0.001) (Figure 3; Table 2). Greenness differed (mean square = 4.253e-13, F = 59.7, P < 0.001) across all three temperatures (Figure 3). Also, within temperatures, wing greenness was lower for flies reared at 18°C in comparison to flies reared at 23°C (mean difference =4.494e-08, P = 0.035) and 28°C (mean difference = 1.334e-07, P < 0.001). Wing greenness was higher for flies grown at 28°C compared to 23°C (mean difference = 1.783e-07, P < 0.001) (Figure 3; Table 2). Wing blueness differed at three rearing temperatures (mean square = 7.265e-13, F = 209.1, P < 0.0001) (Figure 3). Wings were more blue when flies were reared at 28°C compared to rearing at either 18°C (mean difference = 2.289e-07, P < 0.001) or 23°C (mean difference = 1.850e-07, P < 0.001) (Figure 3; Table 2). Also, wing blueness was higher at 23°C (mean difference = 4.388e-08, P = 0.002) compared to wing blueness at 18°C.
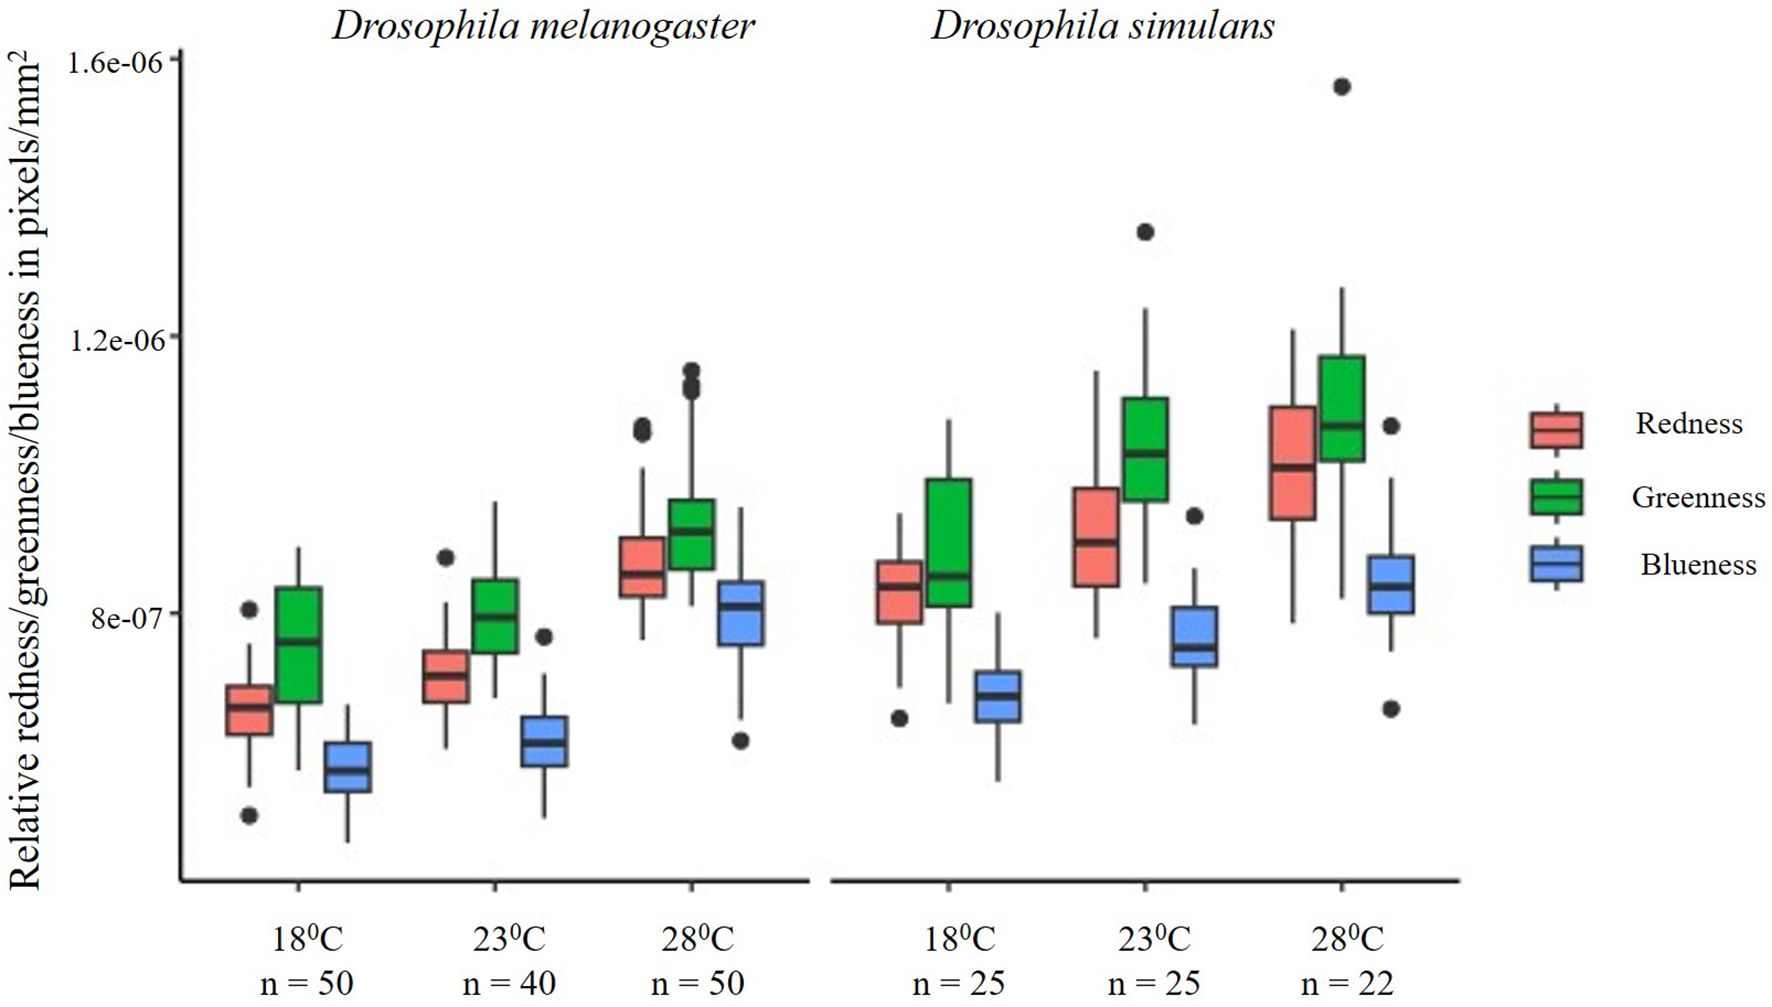
Figure 3. The box and whisker plot depicts the variations in the relative redness, greenness, and blueness for each temperature in which both sibling species D. melanogaster (left) and D. simulans (right) were reared. Relative RGB values increased from 18°C to 23°C and from 23°C to 28°C for both species. The central line in the box is the median, and the edges of the box are interquartile (Q1-Q3) range. Whiskers extend beyond the box edges and dots outside the whiskers are outliers. In both species, the RGB values of WIPs become lighter with the increase in temperature. Thus, males grown at 28°C are lighter with respect to RGB colouration compared to the males grown at a lower (18°C) temperature. Lower RGB values imply darker colouration, and hence, flies reared at lower temperatures could be inferred to have darker wings compared to flies reared at higher temperatures.

Table 2. Table represents relative redness, greenness, and blueness values corrected for wing size in response to growth at 18°C, 23°C, and 28°C in D. melanogaster and D. simulans.
In D. simulans, temperature influenced the overall relative redness, greenness, and blueness. We first compared the mean of the sum of relative RGB colour channels corrected for wing size across temperatures using ANOVA and found significant differences across three temperatures (mean square = 6.297e-13, F = 31.04, P < 0.0001) (Figure 2; Table 2). Further, we compared relative mean values (size corrected) of individual R, G and B channels across temperatures. Accordingly, redness differed (mean square = 2.101e-13, F = 22.59, P < 0.0001) across all three temperatures (Figure 2). However, the wings of flies reared at 18°C had lower redness compared to the wing redness of those reared at 23°C (mean difference = 8.668e-08, P = 0.006, Table 2). The wing redness of flies reared at 28°C was higher than the wing redness of flies reared at 23°C (mean difference = 1.028e-07, P = 0.001). Further, the wings of flies reared at 28°C had higher redness compared to those reared at 18°C (mean difference = 1.894e-07, P < 0.001) (Figure 2). Greenness differed (mean square = 2.882e-13, F = 18.06, P < 0.001) across all three temperatures (Figure 2). Also, within temperatures, wing greenness was lower for flies reared at 18°C in comparison to flies reared at 23°C (mean difference =1.549e-07, P < 0.001) and 28°C (mean difference = 2.119e-07, P < 0.001, Table 2). Wing greenness was similar for flies grown at 28°C compared to 23°C (mean difference = 5.698e-08, P = 0.277) (Figure 2). Wing blueness differed at three rearing temperatures (mean square = 2.21e-12, F = 120.3, P < 0.0001) (Figure 2). Wings had higher blueness when flies are reared at 28°C compared to rearing at either 18°C (mean difference = 1.991e-07, P < 0.001) or 23°C (mean difference = 1.203e-07, P < 0.001) (Figure 2; Table 2). Also, wing blueness was higher at 23°C (mean difference = 7.877e-08, P < 0.001) compared to wing blueness at 18°C.
3.3 Wing thickness across elevation and at different growth temperatures
Wing thickness varies with the topography of the wing which eventually affects the colour formation on the surface. Wing thickness of D. melanogaster was assessed in representative images (Figure 4) and compared (Figure 4) with the Newtonian colour series (Shevtsova et al., 2011). Wings appear to be higher in magenta, cyan and blue colouration at higher altitudes and also at lower temperatures (Figures 4, 5). Alternately, wings at lower altitudes and higher temperatures appear to have more green, yellow, and cyan colouration. We cannot confirm these trends as a single image was used for colour correction and subsequently for generating the Newton series map. Hence, at this stage, our qualitative observations cannot be quantitatively confirmed, which could be studied systematically in future studies.
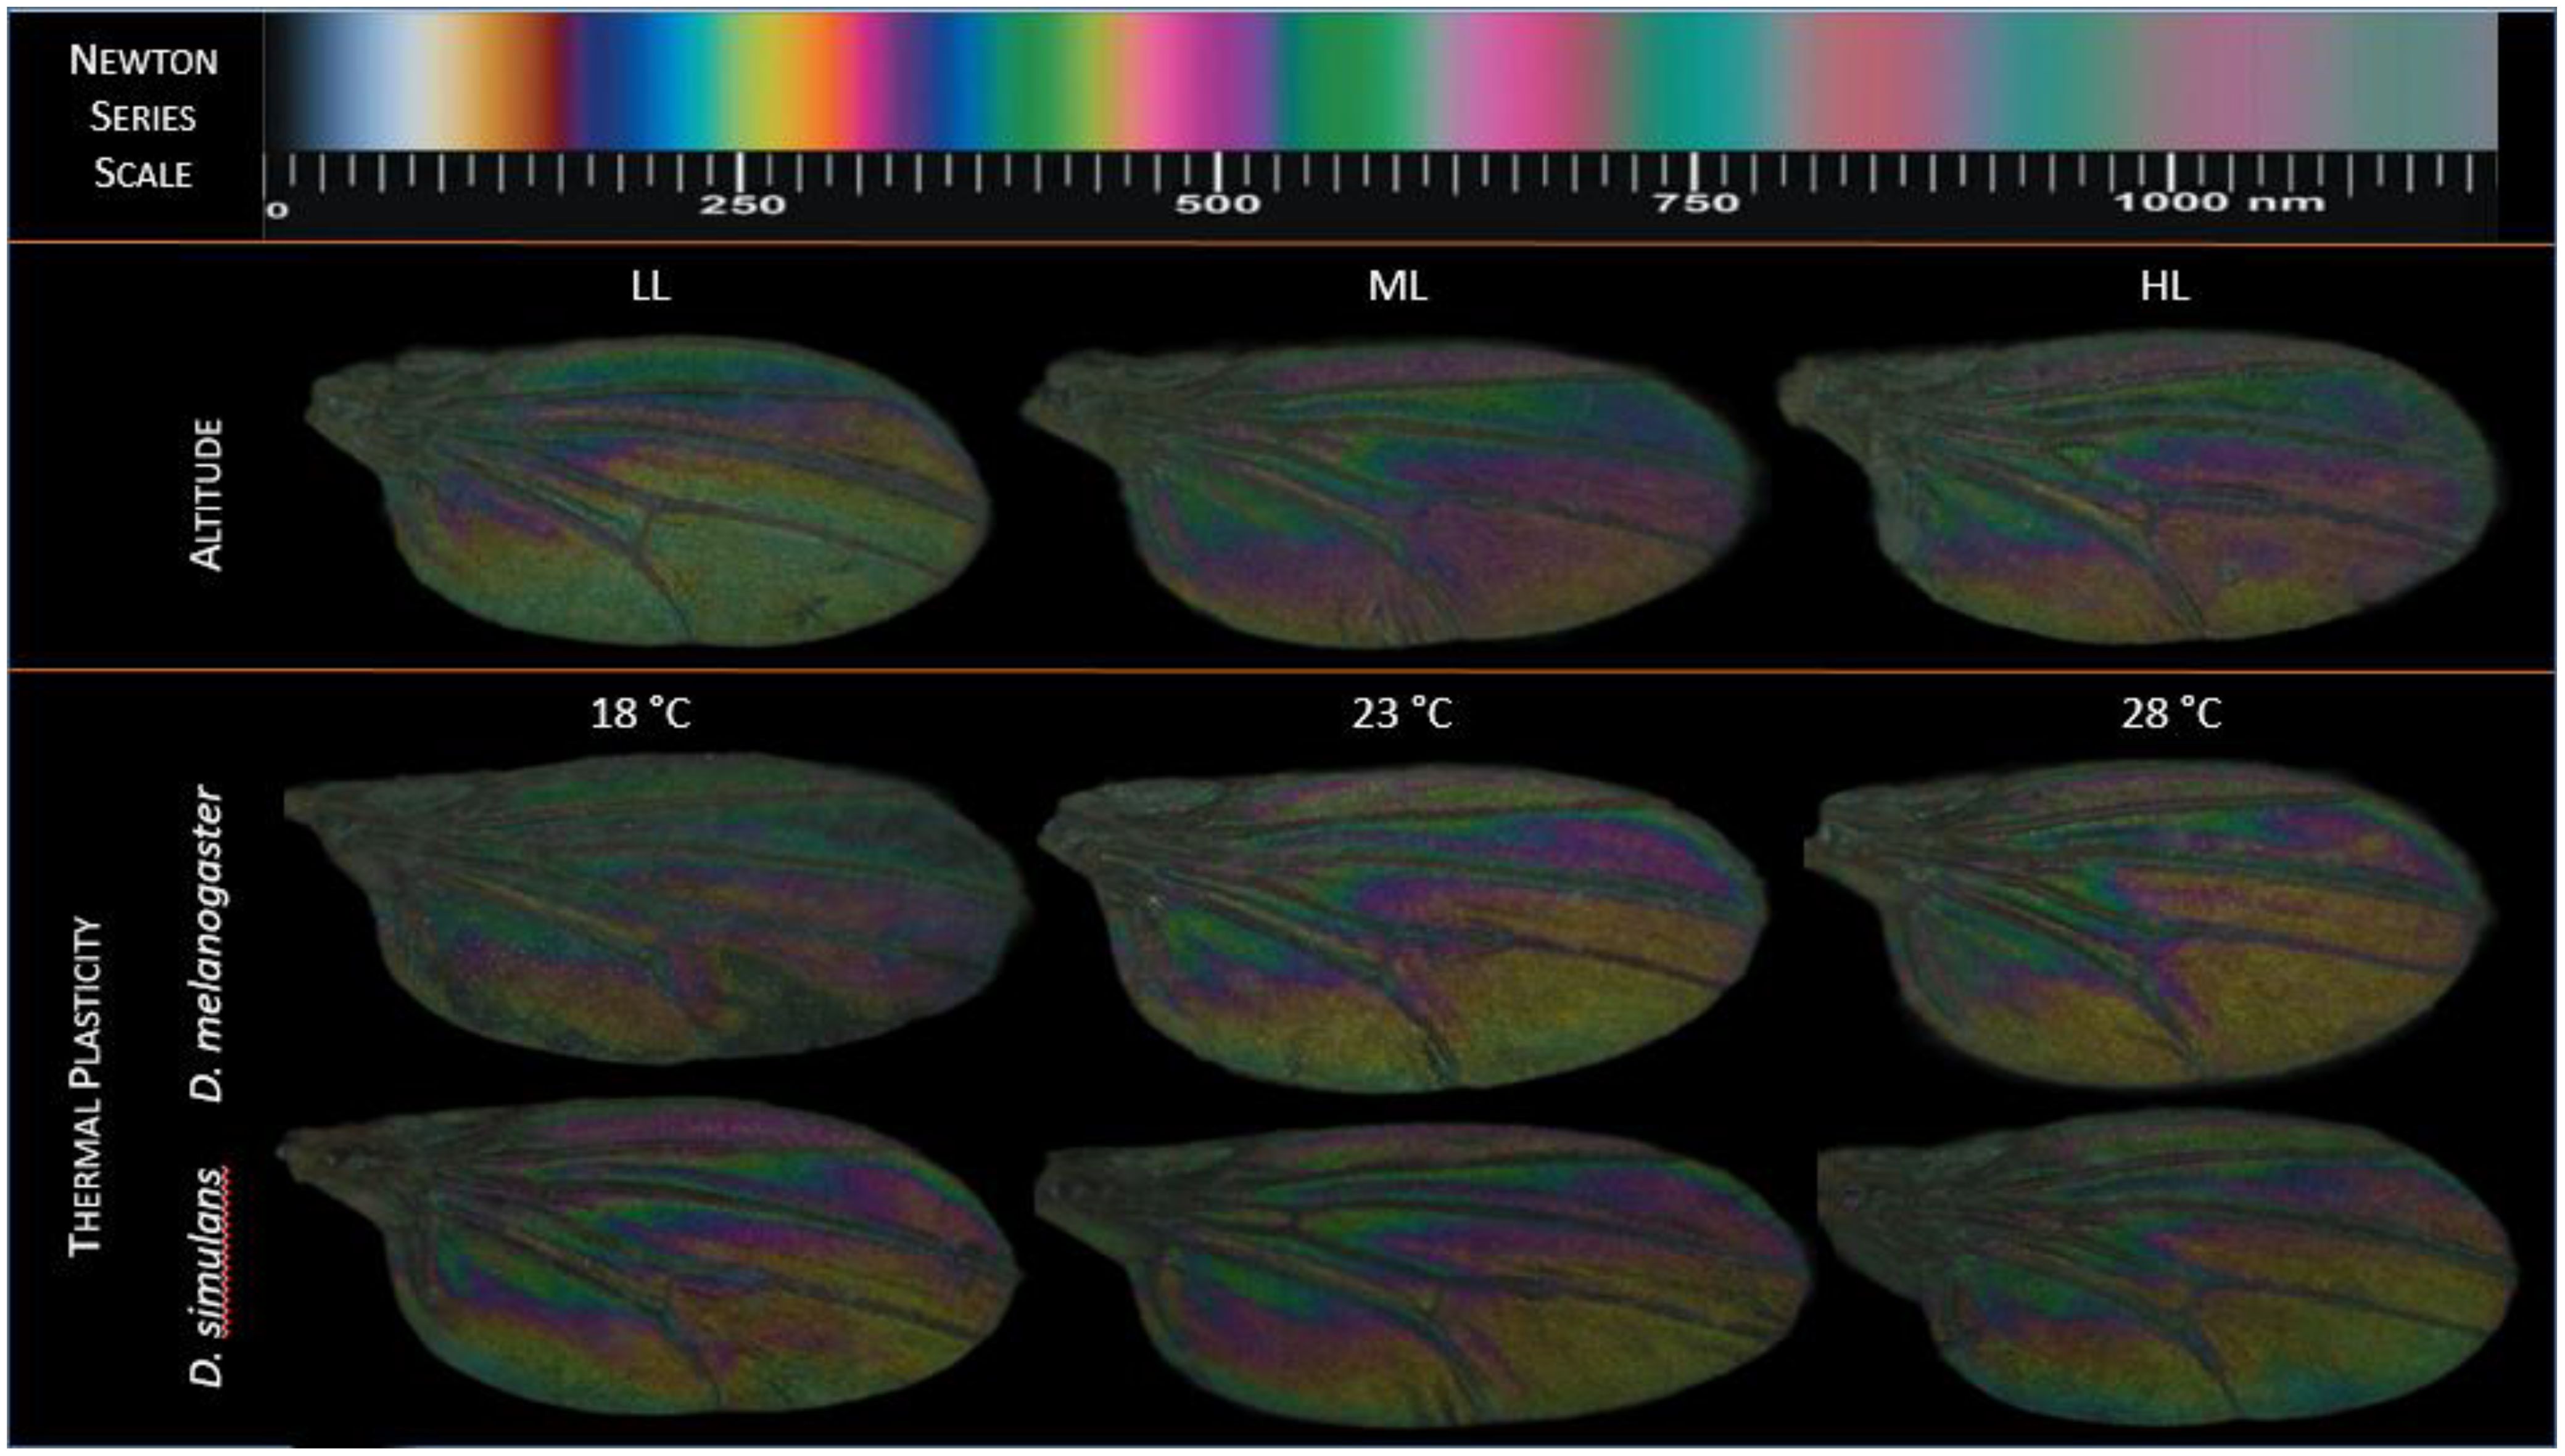
Figure 4. Representative wing images were selected on the basis of greenness (size corrected) median for altitudes (uppermost panel), thermal plasticity for D. melanogaster (middle panel) and D. simulans (lowermost panel). Relative RGB colour variations have been mapped to the Newton colour series. Wings appear to have a higher proportion of blue, magenta at both middle and high altitudes compared to the lowest altitude. The lowest altitude is represented by cyan, yellow, and green colouration than magenta or blue. Similarly, wings of both sibling species D. melanogaster and D. simulans grown at three different temperatures (18°C, 23°C, 28°C) differ in relative RGB values, with wings from lower temperatures in both species appearing higher in blue, magenta and cyan colouration while yellow and green are more predominant at higher temperatures. Overall RGB colour patterns at higher altitudes/higher temperatures mimic those observed at lower temperatures/lower altitudes respectively.
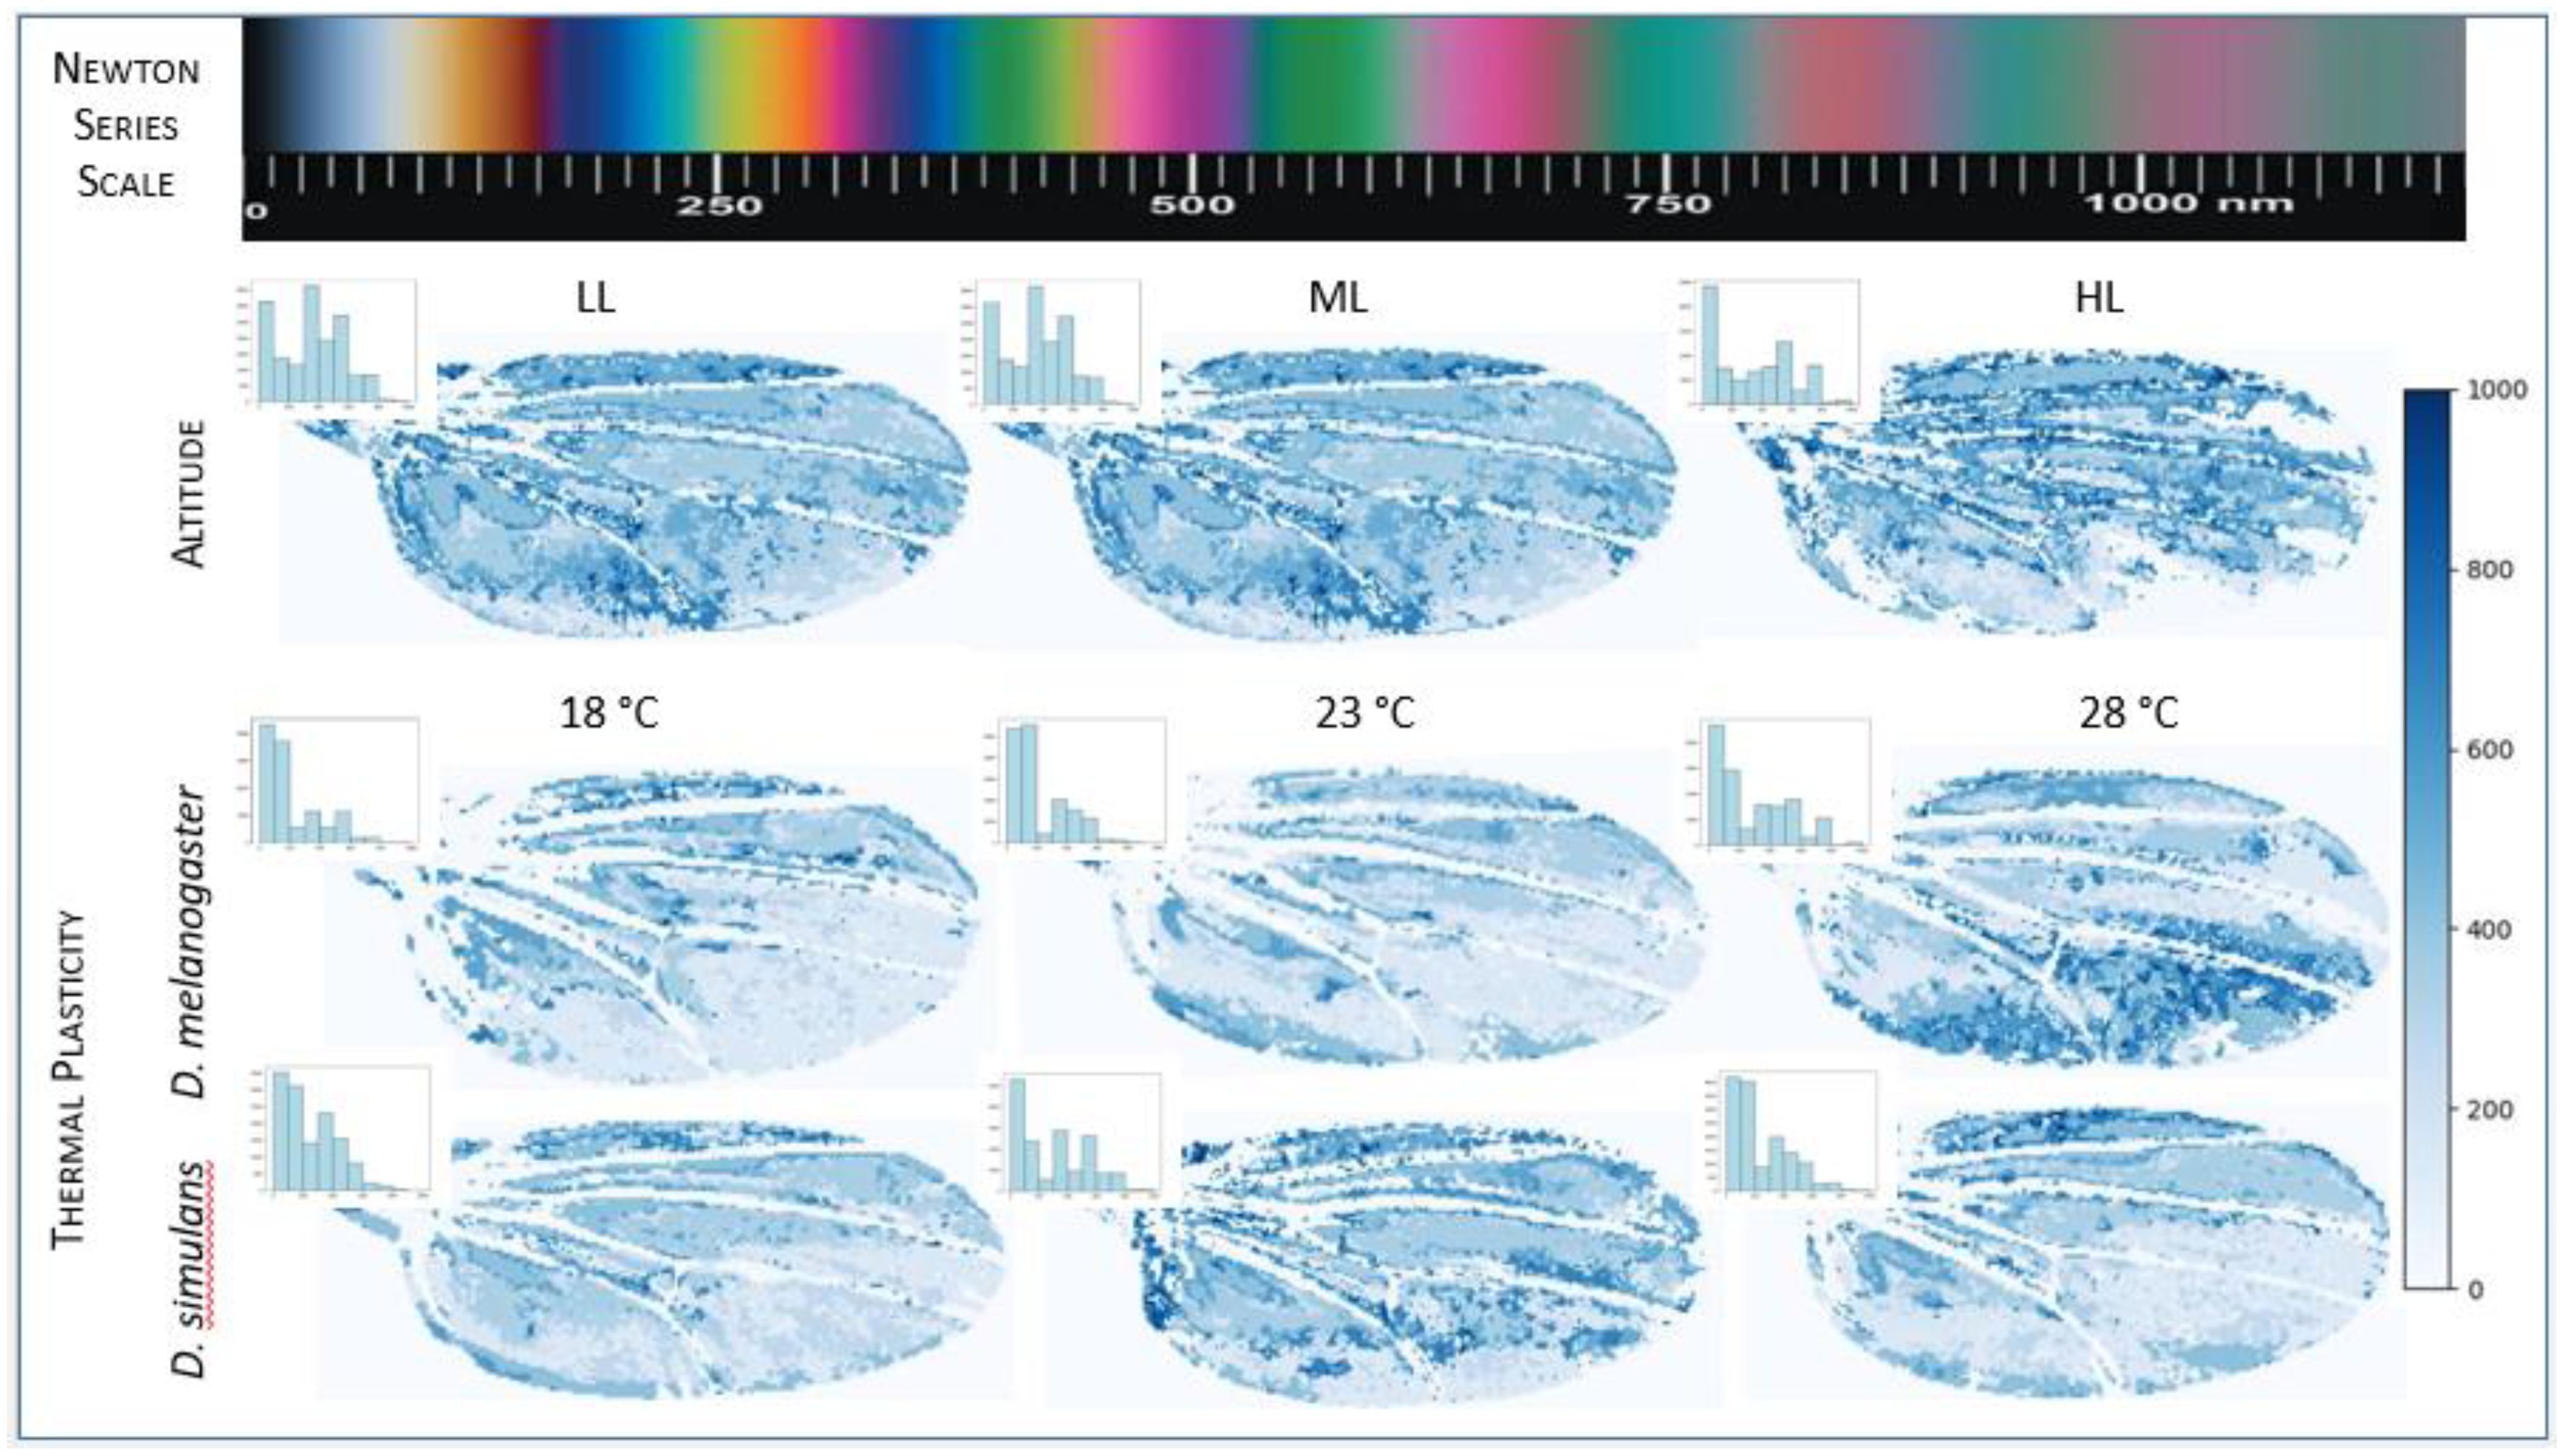
Figure 5. The evaluation of wing thickness was conducted employing the computer generated Newtonian colour series as outlined by Hosseini et al. in 2020. The uppermost bar as well as the side bars represent the Newton series colours from 0 nm to 1000 nm. The Newton series is a set of repeatable colours with the most vibrant spectral outcomes in the 50-600 nm range and extends up to 1500 nm of indistinguishable non-spectral colours. Among the three lower panels, the topmost panel represents wing thickness maps of representative wings from low, middle, and higher altitudes of D. melanogaster. The lowermost panels represent the wing thickness of representative wings of D. melanogaster and D. simulans grown at three different temperatures viz. 18°C, 23°C, 28°C. The gradient scale at the extreme right represents the wing thickness variation from 0 to 1000 nm. Wing thickness varies across elevations and at different growth temperatures (also see histograms in the inset where X axis - thickness in nm and Y axis - frequency). All images measured for wing thickness are selected based on the median of the greenness channel (size corrected).
4 Discussion
WIPs are widespread in insects, but their functional relevance is not very clear. A possible role of WIPs in mate choice has been demonstrated in some insects (Katayama et al., 2014; Hawkes et al., 2019; Butterworth et al., 2021). Males with brighter WIPs are preferred by D. melanogaster and D. simulans species females (Hawkes et al., 2019). In both species, variation in WIPs was greater in males than in females (Katayama et al., 2014; Butterworth et al., 2021). It is not known if WIPs are indeed a sexually selected trait and how common this is across diverse insect taxa. Differences in wing displays could produce variation in WIPs with a strong influence of light striking as well as background light conditions, as noted in some Dipteran and Hymenopteran insects (Simon, 2013). More recently, WIPs have found a strong application of classification in insect biology (Cannet et al., 2024). WIPs are unique characteristics of families and species and are proving to be an economic alternative to molecular or mass spectrometry methods in classifying insects (Cannet et al., 2024). However, to our knowledge, there have been no studies examining WIPs in outbred natural populations of D. melanogaster and D. simulans. We report for the first time that WIPs exhibit plasticity in response to temperature changes and this is further corroborated by observations from natural populations occurring with little thermal overlap (altitudinally differing).
WIP variations were quantified through the RGB colour space, and we used relative RGB values as an index to differentiate WIPs. Thus, relative RGB values differed in both D. melanogaster and D. simulans in response to thermal variation (18°C, 23°C, and 28°C) (Figure 3). Overall, prominent patterns of colour variation observed at both thermal and geographical scales correlate with each other in D. melanogaster (Figures 2, 3). We expected D. melanogaster populations from higher (Rohru), middle (Chamba), and lower (Chandigarh) altitudes to differ in WIPs since these locations differ in their temperature. However, when monthly temperature data from 2000-2022 was retrieved from the National Aeronautics and Space Administration, NASA’s Prediction of Worldwide Energy Resource (Stackhouse et al., 2018) (POWER- Hourly 2.3.6 version downloaded on 2024/08/20) interface we found mean temperatures differed strikingly only among low versus middle/high altitudes. Thus, the Chandigarh collection site which was the lowest altitude was the warmest (24.90°C) compared to Chamba (middle altitude) (11.59°C) or Rohru (high altitude) (11.39°C) collection sites; while the latter two sites were similar in their thermal regime (Supplementary Table 3). Corroborating to temperature variation, we found RGB colour space (i.e. relative redness, greenness) of WIPs was similar across populations collected from Rohru (high altitude) and Chamba (middle altitude) compared to Chandigarh (low altitude) (Table 1; Figure 2). Even though Rohru is at the highest elevation among three locations compared here, Chamba is located at a higher latitude (32.55° N), than either Rohru (31.77° N) or Chandigarh (30.73° N). Higher latitude of Chamba compared to Rohru could be one reason why temperatures and hence temperature influenced WIPs are comparable across Chamba and Rohru, despite the elevational differences across Chamba (996m) and Rohru (2592m). Accordingly, we observed clear differences in WIP trends for relative redness, greenness, and blueness associated with corresponding colder (Chamba and Rohru) vs hotter (Chandigarh) environments possibly suggesting adaptivity of WIPs to the local environmental conditions. However, adaptivity if any of WIPs needs further testing in flying insects.
Flies flying at lower altitudes, and thus, warmer temperatures could get naturally lifted as warmer air is less dense, reducing the air drag. At lower temperatures and higher altitudes, a greater resistance from air could impede flight, and hence, morphological adaptation could be expected in wings (Dudley, 2002). Larger wings could perhaps be adaptive at higher altitudes/lower temperatures to navigate reduced air density. We, too, found larger wings both at lower temperatures and higher altitudes in D. melanogaster (Supplementary Tables 1, 2), and this has been reported in earlier studies investigating thermal effects on wing size (Gilchrist and Huey, 2004). However, there have been a few studies on the effect of temperature on wing size and flight efficiency. D. melanogaster reared at a lower temperature had a larger wing area and a lower wing-beat frequency than the flies grown at a warmer or higher temperature (Frazier et al., 2008). Lower temperatures could be challenging in terms of flight efficiency in tiny ectotherms (Josephson, 1981) and reduced flight efficiency has been correlated with an increased wing area in flies (Barnes and Laurie-Ahlberg, 1986; Gilchrist and Huey, 2004). It would be interesting to investigate if WIPs are correlated with flight capacity, and one possible way is to check the wing thickness. WIPs can also be indirectly translated to understand wing thickness through the Newton colour series (Shevtsova et al., 2011). The Newton colour series is a repeatable series of colour bands known from thin film insect wings and ranges from 50 nm to 1500 nm (Shevtsova and Hansson, 2011). The Newton colour series offers an approximate measure of membrane thickness in various wing regions, relying on the observed sequence of colours in those specific areas.
The closer the WIP is to 1500 nm, the chitin of the wing is considered to be thicker and opaque, and such wings appear neutral, tan, or brown in colour (Conrow and Gelhaus, 2022). Table 3 represents wing thickness from a few insect orders. Wing thickness could vary due to several factors e.g. venation, ridges, and other structural morphologies on the wing surface (Li et al., 2023). Drosophila species possess wings with vibrant WIPs and exhibit thickness variation from 100 to 600 nm (Shevtsova and Hansson, 2011). On the other hand, thinner wings tend to have values closer to 50 nm in the Newton colour series, and are transparent, resulting in thin film and producing vibrant colour patterns. Variations across D. melanogaster populations from three different altitudes/reared at three different growth temperatures were observed as the flies from low altitude/high temperature had comparatively higher relative indices and vice-versa (Figures 2, 3). We report this as mere preliminary observation and not a trend, as this needs further experimentation.
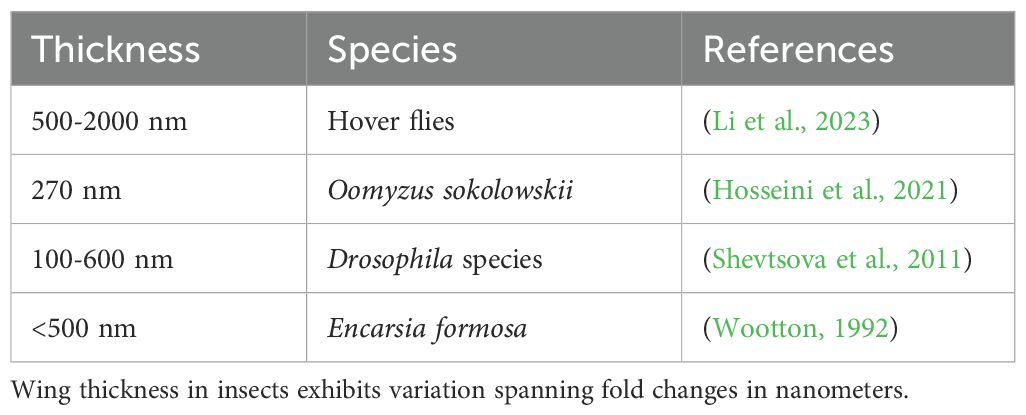
Table 3. Wing thickness varies from species to species. Some of the representative insect species’ wing thickness measurements are listed here.
We observe variation among RGB colour channels consistent across temperature changes and geographic origin. Thus, at both the lowest altitude (Figure 2), and moderate (23°C) and high (28°C) temperatures (Figure 3), the relative greenness and redness are greater than the relative blueness. However, this difference is reduced at the highest altitude and the lowest temperature (18°C). Thus, at lower altitudes and higher temperatures, green and red colour spectra appear more dominant (Figure 4), and hence we can observe more of green or yellow colours in these conditions. However, at higher altitudes and lower temperatures, we see combinations of colours with the blue channel, that is, cyan and magenta, compared to green and yellow observed at high temperatures/low altitudes. If these colour changes correlate with the wing thickness in a directed manner, there is a possibility of presence of alternative selection pressures operating on such traits. Our findings (Figures 2, 3) in this regard indicate brighter/paler WIPs (Figures 4, 5) under certain conditions directing alternative explanations i.e. local adaptations in wings.
Our results highlight similar WIPs formed in males of two sibling species i.e., D. melanogaster and D. simulans. Both the species show a parallel response to developmental temperatures. However, WIPs of lower Newton series appear to be generally more prevalent in D. simulans compared to D. melanogaster (Figures 3–5). The relative indices of all three colour channels is observed to be higher in D. simulans than D. melanogaster. However, the plastic response of WIPs in the two species show similarity in the directionality of increase in the relative indices with the changing developmental temperature hinting at a conserved evolutionary mechanism of WIPs. Further comprehensive understanding of these variations would provide a thorough examination of morphometrics and wing topography.
5 Conclusions
Quantitative analysis of WIPs offers valuable insights into the evolutionary dynamics of structural colour pattern formation on the wing surface. Variations in WIPs along altitudes and across developmental temperatures indicate organism*environment interactions. These variations may arise from changes in wing morphology or could be driven by sexual selection events. In this work, a notable correlation was observed between membrane thickness and the displayed colour patterning on the wing surface, suggesting a potential link between membrane thickness and interference patterns under varying environmental conditions. These patterns (i.e. WIPs) could be the product of other adaptive responses like handling thin air (i.e., flight adaptations) at higher elevations and under high-temperature conditions, which could be achieved through changes to wing thickness. To establish these causations further work is needed at relatively larger geographical scales.
Data availability statement
The original contributions presented in the study are included in the article/Supplementary Material. Further inquiries can be directed to the corresponding author.
Ethics statement
The manuscript presents research on animals that do not require ethical approval for their study.
Author contributions
DG: Data curation, Formal analysis, Investigation, Methodology, Software, Visualization, Writing – original draft, Writing – review & editing. KD: Software, Writing – review & editing. HM: Visualization, Writing – review & editing. RSG: Software, Validation, Writing – review & editing. SR: Conceptualization, Data curation, Funding acquisition, Project administration, Resources, Supervision, Validation, Visualization, Writing – original draft, Writing – review & editing.
Funding
The author(s) declare financial support was received for the research, authorship, and/or publication of this article. The financial support for this work was received from Ramanujan Grant awarded to SR (AU/SAS/BLS/SERB-SB/S2/RJN-129/2018-2019/01). HM was supported through PDF/2021/003439 from the Science and Engineering Research Board (SERB), Govt. of India.
Acknowledgments
DG is thankful for Shodh Fellowship from the Gujarat government and the University’s PhD Assistantship. We would like to thank Rupesh Maurya and Mayur Variya for their help in Drosophila melanogaster natural populations collection. Our supporting staff Suresh Thakor’s help in maintaining various Drosophila stocks is greatly valued.
Conflict of interest
The authors declare that the research was conducted in the absence of any commercial or financial relationships that could be construed as a potential conflict of interest.
Publisher’s note
All claims expressed in this article are solely those of the authors and do not necessarily represent those of their affiliated organizations, or those of the publisher, the editors and the reviewers. Any product that may be evaluated in this article, or claim that may be made by its manufacturer, is not guaranteed or endorsed by the publisher.
Supplementary material
The Supplementary Material for this article can be found online at: https://www.frontiersin.org/articles/10.3389/fevo.2024.1454212/full#supplementary-material
References
Barnes P. T., Laurie-Ahlberg C. C. (1986). Genetic variability of flight metabolism in Drosophila melanogaster. III. Effects of GPDH allozymes and environmental temperature on power output. Genetics 112, 267–294.
Brydegaard M., Jansson S., Schulz M., Runemark A. (2018). Can the narrow red bands of dragonflies be used to perceive wing interference patterns? Ecol. Evol. 8, 5369–5384.
Buffington M. L., Sandler R. J. (2012). The occurrence and phylogenetic implications of wing interference patterns in Cynipoidea (Insecta: Hymenoptera). Invertebrate Sys. 25, 586–597.
Butterworth N. J., White T. E., Byrne P. G., Wallman J. F. (2021). Love at first flight: wing interference patterns are species-specific and sexually dimorphic in blowflies (Diptera: Calliphoridae). J. Evol. Biol. 34, 558–570.
Cannet A., Simon-Chane C., Histace A., Akhoundi M., Romain O., Souchaud M., et al. (2024). An annotated wing interferential pattern dataset of dipteran insects of medical interest for deep learning. Sci. Data 11, 4.
Conrow R. T., Gelhaus J. K. (2022). Wing interference patterns are consistent and sexually dimorphic in the four families of crane flies (Diptera, Tipuloidea). ZooKeys 1080, 1356.
Denoël M., Doellen J. (2010). Displaying in the dark: light-dependent alternative mating tactics in the Alpine newt. Behav. Ecol. Sociobiol. 64, 1171–1177.
Dudley R. (2002). The biomechanics of insect flight: form, function, evolution (Princeton, New Jersey: Princeton University Press).
Frazier M. R., Harrison J. F., Kirkton S. D., Roberts S. P. (2008). Cold rearing improves cold-flight performance in Drosophila via changes in wing morphology. J. Exp. Biol. 211, 2116–2122.
Gatis D. (2022). Rembg: A tool to remove images background. Available online at: https://github.com/danielgatis/rembg.
Gibert J.-M., Mouchel-Vielh E., Peronnet F. (2017). Modulation of yellow expression contributes to thermal plasticity of female abdominal pigmentation in Drosophila melanogaster. Sci. Rep. 7, 43370.
Gilchrist G. W., Huey R. B. (2004). Plastic and genetic variation in wing loading as a function of temperature within and among parallel clines in Drosophila subobscura. Integr. Comp. Biol. 44, 461–470.
Hawkes M., Duffy E., Joag R., Skeats A., Radwan J., Wedell N., et al. (2019). Sexual selection drives the evolution of male wing interference patterns. Proc. R. Soc. B 286, 20182850.
Hosseini F., Lotfalizadeh H., Noruzi M., Dadpour M. (2021). Wing interference patterns and colours of Oomyzus sokolowskii (Kurdjumov)(Hymenoptera: Eulophidae). Int. J. Environ. Stud. 78, 484–490.
Ingleby F. C., Hosken D. J., Flowers K., Hawkes M. F., Lane S. M., Rapkin J., et al. (2013). Genotype-by-environment interactions for cuticular hydrocarbon expression in D rosophila simulans. J. Evol. Biol. 26, 94–107.
Jin S., Parks K. S., Janzen D. H., Hallwachs W., Dyer L. A., Whitfield J. B. (2023). The wing interference patterns (WIPs) of Parapanteles (Braconidae, Microgastrinae): demonstrating a powerful and accessible tool for species-level identification of small and clear winged insects. J. Hymenoptera Res. 96, 967–982.
Josephson R. K. (1981). “Temperature and the mechanical performance of insect muscle,” in Insect thermoregulation. Ed. Heinrich B. (New York: John Wiley & Sons), 19–44.
Katayama N., Abbott J. K., Kjærandsen J., Takahashi Y., Svensson E. I. (2014). Sexual selection on wing interference patterns in Drosophila melanogaster. Proc. Natl. Acad. Sci. 111, 15144–15148.
Kaunisto S., Ferguson L. V., Sinclair B. J. (2016). Can we predict the effects of multiple stressors on insects in a changing climate? Curr. Opin. Insect Sci. 17, 55–61.
Kinoshita S., Yoshioka S., Miyazaki J. (2008). Physics of structural colors. Rep. Prog. Physics 71, 076401.
Li M., Runemark A., Hernandez J., Rota J., Bygebjerg R., Brydegaard M. (2023). Discrimination of hover fly species and sexes by wing interference signals. Advanced Sci. 10, 2304657.
Lloyd V. J., Nadeau N. J. (2021). The evolution of structural colour in butterflies. Curr. Opin. Genet. Dev. 69, 28–34.
Lunau K. (2014). Visual ecology of flies with particular reference to colour vision and colour preferences. J. Comp. Physiol. A. 200, 497–512.
Peitsch D., Fietz A., Hertel H., de Souza J., Ventura D. F., Menzel R. (1992). The spectral input systems of hymenopteran insects and their receptor-based colour vision. J. Comp. Physiol. A. 170, 23–40.
Rodrigues Y. K., Beldade P. (2020). Thermal plasticity in insects’ response to climate change and to multifactorial environments. Front. Ecol. Evol. 8, 271.
Schneider C. A., Rasband W. S., Eliceiri K. W. (2012). NIH Image to ImageJ: 25 years of image analysis. Nat. Methods 9, 671–675.
Shevtsova E., Hansson C. (2011). Species recognition through wing interference patterns (WIPs) in Achrysocharoides Girault (Hymenoptera, Eulophidae) including two new species. ZooKeys 154), 9.
Shevtsova E., Hansson C., Janzen D. H., Kjærandsen J. (2011). Stable structural color patterns displayed on transparent insect wings. Proc. Natl. Acad. Sci. 108, 668–673.
Simon E. (2013). Preliminary study of wing interference patterns (WIPs) in some species of soft scale (Hemiptera, Sternorrhyncha, Coccoidea, Coccidae). ZooKeys 319, 269.
Stackhouse P. W., Zhang T., Westberg D., Barnett A. J., Bristow T., Macpherson B., et al (2018). POWER release 8.0. 1 (with GIS applications) methodology (data parameters, sources, & validation). Data Version 8 (1).
Taylor M. L., Wedell N., Hosken D. J. (2007). The heritability of attractiveness. Curr. Biol. 17, R959–RR60.
Team RC (2000). R language definition Vol. 3 (Vienna, Austria: R foundation for statistical computing), 116.
Thayer R. C., Allen F. I., Patel N. H. (2020). Structural color in Junonia butterflies evolves by tuning scale lamina thickness. Elife 9, e52187.
Tsai C.-C., Childers R. A., Nan Shi N., Ren C., Pelaez J. N., Bernard G. D., et al. (2020). Physical and behavioral adaptations to prevent overheating of the living wings of butterflies. Nat. Commun. 11, 551.
Westneat D. F., Potts L. J., Sasser K. L., Shaffer J. D. (2019). Causes and consequences of phenotypic plasticity in complex environments. Trends Ecol. Evol. 34, 555–568.
Keywords: insect, wing interference pattern, altitudinal cline, thermal plasticity, wing thickness, Newton colour series
Citation: Garg D, Dhotre K, Mayekar HV, Singh Grewal R and Rajpurohit S (2024) Structural colouration in Drosophila wings is thermally plastic and exhibits ecological variation. Front. Ecol. Evol. 12:1454212. doi: 10.3389/fevo.2024.1454212
Received: 24 June 2024; Accepted: 09 September 2024;
Published: 04 October 2024.
Edited by:
Donald Price, University of Nevada, Las Vegas, United StatesReviewed by:
Joanne Yew, University of Hawaii at Manoa, United StatesJayendra Nath Shukla, Central University of Rajasthan, India
Copyright © 2024 Garg, Dhotre, Mayekar, Singh Grewal and Rajpurohit. This is an open-access article distributed under the terms of the Creative Commons Attribution License (CC BY). The use, distribution or reproduction in other forums is permitted, provided the original author(s) and the copyright owner(s) are credited and that the original publication in this journal is cited, in accordance with accepted academic practice. No use, distribution or reproduction is permitted which does not comply with these terms.
*Correspondence: Subhash Rajpurohit, c3ViaGFzaC5yYWpwdXJvaGl0QGFoZHVuaS5lZHUuaW4=
 Divita Garg
 Kanak Dhotre
 Harshad Vijay Mayekar
 Raghwinder Singh Grewal
 Subhash Rajpurohit