 Lea Ellen Matthiessen1,2*
 Sinne Smed2
 Jørgen Dejgård Jensen2
 Dominika Średnicka-Tober3
 Laura Rossi4
 Susanne Gjedsted Bügel1
- 1Department of Nutrition, Exercise and Sports, University of Copenhagen, Frederiksberg, Denmark
- 2Department of Food and Resource Economics, University of Copenhagen, Frederiksberg, Denmark
- 3Department of Functional and Organic Food, Institute of Human Nutrition Sciences, Warsaw University of Life Sciences, Warsaw, Poland
- 4Council for Agricultural Research and Economics – CREA, Rome, Italy
Introduction: Unsustainable and unhealthy food consumption is contributing significantly to the global greenhouse gases and leads to severe health problems. The largest contributors are consumers in high-income countries, such as Denmark, with large shares of meat and high amounts of food waste.
Methods: Taking Copenhagen (the capital) as a case, we aim to explore more sustainable and healthier dietary behaviours based on the organic food share in combination with dietary composition, food waste and attitudes towards change. This mixed-method study used quantitative data from an anonymous online survey and qualitative data from semi-structured interviews. For statistical analysis, 279 adult survey participants were divided into three subgroups; “low”– with up to 25% organic food share, “medium”– 26-75% organic food share and “high”– 76-100% organic food share.
Results: This study found significant differences of food intake between the subgroups for fruits & vegetables, legumes, nuts, whole grain cereals and meat. In those food categories, the share of respondents complying with the official dietary recommendations was higher for the “high” and “medium” than for the “low” organic subgroup. At the level of public procurement, meat was reduced to provide “a room for economic manoeuvre” due to higher organic price premiums. In conclusion, in Copenhagen we observed that an increased share of organic food comes along with other sustainable dietary behaviour, both at household and public kitchen level.
Discussion: Households appear motivated by societal momentum toward more sustainable diets. The public food procurement has largely been driven by politically determined goals. Further studies are needed to better understand how food systems can support the adoption of healthier, more sustainable diets — emphasizing increased plant-based foods and reduced food waste.
1 Introduction
The Global Nutrition Report 2021 highlights that no population in any regions meets the recommendations for healthy diets (Di Cesare et al., 2021). In addition, suboptimal diets frequently stress the environment (Willett et al., 2019). Thus, we need to change our current ways of consuming food due to health implications and environmental concerns.
In the framework of FAO’s “food system wheel” (FAO, 2018), food security is placed in the center and the wheel highlights that healthy and sustainable diets (FAO and WHO, 2019) can be perceived as a desired key outcome of food systems. A food system enfolds “the entire range of actors and their interlinked value-adding activities involved in the production, aggregation, processing, distribution, consumption and disposal (loss or waste) of food products originating from agriculture (including livestock), forestry, fisheries and food industries, along with the broader economic, societal and physical environments in which these activities are embedded” (FAO, 2018).
Food consumption takes place at the end of the food value chain (FVC) and is influenced by actors and activities of the entire food system (HLPE, 2017). Among the key elements in the FAO/WHO’s guiding principles for a healthy sustainable diet (FAO and WHO, 2019) are a high intake of fruits and vegetables, a moderate intake of meat, consumption of foods sourced and produced with respect for local culture and values, and low food loss and waste. Organic farming is a prominent example of production with respect for values such as nature, environment and animal welfare. Recently, scholars identified the combination of organic agriculture, dietary changes toward plant-based foods and food waste reduction as possible scenarios for sustainable food systems (Basnet et al., 2023).
For consumers in many high-income countries, including Denmark, a shift toward a more healthy sustainable diet would imply a shift from meat to legumes, fruits and vegetables, minimizing food waste, and sourcing food from sustainable food production practices, such as organic agriculture (Willett et al., 2019). Denmark has over the past decades experienced an increased organic food share at the household and at public food procurement (PFP) levels. This conversion was based on laws and targets (FVST, 2012) specifying the political goal of at least 60% of organic food in public meals on a national level. Almost all Danish consumers recognize the organic food label, and many private households also consume a substantial amount of organics food. Compared to other European countries, Denmark has one of the highest organic shares in food retail sales (Trávníček et al., 2022) with the largest share in Copenhagen (Hindborg, 2021). Since 2009, institutions (e.g., Restaurants, cafes, hospital kitchens, schools and other eateries) have been certified (The Organic Cuisine Label, 2021), making the degree of organic food transparent to consumers.
Economic factors are considered important for consumers’ incentive to pursue a healthy sustainable diet. In high-income countries (like Denmark), organic foods are on average 20–30% more expensive compared with conventional foods and the price difference increases with the premium level of the product (e.g., meat) (Staudigel and Trubnikov, 2022). On the other hand, replacement of meat (e.g., with vegetables) will tend to reduce food budgets, and food waste reduction can save money as well, although both diet composition and food waste behavior are also driven by other factors, including culture and hospitality (Porpino et al., 2015).
Transition toward more healthy sustainable diets can be bottom-up driven, based on micro-level consumption decisions in the individual households or production decisions in individual firms. However, transition can also be driven by top-down policy initiatives, such as political decisions to promote green procurement in public institutions, canteens etc.
This study adopts an innovative approach by integrating multiple aspects of the food system - including diet, food waste, and attitudes toward change - to better understand dietary behavior. It aims to analyze to which extent a high organic food share in food consumption is associated with more healthy and sustainable dietary behavior. In particular, we investigate the commonalities and differences between household-driven bottom-up transition and policy-driven top-down transition toward sustainable food demand, and in turn a sustainable food system in terms of outcomes and driving mechanisms.
Hence, the study addresses the following research question: Is a high organic food share in private households and public food procurement associated with sustainable and healthy dietary behaviour with more plant-based food and less food waste?
We will assess patterns and potential mechanisms of private households and public food services (e.g., canteens) in the case of Copenhagen, Denmark, with a particular view to the association between organic food share on the one hand, and diet quality, food waste and attitudes toward change on the other hand.
2 Materials and methods
Food systems consist of inherent complexity (Ericksen, 2008). This mixed-method study uses a new approach combining multiple aspects of the food system (i.e., diet, food waste and attitudes toward change) to understand dietary behavior.
2.1 The study area: municipality of Copenhagen
The Municipality of Copenhagen (from now on referred to as Copenhagen) has set as a goal to become the Capital of Sustainable Development (Copenhagen Department of Finance, 2017). Copenhagen, the capital of Denmark, has experienced a large conversion of its PFP toward organic (Sørensen et al., 2016b) and reducing food waste (Lassen et al., 2022) over the past two decades. For Copenhagen, the organic target of public meals was set to 90% (Municipality of Copenhagen, 2019). The organic food share in the 70,000 daily meals served in the municipality’s public canteens was around 84% in 2019 (Municipality of Copenhagen, 2019; Municipality of Copenhagen, 2022).
2.2 Data collection
The Research Ethics Committees for the Capital Region of Denmark do not require approval for this study because it does not involve any interventions or biological materials. Additionally, this work is exempt under DHHS 46.101, which pertains to unidentifiable survey or interview data.
We collected and analyzed quantitative household survey data and qualitative interview data with multiple actors from private and public food suppliers. To study food systems and behavioral drivers, we used the social theory practice of “zooming in” and “zooming out,” which has been used by other scholars in connection to sustainable food system practices (Ulug et al., 2021). We zoomed in on consumption in households and “out-of-home” settings and have put our findings into a broader food systems perspective in the discussion.
2.2.1 Household survey
Quantitative data was collected in an online household survey with 279 participants [379 participants were excluded due to incomplete answers (n = 244) or living outside Copenhagen Municipality (n = 135)]. The cross-sectional survey was carried out with households living in Copenhagen. One adult (18 years or older) in the household was asked to fill out the survey as a representative of the household. The survey is based on previously validated survey questions (van Herpen et al., 2019; University of Oxford, 2022; BEUC, 2020) and was pilot-tested to evaluate clarity, comprehension and the survey flow.
The survey was conducted online from 11th January until 15th March 2022. Invitations were distributed through institutional websites, social media channels (i.e., Facebook, LinkedIn), using instant messaging apps (e.g., WhatsApp) and mailing (e.g., via personal contacts, network newsletters) applying the river sampling method (Lehdonvirta et al., 2021) as further described by Peronti et al. (2024) (Peronti et al., 2024). The online invitations contained a link to the online survey with the opportunity to choose Danish or English as language and information1 about the survey purpose. The participation was voluntary and anonymous.
The survey included questions about sociodemographic information, food frequency questions, the share of organic in the food consumption, and the household’s amount of food waste generated (see Supplementary material 1 for the full questionnaire).
2.2.1.1 Food frequency for 12 food groups
The participants were asked how often they consume different food groups with 10 answer possibilities for different frequencies (“Never,” “Less than once a month,” “1–3 times per month,” “Once a week,” “2–4 times per week,” “5–6 times per week,” “Once a day,” “2–3 times per day,” “4–5 times per day,” “Every time I eat”). Out of 29 food groups in total, 12 food groups were selected for this study as appropriate indicators for a healthy and sustainable diet (Rosane Philippi et al., 2023):
1. Fruits
2. Vegetables
3. Legumes
4. Non-processed nuts
5. Whole-grain bread
6. Whole-grain cereals
7. Potatoes
8. Red meat
9. Processed meat
10. Fish
11. Dairy
12. Cheese
Food frequency data from the survey was converted to average grams per day, by assuming standard portion sizes for each food category according to Ygil (2013) (Ygil, 2013). The 10 frequencies were assigned to factors from 0 (never) to 5 (every time I eat) assuming that the response “every time I eat” refers to five portions per day. Frequency factors were multiplied with portion sizes to have average grams per day (i.e., Supplementary material 2).
2.2.1.2 Food choice attitudes
The survey participants were asked about their attitudes toward different elements’ importance for their food choices: price, taste, appearance, safety, sustainable packaging, composition, nutritional value, origin, without genetically modified organisms, certificates, seasonality, freshness and naturalness. This was measured on a five-point Likert scale (1 = not important at all, 2 = not important, 3 = neither important nor not important, 4 = important, 5 = very important).
2.2.1.3 Food waste assessment
The food waste assessment in the survey focused on avoidable food waste (i.e., excluding unavoidable waste such as vegetable peels, bones) following the methodology developed by van Herpen et al. (2019). Specifically, food waste was defined as food that at a certain point was edible but changed to waste due to deterioration (i.e., rotting), respondents’ disfavoring parts of the products (e.g., skin, stems), or lacking cooking skills (i.e., use of leftovers) (Beretta et al., 2013). The participants were asked how much food (distributed on food groups) was disposed in the past week.
Three steps were taken to calculate the food waste in grams per day per person for food categories corresponding to the selected food groups from intake data. First, amounts of food waste (answer options expressed in serving sizes) were converted from portions to grams per week using the estimated reference values of the survey question (for ranges the center value was taken) (see Supplementary material 2 for conversion factors). Second, waste for 16 detailed food categories were aggregated to 11 food groups. Third, the weekly household food waste amounts were converted to individual-level amounts per day by dividing by household size, and then dividing by seven. On average, 2.2 persons per household was reported in the sample and the maximum was 7 persons in a household.
2.2.1.4 Reasons for generating household food waste
The respondents were asked to rate 11 potential causes of food waste in their households, including, among others, lack of cooking skills, organization of the fridge, demands from other household members and food safety. The questions were measured on a five-point Likert scale: 1 = strongly disagree, 2 = disagree, 3 = neither agree nor disagree, 4 = agree, 5 = strongly agree (see Supplementary material 1 for the detailed questions).
2.2.1.5 Consumption of organic foods
The respondents were asked to estimate the share of organic food in their diet: “What percentage, by volume, of the foods you eat is organic?” with the following answer options: “0%,” “1–10%,” “11–25%,” “26–50%,” “51–75%,” “76–99” and “100%.” Before the question about consumption of organic food the respondents were introduced to the definition of organic food in the survey (see Supplementary material 1).
2.3 Statistical analysis
It is acknowledged that the river sampling method is likely to yield a biased sample, which as a consequence is not well-suited for inference about, e.g., the prevalence of a high organic food share in food consumption. Indeed, the share of consumers with high organic consumption in the survey is considerably larger than what can be confirmed by market data (Hindborg, 2021). However, if it is assumed that such selection bias reflects different levels of general interest in foods and food-related sustainability (with interested individuals being more prone to participate (Groves et al., 2004), and where organic-minded consumers may tend to be over-represented), it can be reasonable to compare responses regarding such specific aspects from participants with different levels of organics in their food consumption.
Subgroups were formed based on the share of organic food, less than 25% organic (i.e., “low organic”) 25–75% organic (i.e., “medium organic”) and above 75% (i.e., “high organic”). Data was organized and analyzed with the open-source software RStudio (Version: 4.3.0, 2023). For the descriptive analysis of intake data, we assessed median estimated intake in grams of the 12 food groups, as well as the 10th and 90th percentiles. For the descriptive analysis of food waste, means and standard deviations per food group in grams of food waste per day per person were assessed. To identify differences in intake and food waste between the three subgroups, the non-parametric Kruskal-Wallis test was performed (p < 0.05), with the null hypothesis that there are no differences of the food intake or food waste between the three consumer subgroups. For food groups with a rejected null-hypothesis, pairwise comparisons were conducted using the Wilcoxon rank sum test (Mann–Whitney U test) with continuity correction between the three subgroups.
Next, based on the food groups with a significant difference of food intake between the three consumer subgroups, a comparison to the national Danish dietary recommendations (FVST, 2021) was performed and displayed in piecharts. Colors are presented as a traffic light scheme to symbolize the degree of fulfilment with the recommendations and breakpoints were defined as following: For fruits & vegetables, legumes, wholegrain and nuts: less than 25% of recommended intake (red), 25–50% of recommended intake (orange), recommended intake ±50% (yellow) and more than 50% above the recommended intake (light green). For meat, dairy and cheese, thresholds are: more than 50% below recommended maximum intake (dark green), 0–50% below recommended maximum intake (light green), 0–50% above recommended maximum intake (orange), and more than 50% above recommended maximum intake (red). As the Danish dietary recommendations target total amounts of fruits and vegetables, meat and whole grain products (incl. Cereals and bread), those are mapped together.
2.3.1 Semi-structured interviews
In order to gather information about organic consumers and Copenhagen’s PFP, we conducted interviews to explore the interrelationships between organic food, diet composition, food waste, and transition processes. The interviews were carried out by the first author of this paper (female, MSc, employed as a PhD fellow and trained through PhD courses) with representatives of key stakeholders.
2.3.1.1 Sampling for semi-structured interviews
Purpose sampling was chosen to find particular individuals with roles relevant to the study, based on information from an initial unstructured case informant interview (see interview summary in Supplementary material 3). In addition, relevant organizations working with the development of sustainable food systems with private households as customers were also considered.
Two representatives were chosen related to Copenhagen municipality’s sustainable PFP (one from the municipality administration and one from the municipality’s kitchen management) and one representative from an organic meal-box scheme delivery to private households. Hybrid meal preparation, including meal-box delivery services, is becoming increasingly common (Halkier, 2021).
Participants were approached per email and introduced to the interviewer and the study background. All three participants were familiar with the topics organic, diet and food waste but there was no direct connection to private households from the survey. The three semi-structured interviews were conducted online in Danish language in December 2021 to January 2022 and recorded using Zoom videoconferencing (see Supplementary material 4 for interview guide). The recordings were transcribed and translated to English by two independent researchers. The interviews lasted between 60 and 100 min. Participation was voluntary and anonymous and a consent form was signed by the interviewees.
2.3.1.2 Analysis of interview data
The interviews were not intended to represent the entire structure of Copenhagen’s food system but served to give impressions and ideas of the situation. Relevant interview questions related to our research question were selected and a coding table established using an inductive approach (Chandra and Shang, 2019). First, for initial familiarization, two independent researchers analyzed the data by reading and re-reading the transcripts as a crucial step for gaining an in-depth understanding of the content of the interviews. Then, open coding was performed by examining the transcripts line-by-line. Codes were assigned to segments of text that appeared significant or meaningful in relation to the research question. This process was iterative, with codes being refined, merged, or split as needed. After the initial coding, we grouped similar codes into categories (e.g., composition of diet, organic, willingness to change diet). These categories represent broader themes or patterns in the data. Each category was defined clearly to ensure consistency in coding. The transcripts were coded in the computer-aided qualitative data analysis software NVivo (version 14.23.2). Word repetitions in quotes were deleted for better readability. Words added in brackets were added for contextual clarity. Regular peer debriefing sessions were held where we discussed the coding process and themes with colleagues to ensure the analysis was not biased by our preconceptions.
3 Results and discussion
In the following, results have been organized in two themes: (1) associations between organic food share of food consumption and dietary composition, and (2) associations between organic food share of food consumption and food waste behavior. For each of these two themes, quantitative results from the household survey are presented and discussed first, and then followed by results from the qualitative interviews. Focus is on similarities and differences between the two settings.
3.1 Organic food consumption and dietary composition
3.1.1 Diet composition and food preferences of households
Table 1 and Figure 1 present food intake data from the household survey for the three subgroups of respondents according to the share of organic products in their food consumption. In Table 1, medians as well as 10- and 90-percentiles for the estimated intakes of the 12 food groups are displayed for the three subgroups.
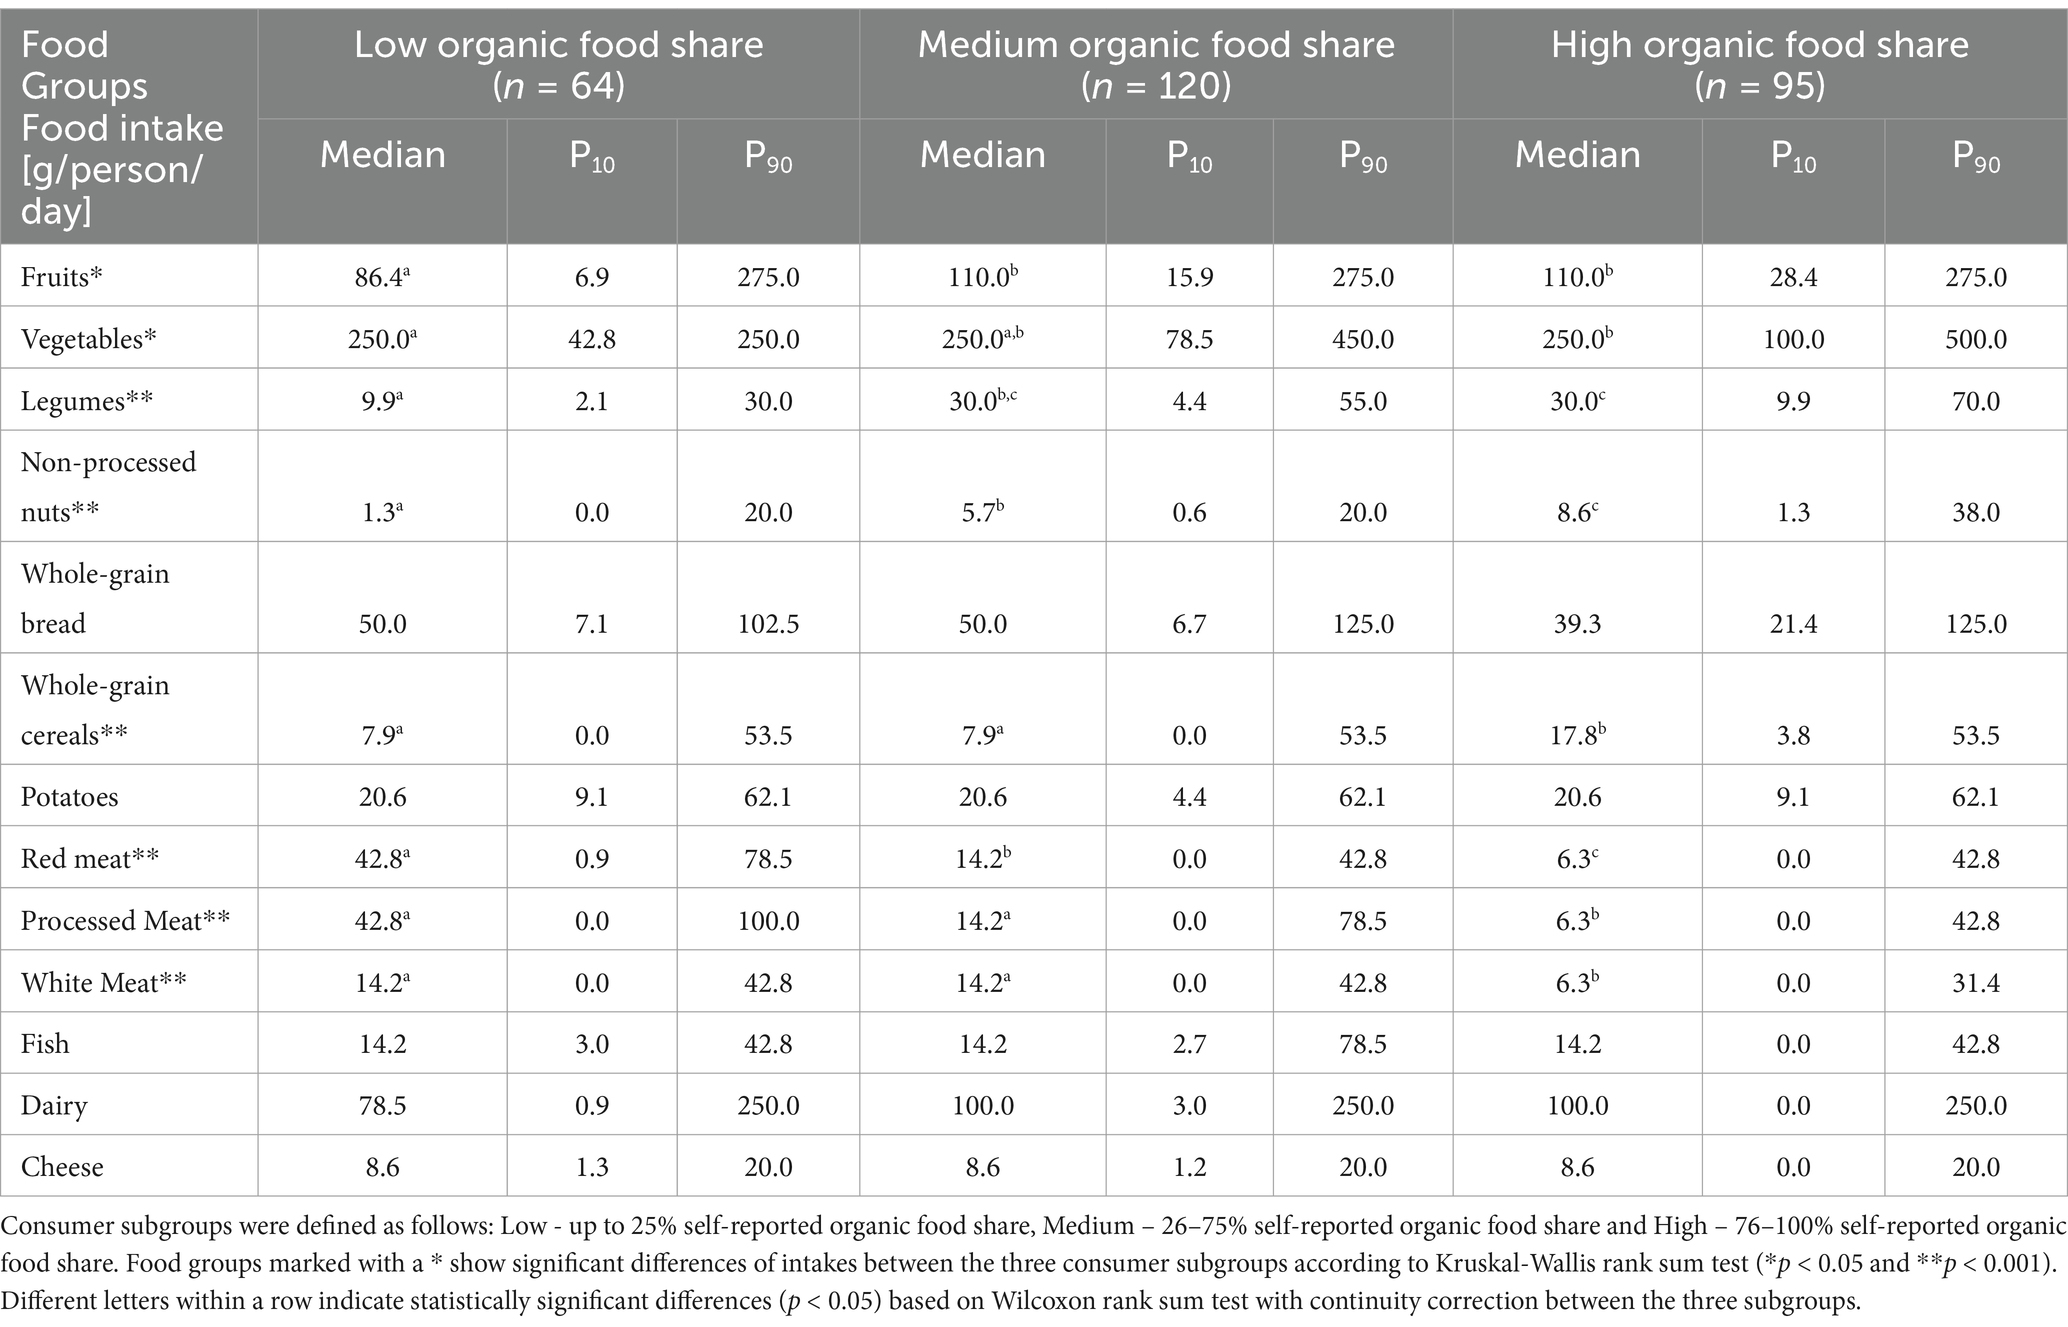
Table 1. Median estimated intake of food groups in grams (g) by consumer subgroups (low, medium and high) with 10th (P10) and 90th (P90) percentiles.
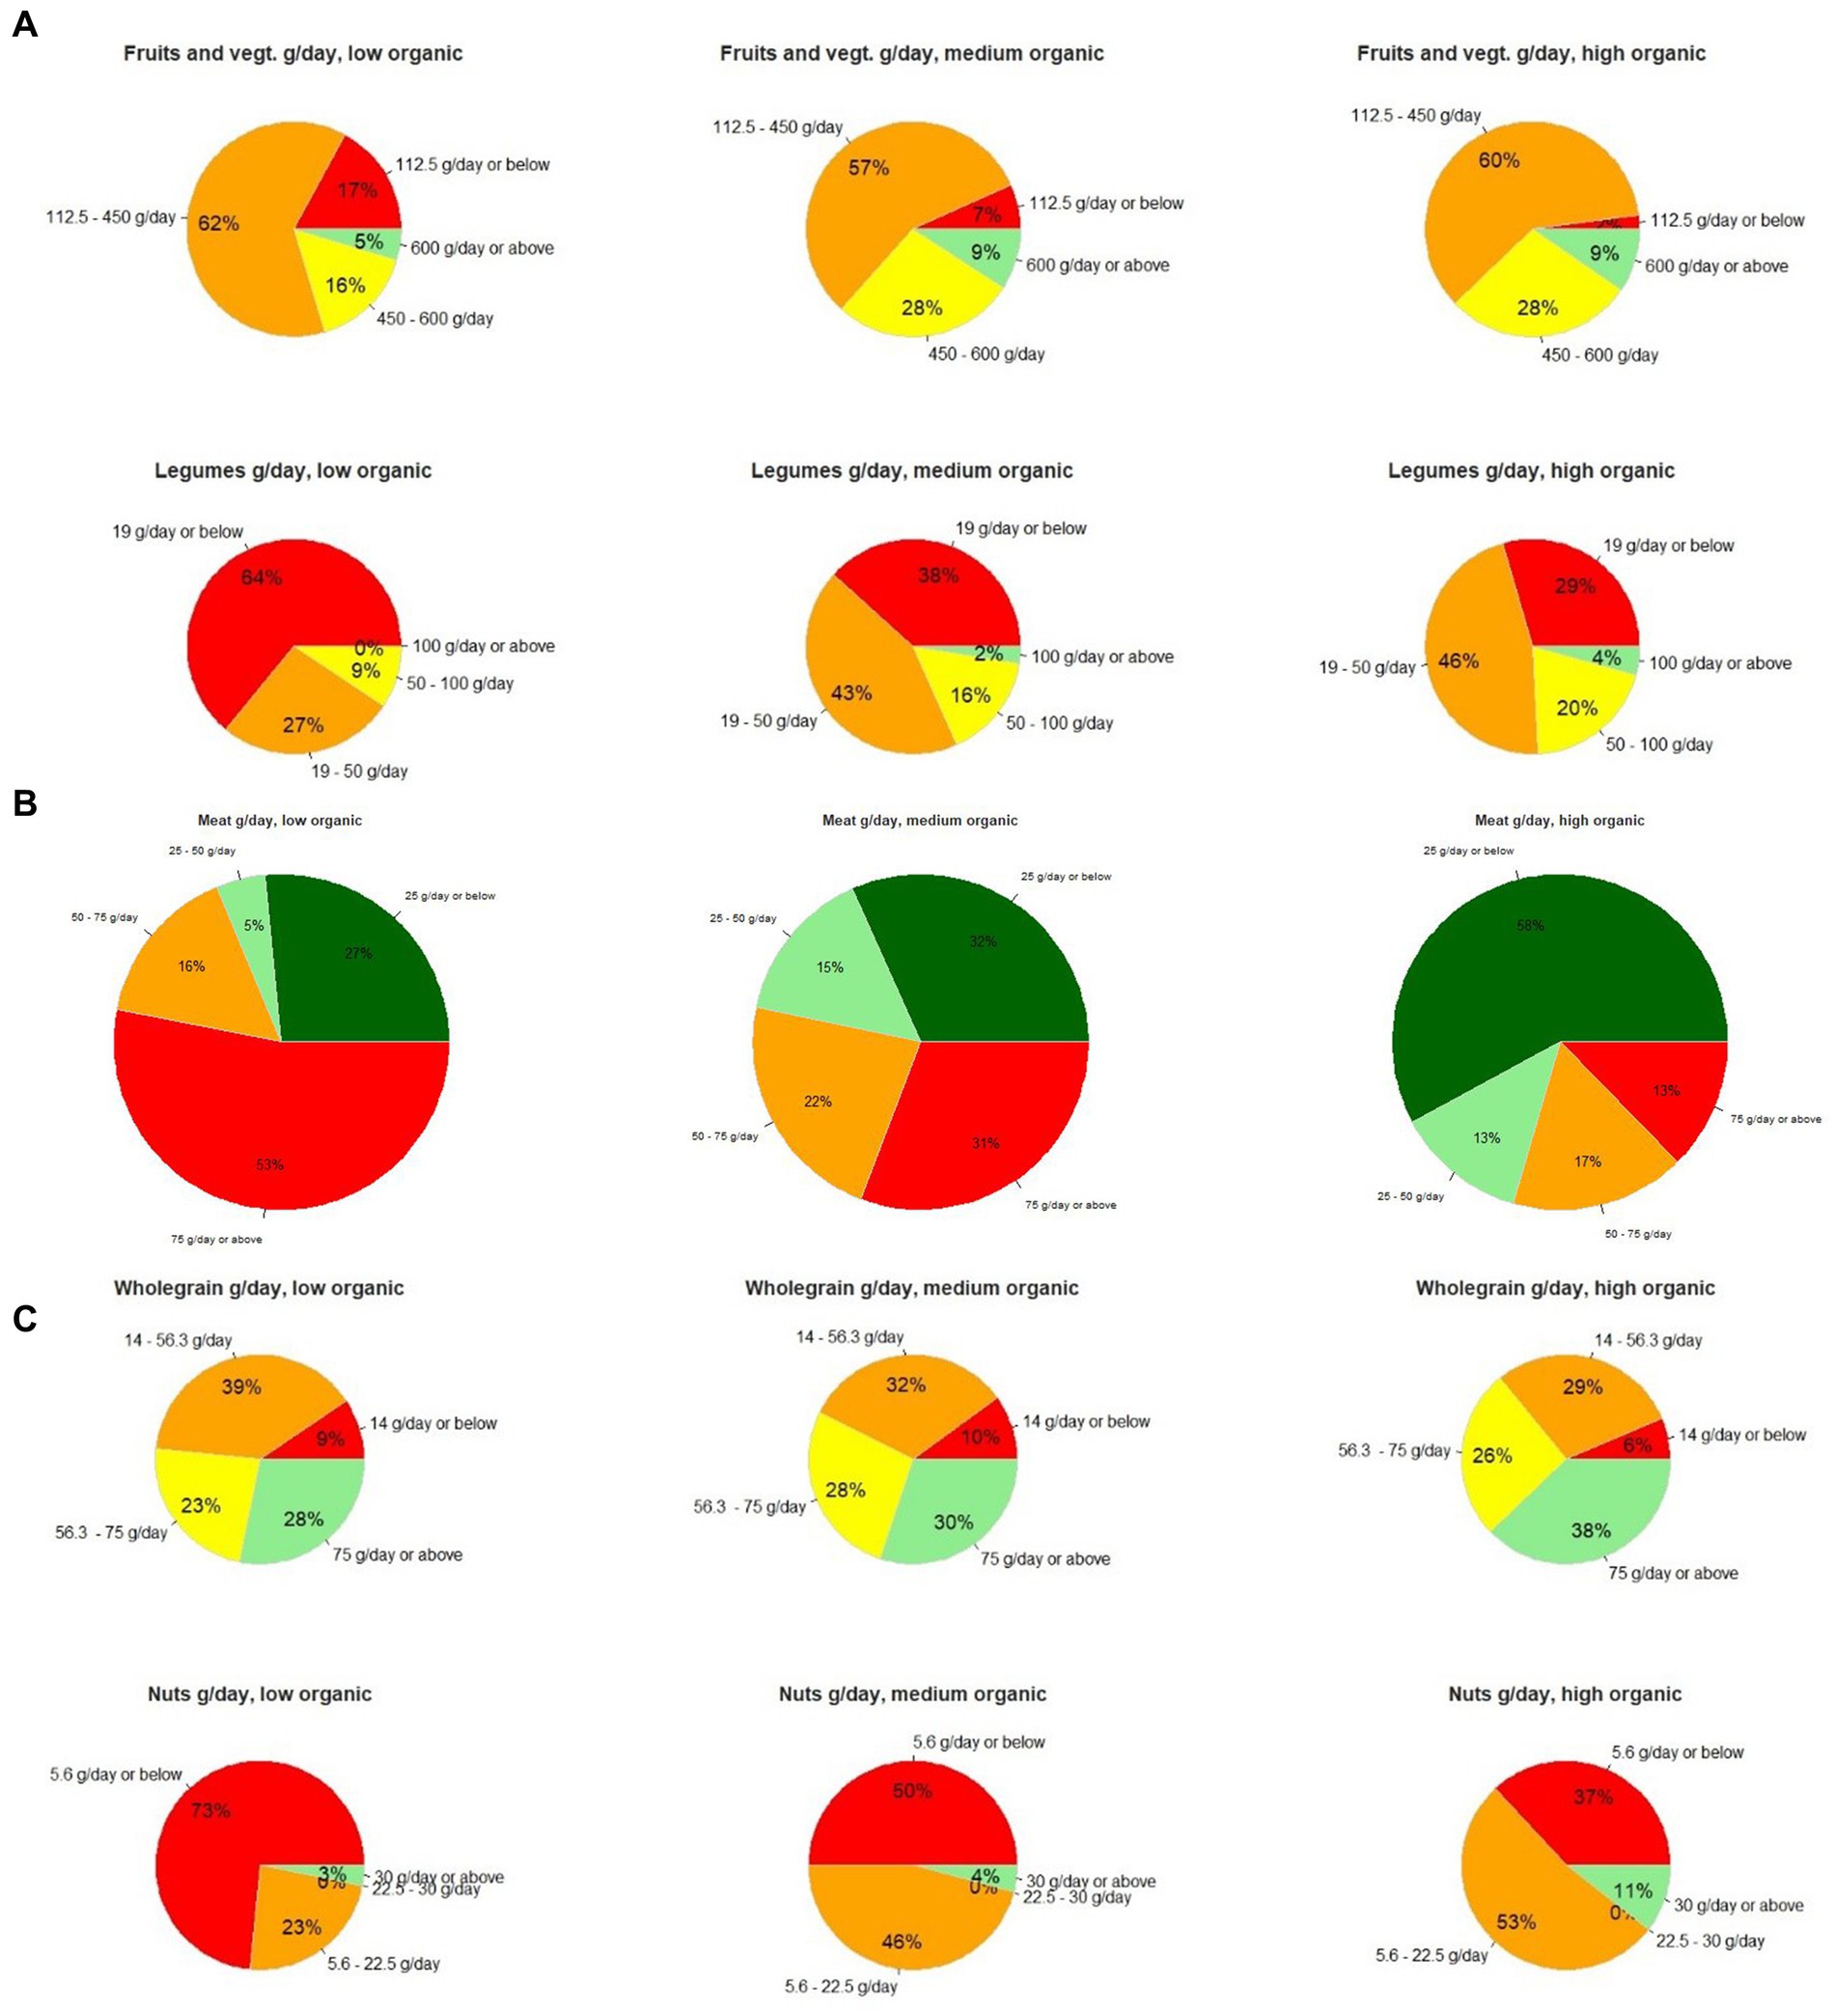
Figure 2. Distribution of food intake among Copenhagen respondents from a 2022 household survey, categorized by three organic consumer subgroups: low (n = 64, left), medium (n = 120, middle), and high (n = 95, right). The food categories are: (A) fruits & vegetables and legumes, (B) meat, and (C) whole-grain products and nuts. Percentages indicate the share of respondents, with colors representing the degree of adherence to Danish dietary recommendations. The traffic light scheme is used: green and yellow indicate compliance or near compliance, while red and orange indicate non-compliance. For definition of consumer groups, see note to Table 1. Colors indicate the degree to which the subgroups eat in accordance with Danish dietary recommendations (FVST, 2021). For fruits & vegetables, legumes, wholegrain and nuts, thresholds are: less than 25% of recommended intake (red), 25–50% of recommended intake (orange), recommended intake ±50% (yellow) and more than 50% above the recommended intake (light green). For meat thresholds are: more than 50% below recommended maximum intake (dark green), 0–50% below recommended maximum intake (light green), 0–50% above recommended maximum intake (orange), and more than 50% above recommended maximum intake (red). As the Danish dietary recommendations target total amounts of fruits and vegetables, meat and whole grain products (incl. Cereals and bread), those are mapped together.
Some interesting features in Table 1 are worth noting. Significant differences between the three groups were found for the consumption of fruits and vegetables (p < 0.05) as well as for legumes, non-processed nuts, whole-grain cereal and meats (p < 0.001). Respondents with a medium or high organic food share have a larger consumption of fruits, vegetables, legumes and wholegrain cereals than those with low organic food share. Furthermore, the consumers with high organic food share have a significantly lower meat consumption, especially for red meat and processed meat. For dairy, medium and high organic consumers on average seem to have a higher average consumption than the low organic consumer category, but this difference was not statistically significant.
In Figure 1, food intake distributions in relation to the Danish dietary recommendations are shown for those food groups where intakes differ significantly between the three subgroups, i.e., fruits and vegetables, legumes, meats, wholegrain foods and nuts.
The pie charts in Figure 1 complement the observations in Table 1 by demonstrating that the share of respondents complying with the dietary recommendations is higher for the high- and medium organic groups than for the low organic group for both fruits and vegetables and for meat. The Danish dietary guidelines (FVST, 2021) recommend an intake of least 600 grams of fruits and vegetables per day. The high and medium organic groups (37%) comply to a larger degree than the low organic group (21%). The high organic group also fulfil better the recommendations to eat a maximum of 50 grams of meat per day and especially low intakes of red and processed meat (see Supplementary material 5 for detailed data). Around one quarter of the high organic group and only around one tenth of the low organic group comply or almost comply with the recommended amount of at least 100 grams of legumes daily (cooked amount). The compliance to the guideline to eat at least 75 grams of whole-grain products increases slightly with a higher share of organic, in that more than half of the high and medium organic groups follow the guideline. Respondents seem to face the largest difficulties to fulfil the recommendations for nuts.
The survey also addressed the importance of different food attributes for consumers’ food choices, measured by means of 5-point Likert importance scales. Figure 2 summarizes the findings regarding these for the three consumer subgroups.
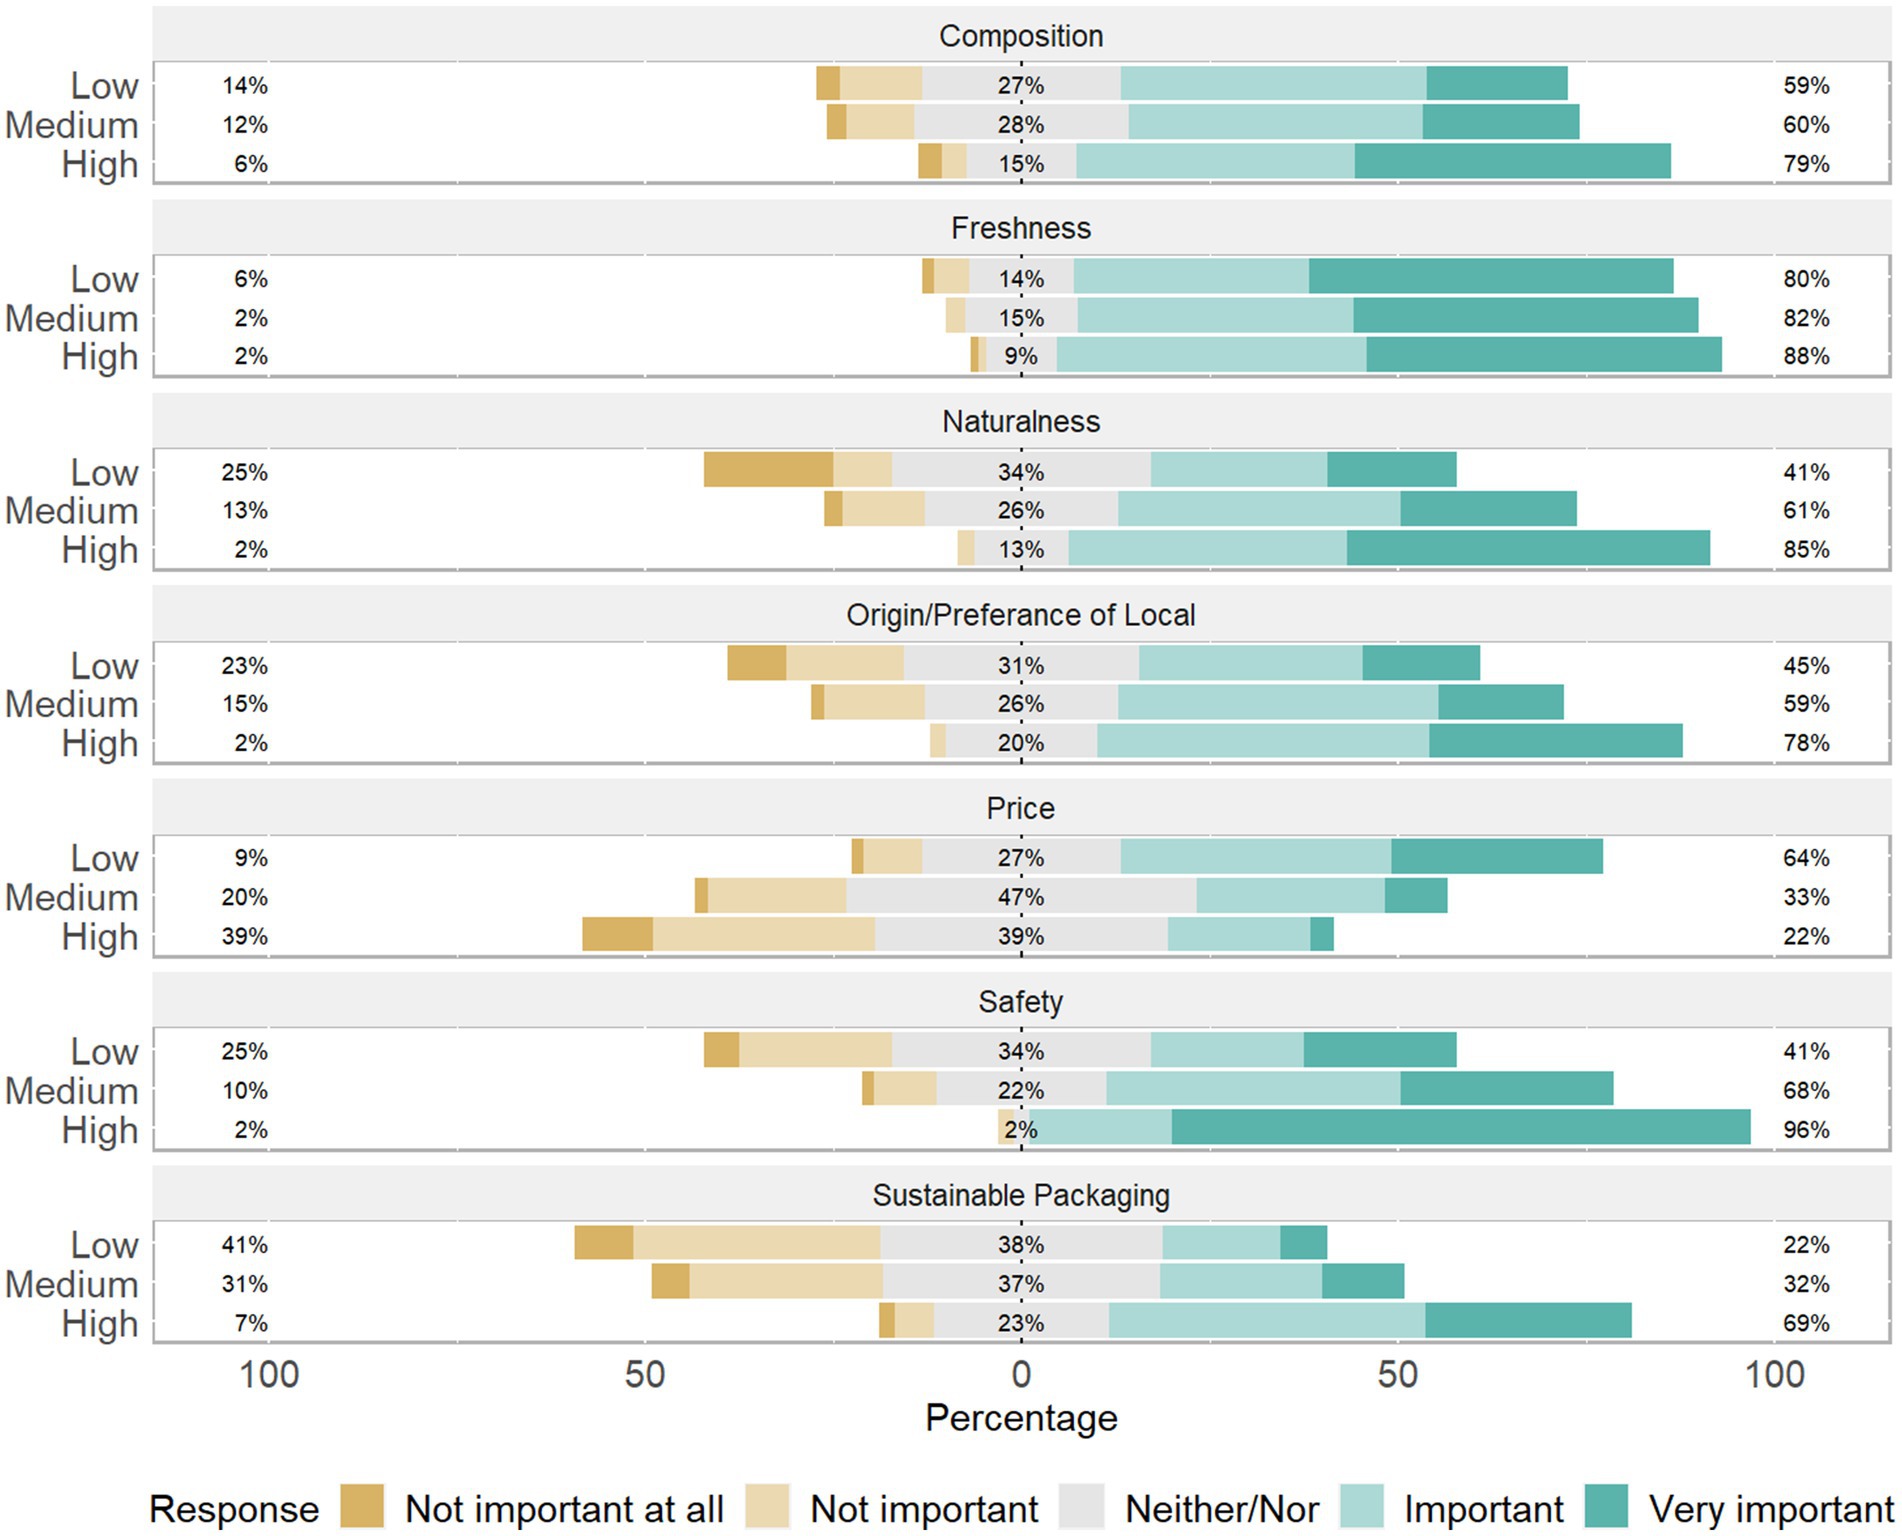
Figure 2. Food choice attributes of households living in Copenhagen from a 2022 survey divided by the three organic consumer subgroups low (n = 64), medium (n = 120) and high (n = 95). For definition of consumer subgroups, see note to Table 1. The respondents were asked to rate “How important are the attributes listed below for your food choices.” The bars on the right-hand side of the graph (green) indicate positive ratings (important to the respondents) and the bars on the left-hand side of the graph (orange) indicate negative ratings (less important). Respondents were asked to rate 13 attributes: Composition (ingredients), freshness, naturalness, origin, price, safety, seasonality, sustainable packaging, appearance, certificates, nutritional value, taste and absence of genetically modified organisms (GMO), among which there were relevant differences between the consumer groups for the seven first-mentioned attributes. If several attributes had similar meanings and results, one representative was shown (i.e., naturalness, GMO and certificates; local and seasonal; freshness and taste; composition and nutritional value).
Some points are worthy of notice in these results. The importance of naturalness [including free of artificial additives and genetically modified organisms (GMO)], composition and localness attributes were rated more important for the high organic subgroup, whereas price considerations was drawn a minor role in the food consumption decisions of consumers with relatively high shares of organic products in their food baskets. Freshness (including taste) was given importance by all three consumer subgroups.
In-depth interviews were conducted to gather qualitative insights from suppliers, kitchen professionals and municipal employee regarding their perceptions and experiences. From the perspective of the organic meal-box supplier, compared to some years ago, the consumer acceptance to eat more vegetables has increased. However, they have encountered a threshold for the minimum amount of meat that must be included in a meal to appeal to a broad consumer base, rather than just a niche audience. Although customers requested less packaging, they had to learn proper storage techniques to prevent increased food waste (see Supplementary material 6 for detailed interview results with meal-box supplier).
3.1.2 Organic in public food procurement and meal composition
The representative from the municipality administration subscribes to the premise that current political goals of reaching a high share of organic and reduce the climate footprint of public meals, requires changes of our consumption patterns. Table 2 shows an overview of how the organic quality of the public meals also changed its composition. The interviewee explained that the extra amount of meat that was in the meal before the reduction, most likely would have ended up as food waste.
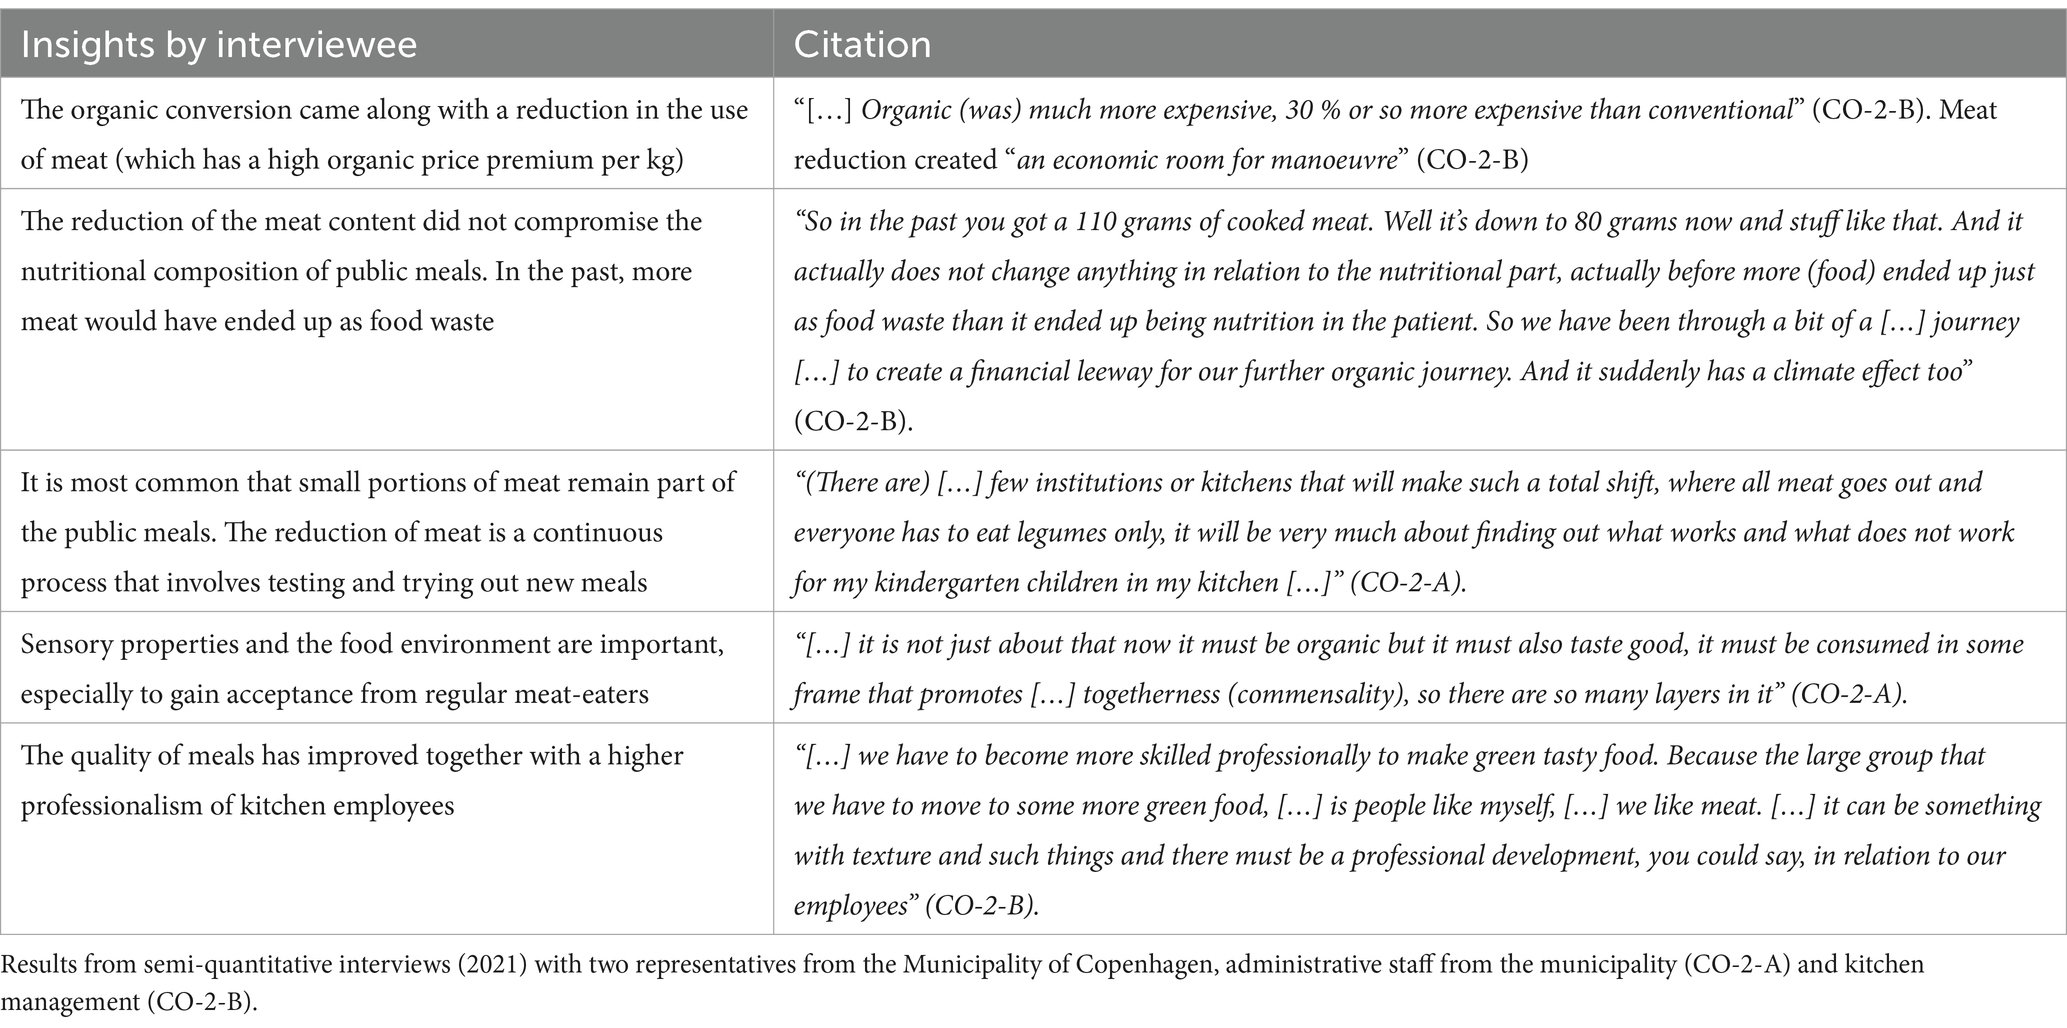
Table 2. Insights of public food procurement in Copenhagen.
Furthermore, the price mechanism was a key driver for PFP’s reduction in meat use following from the increased organic food share. This is in contrast to the findings for the households, where price was less frequently stated as an important attribute for consumers with high organic food consumption, while other considerations, such as nutritional value, naturalness or localness played much more prominent roles for those households’ food choices. Similar to the statements by the organic meal-box supplier, meat cannot just be eliminated. The interviewee from the kitchen management explains that it is especially a challenge to make tasteful green meals with the right texture (i.e., “mouthfeel”). From the household survey, the importance of taste seems to be independent of the organic food share. However, whereas respondents in the households make deliberate food choices (including high-organic consumers’ choices to consume less meat), meal-box suppliers and food service providers may face larger challenges to make their customers accept meals with changed food composition.
3.2 Food waste
3.2.1 Self-reported household food waste
Table 3 presents households’ level of self-reported food waste.

Table 3. Average food waste of food groups in grams (g) by organic consumer subgroups (low, medium and high) with standard deviations in parentheses.
According to Table 3, households’ food waste is decreasing with the increasing share of organic products in their food baskets. However, none of the food groups show significant differences of food waste (p < 0.05) between the three consumer subgroups.
The stated reasons for the generated waste in the households for the three consumer sub-groups are presented in Figure 3, which reports respondents’ agreements with statements like: “For me, it is difficult to use leftovers to prepare new dishes” on a 5-point Likert agreement scale.
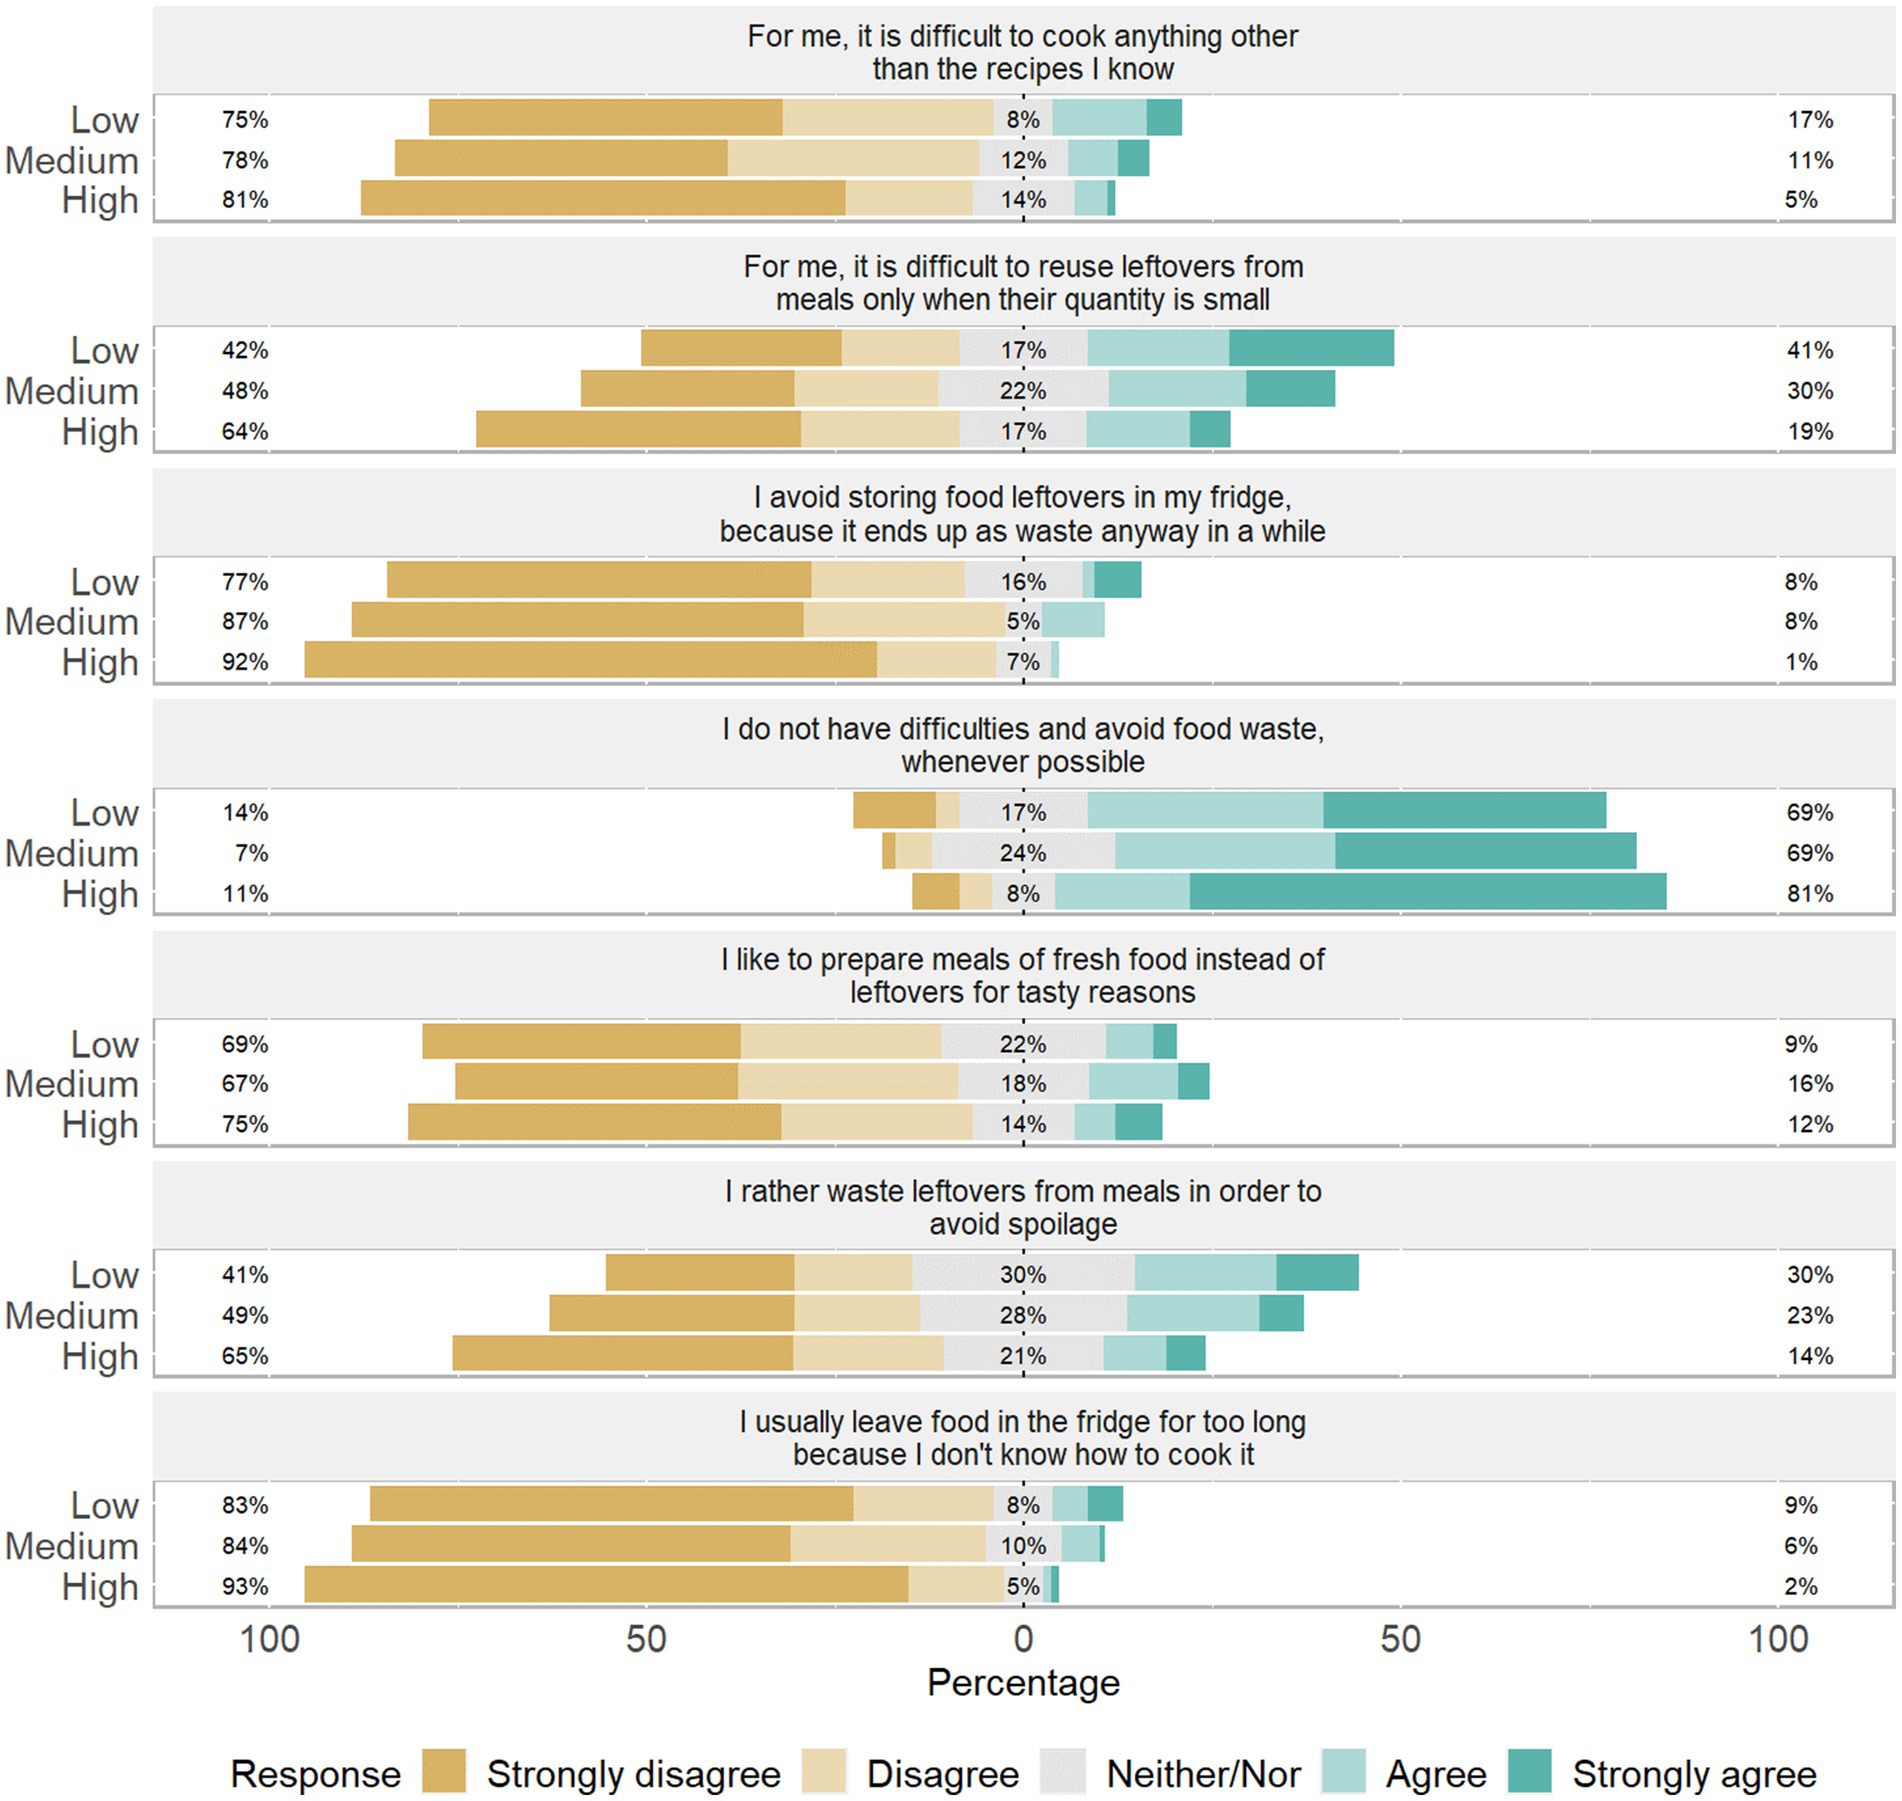
Figure 3. Causes of food waste of households living in Copenhagen from a 2022 survey for the three organic consumer subgroups low (n = 64), medium (n = 120) and high (n = 95). For definition of consumer subgroups, see note to Table 1. The bars on the right-hand side of the graph (green) indicate an agreement with reasons that cause food waste and the bars on the left-hand side of the graph (orange) indicate disagreement with those reasons. Only relevant results for which a difference is found between the three consumer subgroups are presented. Respondents were asked to rate 11 situations: if it is difficult to prepare a meal out of food storage at home, use leftovers to prepare new dishes, cook anything other than the recipes they know, leave food in the fridge for too long, reuse leftovers from meals (small quantity), household members dislike the same food in a row, rather waste leftovers to avoid spoilage, fresh food tastes better than leftovers, limited capacity for storage of leftovers, avoid storing leftovers because it ends as waste, and no difficulties to avoid food waste. If several reasons had similar meaning and results, one representative question was shown (i.e., Avoid storing leftovers because it ends as waste and limited capacity in kitchen for storage of leftovers; Cook anything other than the recipes I know and Household members dislike the same food in a row; Difficult to reuse leftovers from meals (small quantity) and use of leftovers to prepare new dishes; Food left in the fridge for too long and Prepare a meal out of food storage at home).
All respondents state that they intend to minimize food waste both in terms of their infrastructural measures at home and in terms of possessing the right (cooking) skills: Respondents do not depend on specific recipes, which means that they are able to cook meals creatively from what is left. The low organic group agrees to depend slightly more on recipes than the two other groups. Almost all of the suggested causes for food waste were rated less important for high organic than for respondents with low or medium organic food shares. High organic group rate to have less difficulties storing food for too long in the fridge and prepare meals out of the food storage at home. Another interesting result is that all subgroups agreed with the statement that they have no difficulties to avoid food waste, the largest agreement rated by the high organic group.
4 Discussion
Previous scholarly studies have found associations between organic food consumption and potential positive outcomes for health (Baudry et al., 2018), diet quality (Baudry et al., 2017) with less food of animal origin (Baudry et al., 2015; Denver et al., 2019; Sigrid et al., 2018; Christensen et al., 2020) and in turn a likely lower environmental footprint. Our study confirms those results. The diet composition of the high organic subgroup was higher in vegetables, fruits, legumes and whole grain cereals and lower in meats, which corresponds to healthier and likely also more sustainable diets according to recommendations from the Planetary Health Diet (Willett et al., 2019), which were adapted by the Danish national dietary guidelines (FVST, 2021; Lassen et al., 2020).
The reduction of meat and food waste in public food procurement was reported to be mainly driven by needs to improve production efficiency and reduce costs in the public kitchens as part of the means to finance the higher prices of organic ingredients. On the other hand, the key informants described furthermore that there is a “societal momentum” with increased consumer awareness of more sustainable and healthy food consumption (e.g., willingness to reduce food waste and eat less meat).
4.1 Perspectives and policy implications
Kushwah et al. (2019) listed several motives to eat organic, including health, sensory properties, nutritional content, quality and environment. Those results are aligned with our survey investigation. Freshness and taste of foods were rated as highly important by all groups, however, irrespectively of the share of organic food. Composition of foods was rated highest by the high organic subgroup as also the naturalness of foods, which refers to the quality of foods. In addition, sustainable packaging and local origin were given highest importance by the high organic subgroup. Both attributes may relate to the environment motive (Kushwah et al., 2019).
Respondents in the high organic subgroup consider themselves adept at preventing food waste at home and creatively preparing meals from leftovers without relying on recipes. Consumers recognizing their role in making the food system more sustainable by ‘Avoiding wasting food’ has been identified as a crucial lever for action (de Boer and Aiking, 2022). Nevertheless, no significant differences in food waste were observed across the three subgroups, which could indicate a gap between perception and actual food waste at home. We did not find previous studies investigating food waste in relation to organic consumers but other scholars report that organic consumers are relatively likely to follow sustainability practices (Fernandes and Saraiva, 2022).
Household behavior can be considered to be driven by individual decisions, such as, simple heuristics (Scheibehenne et al., 2007), trade-offs (Bava et al., 2008) or social norms (Higgs, 2015). In addition, private consumption is possibly influenced by stimuli from public policy, such as information, general debates etc. (Mozaffarian et al., 2018) and the market (Finlay et al., 2022). In contrast, central elements of the behavior in PFP are mainly driven by political decisions – which are not necessarily completely aligned with users’ preferences or market signals.
In the case of Copenhagen municipality’s meal and food policy (Municipality of Copenhagen, 2019), climate and organic goals are mentioned together. This was also highlighted by the case informants interviewed for this study. On the one hand, the goal is to reduce the climate footprint, and on the other, to increase the organic food share of public kitchens.
Our PFP interviewees describe that competence development of kitchen staff has been given the vast majority of effort. The organic conversion changed the management of the kitchens, including the handcrafting of food and the reduction of food waste. Kitchen staff is key in the transformation according to the municipality and public kitchen interviewees. This confirms what has been found in previous research (Sørensen et al., 2016a).
5 Strengths and limitations
Several strengths and limitations of the study can be mentioned. First, the design of the mixed-methods study allows us to get insights on different motives of transitioning to more sustainable and healthy diets from the perspectives of several actors (households from the survey answers and suppliers and public actors from the interviewees), which use the values of both quantitative and qualitative approaches (Cresswell, 2023), which can contribute to improve on validity and reliability of the resulting data (Abowitz and Toole, 2010). Second, the survey combines questions from diverse aspects of food consumption (i.e., diet, organic and food waste) to describe dietary behavior in a broader sense. Such an interdisciplinary approach can be helpful to explore consumer behavior better in a food system context. Third, for the interviews we used a rather simple recording method through video recording on Zoom, which was positively perceived by the interviewees due to ease of operation. This kind of recording has been described as highly satisfactory by other scholars (Archibald et al., 2019) and enabled us to continue the study despite COVID-19 restrictions.
The study also had some limitations. First, the self-selected study sample of the survey includes consumers who have an above-average interest in food, and apparently a relatively high share of organic food in their daily meals (approximately one third of the respondents indicate that more than 75% of their food intake is organic). In contrast, Danes have a share of around 12% organic in their baskets (Hindborg, 2021). Second, the cross-section nature of the survey cannot give causal explanations, it can only give indications and any potential causality needs to be tested in randomizes controlled trials. Third, we recognize a limitation of the food waste measurement method of this study. Self-reported food waste amounts (from memory) for the past week may cause a skewed distribution of answers (see Supplementary material 7 for data on food waste distribution) and this indicates that people do not know the exact amount of food disposed. Instead, we would have to look in people’s garbage bin to know what they actually waste. Goossens et al. (2019) have drawn attention to the challenge that many common food waste measurements are limited as there is a gap between the perception of food waste management at home and the actual food waste (Goossens et al., 2019). Lastly, interview-based methods are challenging as people’s opinions and perceptions may have a personal bias (Biggs, 2021).
6 Conclusion
This study indicates that in the case of Copenhagen private households and public kitchens with a high organic food share also behave more sustainably on other parameters, for instance, eating more vegetables and less meat but not decreasing food waste significantly at home. The majority of the high organic subgroup were complying with the official recommendation to eat maximum 50 grams of meat daily and they had especially low intake of red and processed meat, compared to the subgroup with low organic food share. Respondents in general seemed to have a strong intention to minimize food waste. Regardless of the share of organic products consumed, none of the food groups show statistically significant variations in food waste. Our results on food waste further indicate a gap between perceptions of food waste, skills and measures to prevent food waste and what the respondents actual dispose.
Differences between household-driven bottom-up transition and policy-driven top-down transition were found in the economic incentives to choose a more sustainable dietary behavior. Relatively few respondents of the high organic subgroup report that food prices play an important role for their food choices. In contrast, for the PFP, a restricted budget “forced” the public kitchens to implement change. Overall, mechanisms to choose organic food in private households versus public canteens are driven by different factors. The food service sector is described as a more controlled eating environment where public authorities to a large extent can influence the meal’s composition. However, private consumers are motivated by more intrinsic drivers (e.g., freshness of food).
The interviewees from private meal-box supply and from PFP described important determinants for success during the organic conversion process, such as competence development, investments and implementation or normalization of new standards. Competence development was important to gain consumer acceptance for a lower share of meat and developing acceptable taste of green meals. All interviewees mentioned the organic conversion in relation to reach climate goals as well (reduction of greenhouse gas emissions).
Our study shows the benefits of combining multiple aspects of the food system (i.e., diet, food waste and attitudes toward change) by applying quantitative and qualitative methods to understand dietary behavior in a broader sense. From a food system perspective, more attention should be devoted to the social pillar of sustainability, for instance accessibility and affordability of organic food.
Data availability statement
The original contributions presented in the study are included in the article/Supplementary material, further inquiries can be directed to the corresponding author.
Ethics statement
Written informed consent was obtained from the individual(s) for the publication of any potentially identifiable images or data included in this article.
Author contributions
LM: Conceptualization, Data curation, Formal analysis, Software, Validation, Writing – original draft, Methodology. SS: Conceptualization, Formal analysis, Funding acquisition, Methodology, Software, Supervision, Validation, Writing – review & editing. JJ: Conceptualization, Formal analysis, Funding acquisition, Methodology, Supervision, Writing – review & editing. DŚ-T: Funding acquisition, Methodology, Writing – review & editing. LR: Funding acquisition, Methodology, Writing – review & editing. SB: Conceptualization, Formal analysis, Funding acquisition, Methodology, Project administration, Resources, Supervision, Writing – review & editing.
Funding
The author(s) declare that financial support was received for the research, authorship, and/or publication of this article. These results have been achieved within the SysOrg project “Organic agro-food systems as models for sustainable food systems in Europe and Northern Africa.” The authors acknowledge the financial support for this project provided by transnational funding bodies, partners of the H2020 ERA-NETs SUSFOOD2 and CORE Organic Cofunds, under the Joint SUSFOOD2/CORE Organic Call 2019, with national funding from Green Development and Demonstration Programme (GUDP) under the Danish Ministry of Environment and Food (Grant number 34009-20-1694).
Acknowledgments
We extend our deepest appreciation to the SysOrg Consortium for their invaluable feedback and support in the design of this study.
Conflict of interest
The authors declare that the research was conducted in the absence of any commercial or financial relationships that could be construed as a potential conflict of interest.
Generative AI statement
The authors declare that no Gen AI was used in the creation of this manuscript.
Publisher’s note
All claims expressed in this article are solely those of the authors and do not necessarily represent those of their affiliated organizations, or those of the publisher, the editors and the reviewers. Any product that may be evaluated in this article, or claim that may be made by its manufacturer, is not guaranteed or endorsed by the publisher.
Supplementary material
The Supplementary material for this article can be found online at: https://www.frontiersin.org/articles/10.3389/fsufs.2025.1534068/full#supplementary-material
Footnotes
1. ^For a scientific research project on diet, organic food and food waste, we look for adults (over 18 years), living in Copenhagen, to answer a questionnaire. The research project is part of an international scientific study that aims to increase the sustainability of our food system.
References
Abowitz, D. A., and Toole, T. M. (2010). Mixed method research: fundamental issues of design, validity, and reliability in construction research. J. Constr. Eng. Manag. 136, 108–116. doi: 10.1061/(ASCE)CO.1943-7862.0000026
Archibald, M. M., Ambagtsheer, R. C., Casey, M. G., and Lawless, M. (2019). Using zoom videoconferencing for qualitative data collection: perceptions and experiences of researchers and participants. Int J Qual Methods 18:1609406919874596. doi: 10.1177/1609406919874596
Basnet, S., Wood, A., Röös, E., Jansson, T., Fetzer, I., and Gordon, L. (2023). Organic agriculture in a low-emission world: exploring combined measures to deliver a sustainable food system in Sweden. Sustain. Sci. 18, 501–519. doi: 10.1007/s11625-022-01279-9
Baudry, J., Allès, B., Péneau, S., Touvier, M., Méjean, C., Hercberg, S., et al. (2017). Dietary intakes and diet quality according to levels of organic food consumption by French adults: cross-sectional findings from the NutriNet-Santé cohort study. Public Health Nutr. 20, 638–648. doi: 10.1017/S1368980016002718
Baudry, J., Lelong, H., Adriouch, S., Julia, C., Allès, B., Hercberg, S., et al. (2018). Association between organic food consumption and metabolic syndrome: cross-sectional results from the NutriNet-Santé study. Eur. J. Nutr. 57, 2477–2488. doi: 10.1007/s00394-017-1520-1
Baudry, J., Méjean, C., Allès, B., Péneau, S., Touvier, M., Hercberg, S., et al. (2015). Contribution of organic food to the diet in a large sample of French adults (the NutriNet-Santé cohort study). Nutrients 7, 8615–8632. doi: 10.3390/nu7105417
Bava, C. M., Jaeger, S. R., and Park, J. (2008). Constraints upon food provisioning practices in ‘busy’ women's lives: trade-offs which demand convenience. Appetite 50, 486–498. doi: 10.1016/j.appet.2007.10.005
Beretta, C., Stoessel, F., Baier, U., and Hellweg, S. (2013). Quantifying food losses and the potential for reduction in Switzerland. Waste Manag 33, 764–773. doi: 10.1016/j.wasman.2012.11.007
BEUC. (2020). One bite at a time: consumers and the transition to sustainable food. Bruxelles. Available online at: https://www.beuc.eu/sites/default/files/publications/beuc-x-2020-042_consumers_and_the_transition_to_sustainable_food.pdf
Biggs, R. (2021). The Routledge handbook of research methods for social-ecological systems. New York: Taylor & Francis.
Christensen, T., Denver, S., and Bøye Olsen, S. (2020). Consumer preferences for organic food and for the shares of meat and vegetables in an everyday meal. J. Int. Food Agribus. Mark. 32, 234–246. doi: 10.1080/08974438.2019.1599758
Copenhagen Department of Finance. (2017). The capital of sustainable development: the City of Copenhagen’s action plan for the sustainable development goals. The City of Copenhagen. Available online at: https://international.kk.dk/sites/default/files/2022-01/Verdensma%Cc%8Al_Uk_Web_Fin.pdf (Accessed October 27, 2022)
Cresswell, J. W. (2023). A concise introduction to mixed methods research. Thousand Oaks, CA: Sage Publications.
De Boer, J., and Aiking, H. (2022). Do Eu consumers think about meat reduction when considering to eat a healthy, sustainable diet and to have a role in food system change? Appetite 170:105880. doi: 10.1016/j.appet.2021.105880
Denver, S., Nordström, J., and Christensen, T. (2019). Is an increase in organic consumption accompanied by A healthier diet? A comparison of changes in eating habits among Danish consumers. J. Food Prod. Mark. 25, 479–499. doi: 10.1080/10454446.2019.1600449
Di Cesare, M., Springmann, M., Shekar, M., Ghosh, S., Osendarp, S., Mozaffarian, D., et al. (2021). 2021 global nutrition report: the state of global nutrition. Bristol: Development Initiatives.
Ericksen, P. J. (2008). Conceptualizing food systems for global environmental change research. Glob. Environ. Chang. 18, 234–245. doi: 10.1016/j.gloenvcha.2007.09.002
FAO (2018). Sustainable food systems concept and framework. Rome: Food and Agriculture Organization of the Unites Nations.
FAO and WHO (2019). Sustainable healthy diets - guiding principles. Rome: Food and Agriculture Organization of the United Nations & World Health Organization.
Fernandes, E., and Saraiva, A. (2022). Alternative consumer practices for a sustainable identity: the perspective of organic food consumption. J. Mark. Manag. 38, 279–308. doi: 10.1080/0267257X.2021.1954057
Finlay, A., Robinson, E., Jones, A., Maden, M., Cerny, C., Muc, M., et al. (2022). A scoping review of outdoor food marketing: exposure, power and impacts on eating behaviour and health. BMC Public Health 22:1431. doi: 10.1186/s12889-022-13784-8
FVST (2012). Økologisk Handlingsplan 2020. Copenhagen: Ministry of Food, Agriculture and Fisheries of Denmark.
FVST. (2021). The Danish official dietary guidelines. Ministry of Food, Agriculture and Fisheries of Denmark. Available online at: https://en.fvm.dk/focus-on/the-danish-official-dietary-guidelines/ (Accessed November 28, 2022)
Goossens, Y., Wegner, A., and Schmidt, T. (2019). Sustainability assessment of food waste prevention measures: review of existing evaluation practices. Front. Sustain. Food Syst. 3:476725. doi: 10.3389/fsufs.2019.00090
Groves, R. M., Presser, S., and Dipko, S. (2004). The role of topic interest in survey participation decisions. Public Opin. Q. 68, 2–31. doi: 10.1093/poq/nfh002
Halkier, B. (2021). Hybridity and change in cooking skills in everyday life: conceptual contributions from a study of cooking with meal-box schemes. Appetite 165:105311. doi: 10.1016/j.appet.2021.105311
Higgs, S. (2015). Social norms and their influence on eating behaviours. Appetite 86, 38–44. doi: 10.1016/j.appet.2014.10.021
Hindborg, H. (2021). “Økologisk Markedsrapport 2021” in Detail - foodservice - Eksport. ed. L. Kaad-Hansen (Aarhus: Økologisk Landsforening).
HLPE (2017). Nutrition and food systems. A report by the high level panel of experts on food security and nutrition of the committee on world food security. Rome: High Level Panel of Experts on Food Security and Nutrition.
Kushwah, S., Dhir, A., Sagar, M., and Gupta, B. (2019). Determinants of organic food consumption. A systematic literature review on motives and barriers. Appetite 143:104402. doi: 10.1016/j.appet.2019.104402
Lassen, A. D., Christensen, L. M., and Trolle, E. (2020). Development of a Danish adapted healthy plant-based diet based on the eat-lancet reference diet. Nutrients 12:738. doi: 10.3390/nu12030738
Lassen, A. D., Thorsen, A. V., and Trolle, E. (2022). Sustainable public food procurement – status and perspectives [Bæredygtige offentlige fødevareindkøb – status og perspektiver]. Kgs. Lyngby: Dtu Fødevareinstituttet.
Lehdonvirta, V., Oksanen, A., Räsänen, P., and Blank, G. (2021). Social media, web, and panel surveys: using non-probability samples in social and policy research. Policy Internet 13, 134–155. doi: 10.1002/poi3.238
Mozaffarian, D., Angell, S. Y., Lang, T., and Rivera, J. A. (2018). Role of government policy in nutrition—barriers to and opportunities for healthier eating. BMJ 361:k2426. doi: 10.1136/bmj.k2426
Municipality of Copenhagen (2022). Status på København 2022. Copenhagen: Municipality of Copenhagen.
Peronti, B., Di Veroli, J. N., Scognamiglio, U., Baiamonte, I., Stefanovic, L., Bügel, S. G., et al. (2024). Household food waste in five territories in Europe and northern Africa: evaluation of differences and similarities as implication for actions. J. Clean. Prod. 452:142086. doi: 10.1016/j.jclepro.2024.142086
Porpino, G., Parente, J., and Wansink, B. (2015). Food waste paradox: antecedents of food disposal in low income households. Int. J. Consum. Stud. 39, 619–629. doi: 10.1111/ijcs.12207
Rosane Philippi, B., Matthiessen, L. E., Góralska-Walczak, R., Kopczyńska, K., Średnicka-Tober, D., Kazimierczak, R., et al. (2023). Development of a methodology to compare and evaluate health and sustainability aspects of dietary intake across countries. Front. Sustain. Food Syst. 7:1147874. doi: 10.3389/fsufs.2023.1147874
Scheibehenne, B., Miesler, L., and Todd, P. M. (2007). Fast and frugal food choices: uncovering individual decision heuristics. Appetite 49, 578–589. doi: 10.1016/j.appet.2007.03.224
Sigrid, D., Leif Jonas, N., and Tove, C. (2018). Increase in organic consumption and dietary health: a dynamic approach.
Sørensen, N. N., Løje, H., Tetens, I., Wu, J. H. Y., Neal, B., and Lassen, A. D. (2016a). Wellbeing at work among kitchen workers during organic food conversion in Danish public kitchens: a longitudinal survey. Eur. J. Pub. Health 26, 323–328. doi: 10.1093/eurpub/ckv229
Sørensen, N. N., Tetens, I., Løje, H., and Lassen, A. D. (2016b). The effectiveness of the Danish organic action plan 2020 to increase the level of organic public procurement in Danish public kitchens. Public Health Nutr. 19, 3428–3435. doi: 10.1017/S1368980016001737
Staudigel, M., and Trubnikov, A. (2022). High price premiums as barriers to organic meat demand? A hedonic analysis considering species, cut and retail outlet. Aust. J. Agric. Resour. Econ. 66, 309–334. doi: 10.1111/1467-8489.12472
The Organic Cuisine Label. (2021). The organic cuisine label. The Organic Cuisine Label. Available online at: https://www.oekologisk-spisemaerke.dk/horeca-en/ (Accessed September 9, 2021)
Trávníček, J., Willer, H., and Schaack, D. (2022). Organic Farming and Market Development in Europe and the European Union. FiBL.
Ulug, C., Trell, E.-M., and Horlings, I. (2021). Ecovillage foodscapes: zooming in and out of sustainable food practices. Agric. Hum. Values 38, 1041–1059. doi: 10.1007/s10460-021-10213-1
University of Oxford. (2022). The million women study. Available online at: http://www.millionwomenstudy.org/introduction/ (Accessed January 5, 2022)
Van Herpen, E., Van Geffen, L., Nijenhuis-De Vries, M., Holthuysen, N., Van Der Lans, I., and Quested, T. (2019). A validated survey to measure household food waste. MethodsX 6, 2767–2775. doi: 10.1016/j.mex.2019.10.029
Willett, W., Rockström, J., Loken, B., Springmann, M., Lang, T., Vermeulen, S., et al. (2019). Food in the Anthropocene: the Eat–Lancet Commission on healthy diets from sustainable food systems. The Lancet 393, 447–492. doi: 10.1016/S0140-6736(18)31788-4
Ygil, K. H. (2013). Mål, vægt og portionsstørrelser på fødevarer [Online]. Dtu Fødevareinstituttet. Available online at: https://backend.orbit.dtu.dk/ws/portalfiles/portal/54035130/maal_vaegt_portionsstoerrelser_marts_13.pdf (Accessed August 10, 2023)
Keywords: sustainable food systems, dietary behavior, organic food, food waste, SysOrg
Citation: Matthiessen LE, Smed S, Jensen JD, Średnicka-Tober D, Rossi L and Bügel SG (2025) Eating green in Copenhagen: organic consumers’ path to less meat and minimal food waste. Front. Sustain. Food Syst. 9:1534068. doi: 10.3389/fsufs.2025.1534068
Edited by:
Reza Rastmanesh, American Physical Society, United StatesReviewed by:
Geoffrey Walker Greene, University of Rhode Island, United StatesJoop De Boer, VU Amsterdam, Netherlands
Copyright © 2025 Matthiessen, Smed, Jensen, Średnicka-Tober, Rossi and Bügel. This is an open-access article distributed under the terms of the Creative Commons Attribution License (CC BY). The use, distribution or reproduction in other forums is permitted, provided the original author(s) and the copyright owner(s) are credited and that the original publication in this journal is cited, in accordance with accepted academic practice. No use, distribution or reproduction is permitted which does not comply with these terms.
*Correspondence: Lea Ellen Matthiessen, bGVtQG5leHMua3UuZGs=