 Mengwen Shan
 Min Ji1*
95% of researchers rate our articles as excellent or good
Learn more about the work of our research integrity team to safeguard the quality of each article we publish.
Find out more
ORIGINAL RESEARCH article
Front. Sustain. Food Syst. , 02 April 2025
Sec. Agricultural and Food Economics
Volume 9 - 2025 | https://doi.org/10.3389/fsufs.2025.1508492
Introduction: With the development of agricultural industry clustering and scale expansion, agricultural carbon emissions (ACEs) have gradually formed a spatial association network. Clarifying the agricultural carbon emissions spatial correlation network (ACESCN) and its influencing factors in Shandong Province is crucial for advancing low-carbon agricultural development.
Methods: Based on ACE in 16 cities of Shandong Province, this study uses Social Network Analysis (SNA) and Quadratic Assignment Procedure (QAP) to investigate the spatial spillover effects and driving factors of ACESCN in Shandong Province from 2010 to 2022.
Results and discussion: The findings show that the following: (1) overall, ACE in Shandong Province has shown a trend of initially increasing and then decreasing. (2) the ACESCN in Shandong Province has gradually improved in both connectivity and robustness, forming a network structure centered around Weifang, Jinan, and Tai’an. However, the degree of network connectivity remains relatively loose, indicating that the network structure needs optimization. Within the network, there are significant spatial spillover and spatial agglomeration effects. (3) Geographical proximity, economic level, industrial structure, and the opening-up degree have a significant impact on spatial correlation. Therefore, this study suggests that spatial associations should be fully utilized to enhance cross-regional agricultural production interactions and cooperation. This approach will help form a rational agricultural industry agglomeration structure, providing a scientific basis for Shandong Province to achieve low-carbon agricultural development and regional coordinated emission reductions.
At present, global warming has become a major challenge for mankind. According to the assessment report of the Intergovernmental Panel on Climate Change (IPCC), the global temperature has risen by 1.1°C compared with pre-industrial times, and the frequency and intensity of extreme weather caused by global warming has increased, posing a threat to the sustainability of agricultural production (Ali et al., 2019). China’s economy has experienced rapid development, and urbanization has continued to accelerate. China’s total carbon dioxide emission has always been higher than the world average level and has become the country contributing the most carbon emissions worldwide (Liu et al., 2023). In this grim context, China has set targets to reach a carbon emissions peak by 2030 and carbon neutrality by 2060 (Gao and Gao, 2024). Relevant studies show that agricultural carbon emissions (ACEs) are the most important source of greenhouse gases in our country, constituting roughly 17% of the total national greenhouse gas emissions (He et al., 2020; Pierre et al., 2022; Wen et al., 2022). Therefore, reducing ACE will directly impact the achievement of China’s dual carbon goals.
As an agricultural powerhouse, China has outlined six key tasks and 10 major actions in the “Implementation Plan for Agricultural Emission Reduction and Carbon Sequestration.” These measures aim to synergistically advance agricultural, ecological, and environmental protection and enhance the co-benefits of agricultural pollution reduction and carbon emission reduction. The plan includes developing smart emission reduction technologies and livestock gut fermentation suppression techniques and promoting nationwide manure resource utilization and agricultural soil carbon sequestration (Das et al., 2024). The goal is to lower agricultural greenhouse gas emissions by implementing a series of agricultural measures to achieve sustainable agricultural development. However, Shandong Province, a critical agricultural province in China, serves as a crucial grain production foundation in our country. As the swift advancement of its agricultural economy, significant advancements in agricultural techniques, and the continuous input of agricultural materials, what follows is the continuous increase of agricultural environmental pollution and agricultural greenhouse gases in Shandong Province (Liu et al., 2020). Simultaneously, as the regional coordinated strategy in Shandong Province continues to deepen, the development pattern of “a group, two centers and three circles” has been promoted (Song et al., 2024), which further promotes the formation of agricultural industry clusters, tightens the interdependence of ACE between cities, and gradually forms a correlation network with each other. Therefore, accurately calculating Shandong’s ACE and studying the spatial agglomeration and spillover effects of these emissions from a spatial perspective have become key research focuses.
Currently, research on ACE mainly focuses on the following aspects. First, in measuring ACE, scholars primarily use methods such as the carbon emission coefficient method, Life Cycle Assessment (LCA), and the mass balance method. Among these, LCA is a method used to evaluate the environmental impact throughout the entire life cycle of crops (Inés et al., 2023; Jebari et al., 2024). It covers the carbon emissions from all activities in the agricultural production process, providing a more detailed and comprehensive approach to carbon emission measurement. However, since LCA requires creating a unique life cycle inventory for the agricultural system (Thomas et al., 2023), data availability and accuracy are major factors affecting the evaluation. Additionally, the diverse sources of ACE (Lesschen et al., 2011; Zhu et al., 2016) can lead to overlooking the connections and impacts of different sources of emissions in the agricultural production process (Yao et al., 2024).
Second, the spatial correlation and clustering impacts have received extensive attention. Scholars mostly used spatial measures such as kernel density function, Moran index, Theil index, and Gini coefficient (George and Franklin, 2017; Du et al., 2024; Yang et al., 2024) to analyze and an input–output model to study their spatial convergence and distribution characteristics, which reveals the spatial correlation of ACE in a way, indicating significant spatial agglomeration and dependence among cities (George and Franklin, 2017). However, the above research only considers the geographical closeness of the two regions and is conducted by attribute data, which fails to indicate the spatial correlation of carbon emissions from a holistic perspective and ignores the integrity among different areas (Zhou and Wen, 2024), and fails to realize regional collaborative emission reduction. With the development of industry clusters and the promotion of coordinated development strategy of regions in recent times, the flow of agricultural production technology, workforce, and capital has become increasingly frequent, making the spatial associations of ACE more adjacency relationship in a geographical sense (Ji and Zhang, 2023), breaking the traditional linear model and presenting more complex network characteristics in space.
Finally, regarding the factors influencing ACE, most scholars have used methods such as the Kaya-LMDI decomposition method (González et al., 2014), Autoregressive Distributed Lag (ARDL) models (Dar et al., 2024), and Tobit models (Liu and Gao, 2022) to examine the impact of external factors such as economic conditions and technological advancements on the promotion or suppression of ACE (Md et al., 2023; Nsabiyeze et al., 2024), as well as the effects of internal factors such as industrial agglomeration and technological progress (Dauda et al., 2021; Wang et al., 2023). They believe that economic and technological advancements have varying impacts on carbon emissions across different regions and that implementing carbon reduction policies combining technological measures with agricultural development will effectively control ACE (Nsabiyeze et al., 2024). Furthermore, some studies have explored the impact of agricultural management, climate change, and crop production on greenhouse gas emissions through field measurements (Abdul et al., 2022; Agyeman-Richard et al., 2023; Shannon et al., 2024). However, these studies mainly focus on single factors affecting the increase or decrease of ACE and do not identify the factors contributing to establishing spatial associations of ACE between cities. By combining spatial autocorrelation analysis with the study of carbon emissions’ transfer and transmission under different driving factors, it has been found that ACE can be transmitted to other regions through economic activities and policies.
Given the limitations of current research, this study makes several innovations and contributions: (1) Previous studies have primarily focused on geographic proximity or adjacency between two regions based on attribute data. This study utilizes relational data to explore the spatial associations, structural characteristics, and spatial conduction mechanisms of a certain system, which can effectively reveal complex non-linear network relationships in a region. (2) This study provides a comprehensive analysis of the structural characteristics of the ACESCN, clarifying the position and function of each node within the network. (3) The study uses QAP regression analysis to determine the factors affecting the establishment of the ACESCN in Shandong Province, addressing the issue of multicollinearity among independent variables. (4) The findings of this study offer a basis for achieving low-carbon development in agriculture and regional collaborative governance in Shandong Province.
Shandong Province is situated along the eastern coast of China and downstream of the Yellow River. It forms a terrain and landform with mountains and hills as the skeleton and plains and lakes in an interlacing ring. Plains are mainly distributed in the west of Shandong Province, followed by hills and mountains, accounting for 15.39 and 14.59%, respectively. The Shandong province has a warm temperate and monsoonal climate. In 2022, the average annual temperature will be 14.5°C, the average annual precipitation will be 861.5 mm, and the average annual sunshine will be 2304.5 h. The superior geographical location and sufficient precipitation and light provide superior conditions for developing agriculture in Shandong Province. As a crucial agricultural region in China, the total arable land in 2022 is 6.4564 million hectares, ranking sixth in the world. The sown area of crops is 10.9641 million hectares, the total grain output is 55.438 million tons, and the total rural output is 608.99 billion yuan, ranking third in the world. Obviously, Shandong Province, as a large agricultural province, has extremely rich agricultural resources.
The time span of this study is 2010–2022. The social activity data needed are from the Shandong Statistical Yearbook and municipal statistical bureaus, the carbon emission coefficient data are sourced from IPCC and related references, and the administrative boundary data are from the Resources and Environment Science Data Platform. The calculation of distances between cities utilizes the geographical coordinates of cities in Shandong Province. The figures relating to GDP are based on 2010, eliminating the effect of price changes.
Based on the analysis of Shandong’s ACE, this study constructs the spatial correlation matrix and investigates the spatial spillover effect and the influence factors based on SNA and QAP. The detailed workflow is shown in Figure 1.
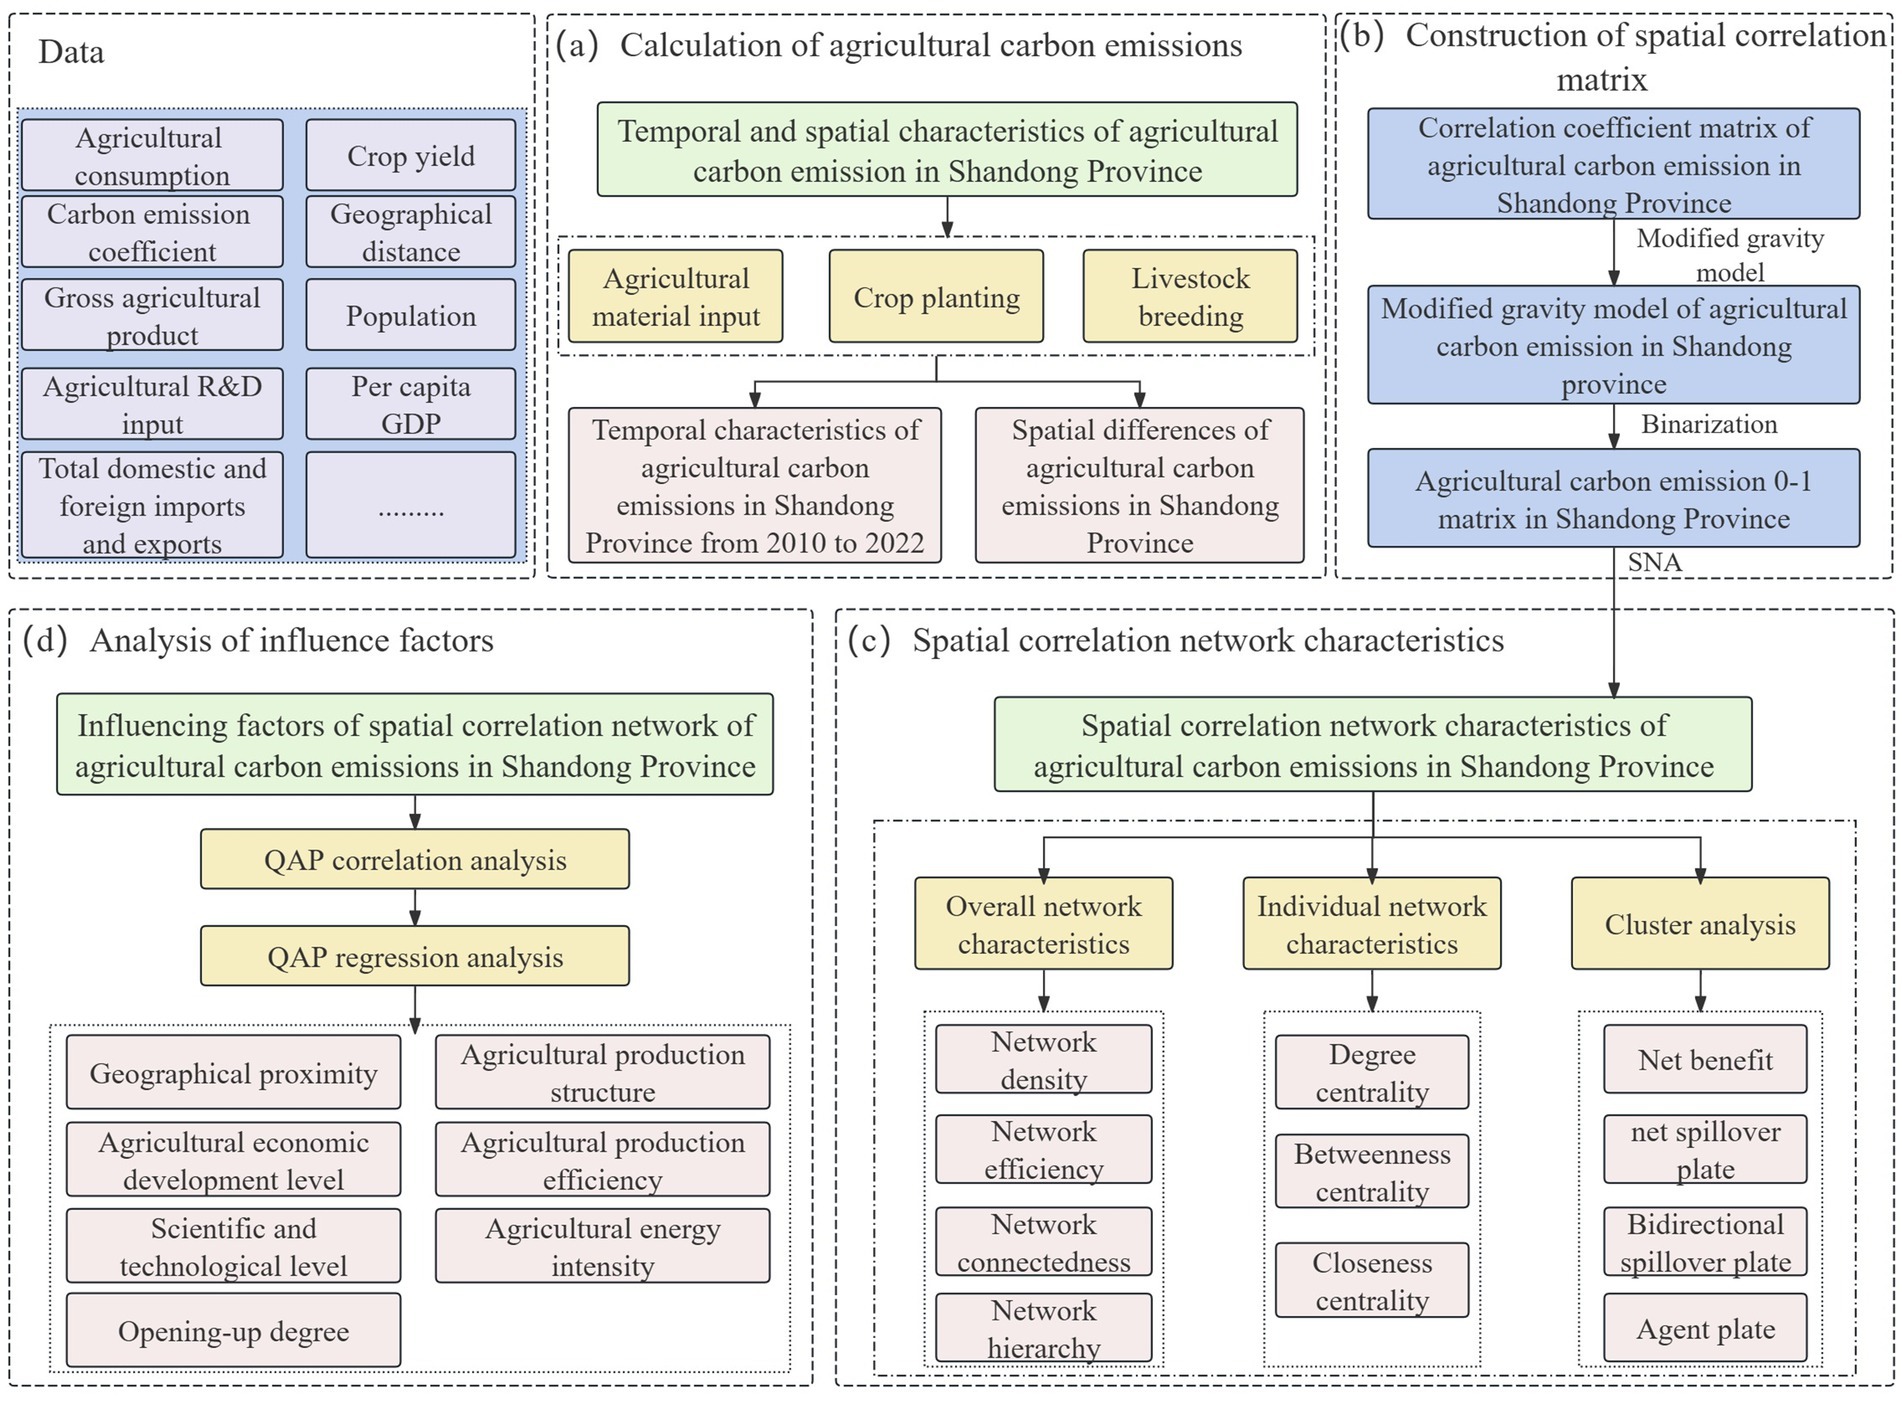
Figure 1. Analysis flow chart.
Since the agricultural carbon sources are characterized by diversity (Hu et al., 2023), this study divides the ACE into three parts. The input of agricultural materials (Table 1) is mainly considered from using fertilizers, agricultural film, pesticides, diesel, and the area under plowing and irrigation. The release of methane (CH4) from rice cultivation and nitrous oxide (N2O) from other crops are mainly considered for crop cultivation (Table 2), and the release of CH4 and N2O caused by intestinal fermentation in livestock breeding and livestock manure are considered for livestock breeding (Table 3). Referring to the IPCC measurement method, this study establishes Shandong’s agricultural carbon emission calculation framework and determines carbon emission coefficients by combining the IPCC and relevant works of literature. The formula is Equation 1:

Table 1. Carbon emission coefficient and sources of agricultural material input.
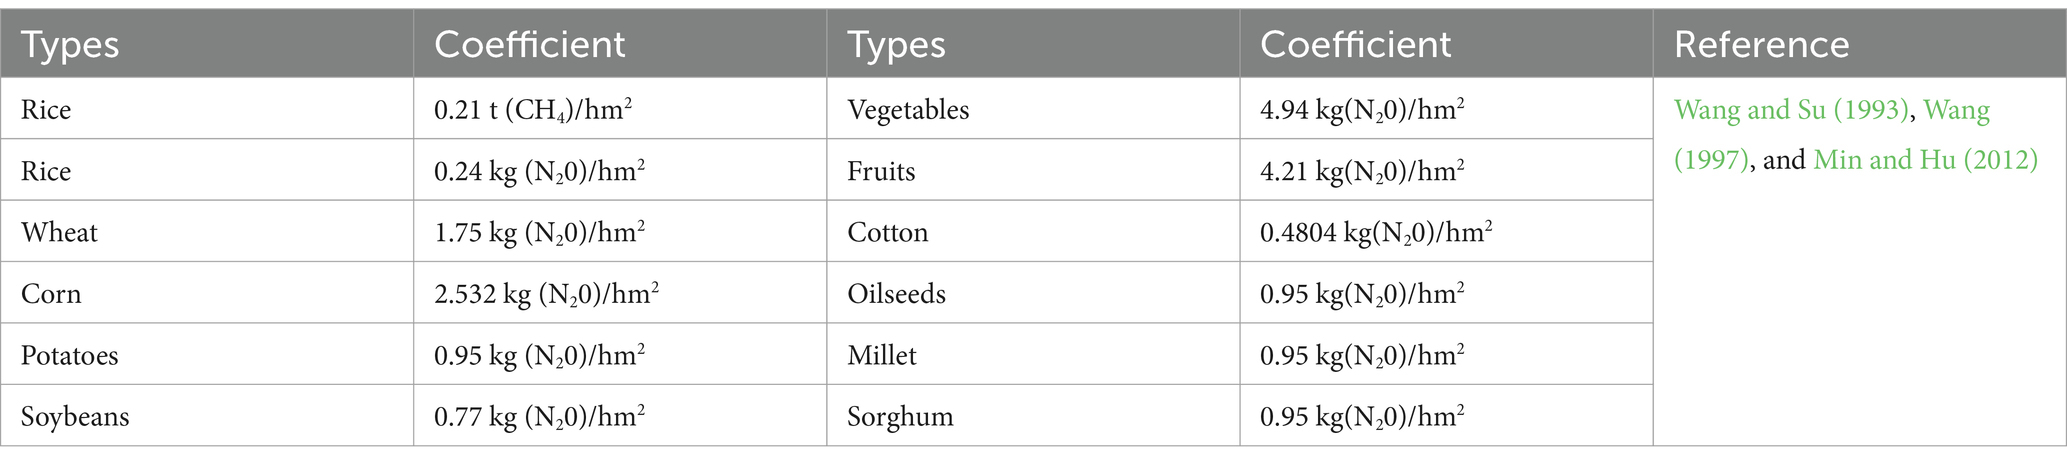
Table 2. Carbon emission coefficient and sources of crop planting.
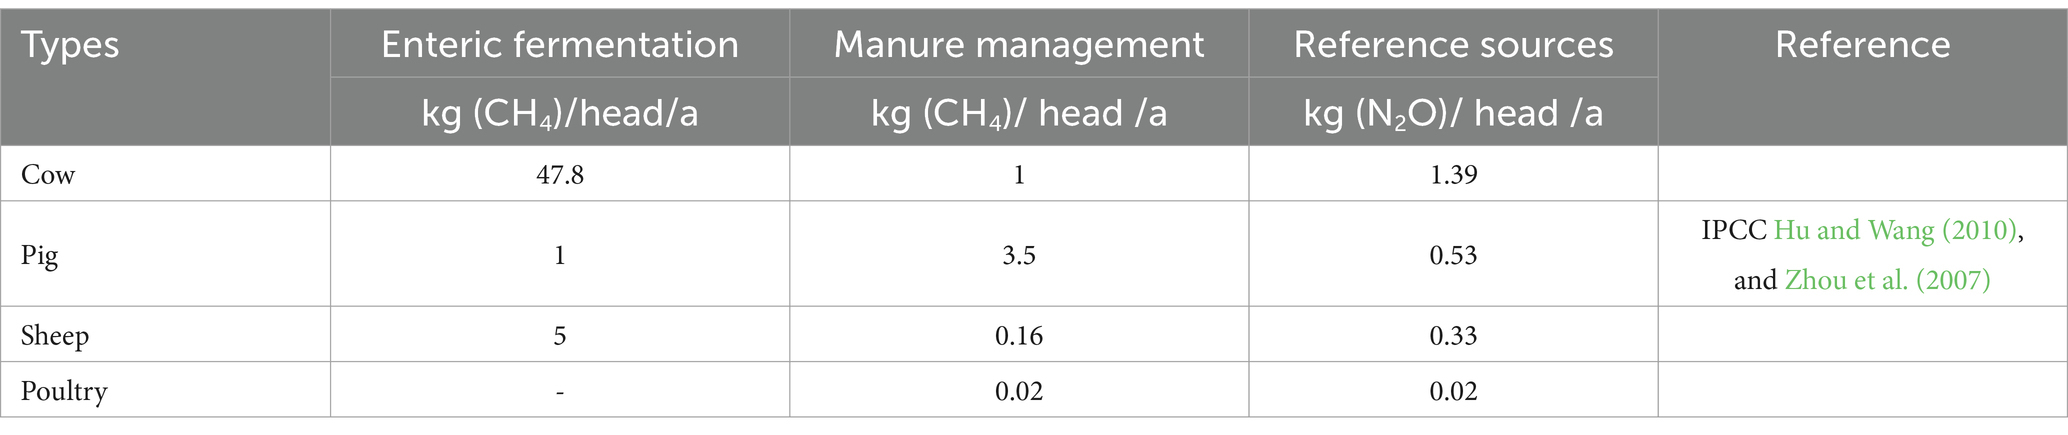
Table 3. Carbon emission coefficient and sources of livestock breeding.
Where C represents the ACE of Shandong Province, Ti represents the activity level, and αi represents the carbon emission coefficient. To facilitate the calculation of Shandong’s total ACE, in accordance with the IPCC assessment report, the impact on the greenhouse effect from 1 t CH4 and N2O equals to 6.82tC and 81.27tC, and the greenhouse effect generated by CH4 and N2O is converted into standard C.
SNA relies on the spatial correlation matrix. To analyze the ACESCN in Shandong province, the initial step involves constructing the correlation matrix. Currently, the main methods used include the vector autoregressive and gravity models. However, the vector autoregressive model is influenced by lag orders, introducing uncertainty biases when describing spatial correlations. In contrast, gravity models incorporate economic and geographic factors, allowing for a more precise characterization of network features (Yu et al., 2022). So, we employ a modified gravity model to describe the association of ACE in Shandong Province and build a correlation matrix. The basic formula is Equation 2:
Where Rij represents the gravitational coefficient between city i and city j, and agricultural carbon emission is used for distribution; P, G, C and A, respectively, represent the rural population, per capita agricultural GDP, carbon emissions and agricultural sown area between cities i and j; Dij represents the distance between cities i and j. The correlation matrix can be derived from the formula, and the average value of each row is taken as the threshold value. If the number is higher than the threshold, it is set to 1, indicating that the cities in the corresponding rows have a correlation; otherwise, it is set to 0.
Using SNA, the ACESCN in Shandong is viewed as a spatial network system. Each city is treated as a network node, with their correlations represented as edges. This study analyzes the spatial spillover agglomeration effect from the perspectives of overall network characteristics, individual network characteristics, and cluster analysis (Cheng et al., 2024). It also analyzes the inner state of the correlation network and the role of each member from the perspective of spatial clustering.
Network density reflects the closeness of the network members. The formula is Equation 3:
Where Cρ represents network density, N represents the number of network nodes, and K represents the number of network correlations.
Network connectedness reflects the robustness of the network. The formula is Equation 4:
Where CC represents network connectivity and V represents the count of node pairs that are unreachable from each other.
Network efficiency reveals the number of network correlation lines. The formula is Equation 5:
Where CE represents the network efficiency, R represents the number of redundant lines, and Max(R) represents the maximum quantity of possible redundant lines.
Network hierarchy reflects the extent of asymmetry within the network (Li et al., 2024b), reflecting the status difference of each node. The formula is Equation 6:
Where CH represents the network hierarchy, S represents the logarithm of symmetry approachable points, and MAX(S) represents the maximum quantity of possible symmetric approachable point logarithm.
Degree centrality reveals the status of each node. The higher the point degree centrality, the stronger the node’s direct correlation with other nodes (Li et al., 2024a), indicating that this node occupies a central status and can influence neighboring nodes. The formula is Equation 7:
Where N represents the number of network relationships; n represents the number of direct relationships between city i and other cities.
Betweenness centrality reflects the degree of control of nodes to other nodes and its mediating function. The formula is Equation 8:
Where bjk(i) represents the number of shortcuts between city j and city k; and bjk represents the total number of shortcuts between city j and city k.
Closeness centrality indicates a node’s resilience in the network against control by other nodes (Qian and Liu, 2024). The formula is Equation 9:
Where dij represents the shortest spherical distance between city j and city k and N represents the number of network relationships.
The structural feature analysis of the spatial association cluster network describes the inner structural condition of the network and the status of each member of their spatial clusters (Gao and Gao, 2024), which can intuitively show the carbon flow and carbon transfer among various modules in the ACESCN. Based on the iterative correlation convergence method, we divide 16 node cities into four major plates (Lv et al., 2019; Huo et al., 2022). The bidirectional spillover plate both accepts and overflows relationships to other plates, and the proportion of intra-plate relationships is relatively low. The number of external relationships received by the net benefit plate is significantly higher than that of spillover external relations. The number of external relationships received by the net spillover plate is obviously lower than that of the spillover external relations. The number of inbound and outbound relationships in the agent plate is relatively large, while the proportion of internal relationships is relatively low.
Since we select relational data as variables, there is multicollinearity among variables, making it challenging to assess whether interference terms conform to a normal distribution. However, the QAP model operates independently of assumptions regarding normal distribution or independence and can effectively solve the multicollinearity problem between variables (Xu et al., 2022). Therefore, to further elucidate the influencing factors of the evolution of the ACESCN in Shandong Province, this study selects indicators such as geographical proximity (D), agricultural economic development level (G), agricultural production structure (S), agricultural production efficiency (C), scientific and technological level (P), agricultural energy intensity (E), and opening-up degree (O) (Xu and Lin, 2017; Lin and Xu, 2018; Liu et al., 2020; Gao and Gao, 2024), and build the difference matrix of the mean values of influencing indicators in each region during 2010–2022. The QAP model is Equation 10:
The calculation results of ACE in Shandong Province during 2010–2022 are shown in Figures 2, 3. According to the calculation results, spatial visualization is performed.
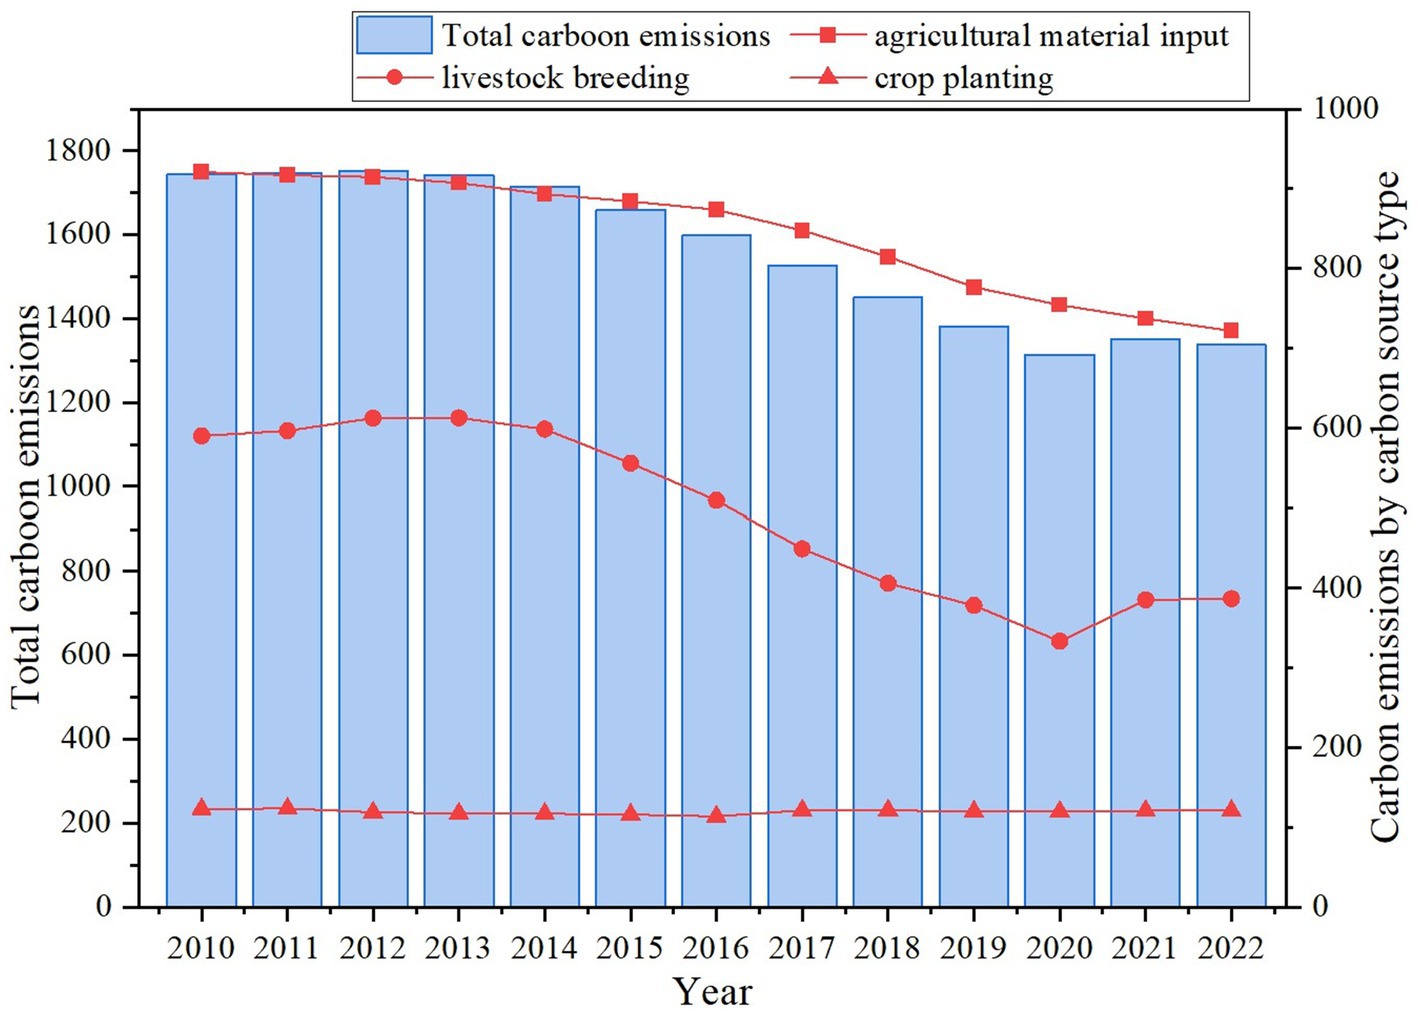
Figure 2. Temporal changes of ACE from 2010 to 2022.
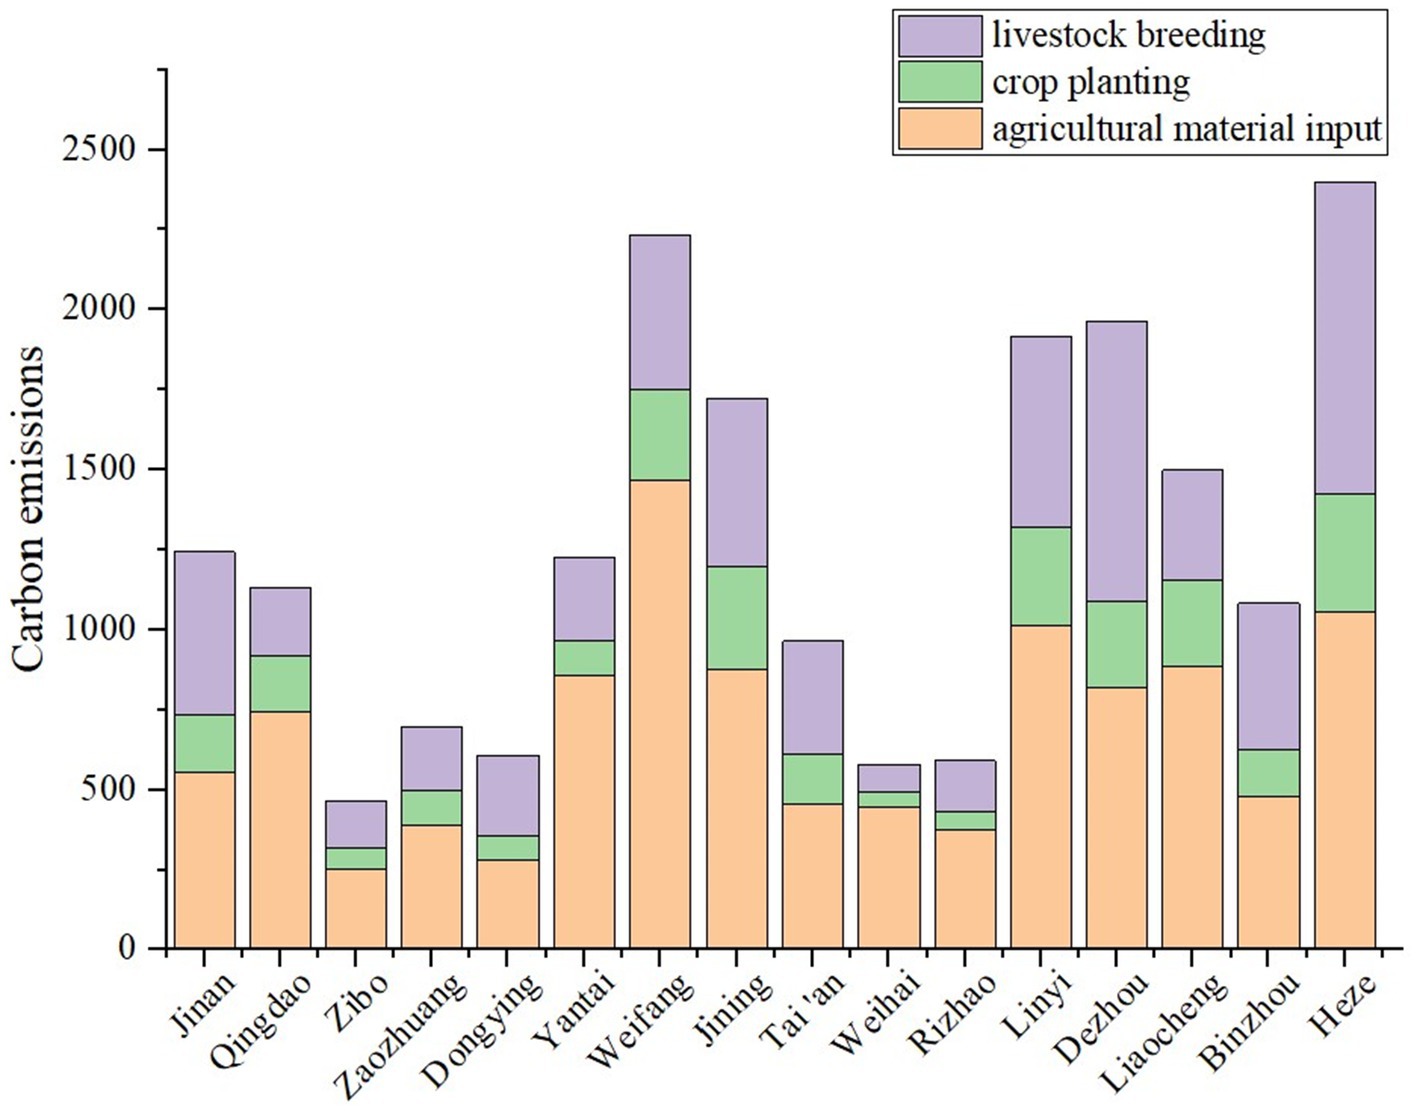
Figure 3. Measurements of ACE across different cities.
From Figure 2, Shandong’s ACE mainly comes from agricultural input, representing more than 50%, followed by livestock breeding and crop planting, accounting for 31.21 and 14.70%, respectively. As a whole, ACE demonstrates a pattern of initial increase followed by a decrease. From 2010 to 2012, carbon emissions exhibit an increasing pattern, from 1,744.99 × 104tons to 1,752.21 × 104tons, with an average yearly growth of 0.14%. With the improvement of agricultural economic levels and social living standards, Shandong Province has an increasing demand for livestock products. The development of the planting industry provides rich feed resources for animal husbandry and promotes the expansion of the scale and density of animal husbandry; the carbon emissions of livestock breeding increased from 589.69 × 10⁴ tons in 2010 to 611.99 × 10⁴ tons in 2012, with an average yearly growth of 1.26%, which is the primary factor contributing to the increase of ACE. From 2012 to 2022, ACE reveals a declining trend, from 1,752.21 × 104 tons in 2012 to 1337.53 × 104 tons in 2022, a decrease of 414.68 × 10⁴ tons, with an average yearly decline of 2.37%. Agricultural input and livestock breeding carbon emissions show a consistent downward trend, which is consistent with the total carbon emissions. It may be because Shandong Province has actively responded to the national low-carbon agricultural development policy in recent years by promoting advanced agricultural production technology and equipment, implementing the national strategy on decreasing fertilizers and pesticide usage while enhancing efficiency, and implementing policies and measures such as utilizing livestock manure and managing straw effectively. Measures such as weight loss and efficiency improvement have reduced the input of agricultural materials and effectively controlled carbon emissions. It shows that Shandong Province has achieved remarkable results in adjusting agricultural production structure and sustainable agriculture and is transforming to green and low-carbon agriculture.
To guarantee the standardization and comparability of Shandong’s ACE at different time scales, the spatial distribution is obtained by dividing the ACE data into four various carbon emission zones (low, medium, higher, and highest carbon emission zones) according to 0.5, 1, and 1.5 times of the average carbon emission in Shandong (Figure 4). From the perspective of the regional structure of the ACE (Figure 3), the variations in agricultural economic level and industrial composition lead to heterogeneity (Liu et al., 2020). Heze has the highest total carbon emissions, reaching 2399.28 × 104 tons, while Zibo was the lowest, reaching 466.02 × 10⁴ tons, only 1/5 of Heze’s. Cities with relatively high carbon emissions from agricultural input and crop planting include Weifang, Heze, Linyi, Liaocheng, Jining, and Dezhou, which belong to higher and highest carbon emission regions, mainly concentrated in western Shandong Province and northwest Shandong Province, where the terrain is flat and the land is fertile, with mainly agricultural production. The large proportion of crop area and high food production make these cities more suitable for agricultural development, resulting in higher carbon emissions. Heze has the highest ACE attributed to livestock breeding, which has the largest scale of livestock breeding, but also brings severe pollution and unsustainable development problems. In contrast, Zibo, Dongying, Weihai, and Rizhao have low ACE and belong to low carbon emission regions, which are mainly focused on the mountains and hills in central Shandong Province and the eastern coastal areas of Jiaodong. These cities have relatively developed industrial development, a small proportion of agriculture, and a single agricultural structure, so ACE is also low. Therefore, to effectively control the total amount of ACE, meanwhile taking into account factors such as natural calamities and the scale development of the planting industry, local governments should devise strategies based on local circumstances and restructure the industry and reduce ACE by reducing the application of pesticides and fertilizers, controlling material input, and improving agricultural utilization efficiency, to achieve a mutually beneficial outcome for regional carbon emissions and sustainable agricultural development.
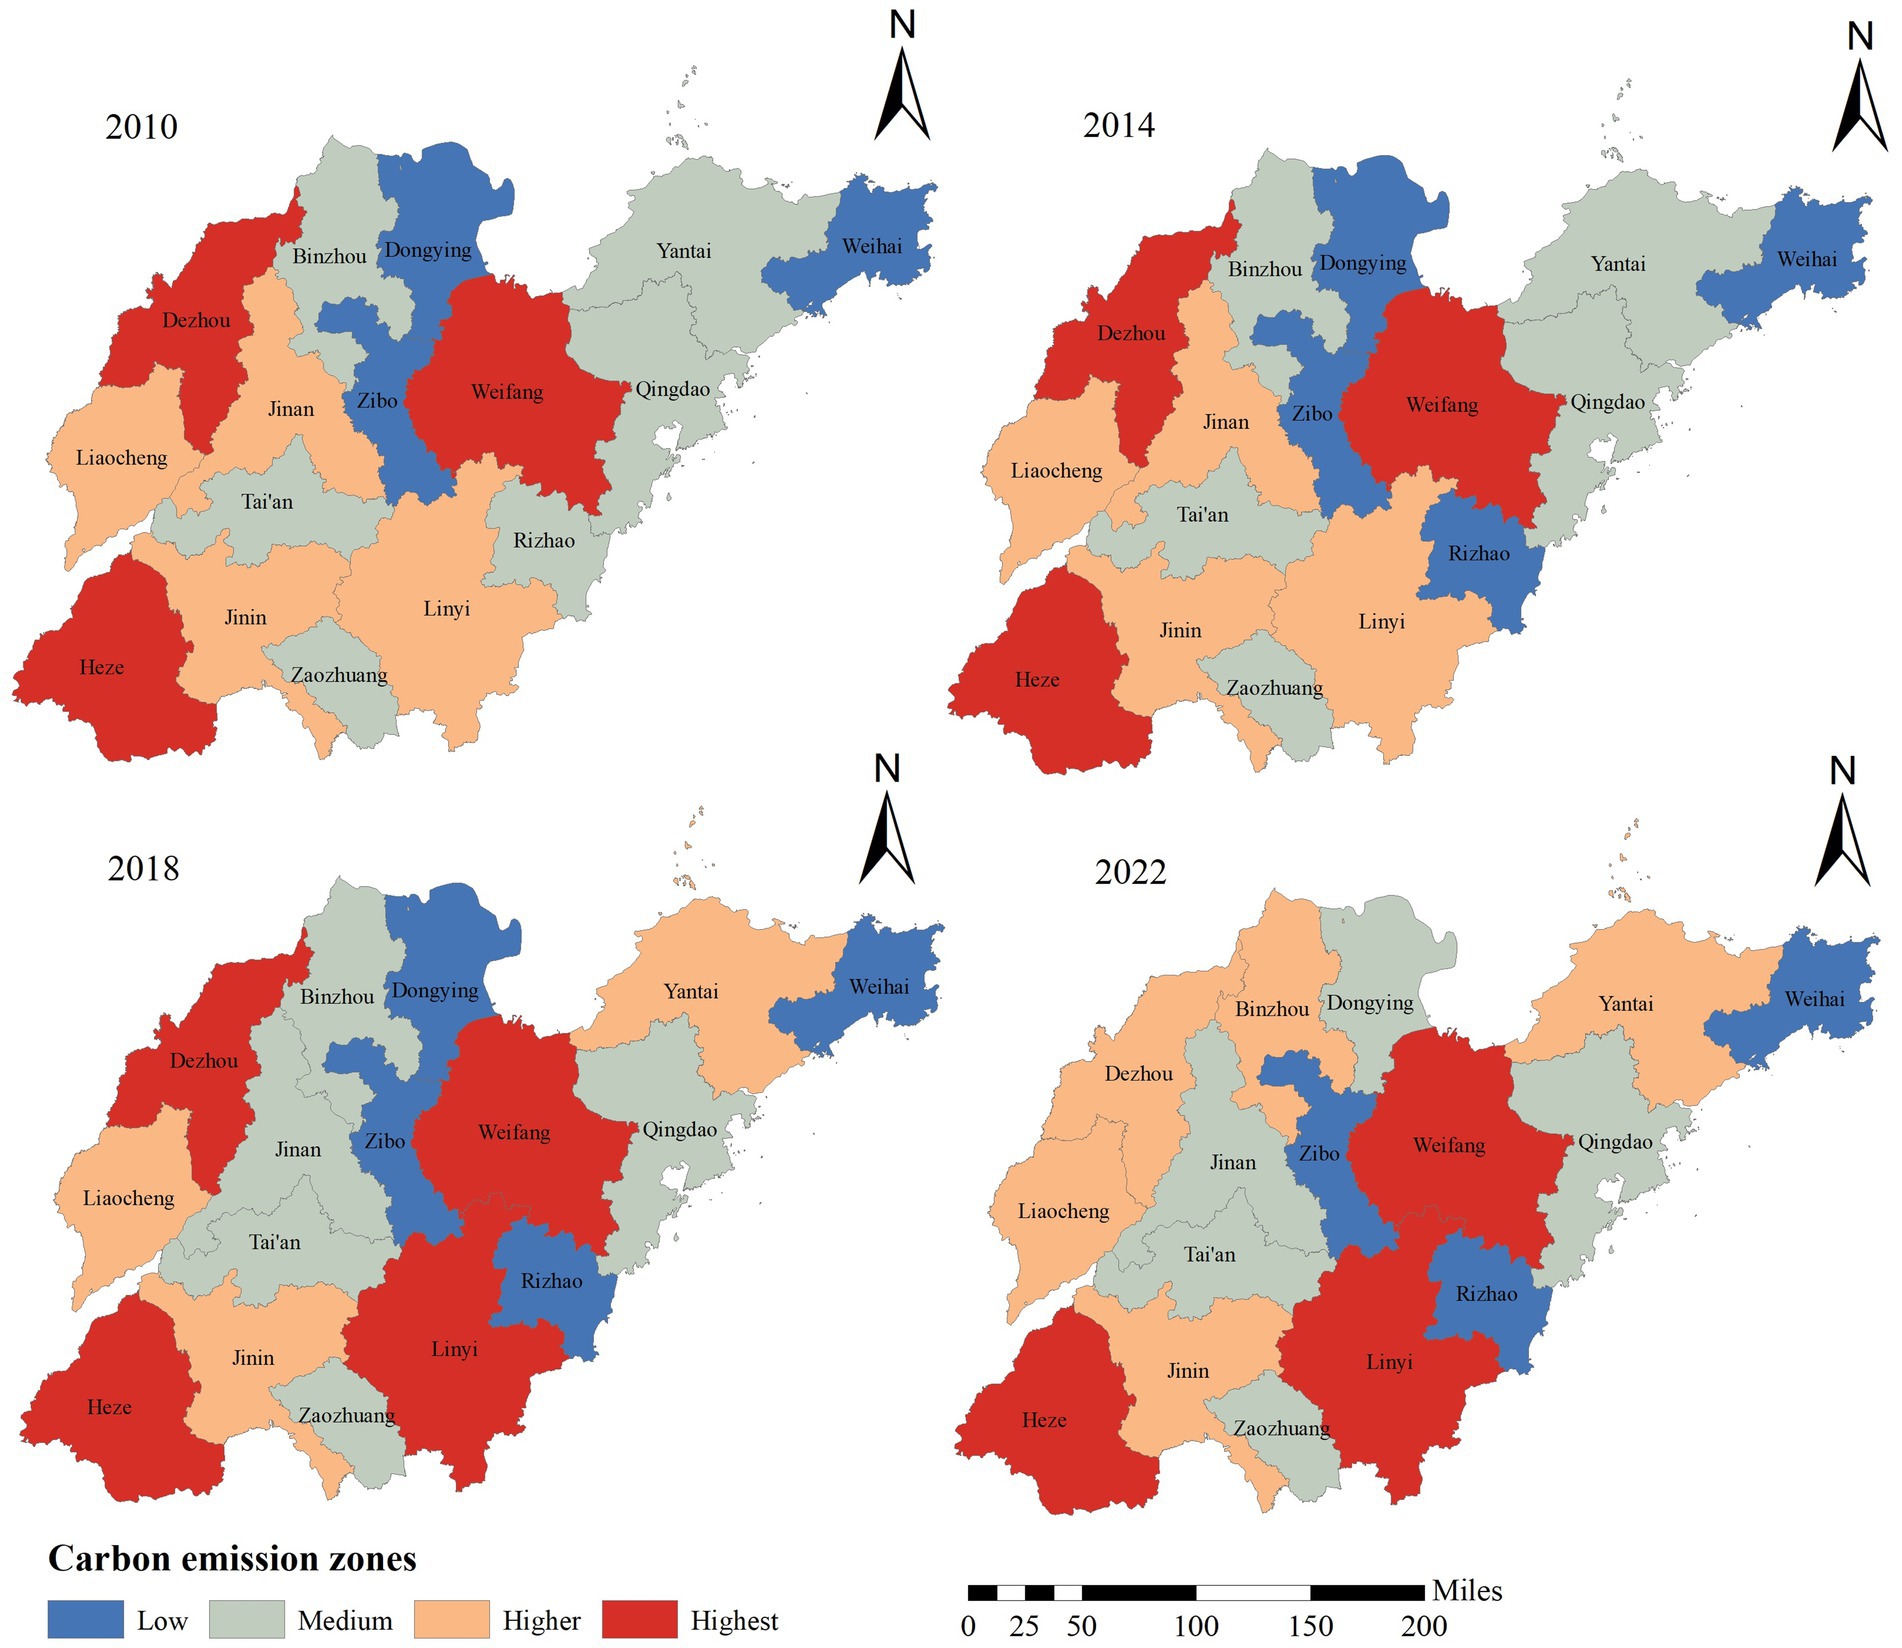
Figure 4. Spatial distribution of ACE in Shandong Province.
After building the modified gravity model, we construct the correlation matrix of Shandong’s ACE from 2010 to 2022 to discuss the spatial correlation, calculate the specific values of the overall characteristics, and draw the network in 2010 and 2022 (Figure 5). The straight line represents the spatial connection between cities, and the square represents each city. It is observable that the ACESCN is relatively stable. Non-neighboring cities break through the traditional geographical space restrictions and produce a cross-regional linkage effect, and gradually form a coil-edge spatial network structure with Weifang, Tai an, and Jinan as the core point, without isolated nodes.
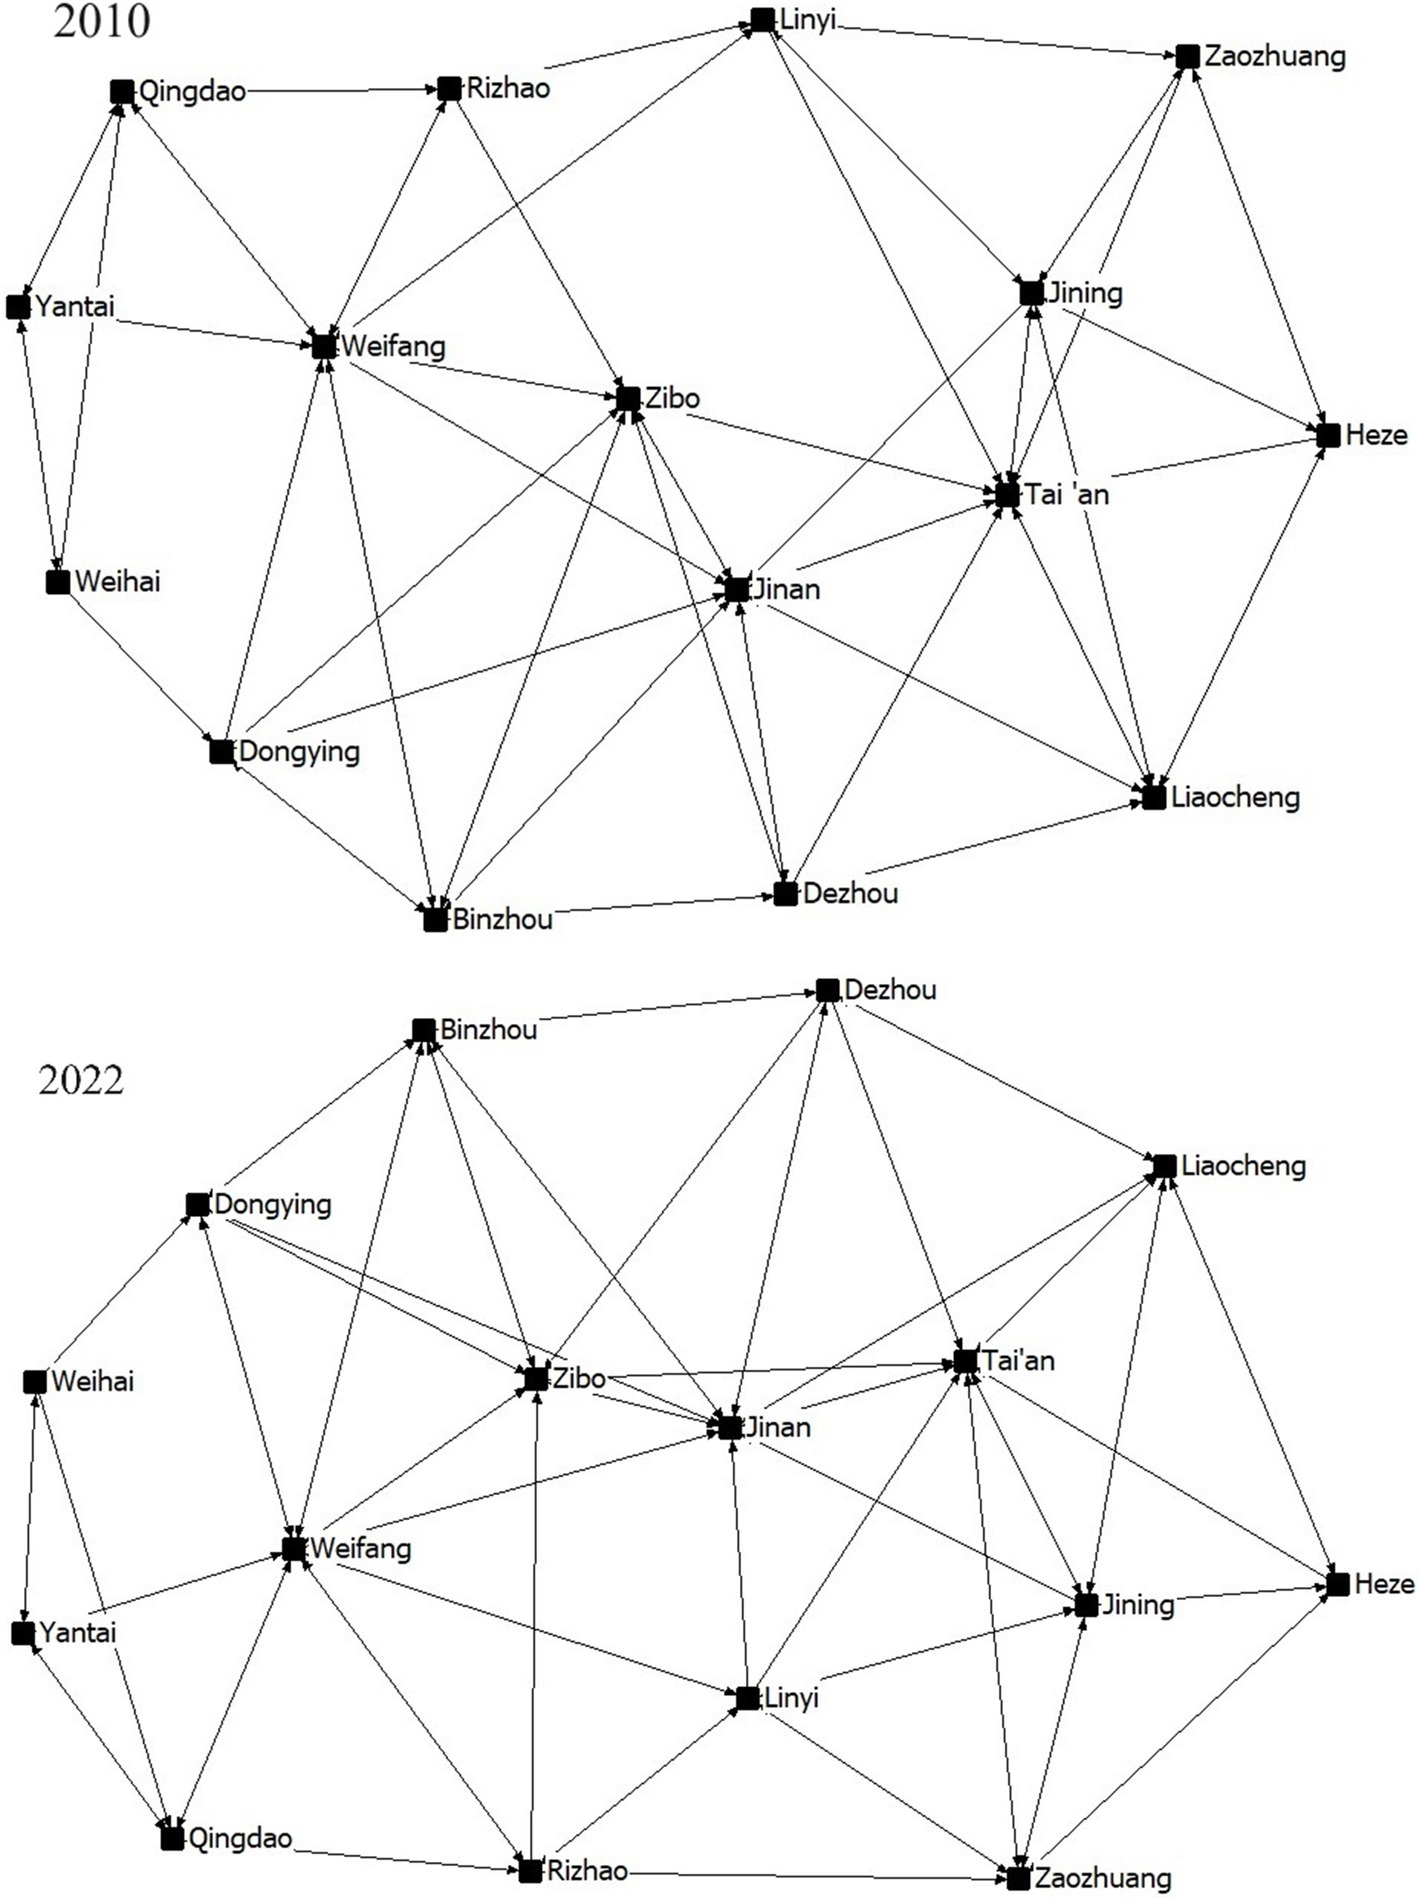
Figure 5. Overall characteristic correlation network structure in 2010 and 2022.
From Figure 6, the network connectedness is always 1 from 2010 to 2022, indicating that Shandong’s ACE has a spatial correlation effect and is robust. All cities and regions have direct or indirect spatial connectivity, without isolated urban nodes. Network density, on the whole, presents a trend of “up-down-up,” increasing from 0.2917 in 2010 to 0.3083 in 2022. Although there are fluctuations, the overall is relatively stable. The fluctuation of the network relationship number is small, and there is a certain gap between it and the maximum possible relationship number 240 (15 × 16). Its change trend is consistent with the network density, showing that the structural correlation of the ACESCN is gradually increasing, but the correlation degree among cities is relatively loose. The network structure requires optimization, and the exchange and connection of agricultural resources among regions need to be strengthened. In 2020, the network density and its relationships reached the maximum, which is because the continuous development of the national economy and transportation, as well as the implementation of regional development strategies, promotes the flow and transfer of agricultural materials such as agricultural science and technology, labor force, and funding, while strengthening the spatial correlation of the ACESCN.
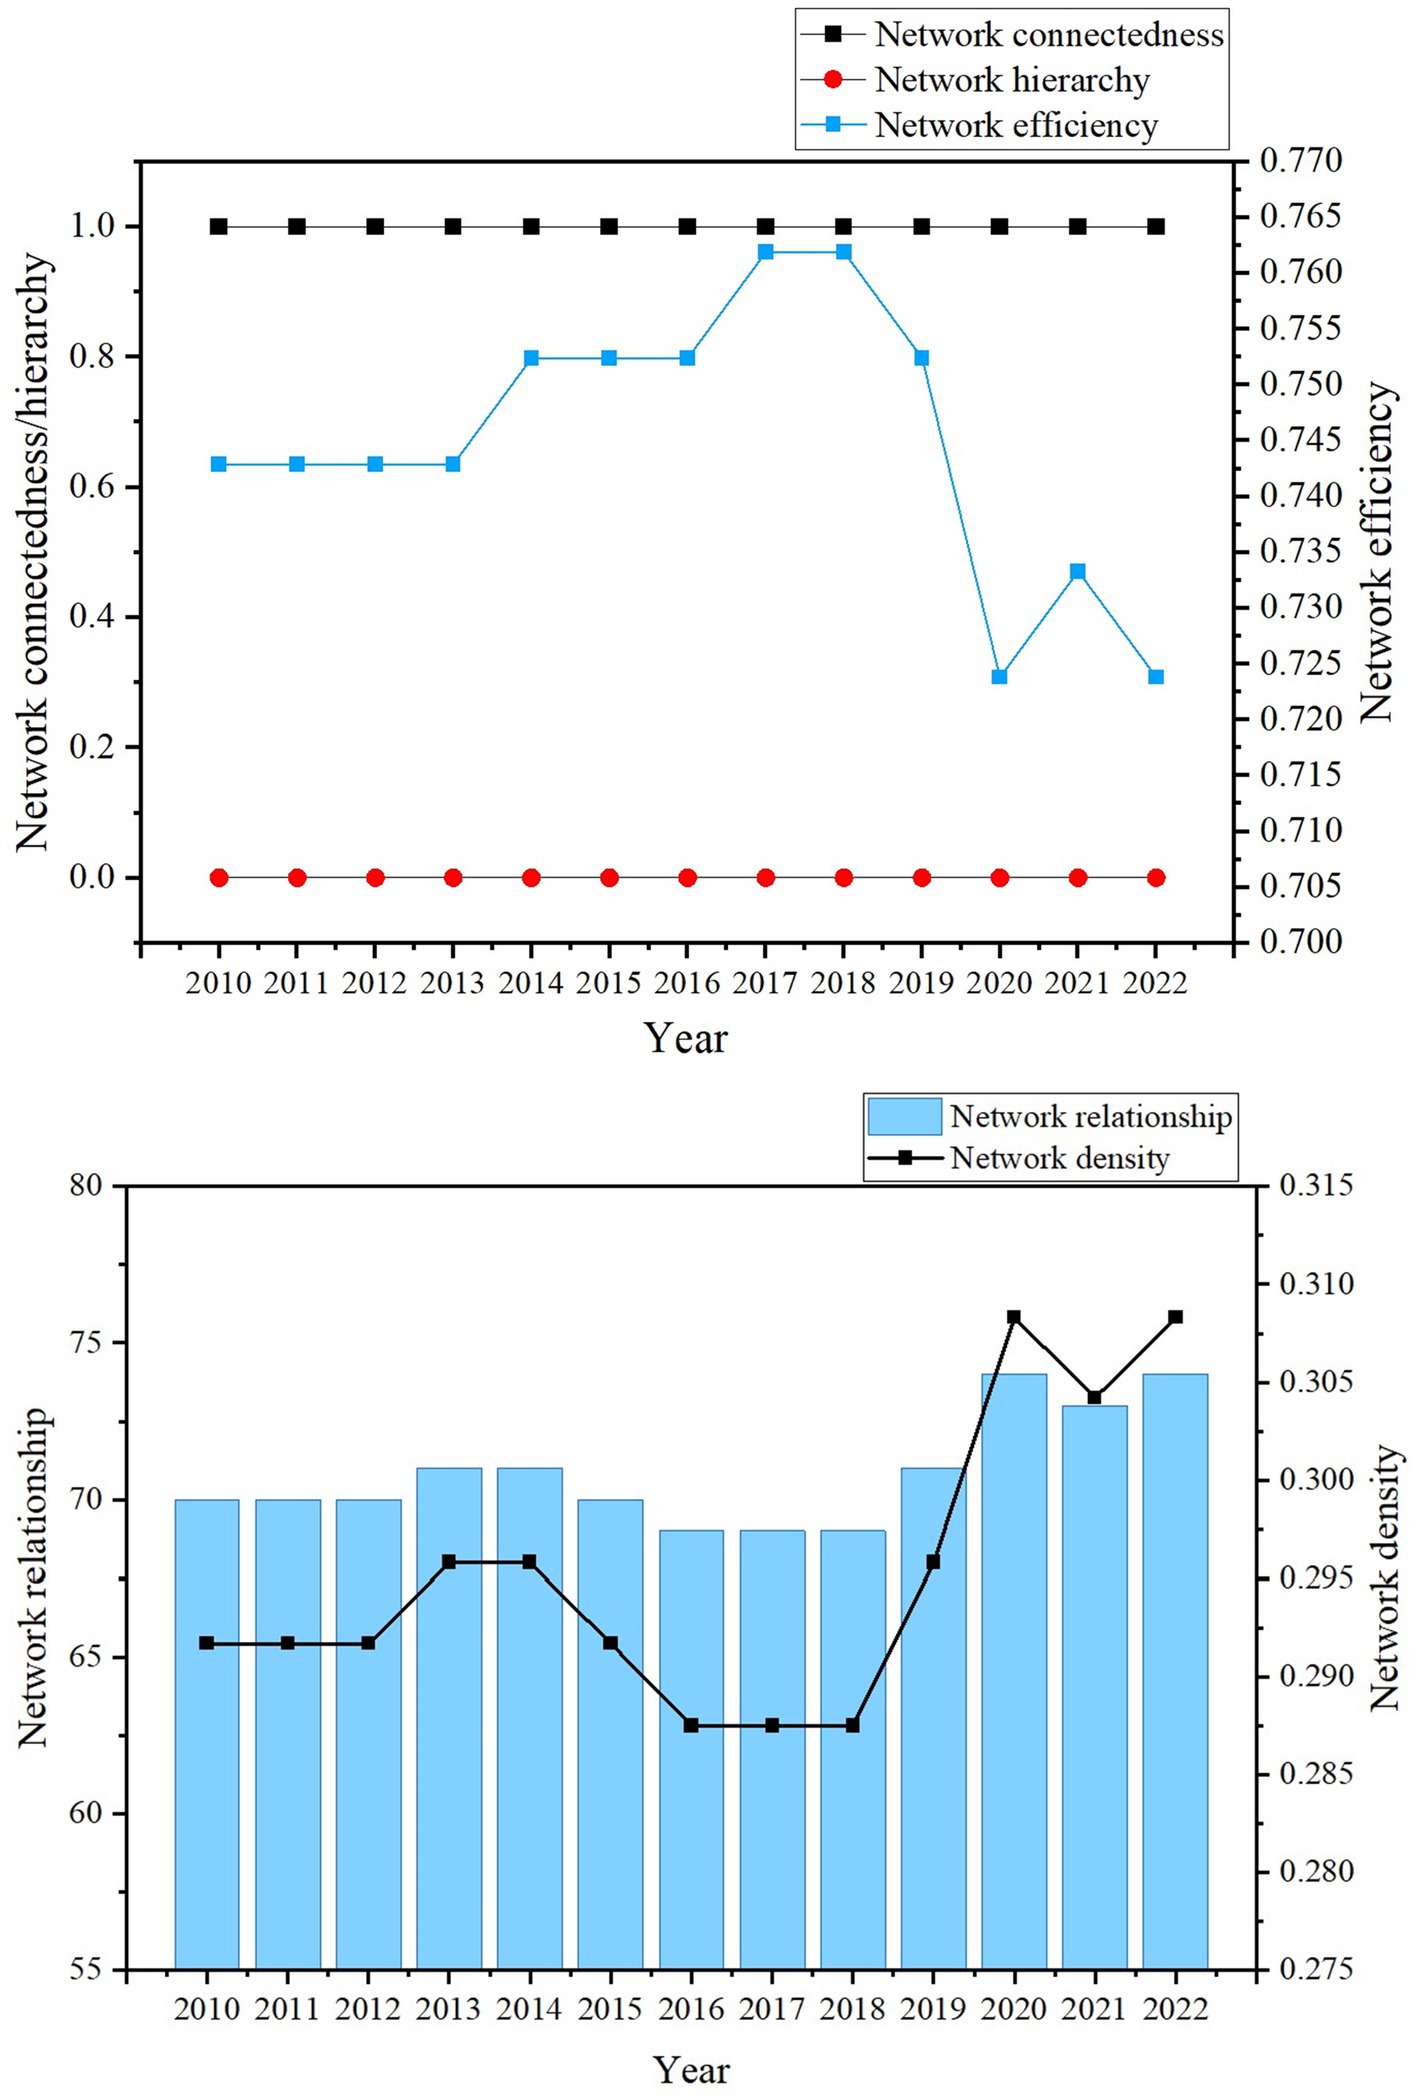
Figure 6. Overall network structure characteristics change trend.
Moreover, the network efficiency decreases from 0.7429 to 0.7238, which reveals that there are additional overflow channels in the related network, the interaction between nodes increases, there is multiple superposition phenomenon, and the ACESCN is gradually steady and its robustness is gradually improved. However, the network hierarchy is consistently at 0 across 2010–2022, which indicates that there is no strict hierarchical structure for the network, no significant hierarchical relation gradient is formed among node cities, the direct difference between different cities was small, and the connection is relatively close. In general, the ACESCN is relatively steady, with common spatial correlation and overflow paths, but high-carbon emission nodes can have a negative impact on the neighboring regional environment through spatial spillover effects, and the increase in network density and the number of relationships may mean that the competition for resources is intensified. Shandong Province should further strengthen the overflow channels of agricultural production factors in the region. Facilitate exchange and sharing of agricultural resources, including technology, labor force, and capital among cities.
This study uses Ucinet to calculate the individual structural indicator of the ACESCN during 2010–2022 and reveal the individual characteristics of the network.
From Figure 7, Tai’an, Weifang, Jinan, Zibo, and Jining are the centers of the ACESCN in Shandong Province, and their degree of centrality is higher than other cities, revealing that these cities have more direct agricultural carbon emission associations with other cities, and act as an important function in shaping and maintaining the robustness of the network. Because these cities are positioned in the central part of Shandong Province, the geographical position is superior, and the geographical distance from other cities is relatively short. They can form a good exchange of agricultural elements with other areas through the transportation network. Among them, Weifang and Jinan are more centrally than other cities. With the accelerated progress of agricultural industry, perfect technology, and superior cultivated land conditions, these cities can quickly produce the siphon effect, attract the input of agricultural development factors from other regions, exert influence on agricultural development in other regions through agricultural technology transfer and other ways, and gradually hold the center in the network. Therefore, promoting agricultural technologies such as precision fertilization or water-saving irrigation in these cities can effectively reduce ACE in the region. However, while promoting agricultural development, attention should also be paid to strengthening the supervision of environmental problems caused by the over-exploitation of resources to realize carbon emission reduction targets. On the contrary, Yantai and Weihai have the lowest degree of centrality. Due to geographical constraints, it is not easy to establish a correlation with ACE in the surrounding areas. They are positioned on the fringe of the network and possess a faint dependence on ACE with other cities, and can reduce ACE by developing local low-carbon agricultural development models.

Figure 7. Degree centrality from 2010 to 2022.
From Figure 8, the closeness centrality to the center of Jinan, Zibo, Dongying, Weifang, Jining, Linyi, and Binzhou during 2010–2022 is above the average values, suggesting that these cities are more likely to be connected with other regions, have a strong ability not to be controlled by other cities, and play an active role in the ACESCN. This is attributed to the advanced agricultural economy and technology in these cities, their superior geographical location, perfect transportation, and good communication channels for agricultural elements, which can quickly generate spatial connections with other areas by exporting labor force or absorbing advanced agricultural technology. As centers of technology diffusion, these cities can take the lead in piloting low-carbon agricultural policies and driving carbon reduction in their surrounding areas by exporting advanced agricultural technology. On the contrary, the proximity of Qingdao, Yantai, Weihai, and Heze to the center is relatively low. Due to their location at the edge of Shandong, the ability to establish spatial connections with other cities for carbon emissions is limited, and it is difficult to obtain advanced agricultural technology and funds from other cities, which reduces their influence in the spatial network.
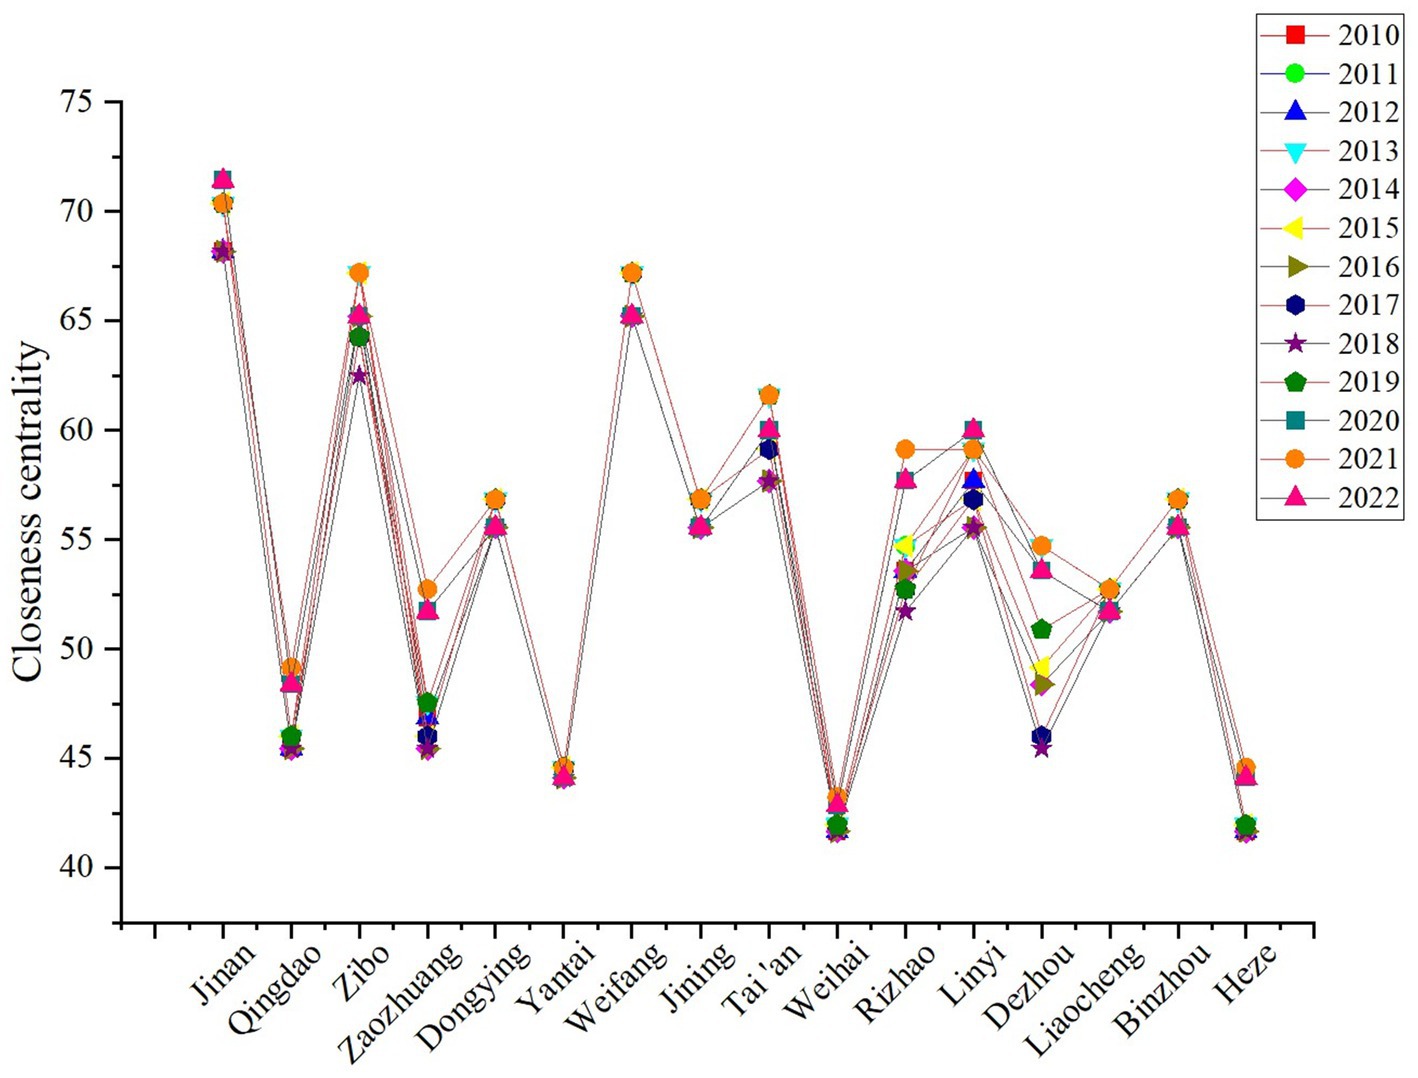
Figure 8. Closeness centrality from 2010 to 2022.
From Figure 9, the betweenness centrality of six cities, namely Jinan, Zibo, Dongying, Weifang, Tai’an, and Linyi, is above the average values during 2010–2022, suggesting that these cities can effectively control the movement of agricultural production factors in the agricultural correlation network and hold an important position in regulating and controlling carbon emissions in other regions. It serves as the most important bridge in the ACESCN. Among them, Jinan and Weifang have the highest degree of intermediary center, which may be due to the rapid progress in agricultural development in the two cities, which affects agricultural development in other regions by exporting capital and technology to other cities. As key nodes in the network, these cities can ensure the fairness and feasibility of carbon reduction policies and actions across the province through coordinated interregional resource allocation and technology transfer. On the contrary, the betweenness centrality of Yantai, Weihai, and Heze is only between 0 and 1 and maintained at a minimal level, suggesting that the spatial correlation with other cities is not close, and they are in a dominant position in the ACESCN, with limited ability to control the spatial network, so making it challenging to impact the spatial correlation of ACE among cities. The betweenness centrality in Zaozhuang, Rizhao, and Liaocheng continues to increase, suggesting that the impact continues to strengthen.

Figure 9. Betweenness centrality from 2010 to 2022.
To further reveal the internal structural features of the ACESCN in Shandong Province, we use the CONCOR algorithm to explore the clustering features of the network. The cutting depth was set to 2, the convergence criteria to 0.2, and 16 cities in Shandong Province were divided into four plates. From Table 4, on the whole, the network comprises 39 relationships inside, which constitute 52.7% of the total number of relationships (74), while 35 relationships are outside the sector, representing 47.3%. This distribution indicates the presence of spatial spillover and spatial agglomeration effects in the ACESCN in various cities in Shandong Province.
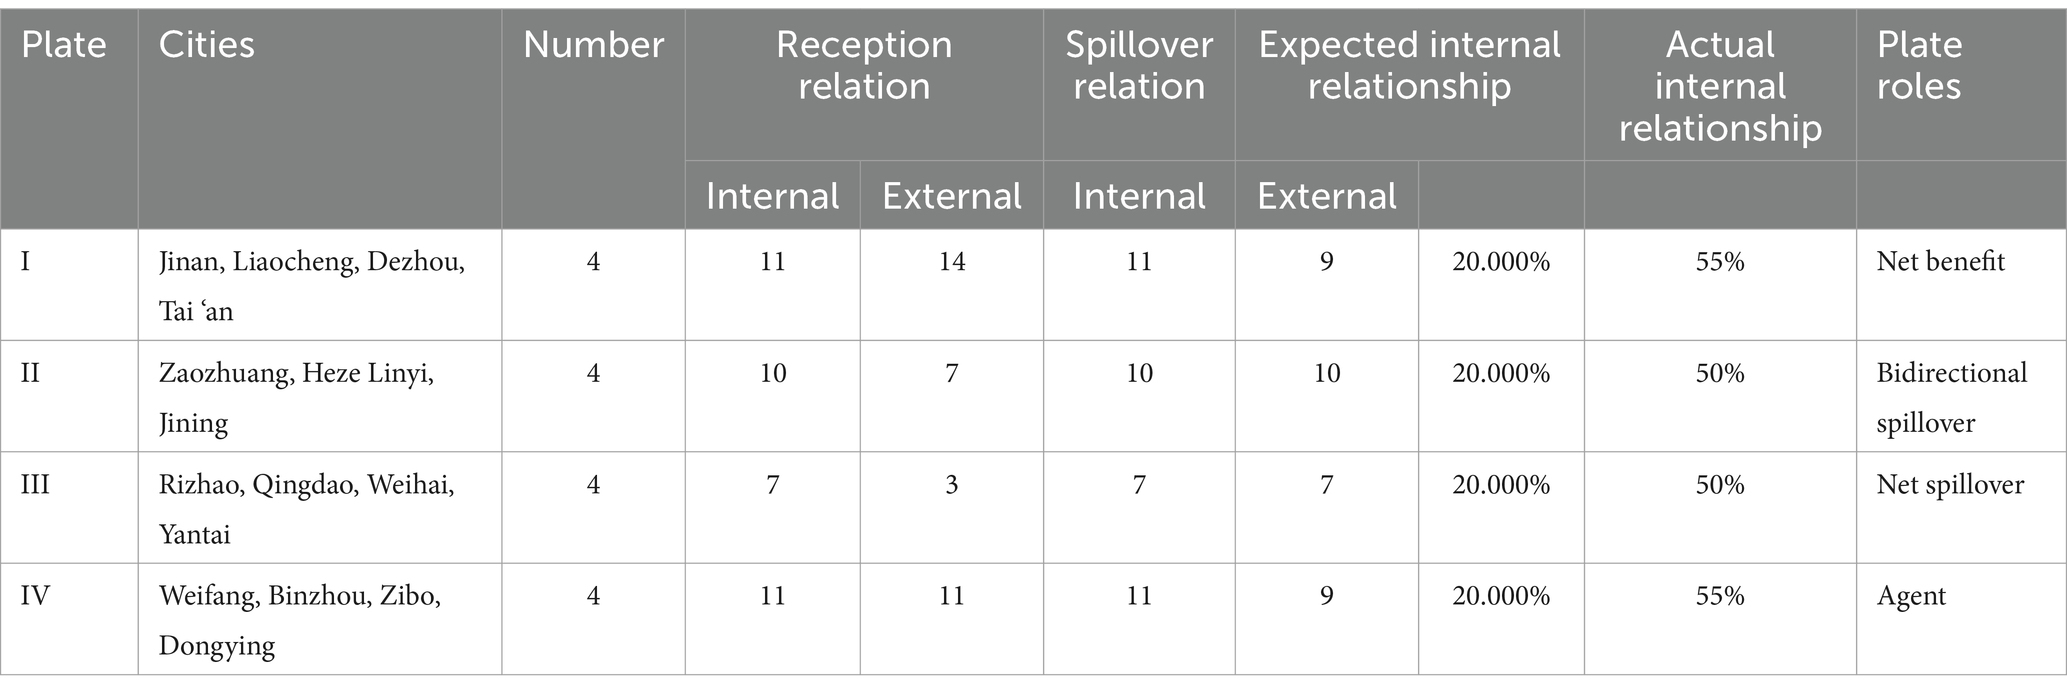
Table 4. Division and characteristics of ACESCN in Shandong Province in 2022.
From Table 4, Plate I includes Jinan, Liaocheng, Dezhou, and Tai’an. The plate contains 11 relationships. There are 14 receiving relations external to the plate and nine spillover relations. The relations received from the external plate exceed those that spillover, the actual ratio of internal relations surpasses the expected ratio, which is the net benefiting plate. The city of this plate is situated in the economic circle of the provincial capital, and its geographical position is superior. They can influence agriculture in other areas through agricultural technology transfer and other ways, hold a central position within the network, and mainly enjoy the input of urban agricultural resources from other plates.
Plate II includes Zaozhuang, Jining, Linyi, and Heze; the intra-plate relationship number is 10, the out-of-plate receiving relationship is 7, and the spillover relationship is 10, which has a significant spillover relationship to both inside and outside, has more connections with intra-plate relationship number, and belongs to the bidirectional spillover plate. These cities are located within the south of the Shandong Economic Circle, with a high level of domestic agricultural economy, abundant agricultural production resources, and a good spatial correlation effect within the block. They not only meet the carbon emission supply within the plate but also provide agricultural carbon emission materials for other cities, maintain close relations with other plates, and occupy a leading position in the spatial network. The ACE in this plate is large, and it is easy to spill over to other cities. Therefore, inter-regional technical cooperation and policy linkage should be strengthened.
Plate III includes Rizhao, Qingdao, Weihai, and Yantai; the intra-plate relationship number is 7, the external plate reception relation is 3, and the spillover relation is 7. The external spillover relation is significantly higher than the internal and external reception relationship number, indicating that the cities in this plate have an obvious carbon spillover effect, which is the net spillover plate. Because their geographical location limits their ability to create spatial connections, resulting in the outflow of resources such as agricultural technology and market. These cities within this plate are mostly coastal cities with relatively backward agricultural development. With fisheries as the main industry, the agricultural development potential is limited. Emission reduction models suitable for local conditions, such as eco-fisheries, should be explored, while cooperation with core cities should be strengthened to obtain more technical support and financial input.
Plate IV includes Weifang, Zibo, Dongying, and Binzhou. There are 11 receiving relationships outside the plate and nine spillover relationships. It is closely connected with members internal and external the plate, which belongs to the agent plate. The urban area in this plate is located in a superior position, connecting the movement of agricultural resources in southwest Shandong and eastern Shandong. It is a link to promote the connection of agricultural resources in Shandong Province, responsible for transferring technology and labor, and acting as an agent and bridge within the network. It can balance the position of each city in the network by strengthening the optimal allocation of resources between regions.
To further explore the spatial relation between plates, we analyze the network by calculating its density matrix and image matrix (Table 5 and Figure 10). Taking the overall network density of 0.3083 in 2022 as the fiducial value, the image matrix in 2022 is assigned 1 if the inter-plate density exceeds this value and 0 if it is not. The matrix provides a more direct representation of the spillover effect between different plates. From Table 5 and Figure 10, it is evident that all diagonal elements of the matrix are 1, revealing notable spatial correlations within the four plates. Plate IV receives the spillover effects spatially transmitted from Plate III and transmits them to plate I, indicating that plate IV acts as a bridge in the network. The spatial spillover effects from plate I mainly affect plate IV and also receive the spatial spillover effects from plate II and Plate IV, showing that the regions with richer agricultural production and resources are more likely to receive agricultural production factor inputs from other regions. However, plate I and plate II exhibit no correlation, indicating that the relation between the network needs to be improved.

Table 5. Density matrix and image matrix.

Figure 10. Correlation of the four plates of the ACESCN in 2022.
Correlation among affecting factors is assessed based on 5,000 random permutations. From Table 6, the correlation coefficient between spatial adjacency and spatial correlation degree is significantly positive at a 1% significance level, suggesting that D shows a significant positive correlation with the ACESCN. G, O, and P are significantly negative at the 1% level, S is significantly negative at the 5% level, and agricultural production efficiency shows a significant negative correlation at the 10% level, suggesting a negative correlation between G, O, S, and P and spatial correlation. The aforementioned factors significantly influence the formation and spatial spillover of ACE. However, E has no significance, suggesting that it has no significant effect on spatial association.
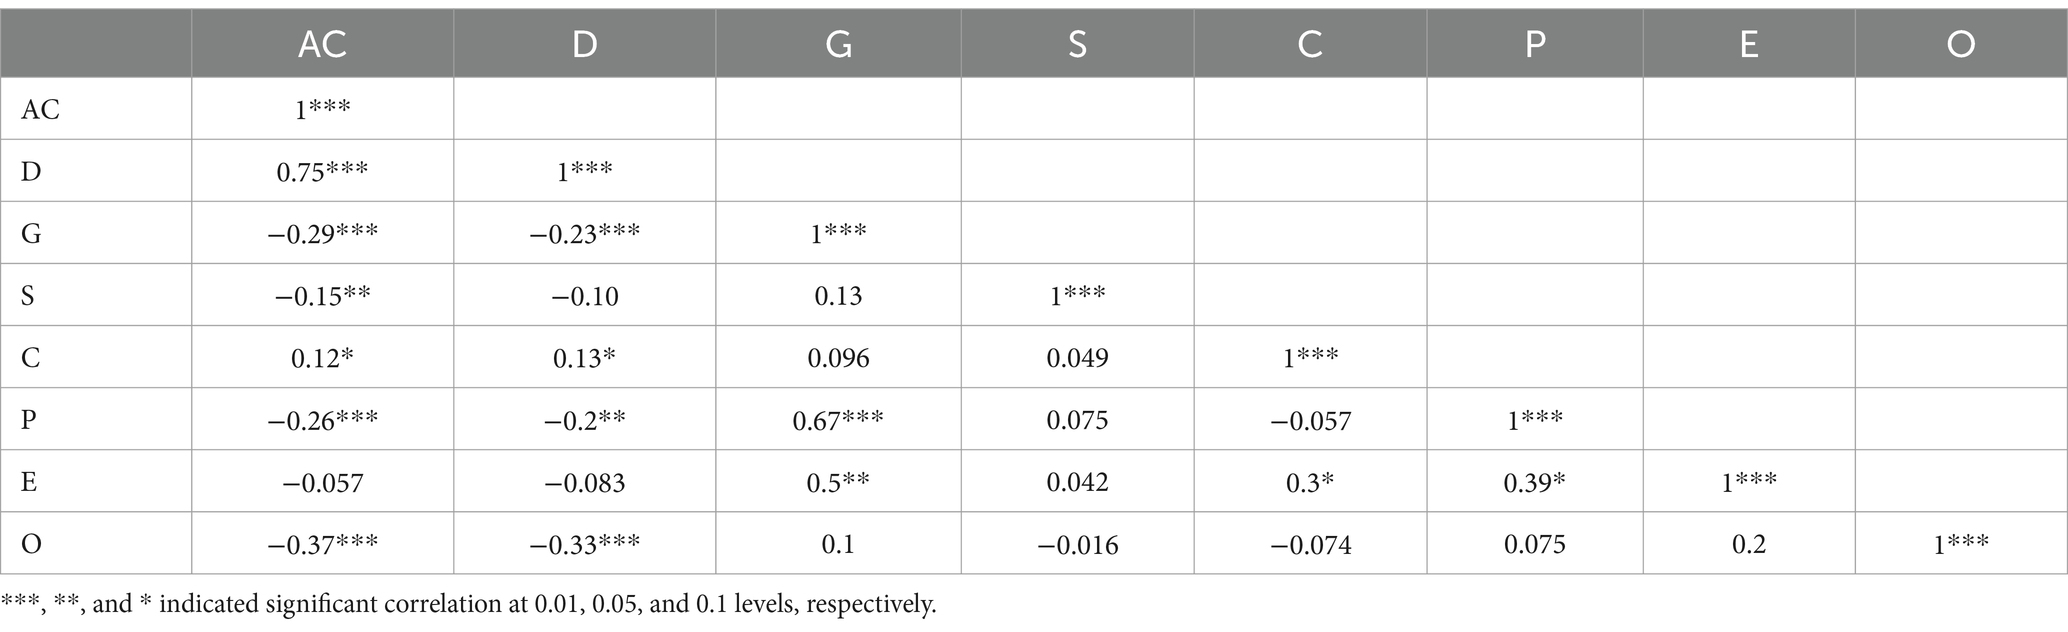
Table 6. Correlation analysis among influencing factors.
From the perspective of the correlation coefficient, D is most closely related to the formation of the ACESCN in Shandong Province, and its correlation coefficient value is 0.75, followed by O, G, and P, whose correlation coefficients are 0.37, 0.29, and 0.26, respectively. The more similar the level of opening up, economic development, and science and technology of different cities in Shandong Province, the more similar it is and the stronger the link between agricultural carbon emissions. In addition, by verifying the correlation between the seven explanatory variables, it is found that G and P, G and E, C and E, P and E, D and G, and D and P variables are all significantly correlated, so we employ QAP regression to eliminate the influence of multicollinearity.
QAP regression analysis is a non-parametric method used to analyze the regression relationship between a matrix of dependent variables and multiple matrices of independent variables (Bai et al., 2020). From the QAP correlation, this study excludes E that has no significance and obtains the regression analysis results affecting the spatial correlation by setting 5,000 random column and column substitutions (Table 7). Findings reveal that the adjusted R2 is 0.595 and passes the 1% significance level. The selected affecting factors can explain 59.5% of the structural changes in the network.

Table 7. Result of QAP regression analysis.
From Table 7, the regression coefficient of D shows a positive effect at the 1% significance level, revealing that spatial proximity significantly promotes the formation of the network. From the first law of geography, closer geographical distances between cities facilitate the easier formation of spatial correlation (Li et al., 2007), which is attributed to convenient transport in neighboring areas and the frequent transfer and flow of agricultural factors. The spatial spillover influence is also obvious, with a closer spatial correlation. However, regions with high carbon emissions may transfer pollution to surrounding areas through geographical proximity, leading to spatial transfer of environmental problems. At the same time, the diffusion of technology is limited to the neighboring regions, and the regions far from the technology center are difficult to benefit from, and the inequality between regions is exacerbated.
The regression coefficient of G shows a negative effect at the 10% significance level, revealing that smaller disparities in the agricultural economy among cities are more favorable for forming the network. ACESCN has obvious spatial agglomeration characteristics in Shandong Province. Regions with better economic development will absorb agricultural products, labor, and other resources in neighboring areas, gradually narrowing the economic distance and strengthening the correlation between regions. Moreover, as the strategy of regional coordinated development deepens, regions with close agricultural economic development are also similar in terms of agricultural technology and demand, leading to more frequent exchanges of agricultural materials such as workforce and capital among regions with similar economic development. However, when the economically developed areas siphon the resources of the surrounding areas, it will lead to the concentration of resources in a few areas and aggravate the inequality between regions.
The regression coefficient of S shows a negative effect at the 10% significance level, revealing that the more similar the structure of the agricultural industry of different cities is, the more it can promote the establishment of ACESCN in Shandong Province. The narrowing of industrial structure differences between regions makes agricultural production and development gradually similar among regions, and the agricultural products and factors required are the same. Therefore, the exchange and circulation of factors between regions are increased, thus forming the agglomeration of regional industries, gradually strengthening the agriculture correlation, and realizing the circulation of factors across regions. However, regions with backward or diverse industrial structures may be further marginalized.
The regression coefficient of O shows a negative effect at the 1% significance level, revealing that smaller differences in the opening-up degree lead to closer ACESCN. The narrowing of the gap in the opening-up degree can make the circulation of agricultural industry factors cluster, facilitating the promotion of regional agricultural industry and further strengthening the accessibility of related networks. The opening-up degree reflects that to realize rapid economic development at the regional level, and due to the lack of agricultural infrastructure in Shandong Province, agricultural production is restricted. With the continuous increase of total import and export investment, the economic distance between regions is gradually narrowed, and the spatial correlation is strengthened by increasing the construction of agricultural infrastructure and fixed assets investment to promote the growth of rural residents’ income and economy (Liu et al., 2020).
The difference of C and P had no significant effect on the ACESCN in Shandong Province.
As agricultural carbon reduction is a crucial aspect of achieving carbon neutrality targets, this study explores the ACESCN and clustering characteristics in Shandong Province by using SNA and examines the influence factors through QAP analysis after the calculations of ACE in Shandong during 2010–2022. Here are the main conclusions: (1) ACE in Shandong Province exhibits a trend of initially increasing and then decreasing during 2010–2022, among which the agricultural material input carbon emissions are the largest, followed by livestock farming. From the regional perspective, the spatial difference is obvious. Regions with high ACE are predominantly clustered in areas with extensive crop planting, and the level of sustainable development in various regions is increasingly evident. (2) From the overall network characteristics, the ACESCN in Shandong Province exhibits a notable spatial spillover effect and gradually forms a spatial network structure with Weifang, Tai’an, and Jinan as the core points, and there is no isolated region in the network. There is a noticeable upward trend in both network density and network relationships, and the changing trend of network efficiency and hierarchy reveals that the resilience of relational networks is gradually improved without forming a significant hierarchical structure. (3) From the perspective of individual network characteristics, Jinan, Weifang, Tai’an, and Zibo are in a leading position in the network, while Weihai, Yantai, and Heze are in an edge position in the network because of geographical constraints, and have a weak dependence on agricultural carbon emission of surrounding cities. (4) From the spatial clustering characteristics, the ACESCN has obvious spatial agglomeration characteristics and is divided into four major plates: Net benefit plate (Jinan, Liaocheng, Dezhou, and Tai’an), bidirectional spillover plate (Zaozhuang, Jining, Linyi, and Heze), net spillover plate (Rizhao, Qingdao, Weihai, and Yantai), and agent plate (Weifang, Zibo, Dongying, and Binzhou). Among them, the net benefit plate is primarily clustered in central and western Shandong Province, enjoying the input of urban agricultural resources; the net spillover plate is concentrated in the coastal cities with slow agricultural economic development and remote geographical locations; and the agent plate acts as a bridge in the network. (5) According to the results of the QAP analysis, spatial proximity has a positive impact on the ACESCN, while economic level, industrial structure, and the opening-up degree have a negative effect on the spatial correlation.
Although this study has made valuable discoveries, there are still some limitations. First, this study focuses on Shandong Province, and its conclusions may not be universal. Future studies can be extended to regions with different agricultural structures, socio-economic conditions, or policies. Second, the statistical data comes from the official website of the Bureau of Statistics, and the missing data are processed by interpolation, but there may be a problem of lagging updates of the statistical data. In addition, due to the availability of data, the measurement of agricultural carbon emissions in this study was carried out only in cities with fewer network nodes. In future, agricultural carbon emissions at the district and county levels can be measured to expand the scale of the network. Finally, we use QAP to analyze the influencing factors of the spatial correlation network of carbon emissions, but only the external factors are analyzed. In future, the internal mechanism of the formation and evolution of the network can be revealed based on the exponential random graph model.
Based on the conclusion of this study, this study proposes the following policy recommendations:
Make full use of spatial correlation, optimize and adjust network structure, and strengthen network connectivity. First of all, the provincial government will set up a cross-regional agricultural technology transfer center, take advantage of the geographical location and economic advantages of core cities such as Jinan and Tai’an, play the role of Weifang, Zibo, and other cities as “Bridges,” optimize resource allocation, promote the transfer of low-carbon agricultural technology to Yantai, Weihai, and other marginal cities, improve the agricultural technology level in the surrounding areas, and reduce the excessive use of chemical fertilizers and pesticides. In addition, it is necessary to strengthen the construction of transportation and logistics network, optimize the regional transportation network of core cities and peripheral cities, set up regional logistics hubs, the distribution of complex agricultural materials, promote economic cooperation and exchanges between different regions, and the cross-regional flow of agricultural factors.
Establish a cross-regional agricultural cooperation mechanism to form a reasonable agricultural industry agglomeration structure, and thus achieve regional collaborative emission reduction. First of all, provincial governments should formulate inter-regional agricultural carbon reduction cooperation agreements, clarify the roles of different cities in cooperation agreements, and promote inter-regional cooperation through the development of reward and punishment measures and agreement coordination mechanisms. Second, according to the agricultural production structure and economic development level of each region, the development plan of agricultural industrial clusters is formulated, such as developing efficient agriculture and green agriculture in high-carbon emission areas such as Weifang and Heze, building low-carbon agriculture demonstration zones, developing ecological fisheries in coastal cities such as Weihai, Yantai, Qingdao, and Rizhao, formulating differentiated emission reduction policies, guiding enterprises to concentrate in industrial cluster areas through specific policies, optimizing resource allocation, and avoiding “one-size-fits-all” carbon reduction. Achieve equitable emission reduction among regions. Finally, a special fund should be set up to support the promotion of agricultural innovation, as well as agricultural carbon reduction subsidy policies to encourage farmers or enterprises to adopt low-carbon agricultural technologies.
Give full play to different factors. First of all, we should narrow the difference in economic level, increase financial support for areas with less developed resources, promote agricultural modernization and the application of green technology, encourage economically developed areas to export capital, technology, and management experience to neighboring areas, and promote resource sharing among regions. Second, we should optimize the industrial structure, promote the coordinated development of the primary, secondary, and tertiary industries in rural areas, and develop new business forms, such as agricultural product processing and rural tourism. The government should increase financial subsidies to areas with backward industrial structure and help them promote low-carbon agricultural technologies through technical training and demonstration projects. Finally, the level of opening to the outside world should be improved, investment in agricultural infrastructure should be increased, agricultural enterprises in Shandong Province should be promoted to carry out agricultural cooperation with other countries, international brands should be built for Shandong’s characteristic agricultural products, and international markets should be expanded through cross-border e-commerce platforms.
The original contributions presented in the study are included in the article/supplementary material, further inquiries can be directed to the corresponding author/s.
MS: Conceptualization, Data curation, Investigation, Methodology, Visualization, Writing – original draft, Writing – review & editing. MJ: Funding acquisition, Resources, Validation, Writing – review & editing. FJ: Methodology, Project administration, Software, Writing – review & editing. YL: Investigation, Supervision, Writing – review & editing. ZF: Data curation, Software, Writing – review & editing. HJ: Formal analysis, Investigation, Writing – review & editing.
The author(s) declare that financial support was received for the research and/or publication of this article. This work was supported by the Natural Science Foundation of Shandong Province (grant number SKDZK20230363); and the National Key R&D Program (grant number SKDZK20230125).
Thanks to the editors and referees who helped the researchers to revise the final version of the manuscript.
ZF was employed by the Ordos Yingpanhao Coal Co., Ltd.
The remaining authors declare that the research was conducted in the absence of any commercial or financial relationships that could be construed as a potential conflict of interest.
The authors declare that no Generative AI was used in the creation of this manuscript.
All claims expressed in this article are solely those of the authors and do not necessarily represent those of their affiliated organizations, or those of the publisher, the editors and the reviewers. Any product that may be evaluated in this article, or claim that may be made by its manufacturer, is not guaranteed or endorsed by the publisher.
Abdul, R., Mahtab, A. M., Rafael, A., Cem, I., Fayyaz, A., Mariana, C. L., et al. (2022). Carbonization and agricultural productivity in Bhutan: investigating the impact of crops production, fertilizer usage, and employment on CO2 emissions. J. Clean. Prod. 375:134178. doi: 10.1016/J.JCLEPRO.2022.134178
Agyeman-Richard, Y. K., Huo, F., Li, Z., Li, Y., Mohamed, E. E., and Hwang, Y. (2023). Impact of climate change under the RCP8.5 emission scenario on multivariable agroclimatic indices in Western Canada from convection-permitting climate simulation. Anthropocene 44:100408. doi: 10.1016/J.ANCENE.2023.100408
Ali, R., Bakhsh, K., and Yasin, M. A. (2019). Impact of urbanization on CO2 emissions in emerging economy: evidence from Pakistan. Sustain. Cities Soc. 48:101553. doi: 10.1016/j.scs.2019.101553
Bai, C., Zhou, L., Xia, M., and Feng, C. (2020). Analysis of the spatial association network structure of China's transportation carbon emissions and its driving factors. J. Environ. Manag. 253:109765. doi: 10.1016/j.jenvman.2019.109765
Cheng, H., Wu, B., and Jiang, X. (2024). Study on the spatial network structure of energy carbon emission efficiency and its driving factors in Chinese cities. Appl. Energy 371:123689. doi: 10.1016/J.APENERGY.2024.123689
Dar, A. A., Chen, Z., Rodríguez, S. R., Haghighat, F., and Rosales, B. G. (2024). Assessing greenhouse gas emissions in Cuban agricultural soils: implications for climate change and rice (Oryza sativa L.) production. J. Environ. Manag. 353:120088. doi: 10.1016/J.JENVMAN.2024.120088
Das, S., Kim, P. J., Nie, M., and Chabbi, A. (2024). Soil organic matter in the anthropocene: role in climate change mitigation, carbon sequestration, and food security. Agric. Ecosyst. Environ. 375:109180. doi: 10.1016/J.AGEE.2024.109180
Dauda, L., Long, X., Mensah, N. C., Salman, M., Boamah, B. K., Ampon-Wireko, S., et al. (2021). Innovation, trade openness and CO2 emissions in selected countries in Africa. J. Clean. Prod. 281:125143. doi: 10.1016/j.jclepro.2020.125143
Du, R., He, T., Khan, A., and Zhao, M. (2024). Carbon emissions changes of animal husbandry in China: trends, attributions, and solutions: a spatial shift-share analysis. Sci. Total Environ. 929:172490. doi: 10.1016/J.SCITOTENV.2024.172490
Duan, H., Zhang, Y., Zhao, J., and Bian, X. (2011). Carbon footprint analysis of farmland ecosystem in China. J. Soil Water Conserv. 25, 203–208. doi: 10.13870/j.cnki.stbcxb.2011.05.020
Gao, Y., and Gao, M. (2024). Spatial correlation network of municipal solid waste carbon emissions and its influencing factors in China. Environ. Impact Assess. Rev. 106:107490. doi: 10.1016/J.EIAR.2024.107490
George, M., and Franklin, A. M. (2017). Spatial analysis of emissions in Sweden. Energy Econ. 68, 383–394. doi: 10.1016/j.eneco.2017.10.003
González, P. F., Landajo, M., and Presno, M. J. (2014). The driving forces behind changes in CO2 emission levels in EU-27. Differences between member states. Environ Sci Policy 44, 11–16.
Guo, L., Zhao, S., Song, Y., Tang, M., and Li, H. (2022). Green finance, chemical fertilizer use and carbon emissions from agricultural production. Agriculture 12:313. doi: 10.3390/AGRICULTURE12030313
He, Y., Chen, R., Zhu, S., and Wang, F. (2020). Spatial network structure of agricultural carbon emission in China and regional collaborative emission reduction. Jiangsu J. Agricul. Sci. 36, 1218–1228. doi: 10.3969/j.issn.1000-4440.2020.05.02
Hu, X., and Wang, J. (2010). Estimation of livestock greenhouse gases discharge in China. Transact. Chin. Soc. Agricul. Eng. 26, 247–252. Available at: https://kns.cnki.net/kcms2/article/abstract?v=_GofKS1StuRcPvupvY16gKbThCa1qPqQWQ7j_gMrLdqu-GvWgbeZaC9UolXf8BRHEBklxMJ9PVb3hl0gmmqRs7VhB_Y-wTv7CRBCZH5c2zf9sAQo_55JZhTlEFRvqv4XrTO00H2Ujt5fdviAuF89C-LkWUy14YWQ0qIkJEPI6I8gkt5Hasde0PaQcw_iHkbc&uniplatform=NZKPT&language=CHS
Hu, Y., Zhang, K., Hu, N., and Wu, L. (2023). Review on measurement of agricultural carbon emission in China. Chin. J. Eco-Agric. 31, 163–176. doi: 10.12357/cjea.20220777
Huo, T., Cao, R., Xia, N., Hu, X., Cai, W., and Liu, B. (2022). Spatial correlation network structure of China's building carbon emissions and its driving factors: a social network analysis method. J. Environ. Manag. 320:115808. doi: 10.1016/J.JENVMAN.2022.115808
Inés, C. M., Joanna, L., Inmaculada, B., Javier, R., and Neus, S. (2023). On the relevance of site specificity and temporal variability in agricultural LCA: a case study on mandarin in North Uruguay. Int. J. Life Cycle Assess. 28, 1516–1532. doi: 10.1007/S11367-023-02186-6
Jebari, A., PereyraGoday, F., Kumar, A., Collins, L. A., Rivero, J. M., and McAuliffe, A. G. (2024). Feasibility of mitigation measures for agricultural greenhouse gas emissions in the UK. A systematic review. Agron. Sustain. Dev. 44:2. doi: 10.1007/S13593-023-00938-0
Ji, X., and Zhang, Y. (2023). Spatial correlation network structure and motivation of carbon emission efficiency in planting industry in the Yangtze River Economic Belt. J. Nat. Resour. 38, 675–693. doi: 10.31497/zrzyxb.20230308
Lesschen, P. J., Berg, M. V. D., Westhoek, H. J., Witzke, H. P., and Oenema, O. (2011). Greenhouse gas emission profiles of European livestock sectors. Anim. Feed Sci. Technol. 166-167, 16–28. doi: 10.1016/j.anifeedsci.2011.04.058
Li, X., Cao, C., and Chang, C. (2007). The first law of geography and spatial-temporal proximity. Chinese J. Nature 29, 69–71. Available at: https://kns.cnki.net/kcms2/article/abstract?v=_GofKS1StuR9l6Ym6cRT6y4Ig9LpMH_Dh5V68rhDIhQ1usCRGWT_W5-kue8BvN4Saq_WVf9EXrJC9faDONCGPH3B17GeaWE4M3qBogYV21aTRVDgdR1xMp8XlW9UuUnos311jRHNd8ce-cxiob1DOauniHLWCtZjAUhiVIp0B_IcBjI6x0D5vFpgzIR2po1U&uniplatform=NZKPT&language=CHS
Li, Z., Yu, K., Zhong, J., Yang, J., Zhang, D., and Zhu, J. (2024b). Spatial correlation network characteristics and influencing factors of water environmental efficiency in three major urban agglomerations in the Yangtze River basin, China. Sustain. Cities Soc. 104:105311. doi: 10.1016/J.SCS.2024.105311
Li, X., Zhang, Y., Zhou, S., Zhao, Z., and Zhao, Y. (2024a). Exploration and future trends on spatial correlation of green innovation efficiency in strategic emerging industries under the digital economy: a social network analysis. J. Environ. Manag. 359:121005. doi: 10.1016/J.JENVMAN.2024.121005
Lin, B., and Xu, B. (2018). Factors affecting CO2 emissions in China's agriculture sector: a quantile regression. Renew. Sust. Energ. Rev. 94, 15–27. doi: 10.1016/j.rser.2018.05.065
Liu, Y., and Gao, Y. (2022). Measurement and impactor analysis of agricultural carbon emission performance in Changjiang economic corridor. Alex. Eng. J. 61, 873–881. doi: 10.1016/J.AEJ.2021.04.083
Liu, M., Yang, X., Wen, J., Wang, H., Feng, Y., Lu, J., et al. (2023). Drivers of China's carbon dioxide emissions: based on the combination model of structural decomposition analysis and input-output subsystem method. Environ. Impact Assess. Rev. 100:107043. doi: 10.1016/J.EIAR.2023.107043
Liu, D., Zhu, X., and Wang, Y. (2020). China’s agricultural green total factor productivity based on carbon emission: an analysis of evolution trend and influencing factors. J. Clean. Prod. 278:123692. doi: 10.1016/j.jclepro.2020.123692
Lv, K., Feng, X., Kelly, S., Zhu, L., and Deng, M. (2019). A study on embodied carbon transfer at the provincial level of China from a social network perspective. J. Clean. Prod. 225, 1089–1104. doi: 10.1016/j.jclepro.2019.03.233
Md, S. A., Pachiyappan, D., Abu, B. S., Muntasir, M., Haider, M., Manigandan, P., et al. (2023). The impacts of globalization, renewable energy, and agriculture on CO2 emissions in India: contextual evidence using a novel composite carbon emission-related atmospheric quality index. Gondwana Res. 119, 384–401. doi: 10.1016/J.GR.2023.04.005
Min, J., and Hu, H. (2012). Calculation of greenhouse gases emission from agricultural production in China. China Popul. Resour. Environ. 22, 21–27. Available at: https://kns.cnki.net/kcms2/article/abstract?v=_GofKS1StuTz6UIu9CWstmAYk67F6MZC39Neucs1jY72y13KMGY4oBbSYi73bXSQrGkij5C8hvGjvQBn5BybEsF9UkISzwHzW5qoz3vUYRYgr5ViRXWwofUKj7cEqcOh_SbAqtc8ZpxC89JOooFMd5sfENJXLwhRXxw5CRhjiGjes2_VWh44F89a8aIUgEcL&uniplatform=NZKPT&language=CHS
Nsabiyeze, A., Ma, R., Li, J., Luo, H., Zhao, Q., Tomka, J., et al. (2024). Tackling climate change in agriculture: a global evaluation of the effectiveness of carbon emission reduction policies. J. Clean. Prod. 468:142973. doi: 10.1016/J.JCLEPRO.2024.142973
Pierre, F., Michael, O. S., Jones, W. M., Andrew, M. R., Gregor, L., Hauck, J., et al. (2022). Global carbon budget 2022. Earth System Sci. Data 14, 4811–4900. doi: 10.5194/ESSD-14-4811-2022
Qian, Z., and Liu, S. (2024). On the characteristics and drivers of spatial correlation network of green low-carbon agricultural production efficiency in the Yellow River Basin. J. Arid Land Res. Environ. 38, 27–38. doi: 10.13448/j.cnki.jalre.2024.026
Shannon, E. B., Claudia, R. W., and Ben, C. (2024). Low-power flux gradient measurements for quantifying the impact of agricultural management on nitrous oxide emissions. Agric. For. Meteorol. 353:110027. doi: 10.1016/J.AGRFORMET.2024.110027
Song, J., Xiao, H., and Liu, Z. (2024). Analysis of the driving mechanism of urban carbon emission correlation network in Shandong Province based on TERGM. Sustain. For. 16:4233. doi: 10.3390/SU16104233
Thomas, N., Andreas, R., Maria, B., Philippe, J., Jens, L., Martin, S., et al. (2023). Swiss agricultural life cycle assessment: a method to assess the emissions and environmental impacts of agricultural systems and products. Int. J. Life Cycle Assess. 29, 433–455. doi: 10.1007/S11367-023-02255-W
Wang, Z. (1997). Estimation of nitrous oxide emission of farmland in China. J. Ecol. Rural Environ. 13, 52–56. Available at: https://kns.cnki.net/kcms2/article/abstract?v=_GofKS1StuQyC_iRpMMISJmUUZEcN-YWTOgLFgw1xVvNMbtWb1wP2kyW7hrCSvscS_Ivbx9lnzd01rx6RdWe_e9HQ-Z9eV0d6F3Le6QkVTaFrxyYR_z_hRgmYEQswCWcQyT8f1MxZCTjxdMwsdOpXB0fdBLJihUKXUqV110yiQgYKpL9JLVn7NedxFmhx_Hw&uniplatform=NZKPT&language=CHS
Wang, R., Chen, J., Li, Z., Bai, W., and Deng, X. (2023). Factors analysis for the decoupling of grain production and carbon emissions from crop planting in China: a discussion on the regulating effects of planting scale and technological progress. Environ. Impact Assess. Rev. 103:107249. doi: 10.1016/J.EIAR.2023.107249
Wang, J., Rothausen, S. G. S. A., Conway, D., Zhang, L., Xiong, W., Holman, I. P., et al. (2012). China’s water–energy nexus: greenhouse-gas emissions from groundwater use for agriculture. Environ. Res. Lett. 7:014035. doi: 10.1088/1748-9326/7/1/014035
Wang, S., and Su, W. (1993). Estimation of nitrous oxide emission and its future change in China. Environ Sci Policy 14:42-46+92-93. doi: 10.13227/j.hjkx.1993.03.013
Wen, S., Hu, Y., and Liu, H. (2022). Measurement and spatial–temporal characteristics of agricultural carbon emission in China: an internal structural perspective. Agriculture 12, –1749. doi: 10.3390/AGRICULTURE12111749
Xu, H., Li, Y., Zheng, Y., and Xu, X. (2022). Analysis of spatial associations in the energy–carbon emission efficiency of the transportation industry and its influencing factors: evidence from China. Environ. Impact Assess. Rev. 97:106905. doi: 10.1016/J.EIAR.2022.106905
Xu, B., and Lin, B. (2017). Factors affecting CO2 emissions in China’s agriculture sector: evidence from geographically weighted regression model. Energy Policy 104, 404–414. doi: 10.1016/j.enpol.2017.02.011
Yang, X., Liu, Y., Bezama, A., and Thrän, D. (2024). Agricultural carbon emission efficiency and agricultural practices: implications for balancing carbon emissions reduction and agricultural productivity increment. Environ. Dev. 50:101004. doi: 10.1016/J.ENVDEV.2024.101004
Yao, Y., Bi, X., Li, C., Xu, X., Jing, L., and Chen, J. (2024). A united framework modeling of spatial-temporal characteristics for county-level agricultural carbon emission with an application to Hunan in China. J. Environ. Manag. 364:121321. doi: 10.1016/J.JENVMAN.2024.121321
Yu, Z., Chen, L., Tong, H., Chen, L., Zhang, T., Li, L., et al. (2022). Spatial correlations of land-use carbon emissions in the Yangtze River Delta region: a perspective from social network analysis. Ecol. Indic. 142:109147. doi: 10.1016/J.ECOLIND.2022.109147
Zhou, J. B., Jiang, M. M., and Chen, G. Q. (2007). Estimation of methane and nitrous oxide emission from livestock and poultry in China during 1949–2003. Energy Policy 35, 3759–3767. doi: 10.1016/j.enpol.2007.01.013
Zhou, F., and Wen, C. (2024). Research on the evolution of the spatial association network structure and driving factors of China’s agricultural green development. Agriculture 14:683. doi: 10.3390/AGRICULTURE14050683
Keywords: agricultural carbon emissions, social network analysis, spatial correlation network, QAP, Shandong Province
Citation: Shan M, Ji M, Jin F, Li Y, Fang Z and Ji H (2025) Structural characteristics and influencing factors of agricultural carbon emissions spatial correlation network: evidence from Shandong Province. Front. Sustain. Food Syst. 9:1508492. doi: 10.3389/fsufs.2025.1508492
Edited by:
Jianxu Liu, Shandong University of Finance and Economics, ChinaReviewed by:
Adnan Abbas, Nanjing University of Information Science and Technology, ChinaCopyright © 2025 Shan, Ji, Jin, Li, Fang and Ji. This is an open-access article distributed under the terms of the Creative Commons Attribution License (CC BY). The use, distribution or reproduction in other forums is permitted, provided the original author(s) and the copyright owner(s) are credited and that the original publication in this journal is cited, in accordance with accepted academic practice. No use, distribution or reproduction is permitted which does not comply with these terms.
*Correspondence: Min Ji, amFtZXNqaW1pbkBxcS5jb20=
Disclaimer: All claims expressed in this article are solely those of the authors and do not necessarily represent those of their affiliated organizations, or those of the publisher, the editors and the reviewers. Any product that may be evaluated in this article or claim that may be made by its manufacturer is not guaranteed or endorsed by the publisher.
Research integrity at Frontiers
Learn more about the work of our research integrity team to safeguard the quality of each article we publish.