
95% of researchers rate our articles as excellent or good
Learn more about the work of our research integrity team to safeguard the quality of each article we publish.
Find out more
ORIGINAL RESEARCH article
Front. Sustain. Food Syst. , 31 January 2025
Sec. Climate-Smart Food Systems
Volume 9 - 2025 | https://doi.org/10.3389/fsufs.2025.1499425
 K. Srikanth Reddy1,2
 C. M. Parihar1*
 P. Panneerselvam2*
 Ayan Sarkar1Hari Sankar Nayak1,3Kiranmoy Patra1D. R. Sena4G. Sreeja Reddy1Alok Sinha1Sneha Bharadwaj5Sunil Kumar2Virender Kumar6
In eastern India, the rice-wheat cropping system (RWCS) faces challenges like poverty, fragmented landholdings, and resource overexploitation, with smallholder farmers prioritizing short-term gains through excessive water and nitrogen use. To address these issues, our study combined field experiments and the DNDC crop simulation model to evaluate the resilience, viability, and environmental sustainability of RWCS under conservation agriculture (CA) with varying irrigation methods and nitrogen rates at the International Rice Research Institute-South Asia Regional Center (ISARC), Varanasi, India. The treatments included: (1) Puddled transplanted rice followed by zero-tilled wheat with flood irrigation (PTR-ZTW-F), (2) Direct-seeded rice followed by ZTW with flood irrigation (DSR-ZTW-F), (3) DSR followed by ZTW with surface drip fertigation (DSR-ZTW-SD), and (4) DSR followed by ZTW with subsurface drip fertigation (DSR-ZTW-SSD), evaluated under 75% and 100% recommended nitrogen dose and nitrogen control plots. The DNDC model accurately predicted soil mineral N (: R2 = 0.74, RRMSE = 52.9%; : R2 = 0.79, RRMSE = 63.5%), water-filled pore space (R2 = 0.85, RRMSE = 20.9%), soil temperature (R2 = 0.91, RRMSE = 4.6%), redox potential (R2 = 0.82, RRMSE = 24.1%), system productivity (R2 = 0.93, RRMSE = 7.8%), and nitrogen uptake (R2 = 0.86, RRMSE = 18.1%). DSR-ZTW systems with drip fertigation significantly enhanced sustainability and productivity compared to PTR-ZTW system, where CH4 emissions were reduced by 70%–80% and global warming potential reduced by 56%, despite higher N2O emissions. Additionally, DSR-ZTW-SSD achieved the highest system yield (12.8 t ha−1), minimized water losses, and improved nitrogen use efficiency. Also, TOPSIS analysis ranked DSR-ZTW-SSDF as the most sustainable system, achieving the highest yield and resource use efficiency, while significantly reducing GHG emissions. The study underscores the potential of integrating CA, drip fertigation, and DSR to enhance productivity, conserve resources, and improve the sustainability of RWCS.
The rice (Oryza sativa L.)–wheat (Triticum aestivum L.) cropping system (RWCS) is crucial for global food security, providing essential staples for a significant portion of the world's population (Banjara et al., 2021; Dhanda et al., 2022). This system is widely practiced across Asia, spanning 13.5 Mha, with 57% located in South Asia, predominantly in the Indo-Gangetic Plains. In India, RWCS spans ~10 Mha, producing 130 Mt of rice and 106 Mt of wheat, contributing around 75% of the nation's cereal output and playing a vital role in food security and economic stability (Ladha et al., 2009; ICAR Annual Report, 2023). Traditionally, rice in RWCS is cultivated through puddled transplanted rice (PTR), involving intense puddling, followed by seedling transplanting, while wheat is grown under conventional tillage (CTW) following rice residue burning and multiple tillage operations (Peramaiyan et al., 2023). The continuous adoption of PTR has deleterious effects on the subsequent CTW crop due to subsoil compaction and structural degradation of soil, impairing root architecture and water movement (Chauhan et al., 2012). Additionally, these traditional practices lead to soil health deterioration, groundwater depletion, residue burning hazards, resource inefficiency, yield stagnation, reduced profitability, multi-nutrient deficiency, and increased energy use (Humphreys and Gaydon, 2015). The resource-, energy-, and labor-intensive nature of RWCS, coupled with its significant greenhouse gas (GHG) emissions, poses substantial challenges to its sustainability (Gupta et al., 2016).
India is considered as the world's third-largest emitter of GHGs, with agriculture contributing ~16% of total emissions. Among them, 74% of emissions are attributable to methane (CH4), primarily from livestock (38.9%) and rice cultivation (36.9%), and the remaining 26% from N2O emissions (Vetter et al., 2017). Climate change, population growth, and depleting natural resources further exacerbate these challenges, making an imperative demand for adoption of sustainable interventions in the RWCS to ensure environmental stewardship and economic resilience. Research must focus on cost-effective, resource-efficient, and eco-friendly practices to sustain this vital agricultural system. Approaches such as conservation agriculture (CA), direct-seeded rice (DSR), and micro-irrigation are emerging as promising solutions. These practices not only improve productivity, profitability, and sustainability but also reduce environmental impacts, thereby supporting food security and livelihoods across South Asia (Parihar et al., 2017; Kumar et al., 2023; Sharma et al., 2023).
CA has emerged as a key strategy for sustainable farming, enhancing productivity and long-term sustainability through residue retention, minimal tillage, and crop diversification (Parihar et al., 2018; Patra S. et al., 2023). Globally, CA is practiced on ~205 Mha (12.5% of total cropland), primarily in developed countries. Adoption in Asia and Africa remains limited, with only 13.9 Mha and 1.5 Mha, respectively, due to small-scale and subsistence farming (Jat et al., 2020). In India, CA is more prevalent in the northwest IGPs due to favorable conditions and robust infrastructure, while the eastern IGP lags behind, necessitating region-specific research and its strategic promotion (Kumar et al., 2024a). DSR offers an alternative to PTR, conserving resources and labor, primarily by eliminating puddling and transplanting (Kumar and Ladha, 2011; Panneerselvam et al., 2020; Reddy et al., 2025). Further, with increasing water scarcity, transitioning from flood irrigation to micro-irrigation systems is critical for enhancing water productivity in RWCS (Rana et al., 2023). Drip irrigation has gained momentum as a cost-effective method for crops like maize, rice, and wheat (Sidhu et al., 2019). Subsurface drip fertigation (SSD) further optimizes resource use by eliminating lateral repositioning required in surface drip fertigation (SD), extending system longevity, and improving nitrogen efficiency by subsurface placement (Hagin et al., 2003; Patra K. et al., 2023). Integrating these resource-saving technologies (CA, DSR, and SSD) in the eastern IGP could enhance RWCS productivity and sustainability while minimizing environmental impact.
Crop models are essential tools for evaluating the productivity and sustainability of agricultural systems, simulating complex interactions between crops, the environment, and management practices (Kumar et al., 2024b). These models integrate knowledge from agronomy, soil science, meteorology, and plant physiology to assess the impacts of factors like climate change, soil properties, irrigation, and nutrient management on crop performance (Kumar et al., 2024c). By enabling researchers to optimize agricultural practices, crop models enhance efficiency and sustainability, offering critical insights for decision-making and advancing hypothesis testing without extensive field trials. They play a pivotal role in steering sustainable agriculture to meet global food demands while preserving ecological integrity (Chen et al., 2018; Zhao et al., 2020). Unlike traditional models, biogeochemical and process-based models such as DayCent (Begum et al., 2019), DeNitrification-DeComposition (DNDC) (Zhao et al., 2020), and water and nitrogen management model (Chen et al., 2018) apply scientific principles to simulate agricultural systems. These models evaluate the effects of water management, nitrogen application, and organic amendments on GHG emissions and crop yield under various soil and climate conditions (Minamikawa et al., 2014; Chun et al., 2016). The DNDC model, for instance, integrates C and N cycling processes within the soil-plant-atmospheric system, enabling researchers to explore scenarios related to sustainable agriculture, climate change adaptation, and resource management. By leveraging these models, users can make data-driven decisions to improve crop productivity, enhance resource efficiency, and mitigate environmental impacts.
The DNDC model has demonstrated strong performance under diverse agroclimatic conditions in simulating crop growth, soil water and N dynamics, and GHG emissions (Jiang R. et al., 2019; Zhao et al., 2020; Abdalla et al., 2022). However, its application in system-based studies, coupled with adoption of CA and drip fertigation remains limited globally. To address this gap, a detailed investigation is necessary to evaluate the DNDC model's performance under these conditions. Hence, the study aims to address the following objectives: (1) calibrate and evaluate the DNDC model (v9.5) using measured soil parameters (, , WFPS, temperature, redox potential), crop yield, and N uptake; (2) estimate GHG emissions (CH4 and N2O) and assess N and water balance across different treatments; (3) evaluate the overall performance of CA, DSR, and micro-irrigation systems in the RWCS.
The field experiment was initiated in 2019, and since its inception, a CA-based rice-wheat rotation has been implemented with the specified irrigation methods (Table 1) at the ISARC experimental farm, Varanasi, India (25.310°N, 82.970°E; elevation: 80.71 m above mean sea level). The present study was conducted during the kharif (rainy) and rabi (winter) seasons of 2022–23 and 2023–24. The experimental station is located in the eastern IGPs with a humid subtropical climate, with an average annual temperature of 26°C, annual rainfall of 1,100 mm, and an average of 9.7 h of sunshine per day. Weather conditions during the study period are illustrated in Figure 1, and soil properties at the time of initial setup of the model are detailed in Supplementary Table 1. The field experiment followed a randomized complete block design with three replications. Treatment and management specifications are described in Table 1 and Supplementary Table 2. Each experimental plot measured 35 m2 (7.0 m × 5.0 m). Drip irrigation systems (SD and SSD) were installed at 60 cm spacing, with SSD positioned 10 cm below the soil surface.
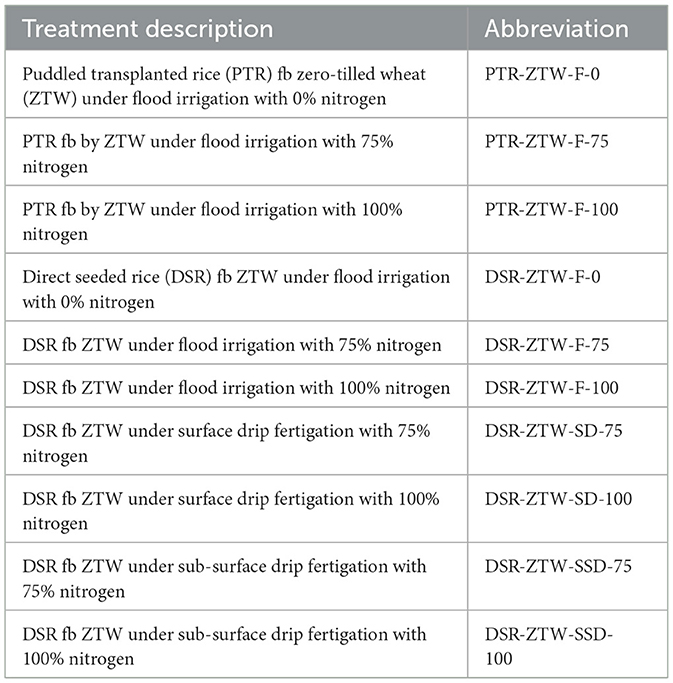
Table 1. Details of imposed treatments in the experiment.
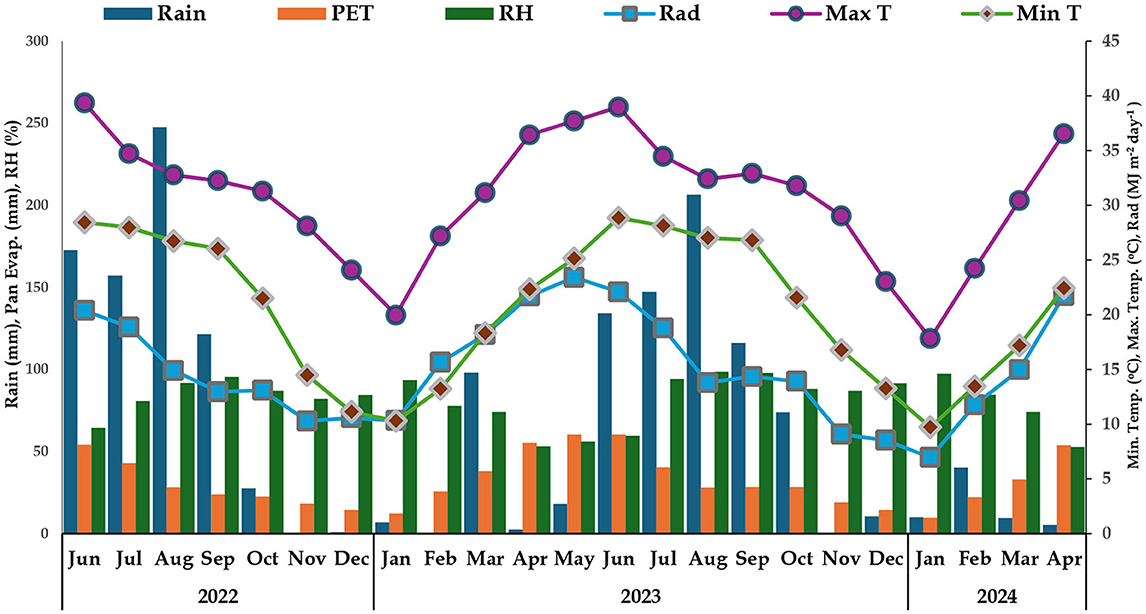
Figure 1. Monthly averages of weather parameters during the rice-wheat growing seasons in 2022–23 and 2023–24.
Soil samples for measuring mineral N ( N and N) were collected and analyzed at 1-,3-, 5-, and 9-days post-fertilization, and then weekly basis using the micro Kjeldahl distillation method (Prasad et al., 2006). Soil water-filled pore space (WFPS) was measured using the PR2 soil moisture profile probe (Delta-T Devices, UK). These probes were calibrated at specific field sites, ensuring readings were within 1%−2% of soil moisture content determined volumetrically. The volume (%) readings were converted to WFPS (%) for evaluation with the DNDC model. Soil Eh and temperature were measured using the Hanna ORP tester and a soil thermometer, respectively. All these soil properties, except mineral N, were recorded at 7–10 days intervals. Grain yield has been obtained from a 10 m2 area omitting the border rows and reported at 14% moisture content. N uptake has been calculated by analyzing the N concentration in grain and straw samples using the Kjeldahl digestion method (Prasad et al., 2006).
In this study, the DNDC model version 9.5 (http://www.dndc.sr.unh.edu/) was employed to simulate biogeochemical fluxes of C and N in agricultural ecosystems. Originally developed by Li et al. (1992a, 2012), the DNDC model captures the complex interactions between soil and crop dynamics, including parameters such as SOC, temperature, moisture, pH, redox potential, and substrate concentration gradients. By integrating environmental data, crop growth parameters, and management practices, the model estimates daily fluxes of C and N and emissions of trace gases (CO2, N2O, CH4, NH3) (Li et al., 1992b; Li, 2000; Giltrap et al., 2010). These simulations are crucial for assessing the impacts of agricultural practices on GHG emissions and soil health, offering insights for sustainable farming. The DNDC model comprises two main components: the physio-chemical and biochemical sub-models. The physio-chemical sub-model simulates soil, climate, crop growth, and decomposition processes in response to ecological drivers such as climate, soil properties, and anthropogenic activities, predicting key soil environmental parameters (Li, 2000). The biochemical sub-model focuses on nitrification, denitrification, and fermentation processes, estimating trace gas emissions based on physio-chemical inputs (Li et al., 1992b; Zhang F. et al., 2018; Zhang Y. et al., 2018). The model incorporates the “anaerobic balloon” concept to track GHG emissions at the field level. Using the Nernst and Michaelis–Menten equations, it simulates redox reactions producing GHGs (Li et al., 1992a). CH4 production is modeled by calculating substrate concentrations and tracking reductive reactions involving electron donors [H2 and dissolved organic carbon (DOC)] and acceptors (O2, , Mn4+, Fe3+, , CO2), with production occurring when soil Eh falls below −150 mV. CH4 consumption is simulated as an oxidation reaction under aerobic conditions. N2O emissions are predicted through nitrification and denitrification processes, with reaction rates determined by the Michaelis–Menten equation (Li et al., 2004).
The DNDC model requires comprehensive input data to accurately simulate biogeochemical processes. These include: (1) daily meteorological data such as temperature, precipitation, wind speed, solar radiation, and relative humidity; (2) initial soil conditions like SOC, and content, field capacity, wilting point, bulk density, pH, and texture; and (3) agricultural management practices, including planting and harvest dates, crop parameters, tillage methods, and fertilizer application rates. For this study, meteorological data were obtained from the automatic weather station at the ISARC experimental farm in Varanasi, with daily weather trends shown in Figure 1. Experimental data from 2022–23 and 2023–24 was used for model calibration and evaluation, respectively, as described in Section 2.3.2. Management practices, including tillage, planting dates, and fertilization schedules, are detailed in Supplementary Table 2. Default crop parameters were fine-tuned to minimize RMSE for simulated variables and align with observed crop maturity, improving model accuracy.
The DNDC model was executed continuously over a 2-year rice-wheat rotation to capture the persistent effects of CA. Dataset from 2022–23 was used for calibration, while 2023–24 dataset was reserved for evaluation. Calibration was performed separately for DSR and PTR, using N control and 100% N treatments representing stressed and unstressed conditions, respectively. Simulated outputs for , , soil temperature, WFPS, Eh, crop yield, and N uptake were calibrated against field data collected from 2022–23 cropping season, following methods described by Thomas and Hao (2017). The calibration process involved optimizing crop growth parameters such as maximum biomass, biomass fraction, C/N ratio, thermal degree days, water demand, and optimal temperature, as outlined by Abdalla et al. (2020) and Zhang et al. (2024). Finalized calibration parameters are detailed in Supplementary Table 3. Validation was performed using the 2023–24 dataset, assessing the model's performance across all variables.
Sensitivity analysis of the DNDC model was performed to evaluate the influence of various input parameters on crop yield and cumulative CH4 and N2O emissions. The 2022–23 dataset with 100% N treatments was used as the baseline scenario after model calibration and validation. Each parameter was independently adjusted while keeping others constant, and simulations were conducted to measure the effects of changes in soil pH (+2, −2), SOC (+200%, −200%), bulk density (+50%, −50%), field capacity (+50%, −50%), porosity (+50%, −50%), residue quantity (100%, 0%), microbial activity (0.5, 1), flooding duration (+20 days, −20 days), and N and P application rates (kg ha−1) (+100%, −100%). Following the independent adjustment of each parameter, a sensitivity index (SI) was calculated using the equation proposed by Zhao et al. (2020):
Where, Pmax and Pmin are the maximum and minimum input parameters, respectively; Pavg is the average of Pmin and Pmax; Rmax and Rmin are the corresponding output values to Pmax and Pmin; and Ravg is the average of Rmax and Rmin. When the value of SI is 1, the simulated values will change by the same proportion as the mean, while the input value changes by a certain proportion relative to the mean. A negative value of SI indicates a negative correlation between the simulated values and input parameters, and positive values of SI indicate greater effects of the input parameters on the simulation value. The SI values can compare the model's sensitivity under different parameters.
After successful calibration and validation (Section 2.3.2), daily GHG emissions were simulated for each treatment, and seasonal emissions were calculated by summing daily fluxes from sowing to harvest. CH4 and N2O emissions, initially reported in kg C ha−1 and kg N ha−1, were converted to kg CH4 ha−1 and kg N2O ha−1 using factors of 1.33 and 1.57, respectively. These emissions were then standardized to CO2-equivalent terms using GWP values over 100 years, with CH4 and N2O multiplied by factors of 27 and 273, respectively (Forster et al., 2021; IPCC, 2021). Further, the model was employed to simulate components of water and nitrogen balances, estimating the pathways of these components within each cropping system over 2 years. Water and nitrogen mean balance errors (WMBE and NMBE) were calculated by subtracting the sum of all components and balance from the total input and dividing by the total input, providing a measure of model accuracy.
The efficacy of the model was assessed through the application of six distinct statistical metrics, namely: the coefficient of determination (R2), the root means square error (RMSE), the relative root means square error (RRMSE), the Nash-Sutcliffe efficiency (NSE), Willmott's index of agreement (d-stat), and the mean absolute error (MAE). These metrics were utilized to appraise the model's performance by comparing the simulated data against the observed measurements (Nash and Sutcliffe, 1970; Willmott, 1982; Jamieson et al., 1991; Moriasi et al., 2007).
(a) R2
(b) RMSE
(c) RRMSE
(d) NSE
(e) d-stat
(f) MAE
Where Oi is the observed value, Si is the simulated value, O is the mean of the observed value and S is the mean of the simulated value.
We employed multicriteria decision analysis using the Technique for Order Preference by Similarity to Ideal Solution (TOPSIS) to evaluate and rank the treatments based on seven criteria: system yield, system profitability (data given in Supplementary Table 4), GWP, nitrogen uptake, nitrogen loss, water use, and non-productive water loss. The criteria were classified as benefits (system yield, system profitability, nitrogen uptake) or costs (GWP, nitrogen loss, water use, water loss), with weights assigned to reflect their importance: system yield (0.2), system profitability (0.2), GWP (0.2), nitrogen uptake (0.1), nitrogen loss (0.1), water use (0.1), and non-productive water loss (0.1). The analysis involved normalizing the data using vector normalization to ensure comparability, followed by weighted normalization to incorporate the assigned weights. Ideal and negative-ideal solutions were determined to represent the best and worst performances for each criterion. Euclidean distances to these solutions were used to calculate the closeness coefficient, which quantified the proximity of each treatment to the ideal solution. Higher closeness coefficients indicated better overall performance, and treatments were ranked accordingly (Hwang and Yoon, 1981; Chakraborty, 2022). All analyses and visualizations were conducted using “topsis” package in R statistical software (R Core Team, 2022).
The DNDC model was calibrated by fine-tuning crop parameters listed in Supplementary Table 3, enhancing its ability to simulate crop performance and soil dynamic properties. The well calibrated and validated model showed high accuracy in replicating observed crop growth and soil parameters for the RWCS.
The DNDC model demonstrated robust performance in simulating soil properties. Performance statistics for calibration and evaluation phases are provided in Supplementary Table 5, highlighting the model's accuracy and reliability. The metrics underscore the model's ability to consistently replicate observed soil property dynamics.
Observed and simulated data indicated that –N dominated mineral N in rice growing season, while –N was more prevalent in wheat growing season (Figure 2). During the rice phase, –N concentrations were lower in PTR plots but significantly higher in DSR across treatments. In 100% N-applied plots, the highest and lowest mineral N concentrations were observed in SSD and flooded DSR plots, respectively. Among flooded treatments, mineral N concentrations were higher in PTR than DSR during rice growth, while concentrations were higher in wheat following DSR compared to wheat following PTR, likely due to the puddling effect. The model effectively simulated soil mineral N dynamics (–N and –N) across N rates (0%, 75%, 100% RDN) and various establishment and irrigation methods, achieving mean R2 values of 0.85 for –N and 0.79 for –N. However, moderate NSE values (0.76 for –N and 0.73 for –N) and high RMSE (0.93 kg N ha−1 and 2.11 kg N ha−1) and RRMSE (52.9% and 62.5%) suggest room for improvement in model accuracy.
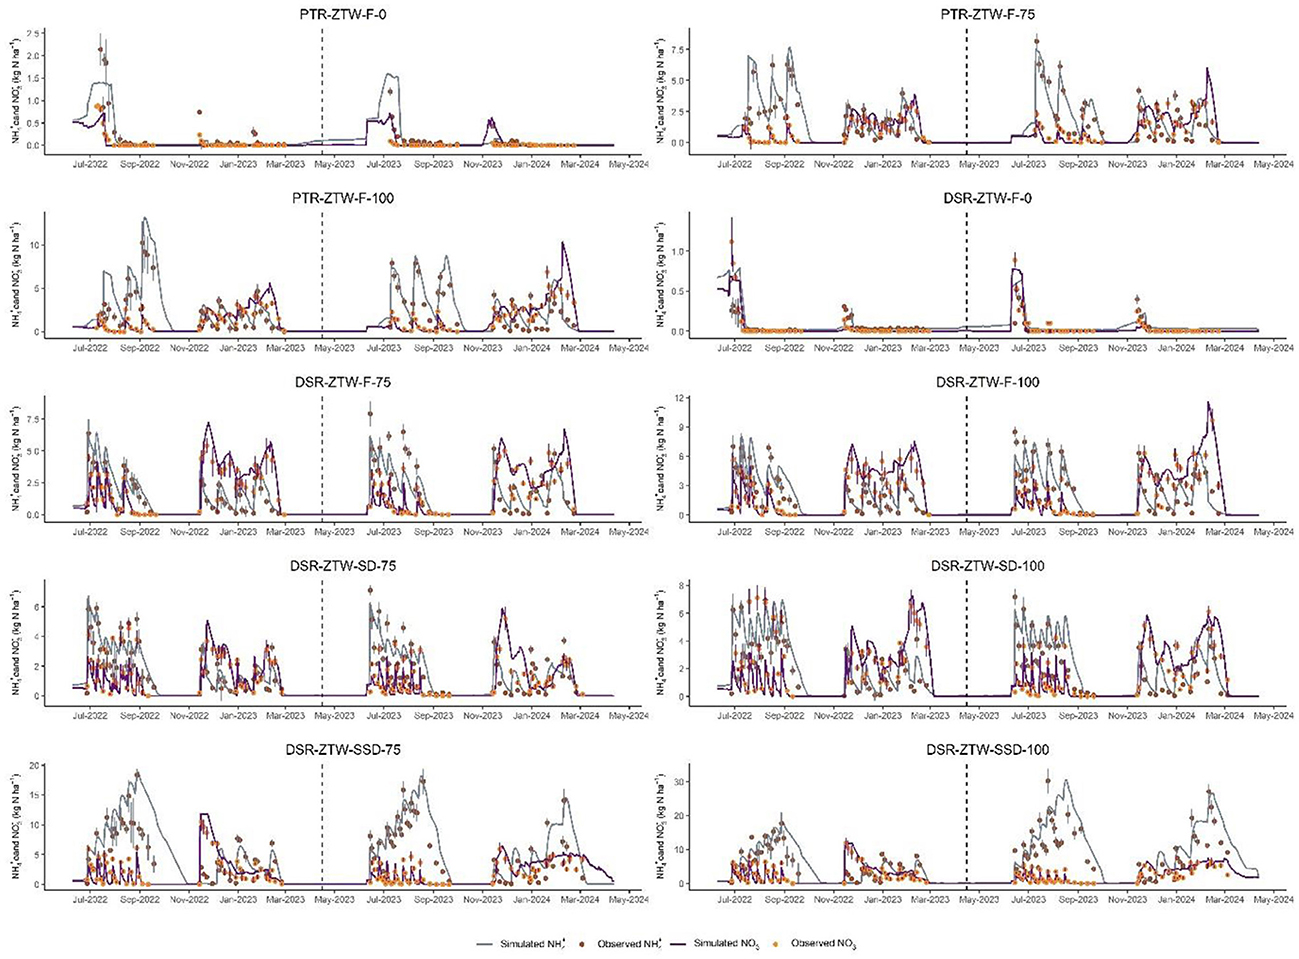
Figure 2. Observed and simulated soil N and N of the 0 cm−20 cm soil layer across different treatments of crop establishment techniques, irrigation methods and N rates during a 2-year rice-wheat cropping cycle. The dashed line distinguishes the 2022–23 (calibration phase) and 2023–24 (evaluation phase).
The DNDC model effectively simulated daily WFPS trends, which were largely influenced by precipitation and irrigation (Figure 3). Simulated WFPS are closely aligned with seasonal measurements across treatments, except during the wheat-growing period in both the calibration (2022–23) and evaluation (2023–24) phases. Temporal variations in flooded plots under PTR and DSR systems were accurately predicted, while WFPS was significantly overestimated in SD and SSD treatments of DSR-based systems. The correlation between observed and simulated values confirmed the model's strong performance in simulating WFPS% at 0 cm−20 cm depth, with metrics including an R2 of 0.85, RMSE of 0.12, RRMSE of 20.42%, and NSE of 0.84. During the rice growing season, mean WFPS% was higher in flooded plots (PTR and DSR) compared to SD and SSD plots. However, no significant difference was observed during the wheat-growing season.
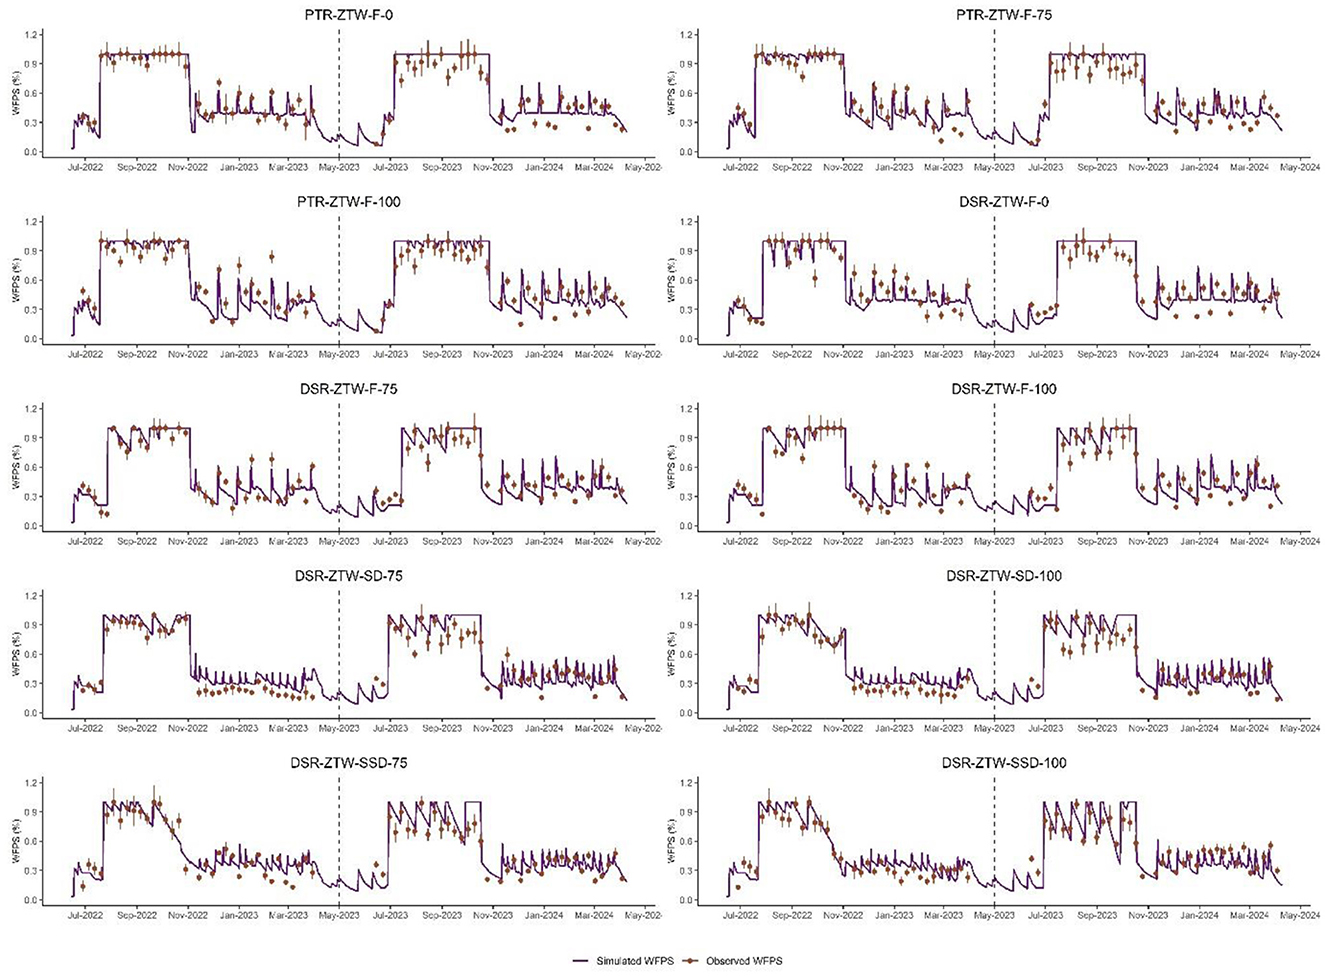
Figure 3. Observed and simulated WFPS (%) of the 0 cm−20 cm soil layer across different treatments of crop establishment techniques, irrigation methods and N rates during a 2-year rice-wheat cropping cycle. The dashed line distinguishes the 2022–23 (calibration phase) and 2023–24 (evaluation phase).
The DNDC model effectively simulated daily soil temperature variations at 0 cm−5 cm depth throughout the calibration and evaluation phases of the RWCS, with minor overestimations during calibration and underestimations during evaluation (Figure 4). Observed fluctuations in soil temperature were primarily influenced by air temperature at the experimental site, and no significant differences were noted across treatments. The model captured temperature variations more accurately during the wet season (kharif rice) than the dry season (rabi wheat) (Figure 4). Performance metrics demonstrated high accuracy, with an R2 of 0.91, RMSE of 1.28°C, RRMSE of 4.58%, and NSE of 0.93.
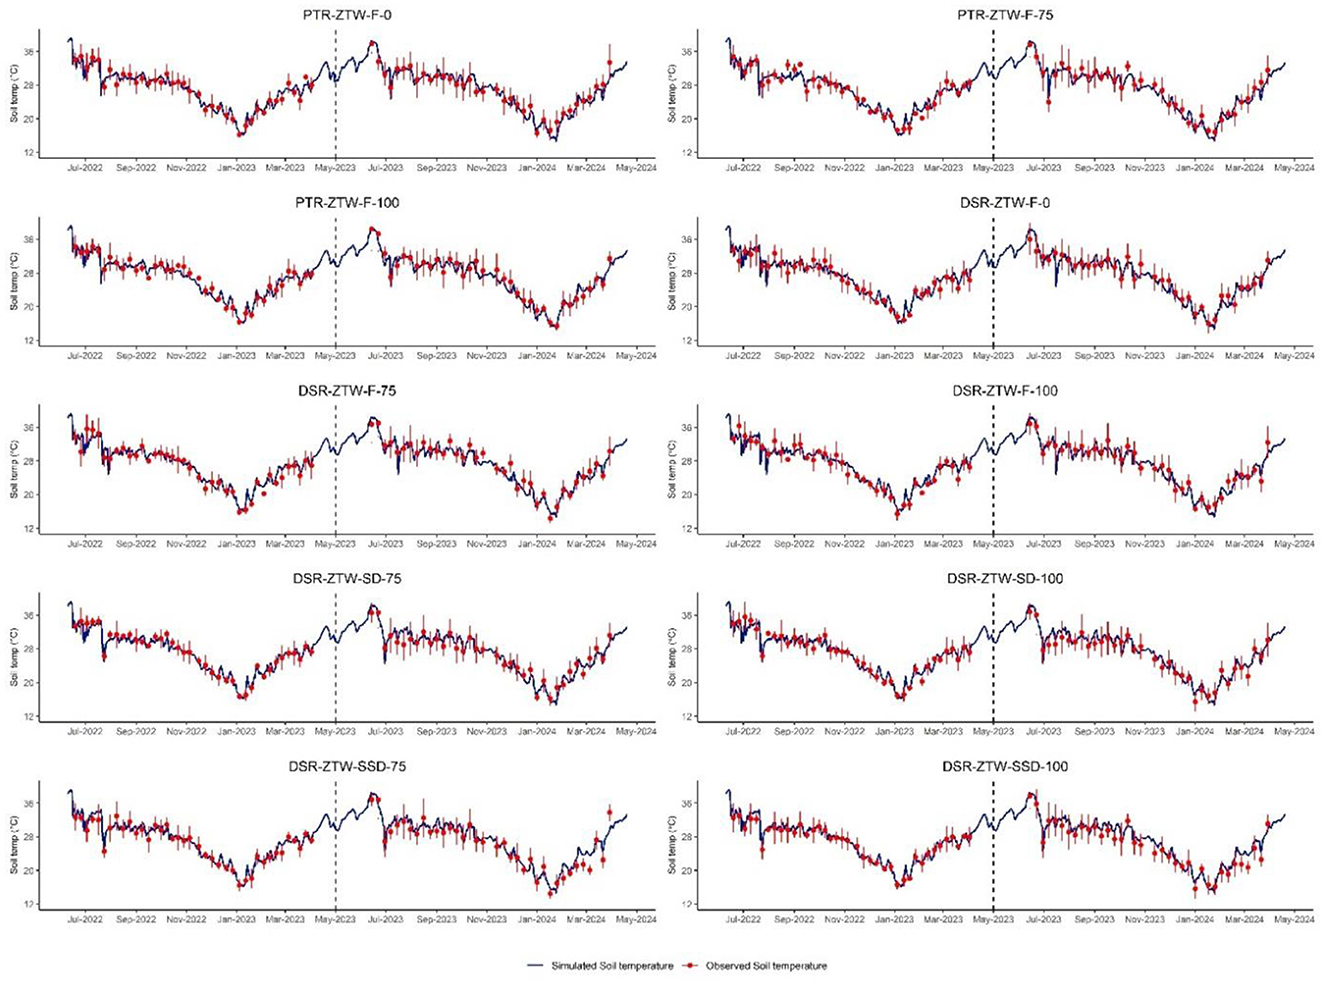
Figure 4. Observed and simulated soil temperature of the 0 cm−20 cm soil layer across different treatments of crop establishment techniques, irrigation methods and N rates during a 2-year rice-wheat cropping cycle. The dashed line distinguishes the 2022–23 (calibration phase) and 2023–24 (evaluation phase).
Eh measurements were taken exclusively during the rice season. The DNDC model tended to overestimate Eh, particularly after the drainage of flood water (Figure 5). Eh responded predictably to irrigation events, decreasing after re-flooding and increasing post-drainage. In PTR treatments, with frequent flooding, Eh showed significant variability, whereas in DSR-flooded treatments, where flooding was controlled, Eh remained mostly positive. In SD and SSD treatments, Eh dropped below 0 mV only during rainfall-induced flooding and remained above 100 mV otherwise. The model demonstrated a strong correlation between observed and simulated values, with an R2 of 0.82. Performance metrics included an RMSE of 91.6 mV, RRMSE of 24.0%, and NSE of 0.82, indicating good model accuracy. The Figure 6 explains the relation between the simulated and observed soil dynamic properties (soil mineral N, WFPS, soil temperature and Eh) along with the 2-year mean evaluation statistics.
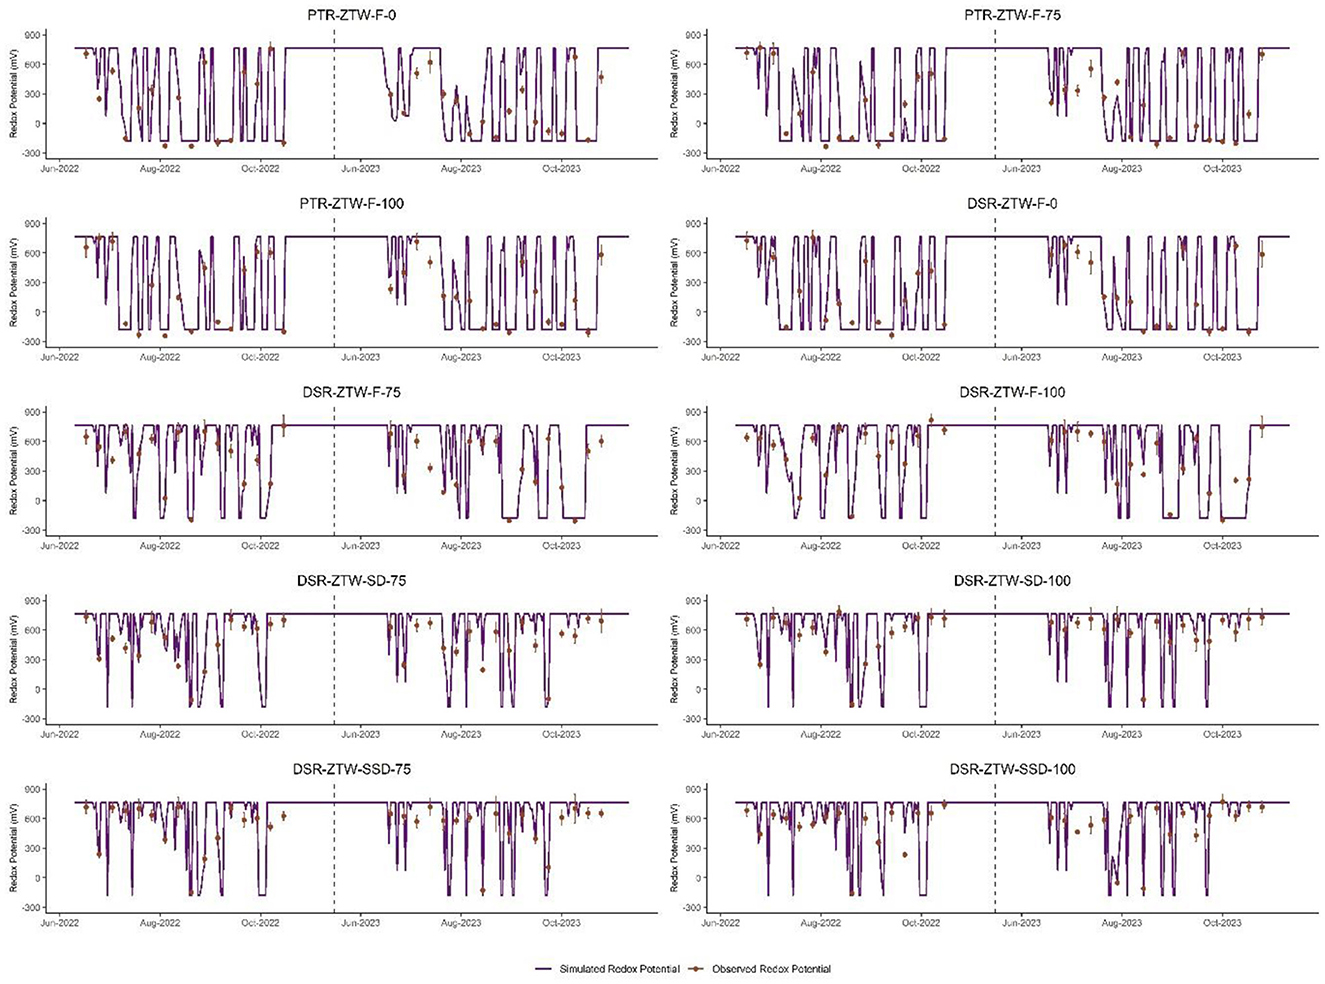
Figure 5. Observed and simulated redox potential of the 0 cm−5 cm soil layer across different treatments of crop establishment techniques, irrigation methods and N rates during a 2-year rice-wheat cropping cycle. The dashed line distinguishes the 2022–23 (calibration phase) and 2023–24 (evaluation phase).
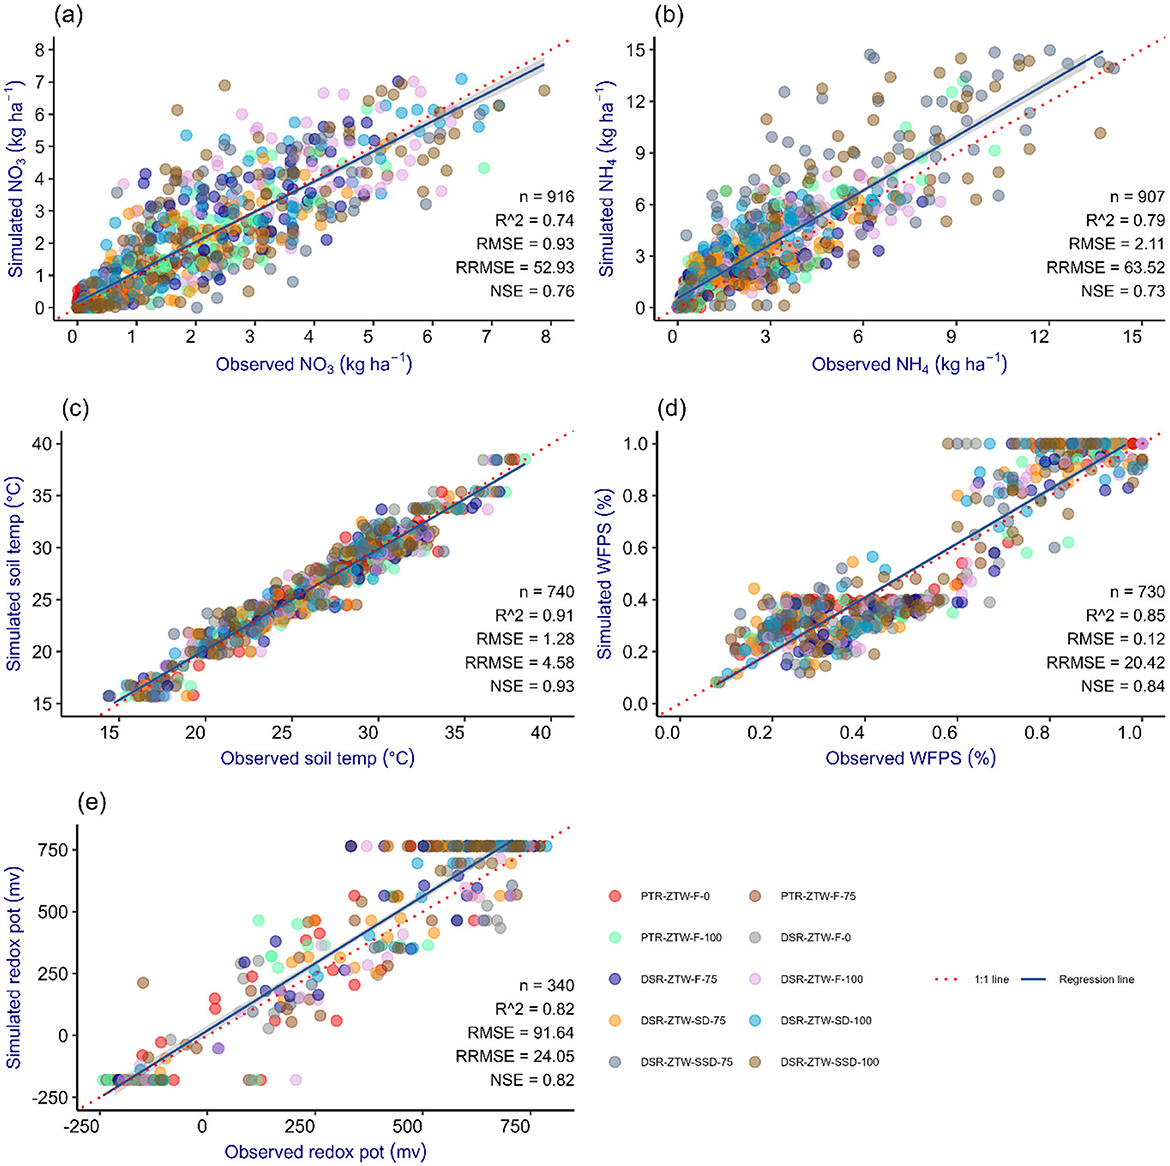
Figure 6. The plots visualize the correlation between the observed and simulated data points for (A) soil , (B) soil , (C) soil temperature, (D) WFPS, and (E) redox potential, respectively.
During both experimental years, the highest observed and simulated system productivity (in terms of rice equivalent yield) was recorded in SSD plots with 100% RDN (12.6 t ha−1 and 13.0 t ha−1, respectively). Yields in SD and PTR plots with 100% RDN were comparable in both years. Across treatments, observed and simulated system yields showed good agreement, though simulated yields were slightly overpredicted, with an RRMSE of 7.8%. The model's accuracy was further validated by a 2-year average RMSE of 779 kg ha−1 and an R2 of 0.93 (Figure 7; Supplementary Table 5). In contrast, simulated system N uptake was consistently lower than observed values, with mean RMSE and RRMSE of 36.4 kg N −1 and 18.1%, respectively, and an R2 of 0.86.
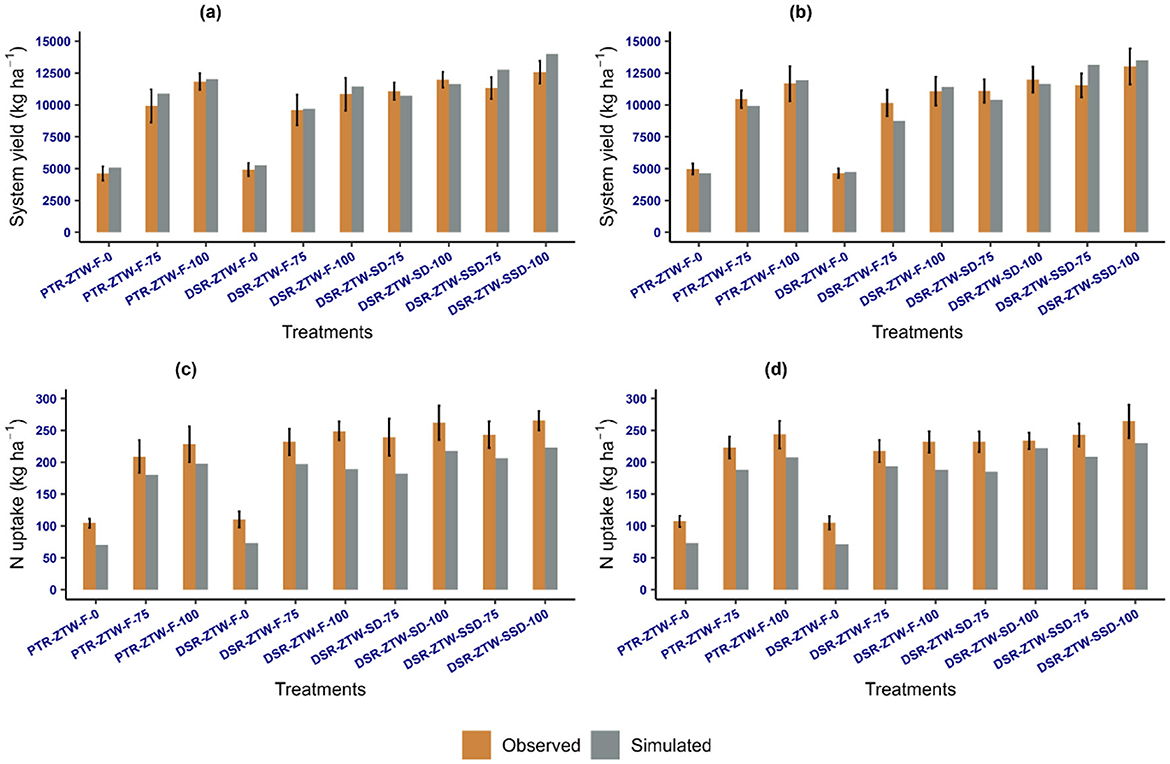
Figure 7. Comparison of simulated and observed rice-wheat system yield and nitrogen uptake for each treatment in the 2022–23 and 2023–24 growing seasons. Error bars represent standard error. (A) RW system yield (2022–23), (B) RW system yield (2023–24), (C) RW system N uptake (2022–23), (D) RW system N uptake (2023–24).
Following successful calibration and evaluation, the DNDC model was used to assess GHG emissions across different crop establishment techniques, irrigation methods, and nitrogen management treatments as a surrogate approach. Simulated SOC at the end of each cropping cycle closely matched observed data, with minimal variation. Among crop establishment methods, CH4 emissions were highest in PTR plots and lowest in DSR plots. Within DSR, flood-irrigated plots emitted the highest CH4 emissions, while micro-irrigated plots (SD and SSD) emitted the lowest (Figure 8; Table 2). N2O emissions were significantly higher in DSR plots, with minimal emissions in PTR plots. N management significantly influenced emissions, with 75% and 100% RDN plots emitting more CH4 than N control plots, although no significant difference was observed between the 75% and 100% RDN plots. N2O emissions were highest in 100% RDN plots, followed by 75% RDN plots, and lowest in N control plots. Yearly variations showed higher CH4 emissions in 2023–24, likely due to increased rainfall during the rice season, while N2O emissions were greater in 2022–23, reflecting optimal conditions for denitrification. Overall, the GWP was 31% lower in DSR plots compared to PTR plots, with SD and SSD plots achieving substantial GWP reductions of 65% and 58%, respectively, compared to PTR.
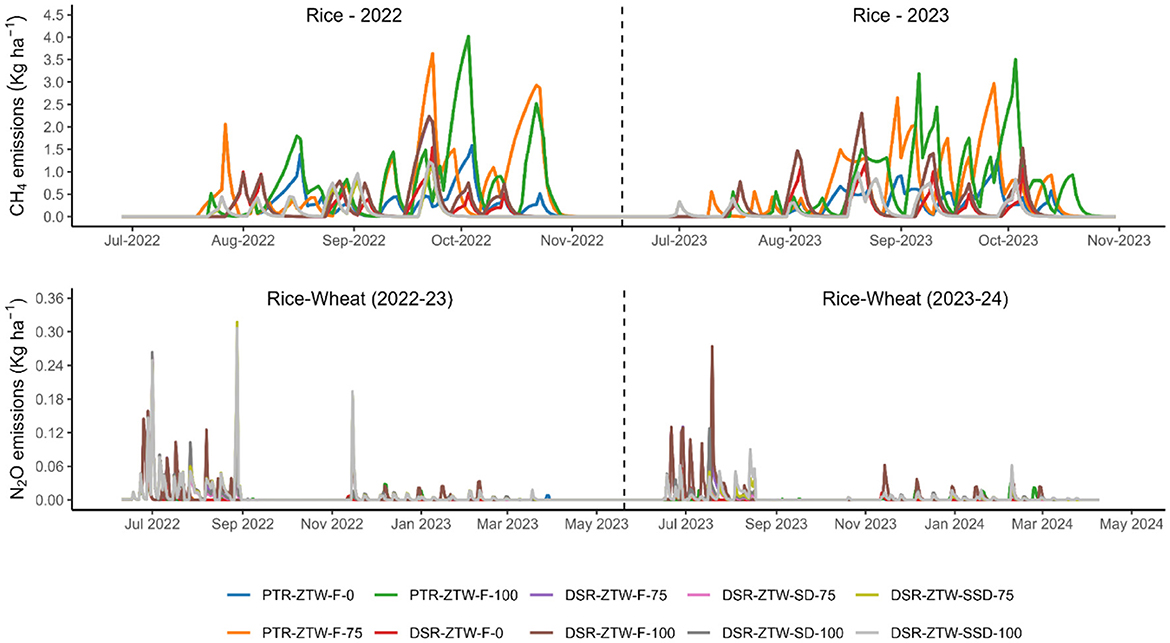
Figure 8. CH4 and N2O fluxes under different crop establishment techniques, irrigation methods and N rates under rice-wheat system over 2-year rotation (model predicted). CH4 emissions are reported only for the rice growing period, while N2O emissions are reported for both the rice and wheat growing seasons. The dashed lines indicate the separation between the rice season and the rice-wheat season for CH4 and N2O emissions, respectively.
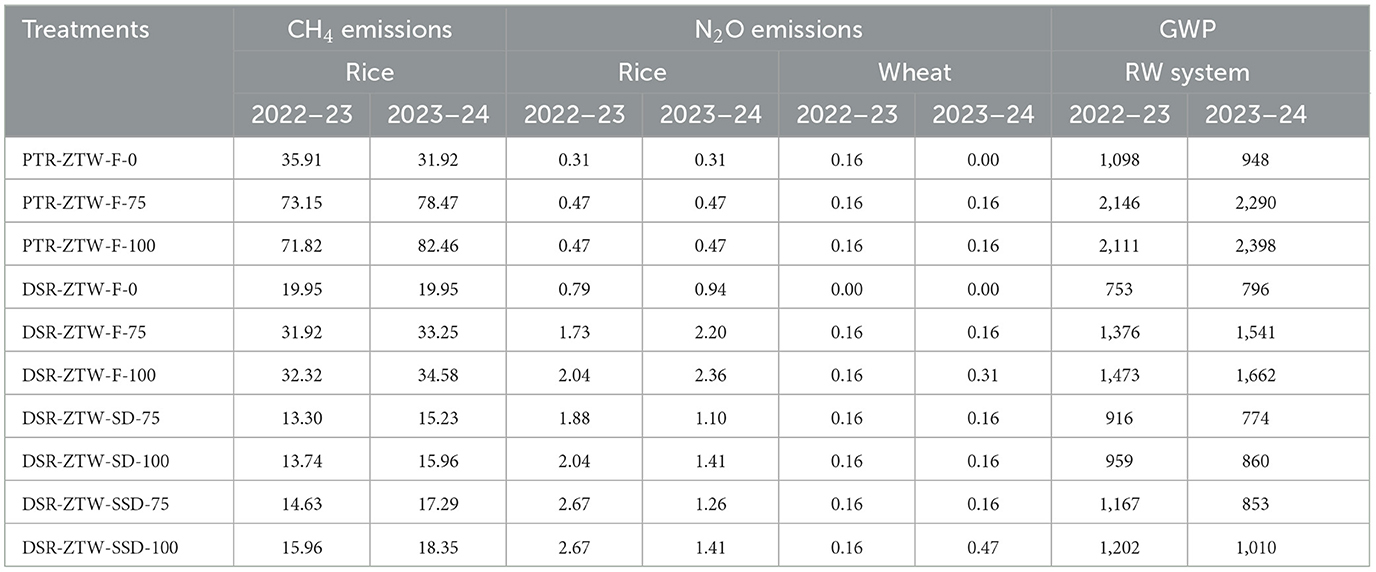
Table 2. Effect of different crop establishment techniques, irrigation methods, and N rates on accumulated CH4 and N2O emissions (in kg ha−1) and GWP (kg CO2-eq.) during the 2-year rice-wheat growing seasons (model predicted).
The DNDC model's sensitivity to input parameters, such as pH, SOC, BD, FC, porosity, microbial activity, residue quantity, flooding duration, and fertilizer (N and P) application rates were evaluated for simulating system grain yield, CH4, and N2O emissions in RWCS under different treatments. The model exhibited varying degrees of sensitivity to these parameters (Figure 9). Grain yield was highly sensitive to pH (−0.2 to −0.69), N fertilizer rate (0.13–0.71), and flooding duration (0.48–0.76). Yield response to N application was significant across treatments except for SSD (0.13). Moderately positive effects on yield were observed for microbial activity, SOC, BD, and FC, while residue quantity had negligible impact (Figure 9). CH4 emissions were most sensitive to microbial activity (0.69–1.24), flooding duration (0.71–0.92), and BD (0.55–0.90), with moderate responses to SOC, FC, and porosity. N and P application rates, pH, and residue quantity had moderate effects on CH4 emissions. N2O emissions showed strong sensitivity to N application rates (0.44–1.30), SOC (0.58–0.83), BD (0.27–1.20), FC (0.23–0.95), and microbial activity (0.43–1.00). In contrast, pH, porosity, and flooding duration negatively influenced N2O emissions, while residue quantity and P application rates had negligible impact. Correlation analysis revealed significant interactions between CH4 flux and soil parameters, with strong correlations to WFPS (R2 = 0.84), Eh (R2 = −0.87), and pH (R2 = −0.91), and moderate correlations with meteorological parameters. Conversely, N2O flux showed no substantial correlations with soil or weather parameters (Figure 10).
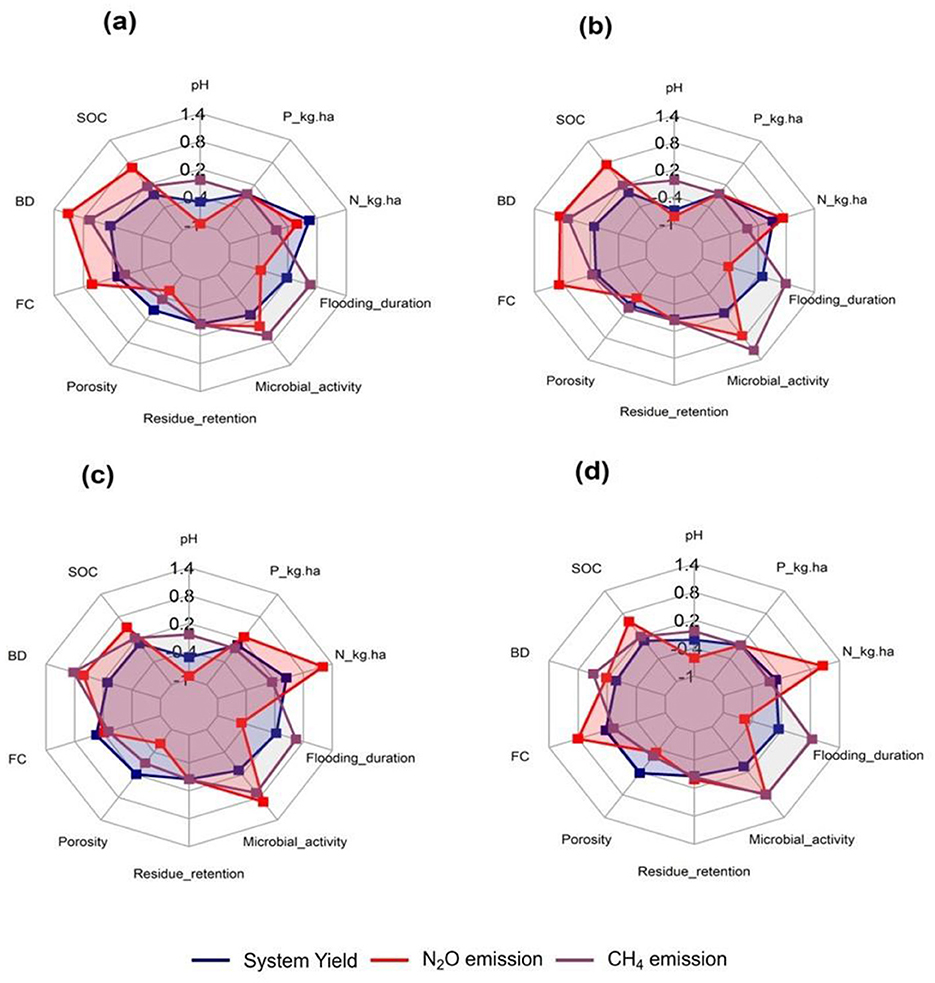
Figure 9. Radar chart illustrating sensitivity indices for yield, CH4, and N2O emissions in the rice-wheat system influenced by different soil properties [pH, soil organic carbon (SOC), bulk density (BD), field capacity (FC) and porosity] and management practices [residue retention (0–1), microbial activity (0–1), flooding duration (days), nitrogen and phosphorous application rates (kg ha−1)]. (A) PTR-ZTW-F, (B) DSR-ZTW-F, (C) DSR-ZTW-SD, (D) DSR-ZTW-SSD.
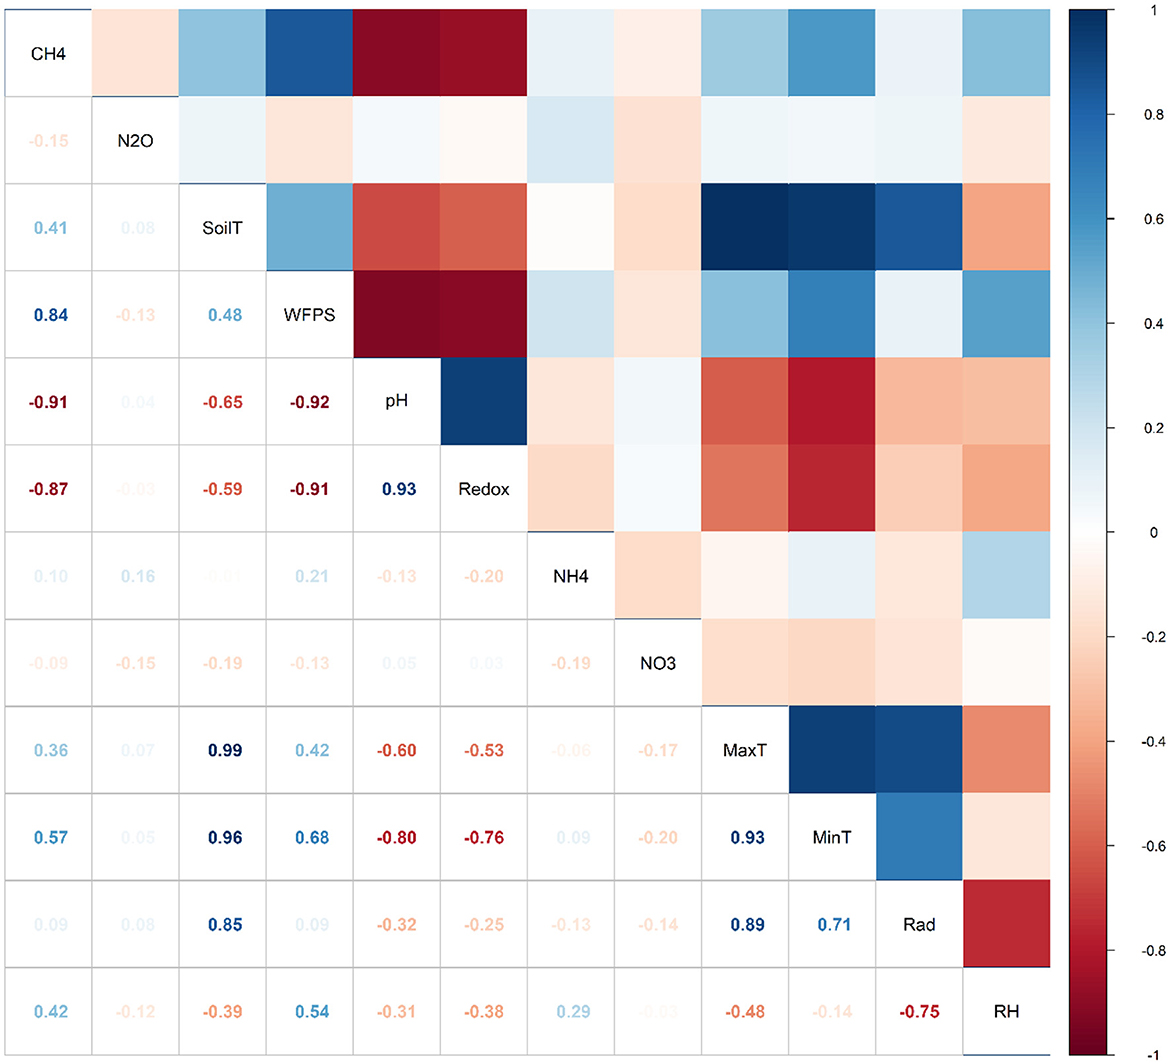
Figure 10. Correlation analysis of CH4 and N2O emissions with soil parameters (WFPS, redox potential, soil and , soil temperature, pH) and weather elements (maximum temperature, minimum temperature, radiation, relative humidity). Red boxes mean negative correlation and blue boxes mean positive correlation.
Among all the simulated components of water balance, transpiration and cumulative evaporation (from both water surface and soil) were identified as the primary water loss pathways. Among crop establishment methods, PTR and flood-irrigated DSR plots used about 40% of the total water for transpiration, while SD and SSD plots utilized ~50% and 64%, respectively. On a 2-year average, SSD plots exhibited the lowest cumulative evaporation losses (571.3 mm), followed by SD (721.3 mm). The highest evaporation losses were recorded in flood-irrigated PTR (990.2 mm) and DSR (861.5 mm) plots. Leaching losses were highest in PTR-flooded plots (629.7 mm), followed by DSR-flooded plots (570.8 mm). In comparison, SD (160.8 mm) and SSD (163.3 mm) plots had significantly lower leaching losses, accounting for about 10% of total water loss (Table 3). Runoff was minimal in micro-irrigation systems (~2%) but highest in PTR (~7%) and flood-irrigated DSR (~5%) plots. MWBE were low and positive in PTR and DSR-flooded plots, while they were high and negative in SD and SSD plots, indicating potential overestimation in the later systems.

Table 3. The model predicted components of water balance under different crop establishment techniques, irrigation methods, and N rates in the 2-year rice-wheat cropping system (in mm ha−1).
The DNDC model provided insights into the major N losses (such as denitrification, volatilization, and leaching) and uptake patterns in different treatments. In addition to fertilizer N, the model accounted for ~30 kg N ha−1 from residue retention in all plots except control plots (~10 kg N ha−1; Table 4). Further, during the rice-growing season, an additional 10–20 kg N ha−1 was contributed through atmospheric N fixation, which was a model default value, and it depends on the soil, atmosphere and growing conditions of the rice crop. Gaseous N losses (N2O, NO, and N2) reached up to 4 kg ha−1 across all treatments. N2 accounted for a significant portion of total gaseous losses, especially in PTR plots, where N2O losses were relatively low. N leaching was ~3.0 kg N ha−1 across most treatments but increased to ~6.0 kg N ha−1 in SSD plots with 100% RDN. NH3–N volatilization was a major loss pathway, ranging from 21%−27% of total N input in PTR plots to 33%−40% in DSR flood-irrigated plots. SD plots also had high NH3–N losses (34%−39%), while SSD plots recorded substantially lower losses (~11%; Table 4). The MNBE revealed higher negative errors in 75% RDN plots across all treatments, whereas 100% RDN plots generally exhibited lower and positive errors, except in SD plots (Table 4).
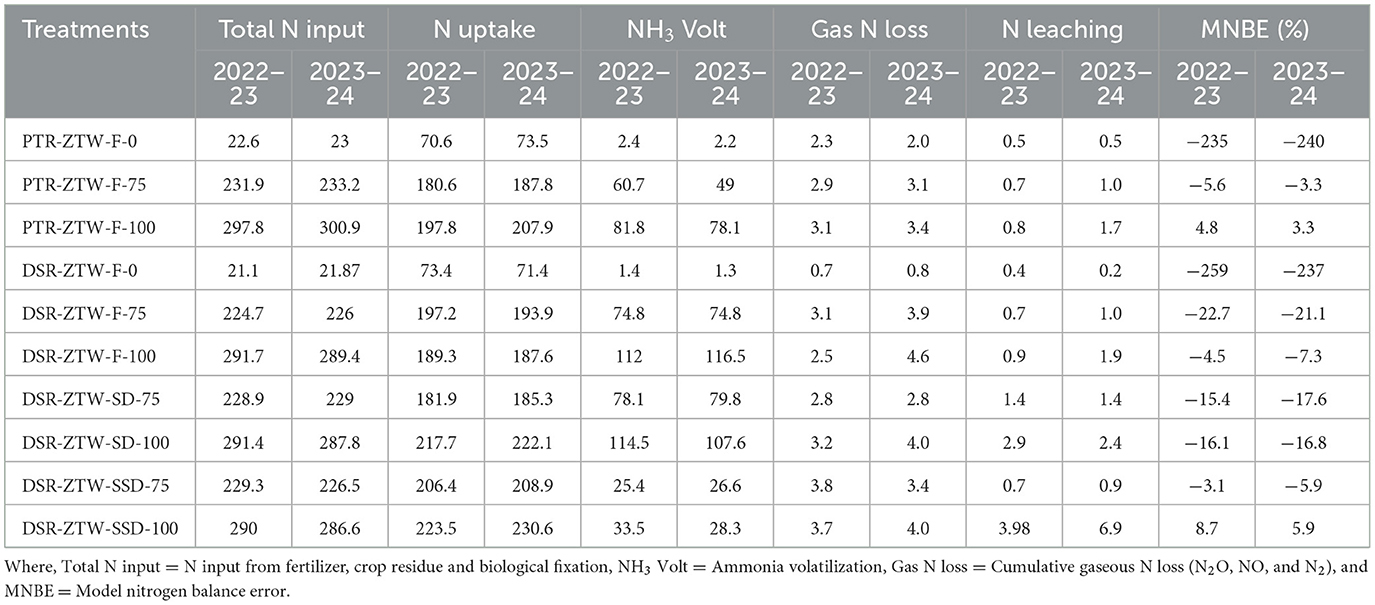
Table 4. The model predicted components of nitrogen balance under different treatments in the rice-wheat cropping system (in kg ha−1).
Treatments integrating DSR with SSD (DSR-ZTW-SSD-75 and DSR-ZTW-SSD-100) ranked highest, with TOPSIS scores of 0.78 and 0.76, respectively, indicating their superior performance in system productivity, profitability, resource use efficiency, and reduced environmental impacts (Figure 11). SD treatments (DSR-ZTW-SD-75 and DSR-ZTW-SD-100) followed closely, demonstrating the effectiveness of micro-irrigation in minimizing water losses and improving nitrogen efficiency. Among flood-irrigated treatments, DSR-ZTW-F-75 and DSR-ZTW-F-100 achieved mid-level rankings, outperforming conventional PTR systems due to improved profitability and resource use efficiency. Conventional practices (PTR-ZTW-F-75 and PTR-ZTW-F-100) ranked lowest, reflecting their limitations in reducing GHG emissions, high water use, and poor nitrogen efficiency (Figure 11). These results highlight the potential of CA practices, particularly those integrating DSR with drip fertigation, to optimize productivity and profitability while minimizing environmental impacts.
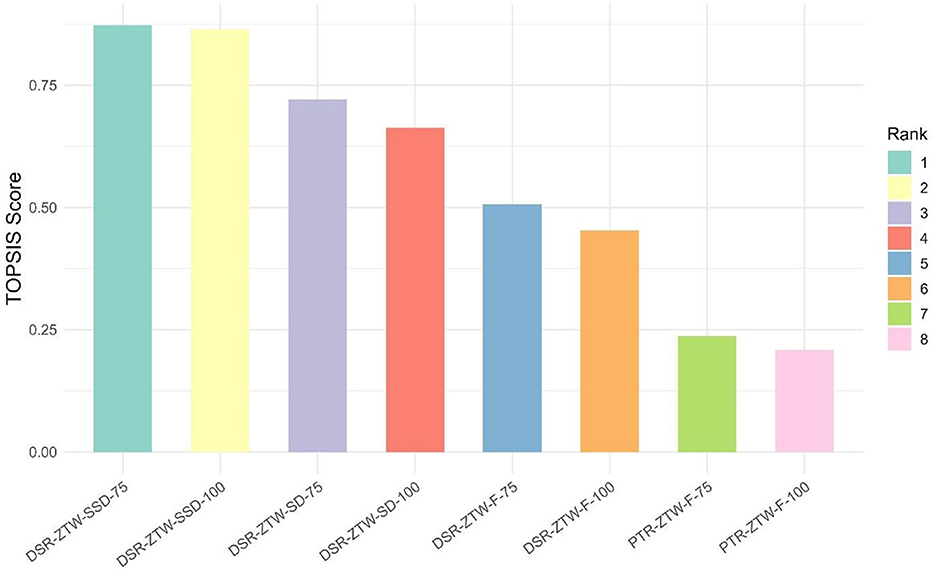
Figure 11. TOPSIS score and ranking of different treatments as effected by different crop establishment techniques, irrigation methods, and nitrogen levels. Treatments were evaluated for seven criteria: system yield, system profitability, GWP, nitrogen uptake, nitrogen loss, water use, and non-productive water loss.
Calibrating the DNDC model is crucial for adapting it to local conditions, given the variability in crop types, management practices, and environmental conditions. Originally designed for temperate climates, parameters such as thermal degree days, optimum temperature, biomass fractions, and C/N ratio must be adjusted for sub-tropical conditions in South-East Asia. Accurate calibration ensures precise simulation of crop growth, nutrient dynamics, and GHG emissions (Zhang and Niu, 2016). In this study, the model was successfully calibrated for different soil parameters (mineral N, WFPS, Eh, soil temperature), crop yield, and N uptake, aligning well with experimental observations.
The higher simulated levels of soil inorganic N during the growing season, with and concentrations 27% and 5% higher than observed values, may be due to slower N transport and transformation processes. This discrepancy likely stems from suboptimal simulation of key processes, including mineralization, nitrification, denitrification, and leaching (Abdalla et al., 2020). The model may also underestimate N immobilization in CA systems, as noted by Brilli et al. (2017). Moreover, higher simulated WFPS appears to have inhibited nitrification and slowed transport between soil layers, increasing and concentrations (Drury et al., 2024). High RRMSE of 53% for and 64% for further highlight these issues, consistent with previous studies (Abdalla et al., 2014; Uzoma et al., 2015; He et al., 2018; Jiang R. et al., 2019). As this study only assessed soil N at a single depth, profile-wide accuracy remains uncertain, underscoring the need for improved algorithms to better simulate nitrogen dynamics in systems with continuous cropping. Further, DNDC model satisfactorily simulated WFPS across different crop establishment techniques, irrigation methods, and nitrogen management treatments, though with slightly less accuracy than soil temperature in the 0 cm−5 cm depth. Consistent with Macharia et al. (2021), the model overestimated WFPS, particularly in control N treatments, likely due to uncertainties in estimating potential evapotranspiration and underestimating crop canopy interception of soil water (Krobel et al., 2010; Uzoma et al., 2015). Similar overestimations have been reported in diverse cropping systems (Abdalla et al., 2014; Cui et al., 2014; Li et al., 2017). Improving the DNDC water module, crop-specific root distribution algorithms, and soil heterogeneity simulation is necessary for better accuracy (Smith et al., 2019). WFPS significantly influences soil conditions, promoting anaerobic conditions that increase CH4 production through methanogenesis (Ussiri and Lal, 2012), while reducing N2O emissions through enhanced water use and lower gas diffusivity (Kuang et al., 2019).
The DNDC model effectively simulates soil temperature, primarily due to its robust representation of heat transfer processes between soil layers, driven by thermal conductivity, temperature gradients, and soil heat capacity (Zhang et al., 2021). This aligns with findings by Cui et al. (2014) and Li et al. (2017), who reported strong correlations (R2: 0.97–1.0 and 0.89–0.97, respectively) between simulated and observed soil temperatures. In wet soils during the rice season, increased heat capacity results in fewer temperature fluctuations, improving prediction accuracy compared to dry-season wheat. However, the present study observed frequent overpredictions, with a RRMSE of 4.6%, likely due to overestimating crop residue insulation and underestimating cumulative crop canopy effects (Jiang et al., 2023). Similar overestimations (2%−6%) were reported by Li et al. (2017), whereas Smith et al. (2008) and Uzoma et al. (2015) noted underestimations (5%−8%) under different agroecological conditions. Accurate soil temperature simulation is critical for modeling CH4 and N2O emissions, as it influences SOC decomposition, water dynamics, microbial activity, and plant growth processes (Wennman and Kätterer, 2006; Hu et al., 2012). Model overestimated Eh, with a mean simulated value of 432 mV compared to the observed 381 mV. While observed Eh showed gradual changes with soil drainage or re-flooding (Islam et al., 2018), the model simulated Eh with abrupt changes, likely contributing to this discrepancy. The DNDC model estimates Eh using the Nernst equation, which depends on oxidation-reduction reactions influenced by WFPS (Li et al., 1992b). Overestimated WFPS as discussed earlier in this section, likely contributed to this overestimation. Since, Eh is a key factor affecting GHG emissions and is critical for simulating carbon and N dynamics in cropping systems (Tao et al., 2024). Enhancing the accuracy of Eh simulations is essential for improving overall model performance.
Overall, the model effectively simulated system yields. In flooded DSR and PTR plots, system yields were consistently overestimated across all N-applied treatments, though the model captured yield variations at different N rates well. Possible reasons include simplification of soil microbial dynamics and root interactions, inadequate local calibration and mainly, the exclusion of stress factors like pests, and diseases (Jiang R. et al., 2019; Zhao et al., 2020). Conversely, the model underestimated yields in micro-irrigation treatments (SD and SSD), likely due to its inability to fully capture and represent the enhanced N and water use efficiency in drip fertigation systems. Meta-analyses indicate that surface and subsurface drip fertigation can boost yields by 20% and 32%, respectively, through improved resource efficiencies (Bhuiyan et al., 2023; Delbaz et al., 2023). Model's N uptake predictions were consistently underestimated, with a mean RMSE of 36.4 kg N ha−1. This discrepancy may stem from simplistic representations of N transformation processes, overestimating losses like leaching and volatilization, consequently leading to lower predicted uptake (Abdalla et al., 2022). Additionally, higher simulated mineral N availability with lower uptake could explain the results, as noted in Section 3.5. To improve accuracy, the DNDC model requires enhancements in its algorithms for crop growth, nutrient uptake, and their interactions under diverse environmental and management conditions (Li et al., 2022).
The DNDC model has been widely evaluated for its performance in simulating GHG emissions, yielding satisfactory results across diverse studies (He et al., 2018; Cui and Wang, 2019; Macharia et al., 2021; Abdalla et al., 2022; Gheisari et al., 2023; Jiang et al., 2023). DNDC models CH4 emissions by simulating production, consumption, and transport processes through intricate soil, plant, and atmospheric interactions. CH4 production is driven by substrate availability from SOC decomposition and root activities. This was followed by reductive reactions between electron donors and acceptors when soil Eh falls below −150 mV under saturated conditions (Li et al., 2004; Hakemain and Rosenzweig, 2007). SOC decomposition generates DOC, influenced by soil temperature and moisture (Li et al., 1992a, 2012). CH4 consumption occurs via oxidation reactions involving electron exchange between CH4 and oxygen, while transport involves plant-mediated pathways, effusion, and diffusion (Fumoto et al., 2008; Zhang et al., 2014). N2O emissions are regulated by nitrification and denitrification processes, activated when soil Eh is below +500 mV and moisture is under 60% WFPS, with acting as a substrate (Jamali et al., 2016).
During the experimental period, prolonged saturation in PTR plots resulted in higher CH4 emissions and lower N2O emissions. Conversely, DSR-flooded, SD, and SSD plots exhibited higher N2O and lower CH4 emissions due to reduced soil moisture (Johnson-Beebout et al., 2009; Reddy et al., 2025). Control treatments showed lower CH4 emissions compared to 75% and 100% RDN treatments, as the model correlates emissions with above-ground and root biomass. By accurately capturing the dynamics of soil moisture, temperature, mineral N, Eh, and plant growth, the DNDC model provides realistic estimates of GHG emissions.
Sensitivity analysis is a key component of the study, enabling identification of critical parameters influencing carbon and N dynamics in agroecosystems. Increasing soil pH reduces proton (H+) activity, promoting volatilization through transformation of to NH3 and creating less favorable conditions for denitrification, thereby lowering N2O emissions (Ingraham and Salas, 2019). However, higher soil pH often results in yield penalties due to reduced macro- and micronutrient availability and increased nutrient losses. The slightly alkaline nature of the experimental soil suppressed CH4 emissions, consistent with findings by Malyan et al. (2016), though some studies report negligible effects of pH on CH4 emissions (Guo et al., 2023). SOC and microbial activity were positively sensitive to system yield and GHG emissions. SOC enhances N mineralization, increasing soil N availability and contributing to higher emissions of N2O and CH4. Increased N availability enhances nitrification and denitrification, raising N2O emissions (Ding et al., 2023). Higher SOC levels in anaerobic rice fields support methanogenic bacteria, enabling CH4 production, while also improving nutrient availability, soil structure, and microbial activity for better root growth and productivity (Jiang et al., 2023). Moderate increases in soil BD and FC enhance yields by improving moisture retention and nutrient uptake but create anaerobic conditions, increasing N2O and CH4 emissions (Gheisari et al., 2023; Zhang et al., 2024). Compacted soils restrict root growth, while higher porosity in drip-fertigated systems boosts yield. Mixed findings on the effects of soil compaction on GHG emissions highlights the need for further investigations (Schmidt et al., 2018; Cui and Wang, 2019).
Crop residue or straw incorporation slightly reduces system yield due to N immobilization during early decomposition, temporarily limiting its availability to plants (Islam et al., 2022). Balanced carbon and N inputs from straw may stabilize microbial processes, leading to negligible effects on soil N2O emissions (Chen et al., 2014). Upland conditions and increased methanotroph activity can offset straw-mediated CH4 emissions, preventing a net increase (Zou et al., 2004). Flooding duration significantly affects rice yield and GHG emissions. Extended flooding promotes anaerobic conditions, resulting in higher CH4 emissions and lower N2O emissions (Arenas-Calle et al., 2024). These conditions also enhance rice productivity by improving nutrient availability and suppressing weed competition, creating an optimal environment for rice growth (Sudhir-Yadav et al., 2011).
Higher N application significantly boosts system yield but also increases CH4 and N2O emissions. As the most limiting nutrient, N enhances plant growth by improving photosynthetic and metabolic rates, resulting in higher yields (Li et al., 1992b). However, excessive N application stimulates nitrification and denitrification, exponentially increasing cumulative and yield-scaled N2O emissions beyond the optimal rate (Song X. et al., 2019). Elevated N inputs also lower the C:N ratio, enhancing substrate decomposition, increasing DOC availability for methanogens, and raising CH4 production (Fumoto et al., 2008; Drury et al., 2024). Enhanced plant growth further facilitates CH4 transport to the atmosphere. In contrast, P application has minimal effects on yield and emissions in non-limiting soils. Additional P supply does not significantly influence crop productivity or processes like denitrification and methanogenesis, leading to negligible changes in CH4 and N2O emissions (Song T. et al., 2019; Gebremichael et al., 2022).
High WFPS promotes soil saturation and anaerobic conditions, creating an ideal environment for methanogenesis. Similarly, low Eh values indicate reduced conditions favoring methanogens, which thrive in the absence of electron acceptors like O2 (Li et al., 1992a). High soil pH (>8.8) negatively correlates with CH4 flux, as it affects substrate availability (acetate and hydrogen), which are essential for methanogenesis (Malyan et al., 2016). Further, alkaline conditions also enhance sulfate-reducing bacteria activity, competing with methanogens for hydrogen and reducing CH4 production (Malyan et al., 2016). N2O flux showed poor correlation with soil and weather parameters, contrary to studies linking it to -N, -N, and WFPS (Jiang R. et al., 2019; Wu et al., 2023). This discrepancy likely stems from prolonged saturated and anaerobic conditions during the rice season, which reduce N2O emissions by favoring complete denitrification to N2 and lowering availability (Gupta et al., 2016).
The DNDC model reliably predicted water balance, accurately simulating WFPS (%) at regular intervals. In flooded PTR and DSR plots, high irrigation levels resulted in high evaporation losses (Mousavi et al., 2009). Conversely, micro-irrigated systems (SD, SSD) exhibited lower evaporation losses due to controlled irrigation. Transpiration losses correlated with plant growth and yield, as higher biomass production required increased transpiration (Rana et al., 2023). Leaching losses were higher in flooded systems due to excess irrigation beyond saturation (Sudhir-Yadav et al., 2011). Although previous studies suggest higher leaching in DSR compared to PTR due to the absence of puddling, the model showed similar losses in both systems, likely due to limited irrigation and silty loam soil texture with low hydraulic conductivity (Jiang Y. et al., 2019). Leaching and evapotranspiration losses observed were lower and more consistent than in continuous flooding systems reported for similar regions (Sudhir-Yadav et al., 2011). Water savings from alternate wetting and drying, compared to continuous flooding, were primarily due to reduced deep drainage with minimal impact on evapotranspiration (Arora, 2006; Belder et al., 2007; Bouman et al., 2007). In micro-irrigation systems, frequent but limited water applications minimized leaching and runoff, except during precipitation events (Patra K. et al., 2023). Whereas in flood-irrigated DSR and PTR plots, significant runoff occurred although the model did not fully capture these losses. The model failed to predict the seepage losses, even though these losses might be minimal. Positive and negative MWBEs observed in flooded and micro-irrigated plots may stem from structural uncertainties and suboptimal water budgeting by the model.
Nitrogen balance simulations revealed substantial NH3 volatilization losses under high soil temperature and moisture following N application. Urea hydrolysis, driven by urease activity, is influenced by soil pH, temperature, and moisture, with higher pH accelerating NH3 volatilization (Cabrera et al., 1991; Kissel et al., 2008; Fisher et al., 2017). Flood and SD-irrigated DSR plots experienced higher volatilization losses than flood-irrigated PTR plots, as puddling in PTR neutralized soil pH, reducing volatilization losses. The slightly alkaline soil conditions in DSR plots further intensified volatilization (Gupta et al., 2016). SSD systems, however, reduced volatilization losses by 76% compared to surface-applied flooded DSR systems, aligning with meta-analyses showing up to 86% reduction of NH3 volatilization in paddy crops with SSD fertigation (Bhuiyan et al., 2023). Leaching losses were low in surface-applied systems (0.7 kg N ha−1−2.9 kg N ha−1), attributed to high volatilization and low N availability. In SSD systems, leaching losses were higher (4.0 kg N ha−1–6.9 kg N ha−1), especially at 100% RDN, due to subsurface application and reduced volatilization (Drury et al., 2024). Higher N application (100% RDN) also increased gaseous N losses due to lower N use efficiency. PTR plots exhibited higher denitrification under anaerobic conditions, reducing to N2, resulting in cumulative gaseous losses comparable to those in DSR systems, despite DSR having higher N2O emissions (Zhao et al., 2020). The MNBE was high in 75% RDN-treated plots but low in 100% RDN-treated plots, indicating the model's limitations in accurately capturing N use efficiency at varying application rates.
Adoption of DSR with SSD under CA emerged as the most efficient system, combining high productivity, reduced GHG emissions, improved nitrogen uptake, and lower water use. This efficiency is further amplified by a ~25% reduction in N application without much compromising with productivity, showcasing significant input savings and environmental benefits. These findings align with previous studies indicating that SSD systems enhance resource productivity by minimizing evaporation leaching and volatilization losses while improving nutrient availability in the root zone (Bhuiyan et al., 2023; Rana et al., 2023). The meta-analysis conducted by Bhuiyan et al. (2023) also states that SSD can save 30% of N without yield penalty and lowers GHG emissions. Similarly, SD treatments demonstrated strong performance, supporting the efficacy of micro-irrigation technologies in reducing non-productive water losses and addressing nitrogen inefficiencies (Delbaz et al., 2023). In contrast, conventional systems such as PTR with flood irrigation ranked lowest due to their resource-intensive nature. High water use, significant nitrogen volatilization and elevated GHG emissions, primarily CH4 due to prolonged anaerobic conditions, have been widely documented in these systems (Kissel et al., 2008; Sudhir-Yadav et al., 2011; Schmidt et al., 2018). These limitations highlight the pressing need of transitioning to low-emission systems such as DSR. However, DSR with traditional flooding alone is insufficient. To fully realize the potential of DSR, integrating it with CA and precision irrigation methods like SSD is essential to enhance resource efficiency, maximize nitrogen uptake, and ensure environmental sustainability (Sidhu et al., 2019; Patra K. et al., 2023). This integrated approach offers a scalable solution to address challenges in resource-constrained agricultural ecosystems.
Thus, optimizing yield emission trade-offs in the RWCS enhances system resilience in terms of productivity, profitability and environmental sustainability. By this way, utilization of DNDC model insights into eco-optimization of the RWCS can be an important tool in evaluating the overall sustainability of the agricultural system.
The present study evaluated the DNDC model's performance in simulating soil parameters, system productivity, and environmental impacts in a 5-year long RWCS experiment in the eastern IGPs of India. The calibrated model effectively simulated soil mineral N ( and ), WFPS, Eh, soil temperature, system yield, and nitrogen uptake with reasonable accuracy. Sensitivity analysis highlighted the importance of soil and management factors in maintaining a yield-emission balance. Integrating resource-conserving technologies like CA, drip fertigation, and DSR improved productivity and resource efficiency while reducing CH4 emissions by 70%−80%. Although N2O emissions increased 2.5 times, the overall GWP was reduced by 58%−65%, showcasing the environmental benefits of these technologies. The TOPSIS analysis further supported the field results, ranking DSR-ZTW-SSD system as the most sustainable treatment, achieving the highest grain yields, improved nitrogen uptake, reduced GHG emissions, and minimized water losses. Despite the model's robust performance, further refinement is required to adapt its algorithms to tropical and subtropical conditions. This study emphasizes the potential of integrating CA, drip fertigation, and DSR to enhance yields, conserve resources, and lower GWP, thereby ensuring the sustainability of RWCS in the challenging agroecological zones like the eastern IGP.
The original contributions presented in the study are included in the article/Supplementary material, further inquiries can be directed to the corresponding authors.
KSR: Data curation, Formal analysis, Investigation, Methodology, Software, Writing – original draft, Writing – review & editing. CMP: Data curation, Formal analysis, Methodology, Writing – original draft, Writing – review & editing. PP: Conceptualization, Supervision, Writing – review & editing. ASa: Data curation, Formal analysis, Investigation, Methodology, Software, Writing – review & editing. HSN: Conceptualization, Data curation, Methodology, Supervision, Writing – review & editing. KP: Formal analysis, Investigation, Writing – original draft. DRS: Conceptualization, Methodology, Software, Writing – review & editing. GSR: Software, Writing – original draft. ASi: Formal analysis, Methodology, Writing – review & editing. SB: Writing – review & editing. SK: Conceptualization, Methodology, Supervision, Writing – review & editing. VK: Conceptualization, Supervision, Writing – review & editing.
The author(s) declare that no financial support was received for the research, authorship, and/or publication of this article.
The first author gratefully acknowledges the Indian Council of Agricultural Research (ICAR) and ICAR-Indian Agricultural Research Institute (IARI) for providing the scholarship and necessary facilities. Heartfelt gratitude is also extended to the International Rice Research Institute (IRRI), South Asia Regional Centre (ISARC), Varanasi, India, for supporting the field experimentation, lab facilities, and overall assistance during the PhD research work. The financial support provided by IRRI and Jain Irrigation through IRRI's Direct Seeded Rice Consortium is also acknowledged. The support from the Director and staff of the Division of Agronomy, ICAR-IARI, New Delhi, is also acknowledged. Special thanks go to Dr. Sudhanshu Singh, Director of ISARC, Dr. P. Soman, Chief Agronomist, Jain Irrigation (Global), Jalgaon, Maharashtra, Dr. Debabrata Nath, Assistant Scientist at ISARC, and Dr. Renu Pandey, Head, Dr. D. K. Sharma, Pr. Scientists at ICAR-IARI, New Delhi, as well as Dr. S. L. Jat, Sr. Scientist at ICAR-IIMR, for their assistance in data management and analysis work.
The authors declare that the research was conducted in the absence of any commercial or financial relationships that could be construed as a potential conflict of interest.
All claims expressed in this article are solely those of the authors and do not necessarily represent those of their affiliated organizations, or those of the publisher, the editors and the reviewers. Any product that may be evaluated in this article, or claim that may be made by its manufacturer, is not guaranteed or endorsed by the publisher.
The Supplementary Material for this article can be found online at: https://www.frontiersin.org/articles/10.3389/fsufs.2025.1499425/full#supplementary-material
Abdalla, M., Hastings, A., Helmy, M., Prescher, A., Osborne, B., Lanigan, G., et al. (2014). Assessing the combined use of reduced tillage and cover crops for mitigating greenhouse gas emissions from arable ecosystem. Geoderma 223–225, 9–20. doi: 10.1016/j.geoderma.2014.01.030
Abdalla, M., Song, X., Ju, X., Topp, C. F. E., and Smith, P. (2020). Calibration and validation of the DNDC model to estimate nitrous oxide emissions and crop productivity for a summer maize-winter wheat double cropping system in Hebei, China. Environ. Pollut. 262:114199. doi: 10.1016/j.envpol.2020.114199
Abdalla, M., Song, X. T., Ju, X. T., and Smith, P. (2022). Evaluation of the DNDC model to estimate soil parameters, crop yield and nitrous oxide emissions for alternative long-term multi-cropping systems in the North China plain. Agron. Basel 12:109. doi: 10.3390/agronomy12010109
Arenas-Calle, L., Sherpa, S., Rossiter, D., Nayak, H., Urfels, A., Kritee, K., et al. (2024). Hydrologic variability governs GHG emissions in rice-based cropping systems of Eastern India. Agric. Water Manag. 301:108931. doi: 10.1016/j.agwat.2024.108931
Arora, V. K. (2006). Application of a rice growth and water balance model in an irrigated semi-arid subtropical environment. Agric. Water Manag. 83, 51–57. doi: 10.1016/j.agwat.2005.09.004
Banjara, T. R., Bohra, J. S., Kumar, S., Singh, T., Shori, A., and Prajapat, K. (2021). Sustainable alternative crop rotations to the irrigated rice-wheat cropping system of Indo-Gangetic plains of India. Arch. Agron. Soil Sci. 67, 1–18. doi: 10.1080/03650340.2021.1912324
Begum, K., Kuhnert, M., Yeluripati, J. B., Ogle, S. M., Parton, W. J., Williams, S. A., et al. (2019). Modeling greenhouse gas emissions and mitigation potentials in fertilized paddy rice fields in Bangladesh. Geoderma 341, 206–215. doi: 10.1016/j.geoderma.2019.01.047
Belder, P., Bouman, B. A. M., and Spiertz, J. H. J. (2007). Exploring options for water savings in lowland rice using a modelling approach. Agric. Syst. 92, 91–114. doi: 10.1016/j.agsy.2006.03.001
Bhuiyan, M. S. I., Rahman, A., Loladze, I., Das, S., and Kim, P. J. (2023). Subsurface fertilization boosts crop yields and lowers greenhouse gas emissions: a global meta-analysis. Sci. Total Environ. 876:162712. doi: 10.1016/j.scitotenv.2023.162712
Bouman, B. A. M., Feng, L., Tuong, T. P., Lu, G., Wang, H., and Feng, Y. (2007). Exploring options to grow rice using less water in northern China using a modelling approach II. Quantifying yield, water balance components, and water productivity. Agric. Water Manag. 88, 23–33. doi: 10.1016/j.agwat.2006.10.005
Brilli, L., Bechini, L., Bindi, M., Carozzi, M., Cavalli, D., Conant, R., et al. (2017). Review and analysis of strengths and weaknesses of agro-ecosystem models for simulating C and N fluxes. Sci. Total Environ. 598, 445–470. doi: 10.1016/j.scitotenv.2017.03.208
Cabrera, M. L., Kissel, D. E., and Bock, B. R. (1991). Urea hydrolysis in soil: effects of urea concentration and soil pH. Soil Biol. Biochem. 23, 1121–1124. doi: 10.1016/0038-0717(91)90023-D
Chakraborty, S. (2022). TOPSIS and modified TOPSIS: a comparative analysis. Decis. Anal. 2:100021. doi: 10.1016/j.dajour.2021.100021
Chauhan, B. S., Mahajan, G., Sardana, V., Timsina, J., and Jat, M. L. (2012). Productivity and sustainability of the rice–wheat cropping system in the Indo-Gangetic plains of the Indian subcontinent: problems, opportunities, and strategies. Adv. Agron. 117, 315–369. doi: 10.1016/B978-0-12-394278-4.00006-4
Chen, D., Wang, C., Shen, J. L., Li, Y., and Wu, J. S. (2018). Response of CH4 emissions to straw and biochar applications in double-rice cropping systems: insights from observations and modeling. Environ. Pollut. 235, 95–103. doi: 10.1016/j.envpol.2017.12.041
Chen, X., Cui, Z., Fan, M., Vitousek, P., Zhao, M., Ma, W., et al. (2014). Producing more grain with lower environmental costs. Nature 514, 486–489. doi: 10.1038/nature13609
Chun, J. A., Shim, K. M., Min, S. H., and Wang, Q. (2016). Methane mitigation for flooded rice paddy systems in South Korea using a process-based model. Paddy Water Environ. 14, 123–129. doi: 10.1007/s10333-015-0484-0
Cui, F., Zheng, X., Liu, C., Wang, K., Zhou, Z., and Deng, J. (2014). Assessing biogeochemical effects and best management practice for a wheat-maize cropping system using the DNDC model. Biogeosciences 11, 91–107. doi: 10.5194/bg-11-91-2014
Cui, G., and Wang, J. (2019). Improving the DNDC biogeochemistry model to simulate soil temperature and emissions of nitrous oxide and carbon dioxide in cold regions. Sci. Total Environ. 687, 61–70. doi: 10.1016/j.scitotenv.2019.06.054
Delbaz, R., Ebrahimian, H., Abbasi, F., Ghameshlou, A. N., Liaghat, A., and Ranazadeh, D. (2023). A global meta-analysis on surface and drip fertigation for annual crops under different fertilization levels. Agric. Water Manag. 289:108504. doi: 10.1016/j.agwat.2023.108504
Dhanda, S., Yadav, A., Yadav, D. B., and Chauhan, B. S. (2022). Emerging issues and potential opportunities in the rice-wheat cropping system of North-Western India. Front. Plant Sci. 13:832683. doi: 10.3389/fpls.2022.832683
Ding, W. H., Chang, N. J., Zhang, G. L., Kang, J. H., Yi, X. P., Zhang, J., et al. (2023). Soil organic carbon changes in China's croplands: a newly estimation based on DNDC model. Sci. Total Environ. 905:167107. doi: 10.1016/j.scitotenv.2023.167107
Drury, C. F., Smith, W., Grant, B., Reynolds, W. D., Yang, X., and Phillips, L. A. (2024). ‘Pipes & valves': managing crop production and environmental impact by mitigating ammonia, nitrous oxide, and nitrate losses. Field Crops Res. 307:109250. doi: 10.1016/j.fcr.2024.109250
Fisher, K. A., Yarwood, S. A., and James, B. R. (2017). Soil urease activity and bacteria ureC gene copy numbers: effect of pH. Geoderma 285, 1–8. doi: 10.1016/j.geoderma.2016.09.012
Forster, P., Storelvmo, T., Armour, K., Collins, W., Dufresne, J.-L., Frame, D., et al. (2021). “The earth's energy budget, climate feedbacks, and climate sensitivity,” in Climate Change 2021: The Physical Science Basis. Contribution of Working Group I to the Sixth Assessment Report of the Intergovernmental Panel on Climate Change, eds. V. Masson-Delmotte, P. Zhai, A. Pirani, S.L. Connors, C. Péan, S. Berger, et al. (Cambridge; New York, NY: Cambridge University Press), 923–1054.
Fumoto, T., Kobayashi, K., Li, C., Yagi, K., and Hasegawa, T. (2008). Revising a process-based biogeochemistry model (DNDC) to simulate methane emission from rice paddy fields under various residue management and fertilizer regimes. Glob. Chang. Biol. 14, 382–402. doi: 10.1111/j.1365-2486.2007.01475.x
Gebremichael, A. W., Wall, D. P., O'Neill, R. M., Krol, D. J., Brennan, F., Lanigan, G., et al. (2022). Effect of contrasting phosphorus levels on nitrous oxide and carbon dioxide emissions from temperate grassland soils. Sci. Rep. 12:2602. doi: 10.1038/s41598-022-06661-2
Gheisari, A., Asgharipour, M. R., Mousavi-Nik, M., Ghanbari, A., and Javaheri, M. A. (2023). Utilization of the DNDC model to estimate yield and CO2 and CH4 emissions in a cotton-wheat rotation under the influence of various tillage treatments. Ecol. Model. 481:110357. doi: 10.1016/j.ecolmodel.2023.110357
Giltrap, D. L., Li, C., and Saggar, S. (2010). DNDC: a process-based model of greenhouse gas fluxes from agricultural soils. Agric. Ecosyst. Environ. 136, 292–300. doi: 10.1016/j.agee.2009.06.014
Guo, Y., Zhang, G., Abdalla, M., Kuhnert, M., Bao, H., Xu, H., et al. (2023). Modelling methane emissions and grain yields for a double-rice system in Southern China with DAYCENT and DNDC models. Geoderma 431:116364. doi: 10.1016/j.geoderma.2023.116364
Gupta, D. K., Bhatia, A., Kumar, A., Das, T. K., Jain, N., Tomer, R., et al. (2016). Mitigation of greenhouse gas emission from rice-wheat system of the Indo-Gangetic plains: through tillage, irrigation and fertilizer management. Agric. Ecosyst. Environ. 230, 1–9. doi: 10.1016/j.agee.2016.05.023
Hagin, J., Sneh, M., and Lowengart-Aycicegi, A. (2003). Fertigation- Fertilization Through Irrigation. IPI Research Topics No. 23. Basel: International Potash Institute. Available at: https://www.ipipotash.org/publications/publication-39 (accessed June 14, 2024).
Hakemain, A. S., and Rosenzweig, A. C. (2007). The biochemistry of methane oxidation. Annu. Rev. Biochem. 76, 223–241. doi: 10.1146/annurev.biochem.76.061505.175355
He, W. T., Yang, J. Y., Drury, C. F., Smith, W. N., Grant, B. B., He, P., et al. (2018). Estimating the impacts of climate change on crop yields and N2O emissions for conventional and no-tillage in Southwestern Ontario, Canada. Agric. Syst. 159, 187–198. doi: 10.1016/j.agsy.2017.01.025
Hu, L., Jian-jun, Q., Li-gang, W., Ming-yi, X., Zhi-qiang, L., and Wei, W. (2012). Estimates of N2O emissions and mitigation potential from a spring maize field based on DNDC model. J. Integr. Agric. 11, 2067–2078. doi: 10.1016/S2095-3119(12)60465-1
Humphreys, E., and Gaydon, D. S. (2015). Options for increasing the productivity of the rice–wheat system of North-West India while reducing groundwater depletion. Part 2. Is conservation agriculture the answer? Field Crops Res. 173, 81–94. doi: 10.1016/j.fcr.2014.11.019
Hwang, C. L., and Yoon, K. (1981). Multiple Attribute Decision Making: Methods and Applications, a State-of-the-Art Survey. New York: Springer-Verlag. doi: 10.1007/978-3-642-48318-9_3
ICAR Annual Report (2023). Department of Agriculture and Farmers Welfare, Ministry of Agriculture and Farmers Welfare, Government of India. Available at: www.agricoop.nic.in (accessed July 7, 2024).
Ingraham, P. A., and Salas, W. A. (2019). Assessing nitrous oxide and nitrate leaching mitigation potential in US corn crop systems using the DNDC model. Agric. Syst. 175, 79–87. doi: 10.1016/j.agsy.2019.05.005
IPCC (2021). “Climate change the physical science basis,” in Climate Change 2021: The Physical Science Basis. Contribution of Working Group I to the Sixth Assessment Report of the Intergovernmental Panel on Climate Change, eds. V. Masson-Delmotte, P. Zhai, A. Pirani, S.L. Connors, C. Pean, S. Berger, et al. (Cambridge; New York, NY: Cambridge University Press), 2391.
Islam, M. U., Guo, Z., Jiang, F., and Peng, X. (2022). Does straw return increase crop yield in the wheat-maize cropping system in China? A meta-analysis. Field Crops Res. 279:108447. doi: 10.1016/j.fcr.2022.108447
Islam, S. F., van Groenigen, J. W., Jensen, L. S., Sander, B. O., and de Neergaard, A. (2018). The effective mitigation of greenhouse gas emissions from rice paddies without compromising yield by early-season drainage. Sci. Total Environ. 612, 1329–1339. doi: 10.1016/j.scitotenv.2017.09.022
Jamali, H., Quayle, W., Scheer, C., and Baldock, J. (2016). Mitigation of N2O emissions from surface-irrigated cropping systems using water management and the nitrification inhibitor DMPP. Soil Res. 56, 301–312. doi: 10.1071/SR15315
Jamieson, P. D., Porter, J. R., and Wilson, D. R. (1991). A test of the computer simulation model ARC-WHEAT1 on wheat crops grown in New Zealand. Field Crops Res. 27, 337–350. doi: 10.1016/0378-4290(91)90040-3
Jat, M. L., Chakraborty, D., Gathala, M. K., Ladha, J. K., McDonald, A., Rana, D. S., et al. (2020). Conservation agriculture for sustainable intensification in South Asia. Nat. Sustain. 3, 336–343. doi: 10.1038/s41893-020-0500-2
Jiang, R., He, W. T., Zhou, W., Hou, Y. P., Yang, J. Y., and He, P. (2019). Exploring management strategies to improve maize yield and nitrogen use efficiency in northeast China using the DNDC and DSSAT models. Comput. Electron. Agric. 166:104988. doi: 10.1016/j.compag.2019.104988
Jiang, Y., Carrijo, D., Huang, S., Chen, J., Balaine, N., Zhang, W., et al. (2019). Water management to mitigate the global warming potential of rice systems: a global meta-analysis. Field Crops Res. 234, 47–54. doi: 10.1016/j.fcr.2019.02.010
Jiang, Z. W., Yang, S. H., Smith, P., Abdalla, M., Pang, Q. Q., Xu, Y., et al. (2023). Development of DNDC-BC model to estimate greenhouse gas emissions from rice paddy fields under combination of biochar and controlled irrigation management. Geoderma 433:116450. doi: 10.1016/j.geoderma.2023.116450
Johnson-Beebout, S. E., Angeles, O. R., Alberto, M. C. R., and Buresh, R. J. (2009). Simultaneous minimization of nitrous oxide and methane emission from rice paddy soils is improbable due to redox potential changes with depth in a greenhouse experiment without plants. Geoderma 149, 45–53. doi: 10.1016/j.geoderma.2008.11.012
Kissel, D. E., Cabrera, M. L., and Paramasivam, S. (2008). “Chapter 4: Ammonium, ammonia, and urea reactions in soils,” in Nitrogen in Agricultural Systems. Agronomy Monographs, Vol. 49, eds. S. Schepers and W. R. Raun (Hoboken: John Wiley & Sons), 101–155. doi: 10.2134/agronmonogr49.c4
Krobel, R., Sun, Q. P., and Ingwersen, J. (2010). Modelling water dynamics with DNDC and DAISY in a soil of north China plain: a comparative study. Environ. Model. Software 25, 583–601. doi: 10.1016/j.envsoft.2009.09.003
Kuang, W., Gao, X., Tenuta, M., Gui, D., and Zeng, F. (2019). Relationship between soil profile accumulation and surface emission of N2O: effects of soil moisture and fertilizer nitrogen. Nutr. Fert. Soils 55, 97–107. doi: 10.1007/s00374-018-01337-4
Kumar, K., Parihar, C. M., Das, T. K., Pandey, R., Sharma, D. K., Sharma, V. K., et al. (2024a). Impact of diverse tillage and nitrogen management on growth and yield of conservation agriculture-based wheat (Triticum aestivum). Indian J. Agric. Sci. 94, 432–436. doi: 10.56093/ijas.v94i4.143508
Kumar, K., Parihar, C. M., Nayak, H. S., Godara, S., Avinash, G., Patra, K., et al. (2023). Enhancing maize yield in a conservation agriculture-based maize (Zea mays)- wheat (Triticum aestivum) system through efficient nitrogen management. Indian J. Agric. Sci. 93, 420–424. doi: 10.56093/ijas.v93i4.133484
Kumar, K., Parihar, C. M., Nayak, H. S., Sena, D. R., Godara, S., Dhakar, R., et al. (2024b). Modeling maize growth and nitrogen dynamics using CERES-Maize (DSSAT) under diverse nitrogen management options in a conservation agriculture-based maize-wheat system. Sci. Rep. 14:11743. doi: 10.1038/s41598-024-61976-6
Kumar, K., Parihar, C. M., Sena, D. R., Godara, S., Patra, K., Sarkar, A., et al. (2024c). Modeling the growth, yield and N dynamics of wheat for decoding the tillage and nitrogen nexus in 8-years long-term conservation agriculture based maize-wheat system. Front. Sustain. Food Syst. 8:1321472. doi: 10.3389/fsufs.2024.1321472
Kumar, V., and Ladha, J. K. (2011). Direct seeding of rice: recent developments and future research needs. Adv. Agron. 111, 297–413. doi: 10.1016/B978-0-12-387689-8.00001-1
Ladha, J. K., Kumar, V., Alam, M. M., Sharma, S., Gathala, M. K., Chandna, P., et al. (2009). “Integrating crop and resource management technologies for enhanced productivity, profitability and sustainability of the rice–wheat system in South Asia,” in Integrated Crop and Resource Management in the Rice–Wheat System of South Asia, eds. J. K. Ladha, Y. Singh, O. Erenstein, and B. Hardy (Los Banos: International Rice Research Institute), 69–108.
Li, C., Frolking, S., and Frolking, T. A. (1992a). A model of nitrous oxide evolution from soil driven by rainfall events: 1. Model structure and sensitivity. J. Geophys. Res. 97, 9759–9776. doi: 10.1029/92JD00509
Li, C., Frolking, S., and Frolking, T. A. (1992b). A model of nitrous oxide evolution from soil driven by rainfall events: 2. Model application. J. Geophys. Res. 97, 9777–9783. doi: 10.1029/92JD00510
Li, C., Mosier, A., Wassmann, R., Cai, Z., Zheng, X., Huang, Y., et al. (2004). Modeling greenhouse gas emissions from rice-based production systems: sensitivity and upscaling. Glob. Biogeochem. Cycles 18, GB1043, 1041–1019. doi: 10.1029/2003GB002045
Li, C., Salas, W., Zhang, R., Krauter, C., Rotz, A., and Mitloehner, F. M. (2012). Manure-DNDC: a biogeochemical process model for quantifying greenhouse gas and ammonia emissions from livestock manure systems. Nutr. Cycl. Agroecosyst. 93, 163–200. doi: 10.1007/s10705-012-9507-z
Li, C. S. (2000). Modeling trace gas emissions from agricultural ecosystems. Nutr.Cycl. Agroecosyst. 58, 259–276. doi: 10.1007/978-94-010-0898-3_20
Li, H., Ligang, W., Jianzheng, L., Maofang, G., Jing, Z., Jianfeng, Z., et al. (2017). The development of China-DNDC and review of its applications for sustaining Chinese agriculture. Ecol. Model. 348, 1–13. doi: 10.1016/j.ecolmodel.2017.01.003
Li, S. Q., Zhang, W., Zheng, X. H., Li, Y., Han, S. H., Wang, R., et al. (2022). Update of a biogeochemical model with process-based algorithms to predict ammonia volatilization from fertilized cultivated uplands and rice paddy fields. Biogeosciences 19, 3001–3022. doi: 10.5194/bg-19-3001-2022
Macharia, J. M., Ngetich, F. K., and Shisanya, C. A. (2021). Parameterization, calibration and validation of the DNDC model for carbon dioxide, nitrous oxide and maize crop performance estimation in East Africa. Heliyon 7:e06977. doi: 10.1016/j.heliyon.2021.e06977
Malyan, S. K., Bhatia, A., Kumar, A., Gupta, D. K., Singh, R., Kumar, S. S., et al. (2016). Methane production, oxidation and mitigation: a mechanistic understanding and comprehensive evaluation of influencing factors. Sci. Total Environ. 572, 874–896. doi: 10.1016/j.scitotenv.2016.07.182
Minamikawa, K., Fumoto, T., Itoh, M., Hayano, M., Sudo, S., and Yagi, K. (2014). Potential of prolonged midseason drainage for reducing methane emission from rice paddies in Japan: a long-term simulation using the DNDC-Rice model. Biol. Fertil. Soils 50, 879–889. doi: 10.1007/s00374-014-0909-8
Moriasi, D. N., Arnold, J. G., Van Liew, M. W., Bingner, R. L., Harmel, R. D., and Veith, T. L. (2007). Model evaluation guidelines for systematic quantification of accuracy in watershed simulations. Trans. Am. Soc. Agric. Biol. Eng. 50, 885–900. doi: 10.13031/2013.23153
Mousavi, S. F., Yousefi-Moghadam, S., Mostafazadeh-Fard, B., Hemmat, A., and Yazdani, M. R. (2009). Effect of puddling intensity on physical properties of a silt clay soil under laboratory and field conditions. Paddy Water Environ. 7, 45–54. doi: 10.1007/s10333-008-0148-4
Nash, J. E., and Sutcliffe, J. V. (1970). River flow forecasting through conceptual models - part 1: a discussion of principles. J. Hydrol. 10, 282–290. doi: 10.1016/0022-1694(70)90255-6
Panneerselvam, P., Kumar, V., Banik, N. C., Kumar, V., Parida, N., Wasim, I., et al. (2020). Transforming labor requirement, crop yield, and profitability with precision dry-direct seeding of rice and integrated weed management in Eastern India. Field Crops Res. 259:107961. doi: 10.1016/j.fcr.2020.107961
Parihar, C. M., Jat, S. L., Singh, A. K., Ghosh, A., Rathore, N. S., Kumar, B., et al. (2017). Effects of precision conservation agriculture in a maize-wheat-mungbean rotation on crop yield, water-use and radiation conversion under a semi-arid agro-ecosystem. Agric. Water Manag. 192, 306–319. doi: 10.1016/j.agwat.2017.07.021
Parihar, C. M., Parihar, M. D., Sapkota, T. B., Nanwal, R. K., Singh, A. K., Jat, S. L., et al. (2018). Long-term impact of conservation agriculture and diversified maize rotations on carbon pools and stocks, mineral nitrogen fractions and nitrous oxide fluxes in inceptisol of India. Sci. Total Environ. 640, 1382–1392. doi: 10.1016/j.scitotenv.2018.05.405
Patra, K., Parihar, C. M., Nayak, H. S., Rana, B., Sena, D. R., Anand, A., et al. (2023). Appraisal of complementarity of subsurface drip fertigation and conservation agriculture for physiological performance and water economy of maize. Agric. Water Manag. 283:108308. doi: 10.1016/j.agwat.2023.108308
Patra, S., Parihar, C. M., Mahala, D. M., Singh, D., Nayak, H. S., Patra, K., et al. (2023). Influence of long-term tillage and diversified cropping systems on hydrophysical properties in a sandy loam soil of North-Western India. Soil Tillage Res. 229:105655. doi: 10.1016/j.still.2023.105655
Peramaiyan, P., Srivastava, A. K., Kumar, V., Seelan, L. P., Banik, N. C., Khandai, S., et al. (2023). Crop establishment and diversification strategies for intensification of rice-based cropping systems in rice-fallow areas in Odisha. Field Crops Res. 302:109078. doi: 10.1016/j.fcr.2023.109078
Prasad, R., Shivay, Y. S., Kumar, D., and Sharma, S. N. (2006). Learning by Doing Exercises in Soil Fertility (a Practical Manual for Soil Fertility). New Delhi: Division of Agronomy, Indian Agricultural Research Institute, p. 68.
R Core Team (2022). R: A Language and Environment for Statistical Computing. Vienna: R Foundation for Statistical Computing. Available at: https://www.R-project.org/
Rana, B., Parihar, C. M., Jat, M. L., Patra, K., Nayak, H. S., Reddy, K. S., et al. (2023). Combining sub-surface fertigation with conservation agriculture in intensively irrigated rice under rice-wheat system can be an option for sustainably improving water and nitrogen use-efficiency. Field Crops Res. 302:109074. doi: 10.1016/j.fcr.2023.109074
Reddy, K. S., Parihar, C. M., Panneerselvam, P., Sarkar, A., Patra, K., Bharadwaj, S., et al. (2025). Meta-analysis of yield-emission trade-off in direct seeded vs. puddled transplanted rice: towards a cleaner and sustainable production. Clean Environ. Syst. 16:100238. doi: 10.1016/j.cesys.2024.100238
Schmidt, J. E., Peterson, C., Wang, D., Scow, K. M., and Gaudin, A. C. M. (2018). Agroecosystem tradeoffs associated with conversion to subsurface drip irrigation in organic systems. Agric. Water Manag. 202, 1–8. doi: 10.1016/j.agwat.2018.02.005
Sharma, A. R., Parihar, C. M., Sarkar, A., Garnaik, S., Reddy, S., and Nayak, H. S. (2023). Nutrient management in conservation agriculture-based production systems: some practical considerations. Indian J. Fert. 19, 1122–1131.
Sidhu, H. S., Jat, M. L., Singh, Y., Sidhu, R. K., Gupta, N., Singh, P., et al. (2019). Sub-surface drip fertigation with conservation agriculture in a rice-wheat system: a breakthrough for addressing water and nitrogen use efficiency. Agric. Water Manag. 216, 273–283. doi: 10.1016/j.agwat.2019.02.019
Smith, W., Qi, Z., Grant, B., VanderZaag, A., and Desjardins, R. (2019). Comparing hydrological frameworks for simulating crop biomass, water, and nitrogen dynamics in a tile drained soybean corn system: cascade vs computational approach. J. Hydrol. 2:100015. doi: 10.1016/j.hydroa.2018.100015
Smith, W. N., Grant, B. B., Desjardins, R. L., Rochette, P., Drury, C. F., and Li, C. (2008). Evaluation of two process-based models to estimate soil N2O emissions in Eastern Canada. Can. J. Soil Sci. 88, 251–260. doi: 10.4141/CJSS06030
Song, T., Xu, F., Yuan, W., Chen, M., Hu, Q., Tian, Y., et al. (2019). Combining alternate wetting and drying irrigation with reduced phosphorus fertilizer application reduces water use and promotes phosphorus use efficiency without yield loss in rice plants. Agric. Water Manag. 223:105686. doi: 10.1016/j.agwat.2019.105686
Song, X., Ju, X., Topp, C. F. E., and Rees, R. M. (2019). Oxygen regulates nitrous oxide production directly in agricultural soils. Environ. Sci. Tech. 53, 12539–12547. doi: 10.1021/acs.est.9b03089
Sudhir-Yadav, E., Humphreys, S. S., Kukal, S. S., Gill, R., and Rangarajan, R. (2011). Effect of water management on dry seeded and puddled transplanted rice: part 2: water balance and water productivity. Field Crops Res. 120, 123–132. doi: 10.1016/j.fcr.2010.09.003
Tao, Y., Xiao, D., Ye, C., Liu, K., Tang, X., Ma, H., et al. (2024). Compound microbial agent improves soil redox status to reduce methane emissions from paddy fields. Rice Sci. 31, 740–750. doi: 10.1016/j.rsci.2024.05.002
Thomas, B. W., and Hao, X. (2017). Nitrous oxide emitted from soil receiving anaerobically digested solid cattle manure. J. Environ. Qual. 46, 741–750. doi: 10.2134/jeq2017.02.0044
Ussiri, D., and Lal, R. (2012). Soil Emission of N2O and Its Mitigation. Dordrecht: Springer. doi: 10.1007/978-94-007-5364-8
Uzoma, K. C., Smith, W., Grant, B., Desjardins, R. L., Gao, X., Hanis, K., et al. (2015). Assessing the effects of agricultural management on nitrous oxide emissions using flux measurements and the CAN-DNDC model. Agric. Ecosyst. Environ. 206, 71–83. doi: 10.1016/j.agee.2015.03.014
Vetter, S. H., Sapkota, T. B., Hillier, J., Stirling, C. M., Macdiarmid, J. I., Aleksandrowicz, L., et al. (2017). Greenhouse gas emissions from agricultural food production to supply Indian diets: implications for climate change mitigation. Agric. Ecosyst. Environ. 237, 234–241. doi: 10.1016/j.agee.2016.12.024
Wennman, P., and Kätterer, T. (2006). Effects of moisture and temperature on carbon and nitrogen mineralisation in mine tailing mixed with sewage sludge. J. Environ. Qual. 1135–1141. doi: 10.2134/jeq2005.0142
Willmott, C. J. (1982). Some comments on the evaluation of model performance. Bull. Am. Meteorol. Soc. 63, 1309–1313. doi: 10.1175/1520-0477(1982)063<1309:SCOTEO>2.0.CO;2
Wu, Z., Dong, Y., Zhang, X., Xu, X., and Xiong, Z. (2023). Biochar single application and reapplication decreased soil greenhouse gas and nitrogen oxide emissions from rice–wheat rotation: a three-year field observation. Geoderma 435:116498. doi: 10.1016/j.geoderma.2023.116498
Zhang, F., Zhang, W., Qi, J., and Li, F. M. (2018). A regional evaluation of plastic film mulching for improving crop yields on the Loess Plateau of China. Agric. For. Meteorol. 248, 458–468. doi: 10.1016/j.agrformet.2017.10.030
Zhang, H. Y., Adalibieke, W., Ba, W. X., Butterbach-Bahl, K., Yu, L. F., Cai, A. D., et al. (2024). Modeling denitrification nitrogen losses in China's rice fields based on multiscale field-experiment constraints. Glob. Chang. Biol. 20:e17199. doi: 10.1111/gcb.17199
Zhang, J., He, W., Smith, W. N., Grant, B. B., Ding, W., Jiang, R., et al. (2021). Exploring management strategies to improve yield and mitigate nitrate leaching in a typical radish field in northern China. J. Environ. Manag. 290:112640. doi: 10.1016/j.jenvman.2021.112640
Zhang, X., Yin, S., Li, Y., Zhuang, H., Li, C., and Liu, C. (2014). Comparison of greenhouse gas emissions from rice paddy fields under different nitrogen fertilization loads in Chongming Island, eastern China. Sci. Total Environ. 472, 381–388. doi: 10.1016/j.scitotenv.2013.11.014
Zhang, Y., Liu, J., Wang, H. Y., Lei, Q. L., Liu, H. B., Zhai, L. M., et al. (2018). Suitability of the DNDC model to simulate yield production and nitrogen uptake for maize and soybean intercropping in the North China Plain. J. Integr. Agric. 17, 2790–2801. doi: 10.1016/S2095-3119(18)61945-8
Zhang, Y., and Niu, H. (2016). The development of the DNDC plant growth sub-model and the application of DNDC in agriculture: a review. Agric. Ecosyst. Environ. 230, 271–282. doi: 10.1016/j.agee.2016.06.017
Zhao, Z., Cao, L. K., Deng, J., Sha, Z. M., Chu, C. B., Zhou, D. P., et al. (2020). Modeling CH4 and N2O emission patterns and mitigation potential from paddy fields in Shanghai, China with the DNDC model. Agric. Syst. 178:102743. doi: 10.1016/j.agsy.2019.102743
Keywords: conservation agriculture, crop modeling, drip fertigation, greenhouse gas emissions, sustainability
Citation: Reddy KS, Parihar CM, Panneerselvam P, Sarkar A, Nayak HS, Patra K, Sena DR, Reddy GS, Sinha A, Bharadwaj S, Kumar S and Kumar V (2025) Eco-optimizing rice-wheat system of Eastern Indo-Gangetic plains of India through resource conservation technologies: insights from field experiments and modeling. Front. Sustain. Food Syst. 9:1499425. doi: 10.3389/fsufs.2025.1499425
Received: 20 September 2024; Accepted: 02 January 2025;
Published: 31 January 2025.
Edited by:
Jagadeesh Yeluripati, The James Hutton Institute, United KingdomReviewed by:
Ebrahim Tilahun, Addis Ababa University, EthiopiaCopyright © 2025 Reddy, Parihar, Panneerselvam, Sarkar, Nayak, Patra, Sena, Reddy, Sinha, Bharadwaj, Kumar and Kumar. This is an open-access article distributed under the terms of the Creative Commons Attribution License (CC BY). The use, distribution or reproduction in other forums is permitted, provided the original author(s) and the copyright owner(s) are credited and that the original publication in this journal is cited, in accordance with accepted academic practice. No use, distribution or reproduction is permitted which does not comply with these terms.
*Correspondence: C. M. Parihar, cGFyaWhhcmNtQGdtYWlsLmNvbQ==; P. Panneerselvam, cC5wYW5uZWVyc2VsdmFtQGlycmkub3Jn
Disclaimer: All claims expressed in this article are solely those of the authors and do not necessarily represent those of their affiliated organizations, or those of the publisher, the editors and the reviewers. Any product that may be evaluated in this article or claim that may be made by its manufacturer is not guaranteed or endorsed by the publisher.
Research integrity at Frontiers
Learn more about the work of our research integrity team to safeguard the quality of each article we publish.