 Ornella Tiboni-Oschilewski
 Camila Corvalán
 Rebecca Kanter
- 1Institute of Nutrition and Food Technology (INTA), University of Chile, Santiago, Chile
- 2CIAPEC, Institute of Nutrition and Food Technology (INTA), University of Chile, Santiago, Chile
- 3Unit of Public Health Nutrition, Department of Nutrition, Faculty of Medicine, University of Chile, Santiago, Chile
Introduction: Dietary choices affect both human and planetary health; however, they are not always linked to public policies. For example, Food Based Dietary Guidelines (FBDGs) do not always consider sustainability in their recommendations. To date, no methods have been developed and agreed upon to assess the five sustainability dimensions proposed by the Food and Agriculture Organization (FAO) (nutritional, environmental, cultural, physical, and economical access) as a whole. The objective of this study was to compare the levels of sustainability of traditional Chilean culinary preparations using a newly proposed method that integrates five unique dimensions of sustainable diets with reference databases to generate recommendations about sustainable culinary preparations; in which the Chilean population serves as a test case.
Methods: A database composed of 651 traditional Chilean culinary preparations was used. It was obtained through 10 focus groups from the Metropolitan Region. Culinary preparations were divided into eight different food groups based on their main ingredients. Sustainability estimations were conducted for physically accessible preparations. All the dimensions were estimated based on approaches and indicators previously used in scientific literature. Different weights were provided for all other dimensions: 30% for cultural and price, respectively, and 20% for nutritional and environmental dimensions. Culinary preparations we recommended as sustainable if they achieved a global sustainability score of 66% or above, provided each dimension individually scored 40% or above.
Results: After data management, 351 culinary preparations were analyzed. A total of 94 were selected as sustainable: 21/38 vegetables; 6/7 fruits; 28/105 proteins; 14/78 cereals; 6/41 soups; 0/32 dairy; 1/6 lipids; 18/443 beverages. The main reason a preparation was not classified as sustainable was failing to obtain 66% of global sustainability. No culinary preparations were excluded based on the economic dimension.
Discussion: This study shows that estimating sustainability of individual culinary preparations based on the five dimensions of sustainable diets of FAO is possible through the development of an innovative methodological approach that is useful for making dietary recommendations for a population, such as within FBDGs. Future research should continue developing this methodology as a tool for public health decision-making for healthier and sustainable diets. This would allow dietary patterns to develop into more sustainable ones, which is a useful strategy for public health and planetary health
Introduction
Current estimates on population growth and climate change show that by 2050 food production is expected to increase between 50 and 90%, which is not a possible outcome considering planetary boundaries and natural resources (Springmann et al., 2018). It is currently known that the food system contributes up to 42% of the greenhouse gas emissions (GHGE) in the world (Masson-Delmotte et al., 2021). It is estimated that agriculture accounts for a third of the GHGE, 70% of the water use (Masson-Delmotte et al., 2021), and more than a third of cultivable land (Willett et al., 2019), varying greatly upon different foods and estimation methods. At the same time, food production is a major contributor to biodiversity loss. Furthermore, six of nine planetary boundaries are transgressed, evidencing the urgency to act on climate change (Richardson et al., 2023). Today, only five crops (rice, wheat, corn, millet, and sorghum) supply more than half of the caloric requirements of the population (FAO, IFAD, UNICEF, WFP, WHO, 2024). Higher food group diversity diets result in lower mortality and diet-related NCD rates and lower micronutrient deficits (WHO and FAO, 2024). Taken together, there is a dire need to change the supply and demand of these foods, while protecting and preserving both agricultural and dietary biodiversity.
Most of the adult Chilean population are overweight or obese. The prevalence of obesity increased in the last three national surveys (2003, 2010, and 2017), reaching 33.4% in 2017 (Ministerio de Salud Chile, 2018). In Chile, up to 80% of deaths are due to non-communicable diseases, higher than the mean of 50% for Latin America and the Caribbean (FAO, PAHO, WFP, UNICEF, 2019), and over 70% of food systems’ hidden costs are attributable to health costs (FAO, 2024). In addition, only 15% of the Chilean population consumes five servings of fruits and vegetables per day; and six out of seven people are sedentary (Ministerio de Salud Chile, 2017a). This scenario highlights the importance and urgency of improving lifestyle and diet for better population health in Chile.
The link between diet, human health, and sustainability is widely recognized, where sustainable diets could reduce the overweight and obesity risk by 0.69 and 0.61, respectively (Reger et al., 2024), the environmental synergies of dietary choices and their mitigation potential on greenhouse gas emissions (GHGE) are rarely considered in public policies. Diets pose a critical role in climate change mitigation, as changes in food demand could reduce the environmental impact and biodiversity loss of the food system (FAO, 2023a). Furthermore, when assessing the caloric sufficiency of a population, nutritional status should be considered, as an overweight person consumes 19% more calories than a normal weight one (Edwards and Roberts, 2009), contributing to greater use of natural resources and further biodiversity pressure, while generating more GHGE (Toti et al., 2019).
Population-level dietary recommendations often only consider human nutrition, with evidence based on nutrients, food items, or dietary patterns (Herforth et al., 2019; Mozaffarian et al., 2018). Rarely, in the design of dietary guidelines is it considered that dietary choices also affect planetary health and vice versa (Herforth et al., 2019; James-Martin et al., 2022). Even though it is currently known that high-income countries throughout the world, such as Chile, tend to have unhealthy diets that are a result of high environmental impacts (Gormaz et al., 2022; Gutiérrez et al., 2023). Only 17% of the world’s population have FBDGs that consider environmental sustainability (James-Martin et al., 2022). Since December 2022, Chile has been currently one of these countries (Ministerio de Salud Chile, 2022). The newly published FBDGs for Chile currently include socio-cultural and environmental sustainability dimensions (Ministerio de Salud Chile, 2022).
By the mid-1980s, the term “sustainable diets” emerged, but a consensus on a standard definition that includes specific indicator cutoff points has not been reached (Moreno-Miranda and Dries, 2022). According to the Food and Agriculture Organization (FAO), sustainable diets are determined by five dimensions: (1) environmental impact; (2) nutrition; (3) culture; (4) physical access and availability; and (5) economical access/prices (Burlingame and Dernini, 2012). In 2019, the first international proposal on environmentally sustainable diets was proposed (Willett et al., 2019). However, there is still no consensus about how to measure the five different dimensions of sustainable diets or which indicators should be selected for each dimension (Allen et al., 2019). The existing methods are very heterogeneous. Some are based on a binary outcome, e.g., having or not the organic label (Lisa Clodoveo et al., 2022); some focus on specific nutrients, e.g., <10% of the energy from saturated fat (Gustafson et al., 2022), but most focus on environmental indicators (Downs et al., 2023). Many metrics, impacts, and indicators of sustainable foods depend heavily on the local realities, and therefore, establishing global standard criteria for these dimensions has yet to take place (Hallström et al., 2018).
Considering the FAO definition of sustainable diets, there could be five dimensions of sustainable diets at the population level: nutritional adequacy, environmental impact, affordability, physical accessibility, and cultural acceptance (Burlingame and Dernini, 2012). The environmental dimension is most commonly assessed through indicators, such as GHGE (Berry et al., 2015; Jones et al., 2016), land use (Poore and Nemecek, 2018), water use, eutrophication potential (Ministerio de Medio Ambiente, Chile, Programa de las Naciones Unidas para el Desarrollo, GEF, 2017), water acidification (Poore and Nemecek, 2018), biodiversity loss (Ministerio de Medio Ambiente, Chile, Programa de las Naciones Unidas para el Desarrollo, GEF, 2017), and ecological footprint (global hectares). According to Global Footprint Network (2022), the ecological footprint considers the lifecycle of consumed products, the resources used to produce them, and the ability to regenerate and absorb the excess. In brief, or the biocapacity of a region or country, or how much is used in contrast to how much is available.
The nutritional dimension is often operationalized through indicators, such as fruit and vegetable consumption (Berry et al., 2015; Donini et al., 2016), food diversity (Berry et al., 2015; Donini et al., 2016), food security indexes (Berry et al., 2015; Donini et al., 2016), quality of life and life expectancy (Berry et al., 2015; Donini et al., 2016), nutritional status, and nutrient quality indexes (Berry et al., 2015). The latter are mathematical calculations that include different nutrients to be promoted or dissuaded for the consumer in comparison with standard requirements. Nutrient quality indexes allow for a direct comparison between the quality of ingredients, culinary preparations, and diets, such as the Healthy Eating Index or previous Nutrient Rich Food Indexes (Drewnowski et al., 2020; Krebs-Smith et al., 2018). However, these results do not often translate directly into health outcomes, as have been investigated and validated for nutrient-rich foods (NRF) 9.3 (Drewnowski, 2009; Fulgoni et al., 2008; Streppel et al., 2014).
The physical access dimension considers the availability in terms of quantity and the distance one must travel to obtain food. Examples of indicators are per capita availability (Berry et al., 2015; FAO, 2023b) and paved roads, infrastructure, and food markets (Berry et al., 2015; Jones et al., 2016). There seems to be a consensus for “local foods” as food that is produced within a certain distance from where it is sold (Downs et al., 2023; Kinnunen et al., 2020).
The cultural dimension takes into account mainly social aspects such as cultural identity with culinary preparation (Garnett et al., 2014), knowledge and beliefs (Berry et al., 2015), and diet adherence (Ponzo et al., 2017).
The economical access uses gross domestic product (GDP), percentage of food expenditure (Berry et al., 2015), and food waste and losses (Berry et al., 2015). Integrated methods that can be adapted for a given local context to estimate the sustainability of diets within complex food systems should be defined (Jones et al., 2016).
Globally, research on sustainable diets has mainly focused on Western Europe, with cultural preference being the least studied dimension (Jones et al., 2016). One study examined how nutritionists and non-experts conceptualize healthy foods (de Moraes Prata Gaspar et al., 2020). Despite the participants having a prior scientific knowledge of nutrition, the socio-cultural dimensions were also linked to their current understanding of healthy diets. To address the limitations of previous studies, sustainable diets should be defined and promoted, to be locally adapted and feasible to follow by a population (Willett et al., 2019). Thus, traditional culinary preparations may be a practical tool for promoting the consumption of sustainable diets.
There is a lack of evidence on how to implement and assess foods utilizing all the aforementioned sustainability dimensions. Most of the studies only use the environmental dimension (Marrero et al., 2022; Ran et al., 2024), and few use a combination of dimensions (Liu et al., 2024; Rei et al., 2024; Yacoub Bach et al., 2023), but to our knowledge, none has used five dimensions at the same time. A method to estimate sustainable diets that includes all five dimensions may help identify which dimensions contributed more or less to its sustainability and thus suggest areas for improvement.
Different structural and individual strategies exist to promote healthy diets in Chile, such as the front-of-package labeling law and the FBDGs. Despite these efforts, dietary habits continue to worsen along with the prevalence of nutrition-related non-communicable diseases (Ministerio de Salud Chile, 2022, 2017b). In general, healthy diets aligned with FBDGs are more expensive when compared to diets that include more processed foods or that only satisfy caloric requirements (FAO, IFAD, UNICEF, WFP, WHO, 2023; Verdugo et al., 2016). Furthermore, the price of a basic food basket in Chile has risen since the COVID-19 pandemic (Observatorio Social, Ministerio de Desarrollo Social y Familia, Gobierno de Chile, 2023). The lack of adherence to healthy diets could also be related to a lack of culinary abilities for traditional recipes. It is difficult to motivate behavior change, of which cost and taste have been identified in the United States as common barriers (Nicklas et al., 2013). In conclusion, both the health and the dietary intake of the Chilean population are worsening, which puts greater pressure on the climate, threatening the planetary boundaries of the food system for freshwater and carbon emissions (Gormaz et al., 2022). Thus, there is an urgent need in Chile, and elsewhere, to promote diets that are both sustainable and healthy in an integrative way.
Given this scenario, and the consequences it poses for humans and the planet, this study aimed to compare the degree of sustainability of traditional Chilean culinary preparations using a newly proposed method, with a primary aim of producing recommendations on sustainable culinary preparations for the Chilean population and a secondary aim of proposing a new method to estimate the sustainability of culinary preparations.
Materials and methods
To compare the sustainability of traditional Chilean culinary preparations, a novel method is proposed. As culinary preparations are the unit of analysis, recipe estimations had to be made. In addition, weighting among different sustainability dimensions was made. Five sustainability dimensions were considered: environmental, cultural acceptance, nutrition adequacy, costs, and physical access. The latter was first assessed, and if physically available, a weight for the other four dimensions was made.
Qualitative data on physical access and economic cost were coded to calculate the sustainability dimensions of each culinary preparation, further explained in the “Physical access and availability criteria” and the “Economic access and price criteria” sections. The weights are as follows: environmental impact with a weight of 20%, nutrition with 20%, culture with 30%, and economic cost with 30%. Physical access and availability were estimated as a pre-condition to be sustainable. Culture and economic access were given a higher weight in the final sustainability score as taste and cost are the main drivers of dietary decisions (Garnett et al., 2015; Nicklas et al., 2013), while nutrition and environmental sustainability seem to be less important or represent a trade-off for consumers (Elmor et al., 2024). Thus, for making more locally suited recommendations, cultural acceptability and economic access were given higher weight than nutritional adequacy or environmental sustainability. With these weights, it was possible to obtain a composite final score that represents how sustainable a certain culinary preparation is. Finally, all preparations were ranked according to their score.
Study sample
Data on traditional preparations known to the population were obtained from 10 focus groups between December 2017 and August 2018. Focus groups were developed in counties that were geographically and socio-demographically diverse, and participants were invited considering urbanicity, ethnicity, and income level. Little guidance on traditional meaning was given to capture the preparations that people remembered, encouraging adults who were not culinary experts. Each focus group had between 6 and 10 participants in 10 different counties in the Metropolitan Region of Chile (total n = 73), including socio-economically vulnerable areas. Two focus groups were conducted for each age and ethnic group: 25–45 y, 45–65 y, >65 y, First Nations descent, and not First Nations descent. In the focus groups, two large posters were used to guide the conversation and register the data. This study has been described in detail previously (Kanter and León Villagra, 2020). A database composed of the unique traditional culinary preparations (n = 651) listed in all 10 focus groups was used.
Instruments
Quantitative and qualitative data on culinary preparations were obtained through different methods, as described by Kanter and Leon (Kanter and León Villagra, 2020). The data used in this study are mainly based on 10 different focus groups from the Chilean Metropolitan Region, including vulnerable and peri-urban areas. Participants were asked to free list the top 10–15 culinary preparations per mealtime. For each culinary preparation named, the consumption frequency, likeability, and seasonality of consumption were collected and utilized in this study. Data were transferred two times to REDCap (research electronic data capture) hosted at the University of Chile (Harris et al., 2009, 2019). Qualitative data codification was used for the physical access and the economic access or affordability. This information was coded into numbers and transferred to a database. Price was coded: cheap, −1; normal/regular: 0; expensive, 1. Physical access was coded: local store (neighborhood markets), 0; supermarket, 1; harvest/gifts, 2.
Data management
Culinary preparations (n = 651) were ordered in different Excel sheets for 10 food groups (fruits, vegetables, protein and pulses, cereals, dairy, lipids, soups, beverages, sausages, and food rich in critical nutrients, i.e., sodium, trans fats, cholesterol, and added sugar). These food groups were selected as usually the same food grouping is made for FBDGs for nutrient-similar foods. Each food group included culinary preparations whose main ingredients were pertinent to each group. For example, the soups group is composed of mixed culinary preparations, such as soups, stews, and others that have a liquid component that is not a beverage. While the lipid group is composed of only nuts and avocado, the beverage group include hot and cold, alcoholic, and non-alcoholic beverages.
Sausages and other foods rich in critical nutrient groups were excluded. After the food group exclusion, 568 culinary preparations remained. Of the 568 culinary preparations, 217 were cleaned and consolidated because of naming similarities (e.g., sliced tomatoes, tomato salad, fresh tomatoes, and tomatoes as a side). Finally, 351 preparations were left to estimate its sustainability.
Sustainability estimations were made by the food group and its standard portions (further explained in the “recipe estimation” section) to calculate the final unique sustainability score for each culinary preparation.
Exclusion criteria for culinary preparations
Per the nutritional and health context described above, consumption of critical nutrients (i.e., sodium, sugar, trans fat, and calories) should be dissuaded in the Chilean population. Thus, preparations based on two food groups were excluded: (1) sausages (pate, cured meat, and derivatives) and (2) food or ingredients rich in critical nutrients, such as fast food, sweets, and fried food. A total of 83 preparations were excluded from this study for not being healthy nor traditional enough to be recommended at the population level as part of sustainable diets. Of 651 culinary preparations included in the initial study sample, excluding these two food groups resulted in 568 culinary preparations.
Standard recipe estimation
As this study did not intend to compile recipes, their estimation had to be made and standardized. Each culinary preparation ingredient was estimated as a standard portion (Gattás Zaror, 2011; Jury et al., 1995), with the aim to maintain similar nutritional composition and inter-changeability afterward. For example, if a culinary preparation includes raspberries but are difficult to find and purchase, or too expensive, this ingredient could be interchanged with another type of fruit, such as strawberry in the same 80 g per portion.
Each food ingredient within a specific culinary preparation is compared to its relative weight within its food group according to a standard portion size (g or ml). For example, if the culinary preparation was salad all the ingredients that are vegetables are compared within the vegetable food group (e.g., tomato, cucumber, and lettuce), but if the salad has cheese, the cheese is compared separately within the dairy group. Then, all the ingredients of the salad are weighted with respect to the food group to which they belong—vegetables vs. vegetables, dairy vs. dairy. Given that most culinary preparations are composed of multiple ingredients in different proportions, for each separate culinary preparation ingredient standard portions were used as already proposed in Chilean literature (Gattás Zaror, 2011; Jury et al., 1995). Food ingredient quantities were estimated as: 50 g for meat for the soups group, 100 g for meat in plates with sides; 150 g fish; 80 g cereals when as sides and 30 g in the soup group; 100 g of vegetables when as salads and 50 g when in soups; 130 g fruits; 200 mL for milk, 170 g for yogurt and 25 g for cheese; 60 g dried for pulses (Gattás Zaror, 2011; Jury et al., 1995). Every food ingredient had a relative presence (weight %) within the culinary preparation according to its average weight (kg) or volume (ml) of one serving. The percentage of each ingredient within a given sustainability dimension was estimated according to its own weight (%) within the preparation. For example, a raspberry smoothie was estimated as 200 mL of milk plus 80 g of raspberry (280 cc total), such that raspberry accounted for 28.5% of its environmental and nutritional footprint. Afterward, the sustainability footprints (%), whether environmental or nutritional, of each ingredient were weighted into one final sustainability percentage per dimension for each preparation as follows: nutrition sustainability for raspberry smoothie = (0.285 × [raspberry nutritional sustainability % within fruits group]) + (0.715 × [milk nutritional sustainability % within dairy group]). The same methods were used by the Barilla Center for Food and Nutrition (BCFN, 2016). For each dimension of sustainable diets, specific criteria were used as described in the subsequent sections.
The five dimensions of sustainable diets as established by the FAO were considered to estimate the overall sustainable diet score of each culinary preparation: (1) environmental, (2) nutritional, (3) cultural, (4) physical access and availability, and (5) economic access and price.
Environmental impact criteria
To determine the environmental impact dimension of a sustainable culinary preparation, carbon, water, and ecological footprints were used. Each footprint was weighted differently to construct an overall environmental footprint (Table 1). The ecological footprint has a higher relative weight (60%) than that of carbon (15%) or water (25%) given its consideration for both land and sea used to produce food. The environmental footprint was estimated first for each culinary preparation. Based on data from the “Double Pyramid” (BCFN, 2016), we constructed a database that included the weighted carbon footprint (gCO2, equivalent kg*0.15), water footprint (liters of water*0.25), and ecological footprint (global m2/ kg*0.60) for all food ingredients within each food group (Table 1). For example, the protein group consists of six individual food ingredients, each with its own environmental footprint. For each individual food ingredient in a food group, such as fish, legumes, cooked eggs, cooked poultry, cooked pork, and cooked meat in the protein group, an average value is separately assigned for its carbon footprint, water footprint, and ecological footprint. Each average footprint value is based on an average value from the BCFN database, accounting for cooking (e.g., boiling) if applicable. The overall environmental footprint for each culinary preparation included in the study sample (n = 351) was based on the relative weights assigned to each footprint type and the standard recipe for each culinary preparation. For example, for eggs the average carbon footprint with cooking is 5,233 gCO2 equivalent/kg, the average water footprint is 3,300 L/kg, and the average ecological footprint is 14 global m2/kg. When the weights described above are applied, the weighted average carbon footprint for cooking eggs is 784.95 (5,233 * 0.15), the average water footprint is 825 (3,300 * 0.25), and the average ecological footprint is 8.4 (14 * 0.60), resulting in a total average footprint of 1,618. Similar calculations were made for all the other five food ingredients in the protein group as well as for each individual culinary preparation in each food group. Once the total average footprint for each individual food ingredient was calculated, each individual culinary preparation was ranked according to its overall environmental footprint from least to most. Moreover, then given a weight (%) relative to the other individual culinary preparations in a particular food group based on the number of individual food ingredients in each group. Therefore, the environmental footprint of each culinary preparation was calculated according to a relative ranking for every food ingredient within each food group. The lowest scoring food ingredient within its food group (e.g., fish in the protein group) was subjectively assigned 100% environmental sustainability for its food group. The higher scoring ingredients were calculated as percentiles according to the total number of culinary preparations within its food group. For example, for the protein group there were six ingredients (100/6 = 16.6), such that the ingredients that did not achieve 100% environmental sustainability dropped by 16.6 percentage points relative to those that had the highest score. In the protein group, fish was 100% environmentally sustainable, then legumes at 83%, boiled eggs at 66%, and so on until cooked meat at the bottom at 17%. Finally, the overall environmental sustainability percentage of each food ingredient was estimated through a series of steps described below.
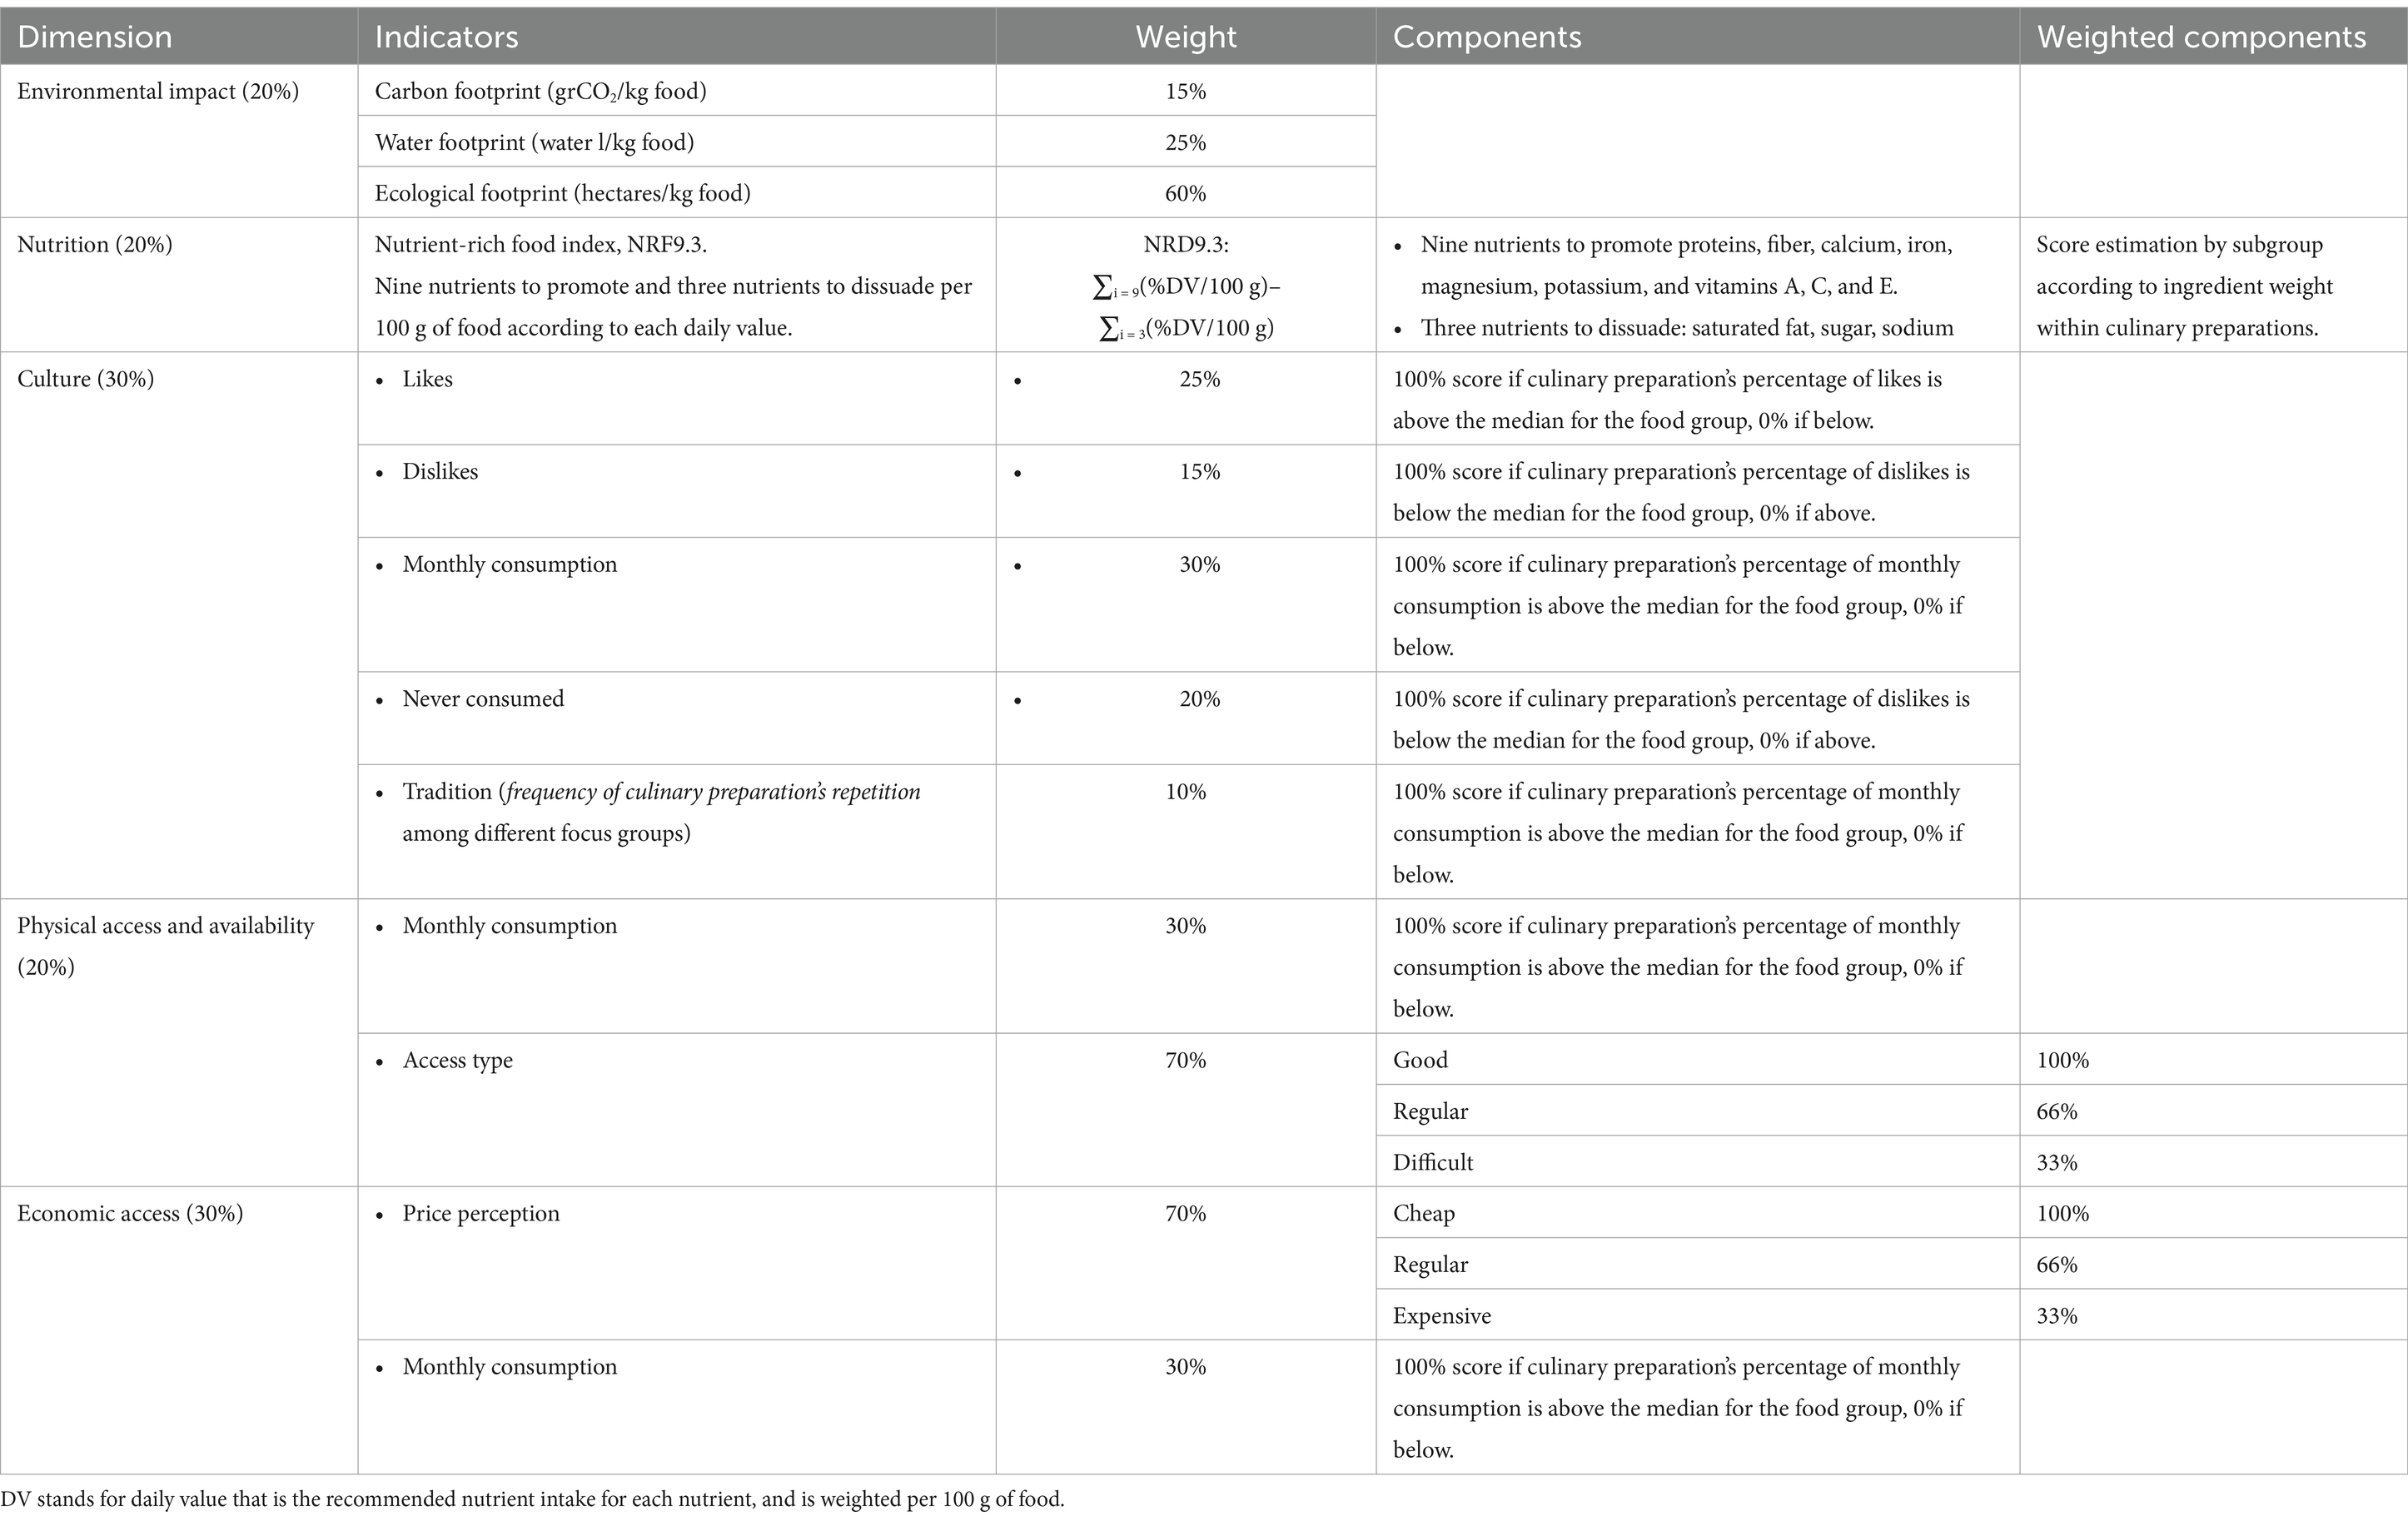
Table 1. Sustainability scoring method by sustainability dimensions.
As previously described, the environmental footprint of each culinary preparation was determined through a series of methodological steps based on the individual ingredients within each culinary preparation using a standard recipe. The second step was to calculate the weighted environmental footprint for each ingredient based on the relative proportion of each ingredient in the standard recipe used. Following the equation: relative weight (%) of the food ingredient within its food group*proportion of ingredient (%) in the overall weight of the standard recipe used summed across all ingredients in each standard recipe. An example is a vegetable omelet with mashed potatoes. According to our constructed database, eggs have a relative score*weight of 0.66*.17 g eggs in the standard recipe used + relative weight of cooked seasonal vegetables of 1*.33 g vegetables in the standard recipe used + relative weight of potatoes of 1*0.5 potatoes in the standard recipe used; for an overall environmental footprint percentage of 9.4.2% [=((0.66*0.17) + (1*0.33) + (1*0.5))*100]. This process was repeated for each culinary preparation included in the final study sample.
Nutritional criteria
To estimate the nutritional content of each included culinary preparation different indices were searched (Berry et al., 2015; Drewnowski et al., 2020; Fulgoni et al., 2008; Streppel et al., 2014), as they are simple mathematical calculations that include different nutrients to be promoted or dissuaded for the consumer, in comparison with the standard requirements. These indexes allow a quality comparison between food, dishes, and diets. NRF9.3 was selected over others because it is validated for the study of health impacts (Drewnowski, 2009; Fulgoni et al., 2008; Streppel et al., 2014).
This index uses nine healthy nutrients to encourage its consumption (i.e., protein, fiber, calcium, iron, magnesium, potassium, and vitamins A, C, and E) and three unhealthy nutrients to dissuade (saturated fats, total sugar, and sodium) according to their recommended daily values (DV), as shown below:
The NRF9.3 index data values used in this study were a compilation from the data published by Drewnowski, Berendsen as well as by Streppel by food group (Berendsen et al., 2016; Drewnowski, 2009; Streppel et al., 2014), as no author had included all ingredients in one comprehensive database. A database was assembled that included 15 of 21 foods from Drewnowski et al. (2020), 17 of 20 foods from the Berendsen database, and 18 of 20 foods from the Streppel database: or 50 foods (ingredients) in total. The foods excluded from the original NRF9.3 data sources included ingredients excluded from this analysis (e.g., “pastry, cakes, and biscuits”) and “mixed dishes” where the specific ingredients per “mixed dish” were not previously specified. In instances where the same ingredient was included in multiple data sources, a series of decisions was made to select the NRF9.3 value for the purpose of this study. For dough and sweets, those with negative values in the database were considered “0” because the nutritional sustainability scale in this study is from 0 to 100. The lowest value for bread and cereals was also used because Chilean bread is white, high in sodium, and often made with lard (animal fat). Most cereals are also made of refined white flour. For meat, cheese, and potatoes, the median value was used because two out of three data sources had a similar value. The largest NRF9.3 value was used for fruit considering that Chile produces and sells a lot of fruit rich in antioxidants. Fruits with higher levels of antioxidants should increase the NRF9.3 value. The largest value of NRF9.3 was also used for eggs, legumes, and fish because the consumption of these foods is low in the Chilean population (Ministerio de Salud Chile, 2017a) and their consumption should be promoted. Vegetables were both over 100, so these ingredients took on 100 as the maximum limit. The result was a table with 20 ingredients. From this table, the rule of three as is commonly used in elementary mathematics was used to determine the nutritional sustainability of each unique food (ingredient) relative to vegetables that had the highest NRF9.3 score of 102 that was given a nutritional sustainability score of 100%. Whereby if we know that the next highest NRF9.3 score is 94.2 for legumes, we can solve for its sustainability score (x) using cross-multiplication: x/94.2 = 100/102; such that x = 92.3%. The sustainability score values for each unique ingredient were used to determine the overall nutritional sustainability score for a given culinary preparation included in this study (Supplementary Table 1).
The same standard recipes used to estimate the environmental criteria were used to estimate the nutritional criteria. First, the relative proportion, or weight (g o ml), of each ingredient within the recipe was determined. To carry over the previous example, for the culinary preparation vegetable omelet with mashed potatoes, the standard recipe used was 50 g eggs, 100 g vegetables, and 150 g potatoes: for relative ingredient weights of 17% eggs, 33% vegetables, and 50% potatoes. Thus, the overall nutrition dimension for the vegetable omelet recipe is 68% based on the following: (63% nutritional dimension for eggs*17% proportion of the recipe with eggs +100% nutritional dimension for vegetables*33% proportion of the recipe with vegetables +49% nutritional dimension for potatoes*50% proportio of the recipe as potatoes).
Cultural acceptability criteria
Data on taste preferences and frequency of consumption of each culinary preparation were used to assess the cultural acceptability dimension of a sustainable culinary preparation. The number of times participants highly liked or disliked a culinary preparation was used as proxies for cultural acceptability, as cultural pertinence could be defined as adherence to a diet (Drewnowski, 2009). Therefore, for each culinary preparation (n = 351), the cultural dimension was estimated through a multi-step process to create a composite indicator using data on taste preferences and consumption frequency. First, for each food group, the number of participants who recognized each traditional culinary preparation mentioned in a particular focus group was totaled across all culinary preparations and focus groups. For example, a vegetable omelet was recognized by 22 participants, but a vegetable omelet with mashed potatoes was recognized by only four participants, which would sum to a total of 26 times one of these two culinary preparations was mentioned over 10 focus groups. The proportion of times a given culinary preparation was recognized by participants over the 10 focus groups provides an indicator of how culturally salient it is at present. The cultural dimension is a composite indicator consisting of the following overall focus groups: (i) how many recognized the culinary preparation; (ii) how many said they liked the culinary preparation; (iii) how many said they did not like the culinary preparation; (iv) how many said they consumed the culinary preparation monthly; and (v) how many said they never consume the culinary preparation. In this case, a vegetable omelet with mashed potatoes was recognized by four participants out of 772 times (0.05%) culinary preparations were recognized in the protein food group; that is, the sum of how many people recognized a culinary preparation of all the unique culinary preparations mentioned over 10 focus groups within the protein food group. The sum of the values for each of the other four indicators (likes, dislikes, monthly consumption, and never consumed) is used to identify the proportion of participants that responded, given how many recognized the culinary preparation to begin with. Thus, for a vegetable omelet with mashed potatoes, three out of four participants said they liked it (75%); zero of four said they really did not like it (0%); two out of four (50%) said they consumed it monthly; and zero of four said they never consumed it (0%). For each culinary preparation in the database, these five proportions were determined and compared to the median value for its food group. If a culinary preparation is to be highly culturally accepted (close to 100% cultural sustainability to say), the preparation must be above the median for its food group. Specifically, for a preparation to be culturally acceptable, participants must recognize or know the preparation, participants must like it, and participants must eat it monthly. Conversely, if a particular preparation is below the median for its food group, it is a culturally negative attribute for the preparation, in that it is not well-known, well-liked, or consumed. For each culinary preparation, when the values of the first four indicators above were greater than the median of the food group an arbitrary value of 100% was assigned to indicate positive sustainability; and 0% when these proportions were below the median. However, when the proportion of how many people say they never consume the preparation was below the median an arbitrary value of 100% was assigned to denote that it is a commonly consumed preparation; and 0% when this proportion was above the median. Thus, when vegetable omelet with mashed potatoes is compared to its food group, protein, the median for recognition was 0.6%, liked 66.7%, not liked 0%, consumed monthly, 25%, and never consumed, 18.2%, resulting in the following values for vegetable omelet with mashed potatoes: recognition: 0%, liked: 100%, not liked 0%, consumed monthly: 100%, and never: 100%. Once all five indicators for each culinary preparation were compared to the median for its food group and the values of 100% or 0% assigned to denote cultural relevance, all preparations were weighed using arbitrarily assigned weights to be able to rank all culinary preparations independent of food group; and summed across the five indicators. Specifically, recognition 10%, liked 25%, not liked 15%, consumed monthly 30% and never 20%. Thus, for a vegetable omelet with mashed potatoes: recognition: 0% (10%*0), liked: 25% (25%*100), not liked 0% (15%*0), consumed monthly: 30% (30%*100) and never: 20% (20%*100); for a total of 75%. Once this process is completed for each culinary preparation, all culinary preparations can be ranked in terms of their cultural sustainability.
Physical access and availability criteria
Two indicators were used to estimate the physical access and availability dimension: physical access and monthly consumption. In the focus groups, physical access information was not collected for each specific culinary preparation but was collected for the main ingredients included in each culinary preparation. Thus, the physical access data were based on the type of food outlet accessed for the main ingredient in each culinary preparation, which was categorized as neighborhood stores, or good access; supermarkets, or regular access; and difficult access. Good access was defined as the main ingredient(s) that could be bought in local neighborhood markets, farmers’ markets, butcheries, etc. Within the Chilean population, local fruit and vegetable markets (indoor and outdoor), butchers, and bakeries are likely to be closer to consumers. Farmers’ markets also favor access to the more vulnerable sectors of the population as they are more concentrated in areas of lower socio-economic status, different from the large supermarket chains that have more concentration in wealthier neighborhoods (Carreño and Silva, 2019; Saez et al., 2010). Regular access was assigned if ingredients were mainly bought in supermarkets, and bad access if access to the ingredient(s) was only occasional or irregular, e.g., gifts from relatives or harvested. They were scored by weight in the final culinary preparation as with the previous dimensions. After each ingredient had its percent physical access determined, the percent physical access of the overall preparation is averaged according to the weight of each ingredient per standard portion of the culinary preparation. The frequency of consumption (never, monthly) as reported during the focus groups was used to indicate monthly consumption. Monthly consumption was incorporated into the physical access criteria based on the assumption that if one consumes a preparation every month, it is also because they can stock up on the ingredients on a “regular” basis. They were scored by terciles, subjectively attributed a 100% for those with good access, 66% if regular, and 33% if difficult. For the estimation of this dimension, physical access was given a weight of 70%; and monthly consumption a weight of 30%, as shown in Table 1. Physical access was given greater weight than monthly consumption because it is a more direct indicator of where they obtain the food and its availability within a certain county. While monthly consumption has a lower weight as it is more subjective than that of physical access, i.e., the availability of ingredients is presumably easy, and stable. To follow the example of the vegetable omelet with mashed potatoes because all the ingredients can be purchased from a farmers’ market, physical access for this culinary preparation was designated as good access for an overall value of 100%. Based on the same data used to determine the cultural sustainability dimension, of those that recognized vegetable omelet with mashed potatoes 50% reported monthly consumption that was over the median monthly consumption for the protein group; to give an overall value of 100%. Thus, the physical access dimension for vegetable omelet with mashed potatoes is 100%, or ΣPhysical Access (100%*0.7) + Monthly Consumption (100%*0.3).
Economic access and price criteria
Two key concepts were used to assess the sustainable diet dimension of economic access and price criteria. Price perception was designed as a categorical weighted indicator as the participants’ perception of the ingredient costs (inexpensive, regular, and expensive—granted 100, 66, and 33%, respectively) based on terciles of assumed affordability, where inexpensive ingredients had the best economic sustainability (100%) and expensive the worst (33%). When price perception data for an ingredient were not available, the price data for a similar ingredient were assumed (e.g., broccoli instead of cauliflower). Monthly consumption was considered as an indirect indicator of economic access, as it also has assumptions such as an ingredient could be consumed less if more expensive. The price was weighted 70% and the frequency of consumption 30% for this dimension, as the price is the most important indicator of economic access, while the frequency of consumption is a proxy of affordability and is based on assumptions. To follow the example of vegetable omelet with mashed potatoes, the economic access and price criteria were calculated based on the data that all main ingredients (i.e., eggs, vegetables, and potatoes) are inexpensive; and the monthly consumption is above the median monthly consumption for the protein group. Thus, the economic access and price dimension for vegetable omelets with mashed potatoes is 100%, or ΣPrice (100%*0.7) + Monthly Consumption (100%*0.3).
Global sustainability score criteria
Once all culinary preparations were assigned a score for each of the five sustainability dimensions, an overall global sustainability score was determined. The first step was to organize all culinary preparations according to their food group. For example, vegetable omelet with mashed potatoes is in the protein group; and as previously determined has a cultural acceptability dimension of 75%; physical access and availability of 100%; economic access and price of 100%; environment of 94%; and nutrition of 68%. The next step was to exclude any culinary preparation with <33% physical access and availability because such preparations could not be recommended if people could not access them. The global sustainability score was calculated as follows: Σ (30%*cultural dimension) + (30%*economic dimension) + (20%*environment dimension) + (20%*nutrition dimension). Then, among each specific food group, only those that had a global sustainability score of 66% or greater, and did not have any dimension <40%, were included. Within each food group, the final list of culinary preparations was ranked according to their overall sustainability score in descending order. By meeting the aforementioned inclusion criteria, the final list of classified culinary preparations was considered sustainable culinary preparations in which to promote consumption among the Chilean population.
Results
Thirty-five percent, or 124 of the 351 culinary preparations included in the final study sample achieved a global sustainability score of at least 66% (Figure 1). The best scoring sustainable culinary preparations are all plant-based and are shown in Table 2. The results follow for each specific dimension and then for the global sustainability criteria.
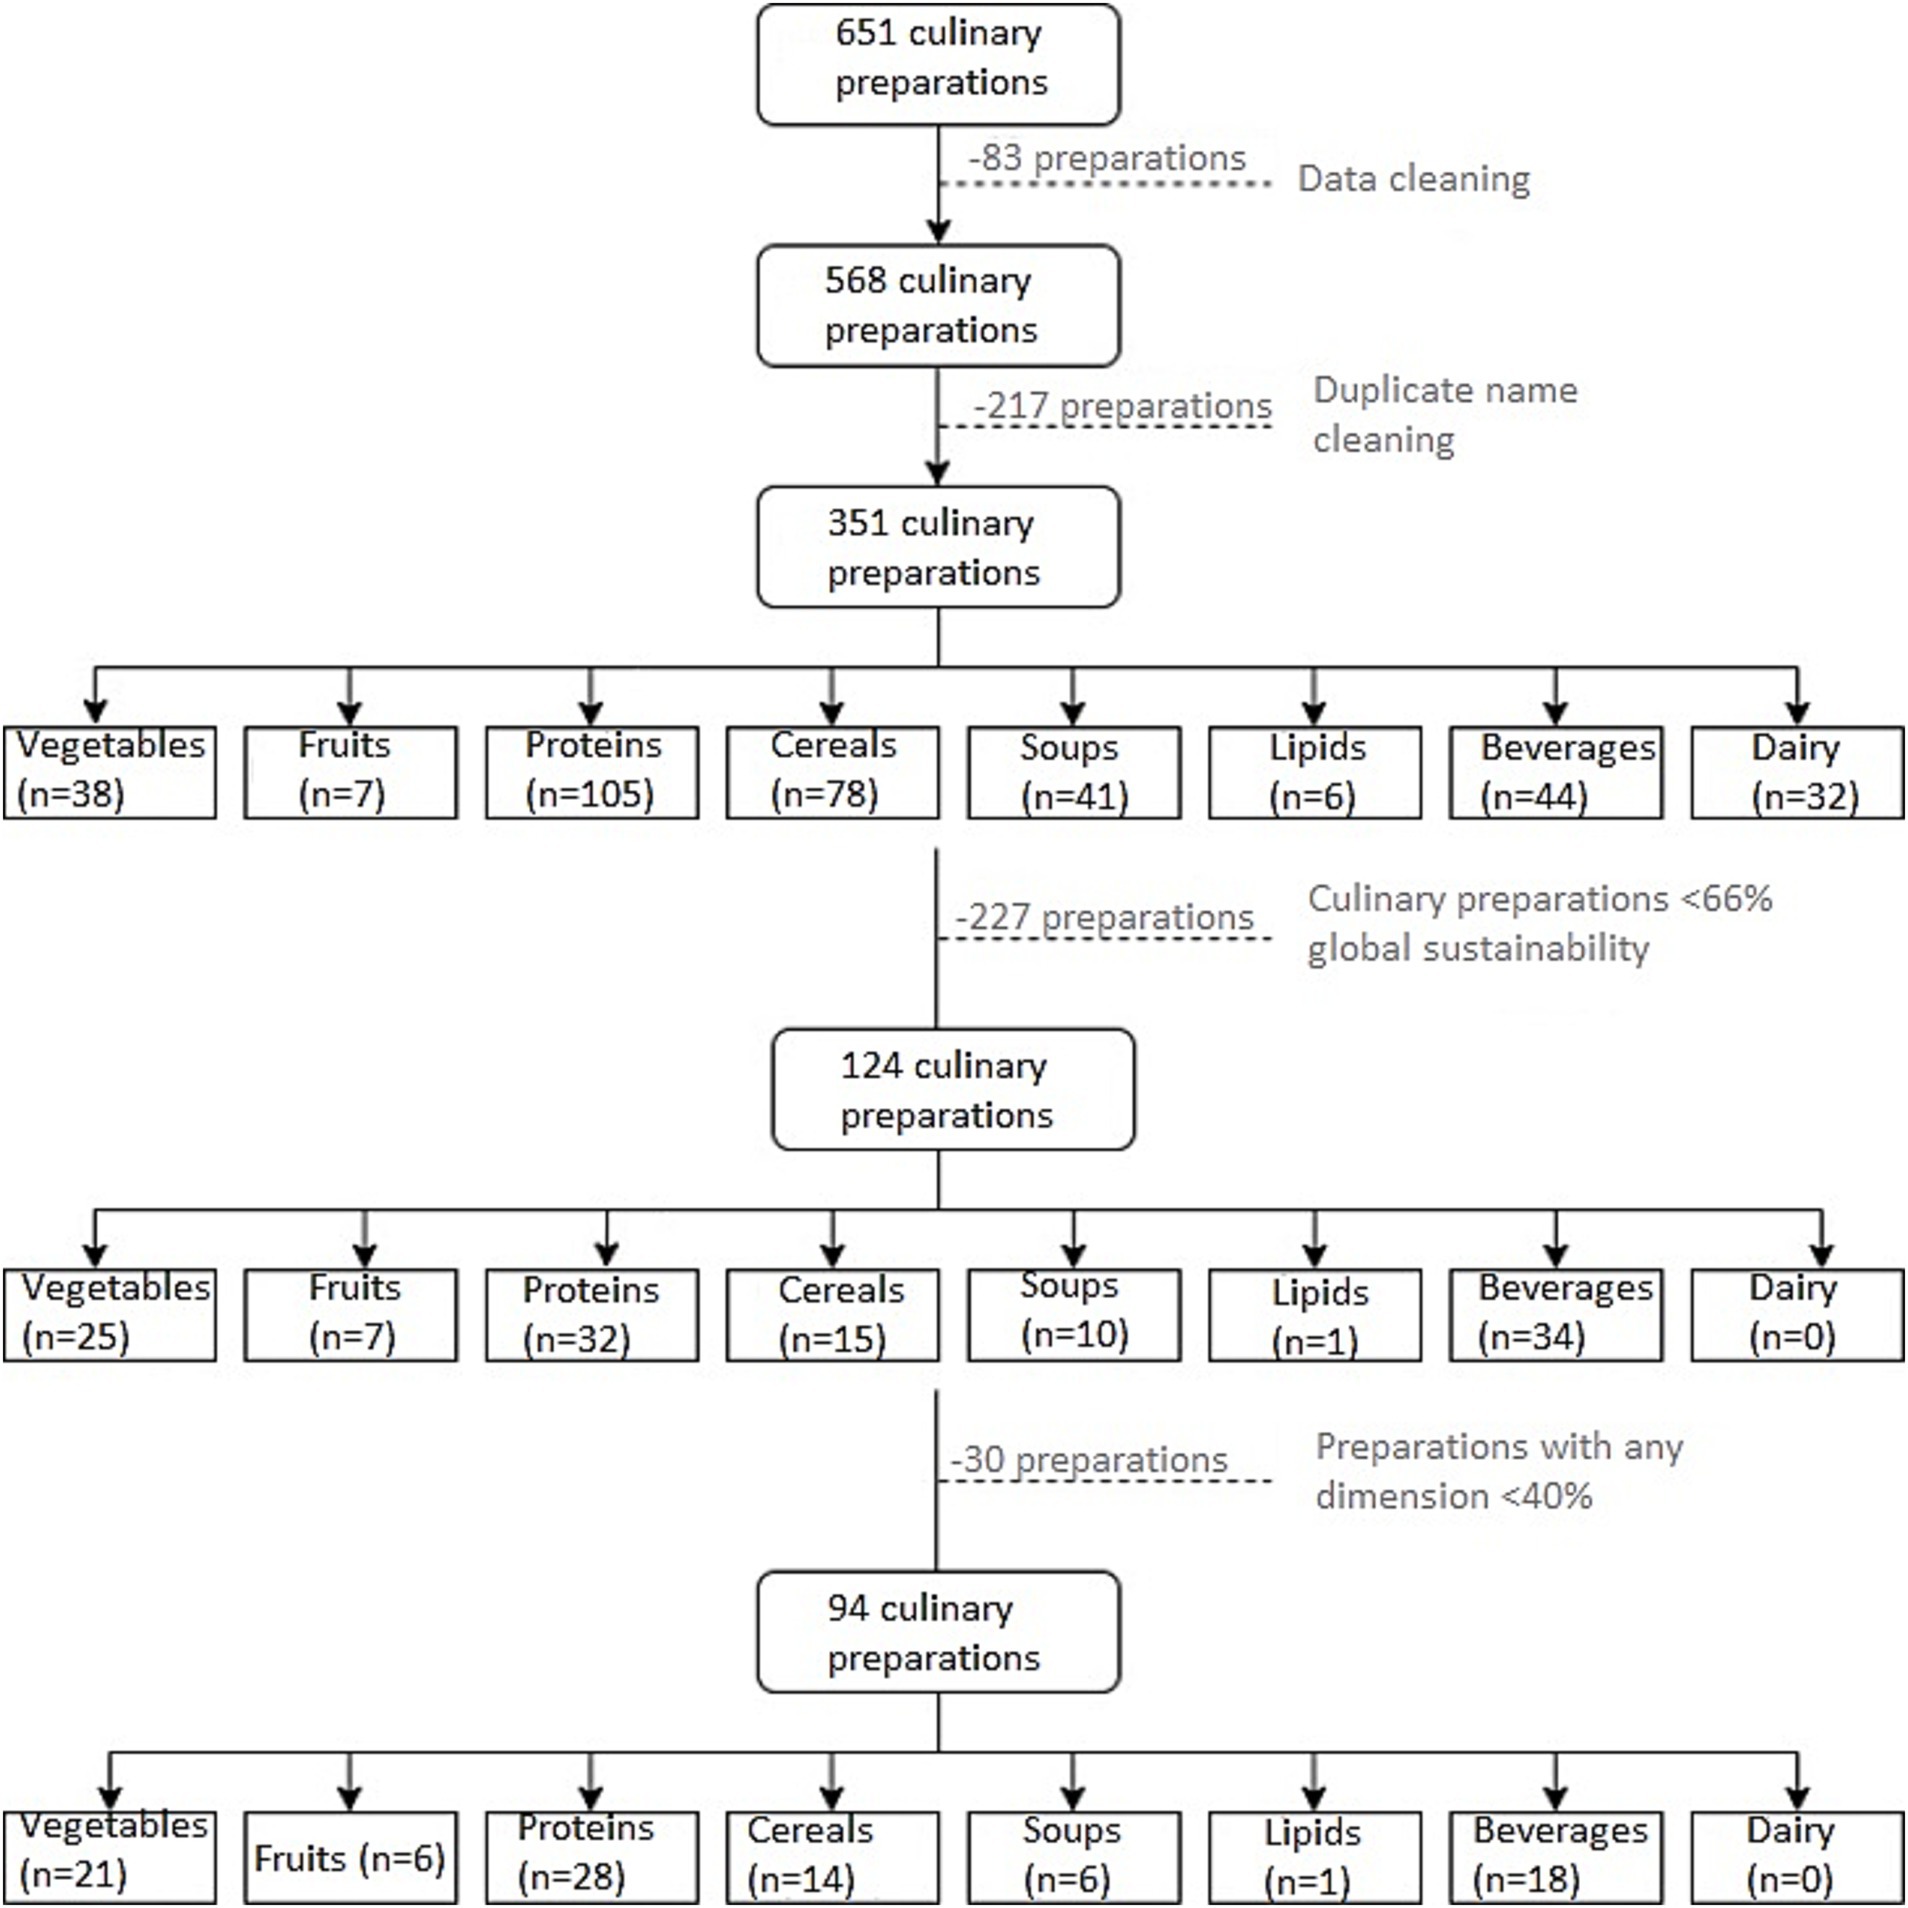
Figure 1. Culinary preparations and selection process.
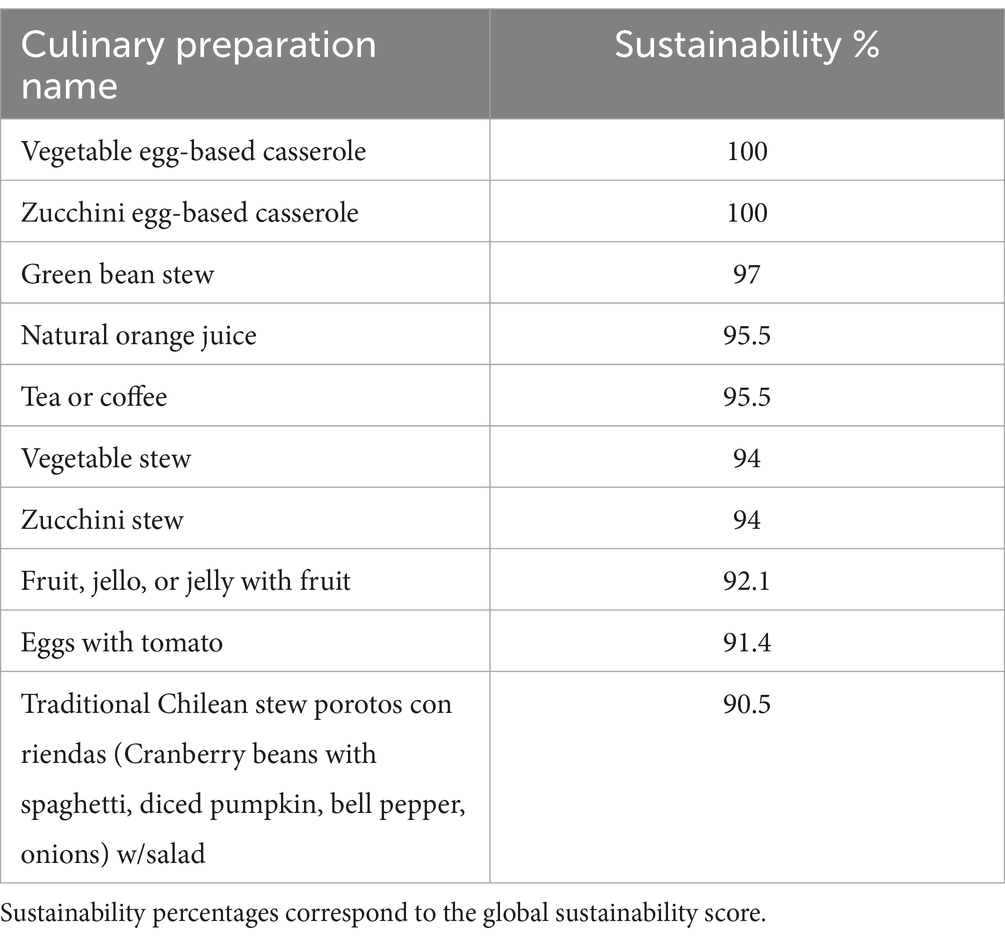
Table 2. Top 10 culinary preparations.
Environmental impact
Most of the culinary preparations in the vegetable and fruit food groups scored 100% in the environmental impact dimension (Table 3). Of the selected 32 culinary preparations in the protein group that achieved 66% global sustainability, 13 scored 100% in the environmental impact dimension, all of which included fish or seafood. Two-thirds of the culinary preparations in the cereal food group scored 100% in the environmental impact dimension that consisted of preparations with native grains (e.g., husked wheat or mote, quinoa) and potatoes. Nearly all the culinary preparations in the beverage group also scored 100% in the environmental impact dimension, such as juices, coffee/tea, and water. Only one culinary preparation (frozen vegetables) was excluded for not achieving at least 40% environmental impact (Figure 2).
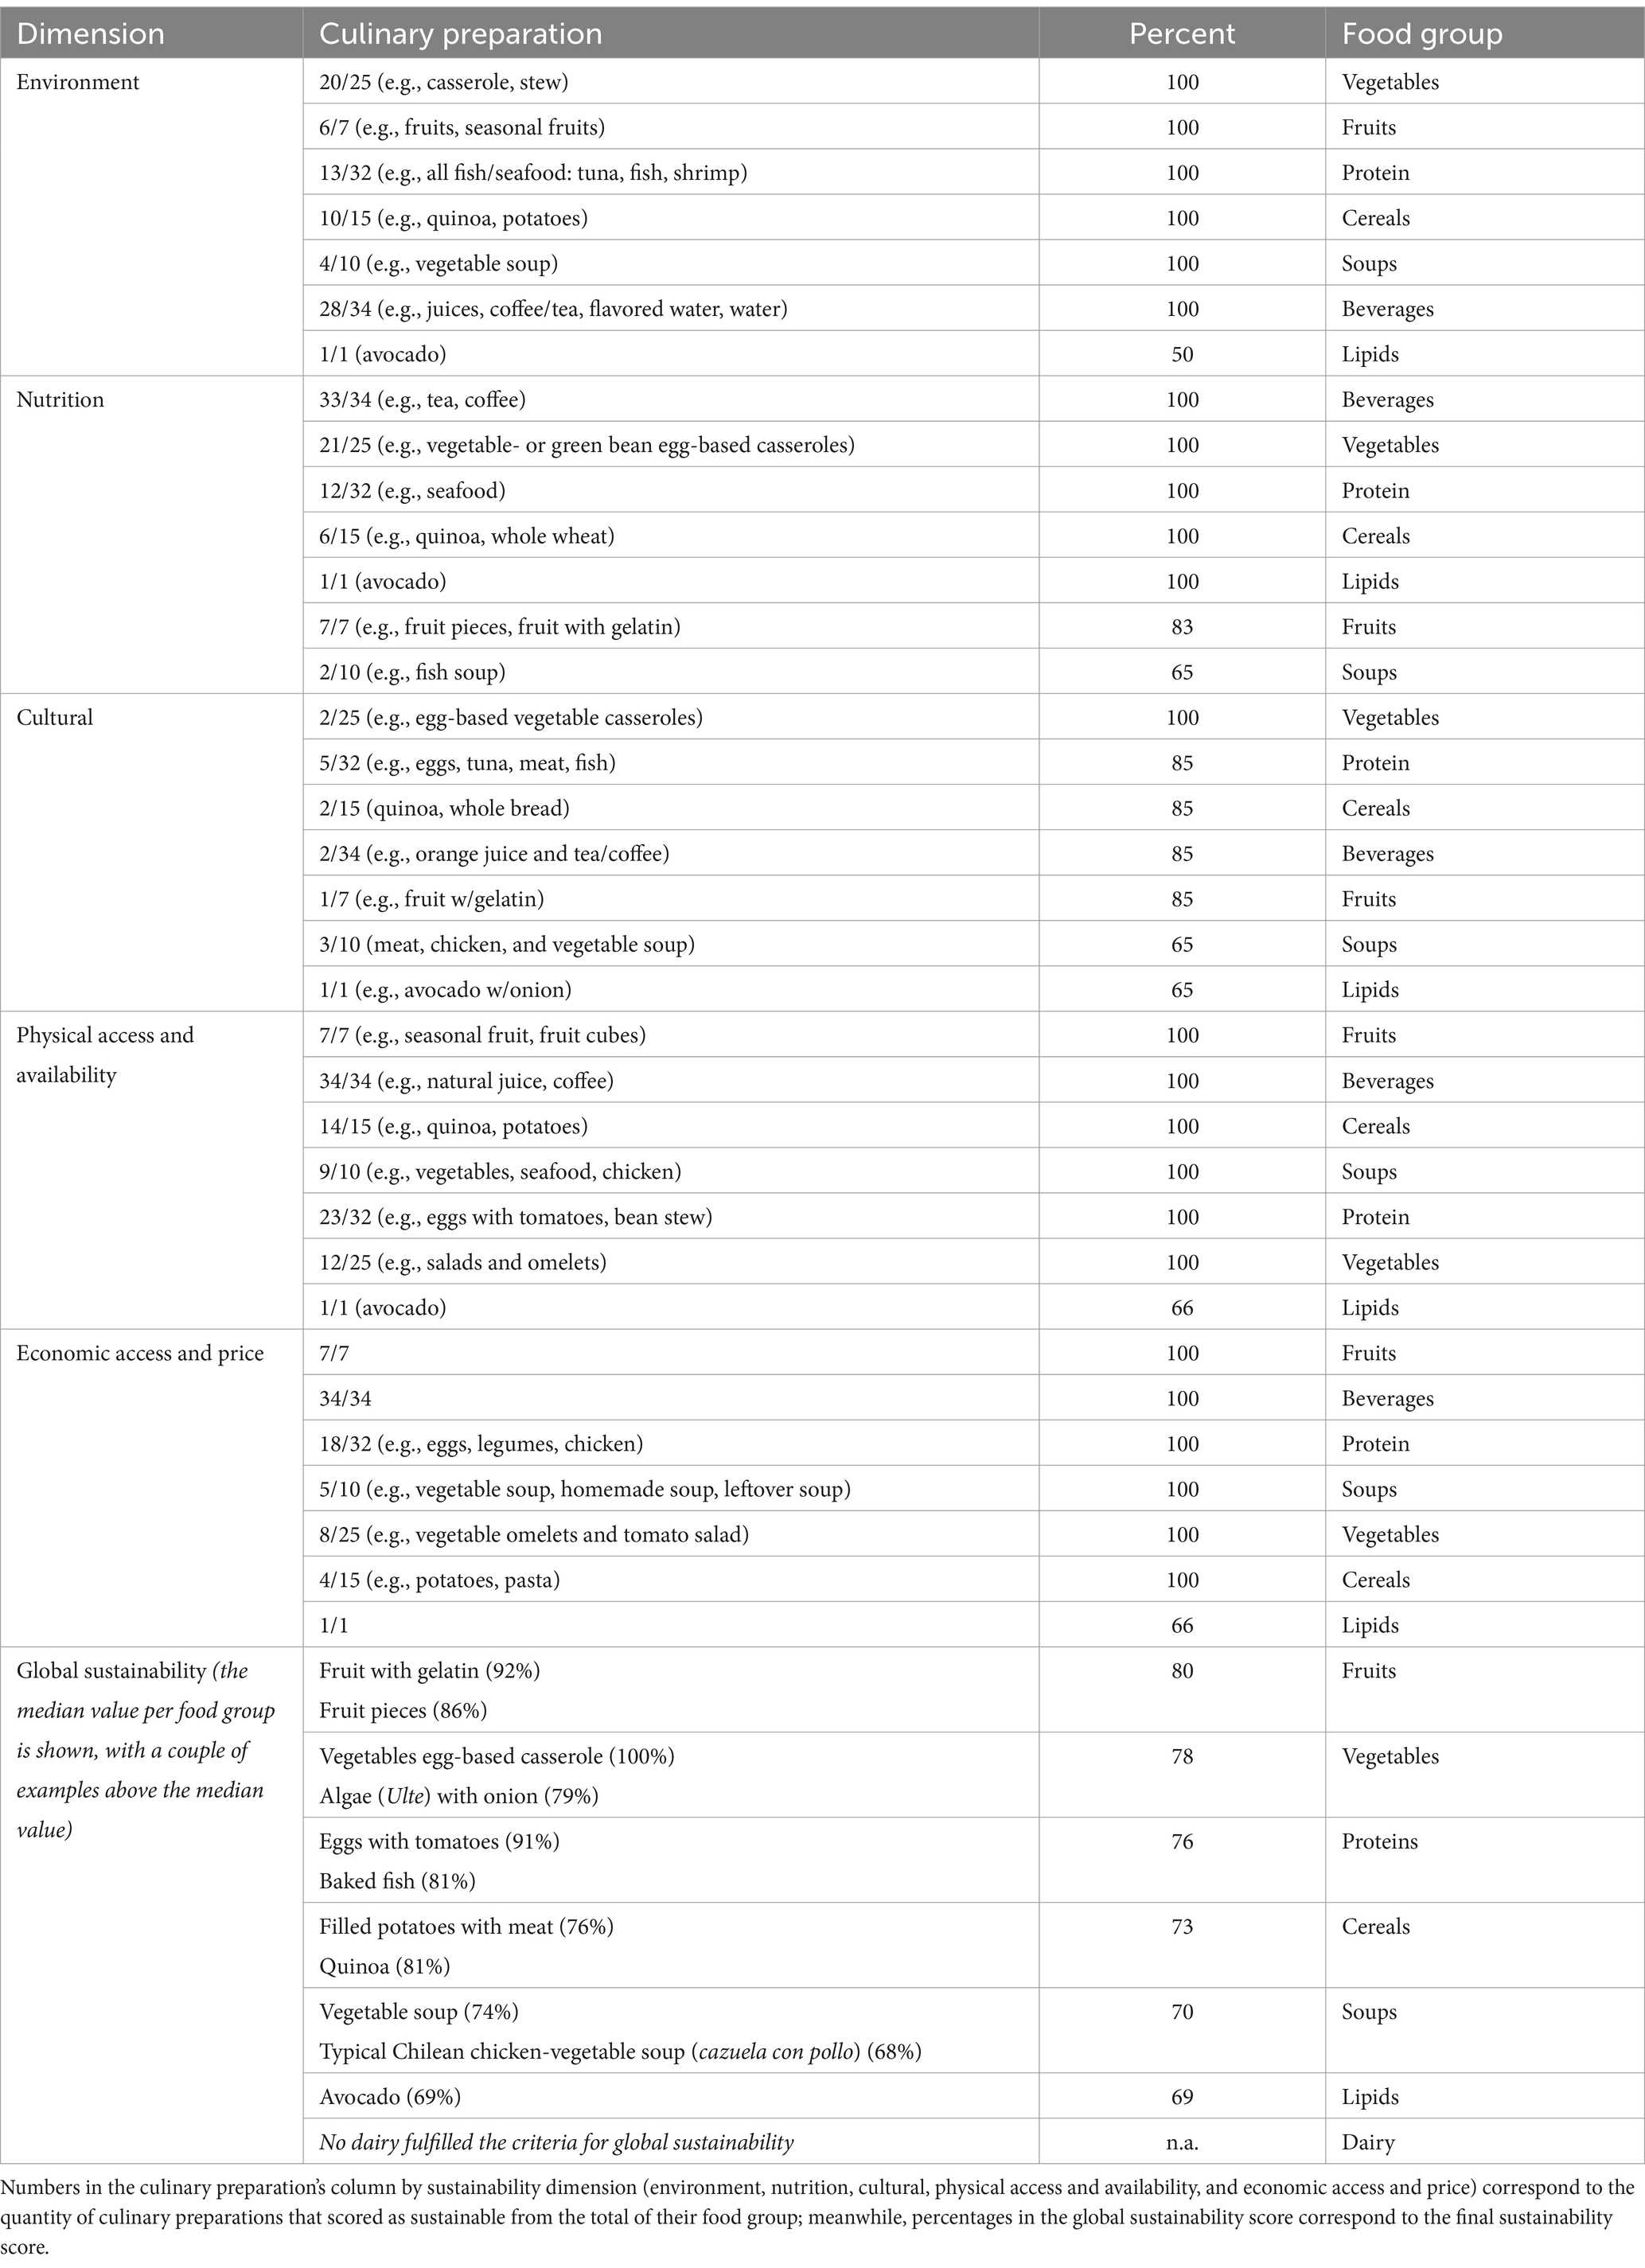
Table 3. Best scoring culinary preparations by food group and sustainability dimension.
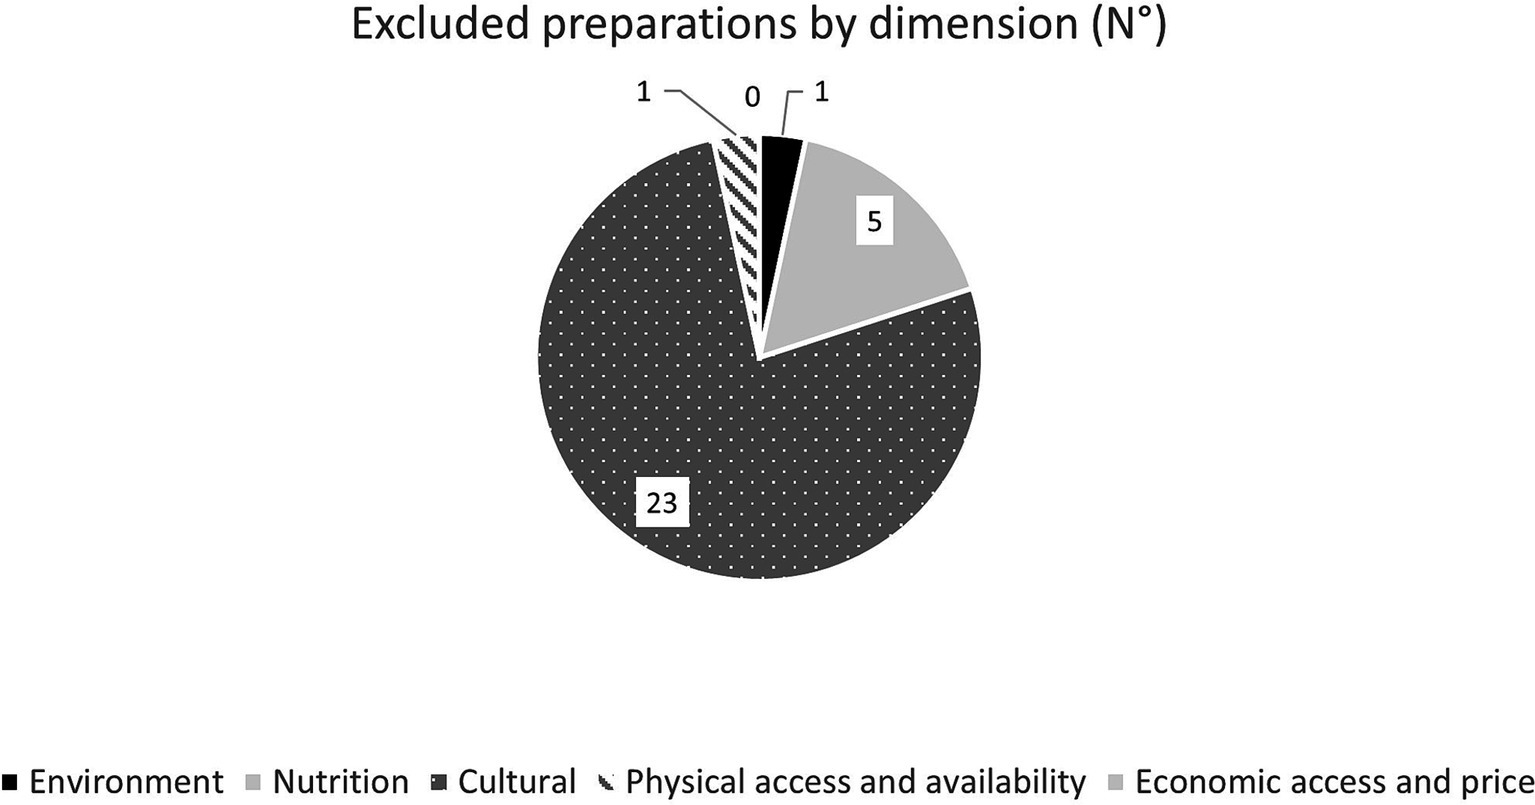
Figure 2. Number of culinary preparations with a final sustainability score ≥ 66% that were excluded for scoring any dimension below <40%.
Nutrition impact
All fruits and nearly all beverages scored 100% in the nutritional impact dimension (Table 3). Most of the vegetable preparations also scored 100% in nutritional impact, mainly stews and egg-based vegetable casseroles. More than a third of the protein group scored 100% within this dimension which consisted of fish and seafood. Moreover, about half of the cereals group reached 100%, all of which were ancestral grains such as quinoa, husked wheat, and amaranth. Five culinary preparations were excluded for not meeting at least 40% of the nutrition dimension (Figure 2).
Cultural impact
Among all food groups, only two culinary preparations from the vegetable food group scored 100% in the cultural dimension: vegetable and zucchini egg-based casseroles. Only 10 culinary preparations achieved 85% in the cultural impact dimension from the protein (n = 5), cereal (n = 2), beverage (n = 2), and fruit (n = 1) groups. Twenty-three culinary preparations were excluded for not meeting at least 40% of the criteria for the cultural dimension (Figure 2), such as dried figs, seaweed (cochayuyo) salad, canned fish with boiled potatoes, husked wheat salad, and water with oatmeal.
Physical access and availability
All the fruits and beverages scored 100% in terms of physical access and availability. All cereals and soups except one in each category (whole grain bread and chicken soup) also scored 100%. More than two-thirds of the protein group scored 100%, with the exceptions being seasonal legumes, canned, and frozen ingredients. Half of the vegetable preparations also scored 100%, mainly salads, egg-based casseroles, and omelets. The lipid group (avocado) scored 66%. Only one culinary preparation (seaweed stew) was excluded based on physical access and availability (Figure 2).
Economic access and price
All the fruit preparations and beverages scored 100% in the economic access and price dimension. Over half of the protein group scored 100% including eggs, legumes, and chicken, whereas meat, fish ceviche, and baked fish scored the lowest. Half of the soup preparations scored 100%, mainly those only with vegetables. One third of the vegetable group scored 100%, but not the vegetable culinary preparations with seaweed or frozen vegetables. Only four cereal preparations scored 100% in terms of economic access and price, mainly potatoes and pasta. The lipid group (avocado) scored 66%. No preparations were excluded because of economic access (Figure 2).
Global sustainability
Seventy-five percent, or 94, of the 124 culinary preparations that achieved at least 66% global sustainability also achieved at least 40% on each of the five dimensions (Figure 1). All the culinary preparations in the fruit group except for one were selected as sustainable (Figure 3). The vegetable food group was the only other food group in which over half (55%) of the culinary preparations were also included in the final study sample. In the beverages group, 18 of 44 culinary preparations were selected (41%). Within the proteins group, 28 of 105 culinary preparations (27%) were selected. In the cereals group, 14 of 78 culinary preparations (18%) were selected. In the soups group, 6 of 41 culinary preparations (15%) were selected. In the lipid group, only one of six culinary preparations (17%) was selected. Finally, in the dairy group none was selected, mainly due to low scores in nutritional and economic dimensions. Thus, after considering those that achieved at least a 66% global sustainability score and at least 40% on the four dimensions, in terms of global sustainability, the highest median value was 80% in the fruits group, such that fruit with gelatin achieved 92% and fruit pieces 86% sustainability, respectively. The median value of the vegetable group was 78%, with vegetable egg-based casserole achieving 100% global sustainability, while the median values of the protein, cereal, and soup food groups were 76, 73, and 70% (Table 3). Of the 94 culinary preparations included in the final study sample, the top 10 culinary preparations ranked according to global sustainability score are presented in Table 4.
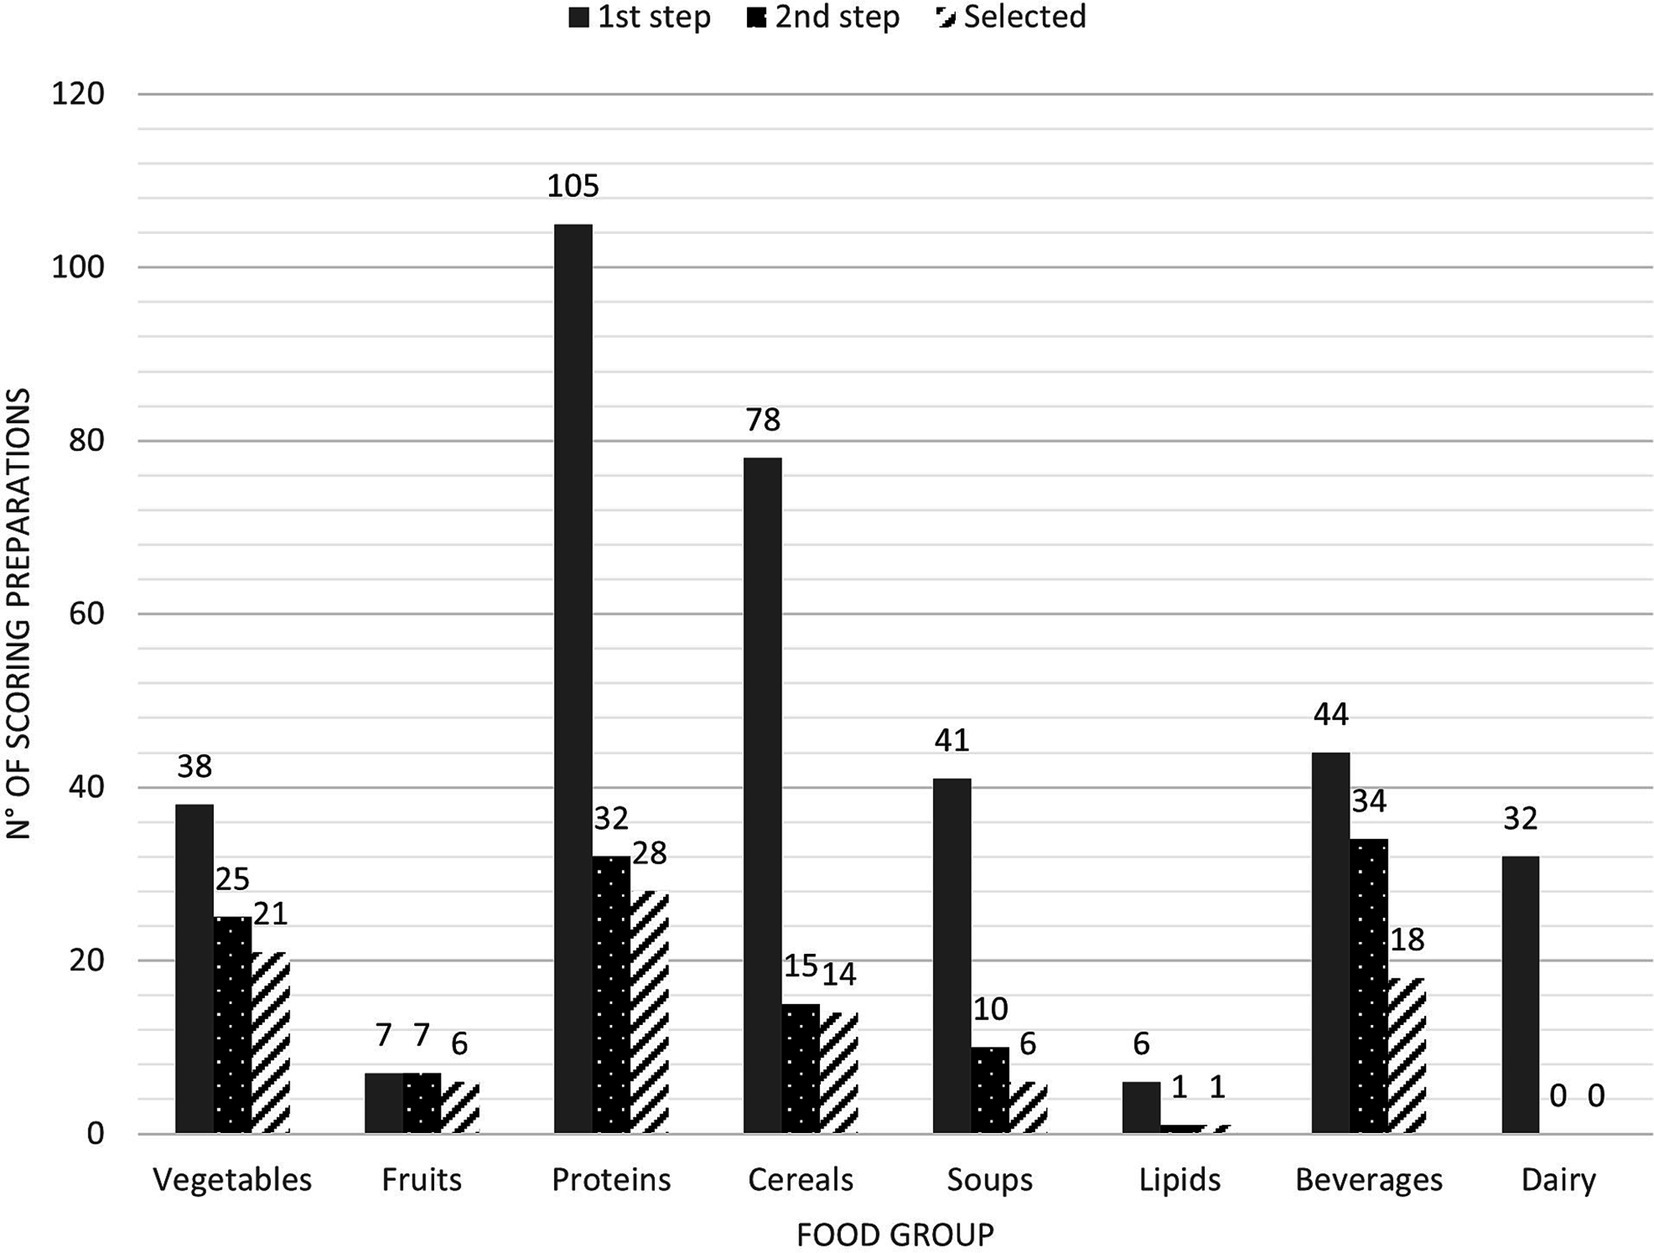
Figure 3. No. of culinary preparations per scoring step. The first step refers to the food group total. Those culinary preparations that reached 66% of global sustainability are the second step. Selected are those culinary preparations after excluding those that had any dimension below 40% sustainability.
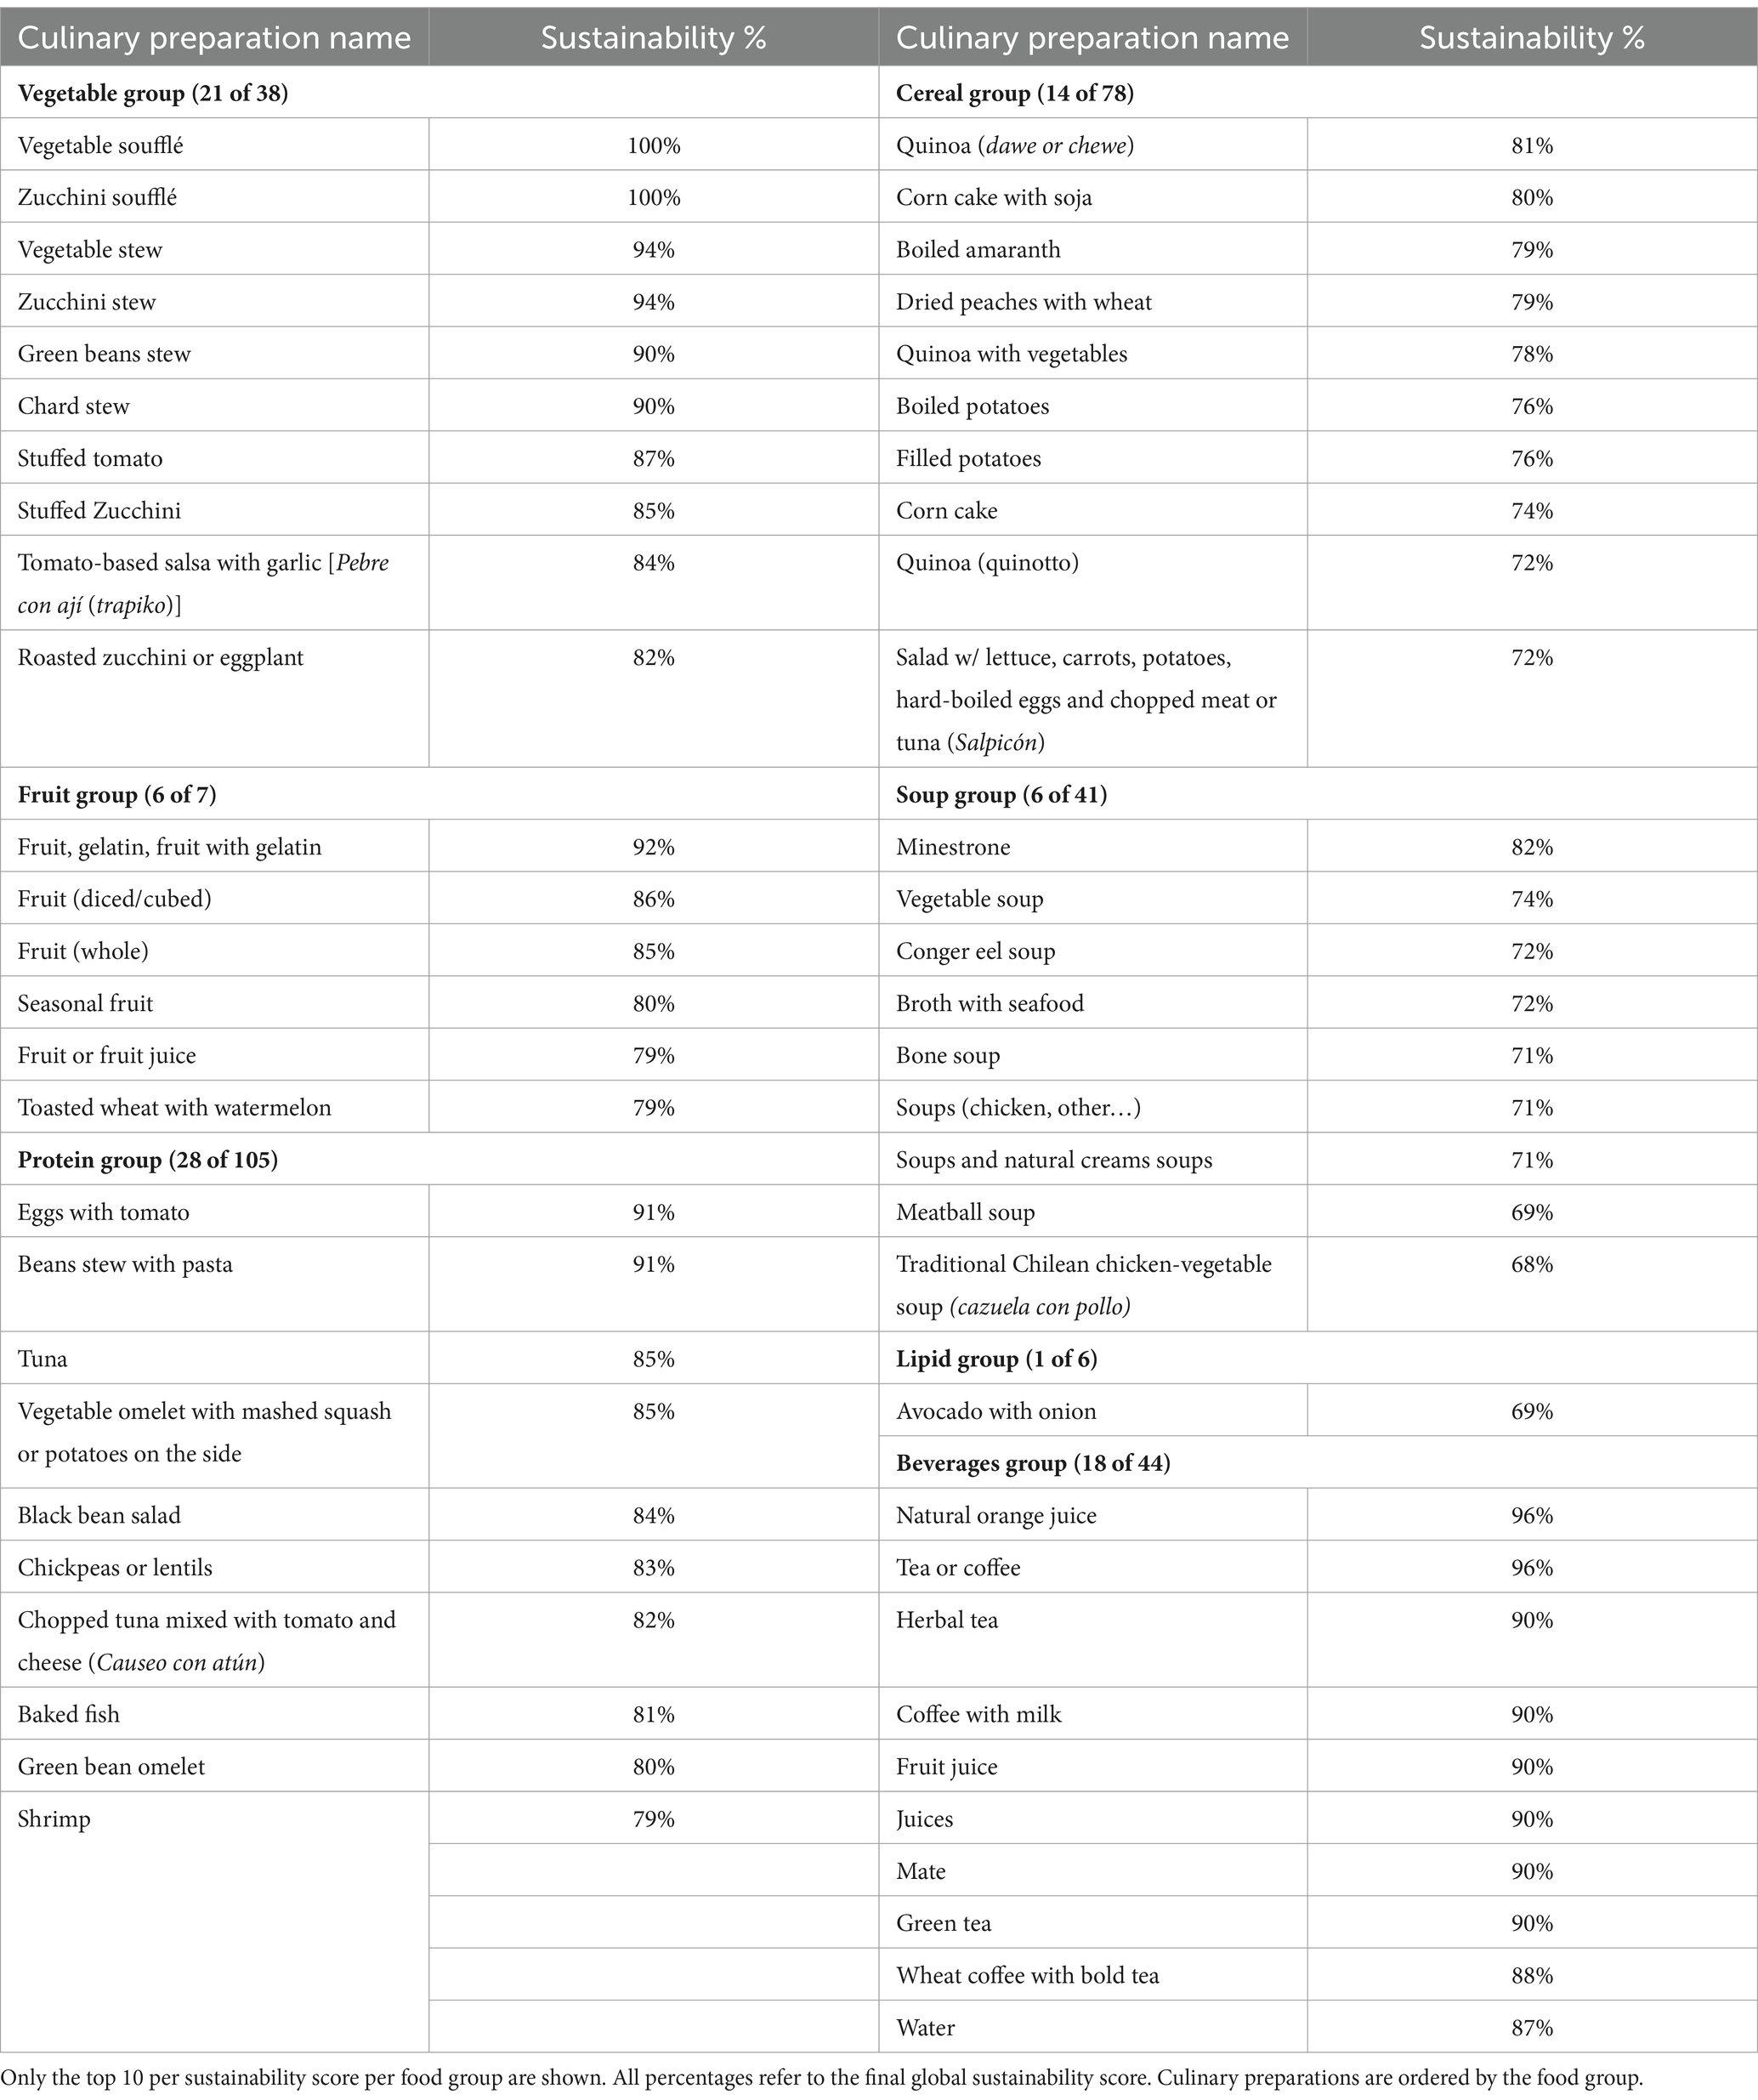
Table 4. Final sustainability percentage for the selected culinary preparations by food group.
Discussion
The objective of this study was to integrate different dimensions of sustainable diets (e.g., physical access to foods) into one assessment method and translate these dimensions from diets to culinary preparations. Based on the estimation method for the sustainability of culinary preparations we constructed, 94 culinary preparations were identified as sustainable out of a total of 351 traditional culinary preparations (27%) for the Metropolitan Region of Chile. In which every sustainable culinary preparation is considered healthy, with a reduced environmental footprint, physically and economically accessible, and culturally acceptable.
Different dimensions account for high scores among the food groups. The vegetable group stands out for high scores in nutrition, environmental, and cultural dimensions, but not in terms of economic or physical access. The fruit, protein, cereal, and beverage groups have high scores in every dimension but the cultural one. Soups also scored very high in each dimension, except for nutrition. Only one of the culinary preparations from the lipids group and none of the dairy preparations were included in the final study sample. These results suggest that it is important to include multiple dimensions when assessing the dietary sustainability of culinary preparations. Only assessing dietary sustainability through a single dimension will prevent an understanding of the sociocultural and socio-economic factors related to promoting a particular culinary preparation or food group for healthy and sustainable diet consumption in the population.
The secondary aim of this study was to determine whether the methods used to estimate each dimension of sustainable diets are adequate for the determination of each dimension and the overall indicator of global sustainability. Approximately 24% (n = 30) culinary preparations were excluded from the calculation of the overall indicator of global sustainability because they did not achieve at least 40% on one dimension; the majority of which was due to the cultural dimension (n = 23). Thus, cultural acceptability may be the greatest limiting factor to sustainable diets when considering all five dimensions of sustainable diets. On the contrary, price was not the reason for exclusion (<40%) for any culinary preparation. Even though the focus group participants in this study were from vulnerable neighborhoods, suggesting that traditional preparations are still affordable for low-income Chileans.
Surprisingly, while pulses in this study are inexpensive culinary preparations, with a high cultural score and good physical access, they are only eaten by 14% of the participants. This is consistent with governmental data in which pulses are eaten two times a week by only one in four people (Ministerio de Salud Chile, 2017a). There may be cultural constraints of pulses being associated with poverty, higher cooking times and consider a difficult culinary preparation to cook, and where young people lack cooking knowledge (Barrientos-De la Rosa et al., 2023; Pinheiro et al., 2018). A similar case was found with fruits, where every fruit-based culinary preparation scored the highest within the economic dimension and therefore price did not seem to limit consumption. However, only 15% of the population eats two portions of fruits a day (Ministerio de Salud Chile, 2017a).
A compensatory effect could exist between taste and price, in which if the culinary preparation is very much liked or culturally important, people would be willing to pay a higher relative price. For example, in the case of vegetable-based salads, tomatoes are highlighted as a favorite, despite participants classifying them as more expensive than other vegetables. Other expensive culinary preparations that are eaten monthly are avocados and barbecued or stewed meats. Even though these preparations scored as the most expensive culinary preparations in their food group (17% in economic dimension), they were still eaten monthly by most participants as they are culturally very important. In contrast, participants had lower taste preferences for dairy foods, and thus people probably would not be willing to pay a higher perceived price. During the twentieth century, Chile has been through a nutritional transition. As a result, meat, dairy, and avocado consumption increased over this time. Specifically, meat consumption in Chile increased from 32 to 36 kg per capita from 1930 to 1980 to 86 kg in 2010 (Llorca-Jaña et al., 2022). This highlights the fact that interactions between different sustainability dimensions may arise, emphasizing the importance of integrating different dimensions in the same estimation for population recommendations.
Cultural acceptability appears as a main barrier to eating healthier and more sustainable diets. Together with lack of time, distrust of the food industry, and prices, dislike of specific foods persists (Muñoz-Martínez et al., 2024), highlighting that personal preferences are the ultimate goal when promoting more sustainable diets. Cooking workshops and recipe adaptations could be suggested. Fortunately, in general, traditional culinary preparations seem to be healthy, affordable, and sustainable, providing an excellent opportunity to promote these types of meals to the general population.
Most studies regarding food or diet sustainability have focused on whole dietary patterns (i.e., “healthy,” Mediterranean, vegan, western, etc.) considering mainly nutrition and environmental impact (Arrieta and González, 2018, 2018; Ridoutt et al., 2021; Sala et al., 2020; Springmann et al., 2018; Willett et al., 2019) leaving out other dimensions such as cultural acceptance and affordability. Recently, global efforts have included affordability (Bai et al., 2021; Herforth et al., 2020), but these attempts still lack the dimension of cultural acceptability.
Previous studies have also studied the sustainability of traditional culinary preparations but focused exclusively on carbon footprint (Goel et al., 2023; Mannheim and Avató, 2023; Torstensson et al., 2021). A recently published study in Chile has also studied different indicators in order to evaluate culinary preparations in collective food services/restaurants (Cáceres et al., 2024). Six indicators were selected: carbon and water footprint, local origin, waste when cooking, and the presence of meat and animal food. One similarity with our proposed method is that for the estimation the authors also used grams transformed into a percentage of ingredients within the culinary preparation. This method differs from the one proposed here most importantly by two factors: (i) the methods and quantities for obtaining the traditional preparations dataset (they selected 10 from an online survey, while we used over 350 obtained from focus groups); (ii) the sustainability dimensions included (they only estimated environmental sustainability from indicators chosen from expert consultation). We also propose a cutoff value for each dimension, and the inclusion of locally raised information, such as monthly consumption, likeability, and price perception.
Promoting sustainable culinary preparations rather than whole diets could be easier to promote and for the population to adhere to as they provide practical advice for consumers on what to buy or cook. In fact, in 2022 Chile released its new FBDGs (Ministerio de Salud Chile, 2022). This new version included for the first time the environmental sustainability dimension. Furthermore, in Chapter XV of these guidelines many recipes for traditional dishes were incorporated under the premise of “how to incorporate these guidelines in your routine.”
We did an attempt to propose a weekly meal plan based only on sustainable culinary preparations from our results (Suppl. Table S1) to check whether it could be a feasible diet, and afterward estimated its nutritional intake in terms of calories and macronutrients. The adequacy reached an adequacy of ±5% from the recommendations, which shows these suggestions of sustainable culinary preparations are nutritionally adequate (Suppl. Table S2). Finally, to double-check our proposal, we did a comparison from our preparation-based meal plan with the EAT-Lancet Planetary Health Diet (Willett et al., 2019), and our proposal stayed within all of the EAT-Lancets’ consumption ranges for every food group (Suppl. Table S3). This is a practical way of how our study methods and results could be used.
Limitations, strengths, and relevance of the study
This study has many limitations. Among them, ingredients were estimated according to a standard portion and not necessarily to its actual quantities as well as their ingredient estimation from generic nominations (e.g., fruit smoothie/vegetable omelet). Therefore, the weight (grams or milliliters) included within the actual recipe could differ in its final sustainability percentage. Future studies should aim to use recipe booklets or collect recipe information to be more accurate that could also serve as an input when ingredient substitutions are made or suggested. Another limitation is that there are approximately 25 culinary preparations out of 95 that participants generically named, “salads” or “pulses,” without naming any specific ingredient. It can also be argued that the qualitative data used in this study are subject to bias common to qualitative studies, such as individual opinions being influenced by others and group topic discussed control (Wong, 2008). To minimize some of these sources of bias, all the focus groups in this study were carried out by skilled and trained facilitators with a comprehensive knowledge of Chilean cuisine and ethnographic methods. Even though the Metropolitan Region in Chile contains half of the Chilean population, and the participants included people from peri-urban areas and indigenous ethnicity, these results and methods should be considered mainly for this geographic area. Different geographic locations, in Chile and elsewhere, have differences in culinary traditions, agricultural production, and food access (Gutiérrez et al., 2023). The use of the indicator “monthly consumption” in more than one dimension, signifies that it has more final weight in the global sustainability score. Even though food likeability is also used as a cultural food preference (Drewnowski et al., 1999; Kanter and Gittelsohn, 2020), future studies could use more indicators for cultural acceptance, such as dietary adherence using the Perceived Adherence Questionnaire (PDAQ) (Asaad et al., 2015), minimizing dietary change from the real diet (Sugimoto et al., 2022), food dairies (Heo et al., 2015), and 24-h dietary recall surveys. How the economic access dimension was assessed also has inherent limitations, as it was asked as a subjective perception of the costs and not through objective indicators, such as a share of the income in Chile, household budget surveys, or percentage of food expenditure (Bai et al., 2021; FAO, IFAD, UNICEF, WFP, WHO, 2023; Herforth et al., 2020). More recently, income per capita has been used to denote economic affordability (Bai et al., 2021; Herforth et al., 2020). Physical access and availability were also not measured directly. Finally, the nutritional content was measured by food groups and not by food items or ingredients; therefore, the nutritional content could not be differentiated between spinach and lettuce, for example. Further studies should aim to address individual food ingredients with nutritional databases and nutrient requirements, rather than relying on an index such as NRF9.3 or, if using NRF9.3, make comparisons with other indexes.
This study has similarities with other research studies that have examined diet sustainability also with subjective indicators. For example, Azzini et al. (2018) arbitrarily assigned scores (between 0 and 10) to nutrients and defined that above 5 was sustainable. In our study, we used terciles to classify each of the five dimensions consistent with that by Hallström et al. (2018) using a similar assignation as Azzini et al. (2018) by being above or below the median, as in the case of some indicators in this study. As we excluded some food groups (e.g., ultraprocessed red meat and fried foods), future studies should consider all culinary preparations to compare if this method can differentiate between healthy and unhealthy dishes, as well as for comparing the other sustainability dimensions.
This study also has many strengths. Among them, this study uses local cultural information rather than national surveys, conferring great internal validity for the Metropolitan Region population, where over half of Chile’s population resides. The participants were also diverse, women and men, from 25 years to older than 65 years, from different ethnic and socio-economic groups from both urban and peri-urban areas. This study provides a practical method that could contribute to the assessment of the national food-based dietary guidelines, so they could provide evidence-based sustainable culinary preparations recommendations, thus allowing for more local and practical recommendations. Finally, every analysis between culinary preparations or food ingredients has been made within their food group. We believe an aggregate analysis across food groups would not be methodologically sound, such as comparing meat and tomatoes, as their dimensions could be vastly different.
Recommendations
According to our knowledge, this is the first study that investigates the estimated sustainability of individual culinary preparations considering five sustainability dimensions and suggesting cutoff values. While this objective of the study was to examine the overall dietary sustainability of culinary preparations, this method could also be used to compare individual ingredients or dimensions. We recommend that when studying sustainable diets, at least these five dimensions should be considered, with a special focus on a consumer’s perceived price/cost and cultural acceptance, while considering that cultural acceptance and economic access are highly context specific. A question that remains unanswered is how and to what extent cultural and economic dimensions interact to determine the cultural preferences of diets. It seems that taste is more important than price in some cases, suggesting that for food that is very liked, people would be willing to pay a higher price (e.g., avocados). Future studies could evaluate this compensatory relationship. However, we would recommend using more indicators in the cultural acceptance dimension. For example, further inquiring on the likeability of ingredients or culinary preparations, and the reasons behind consumption or avoidance.
The thresholds and methodology used in this study can be adapted to other realities and local data globally as it is context dependent. Weights and indicators may be adapted to local realities as well the inclusion of more objective indicators. Validation with local experts will be an additional asset when adapting the methodology. These methods and results could be useful to propose feasible improvements to achieve more sustainable diets that are aligned with current national policies, such as within FBDGs, through specific recommendations on culinary preparations.
This method and results could serve as an important contribution to public policies, specifically through the provision of concrete recommendations in FBDGs. Academia, especially nutrition and food systems experts, should actively persuade policymakers on importance of sustainable diets for public and planetary health. Even though sustainability is increasingly considered in public policies, more emphasis and urgency is needed. Concrete examples for everyday life for consumers may be an efficient first step to improving adherence to healthy and more sustainable dietary guidelines.
Data availability statement
The raw data supporting the conclusions of this article will be made available by the authors, without undue reservation.
Ethics statement
The studies involving humans were approved by the Comité de Ética de Investigación en Seres Humanos de la Facultad de Medicina, Universidad de Chile. The studies were conducted in accordance with the local legislation and institutional requirements. The participants provided their written informed consent to participate in this study.
Author contributions
OT-O: Conceptualization, Data curation, Formal analysis, Investigation, Methodology, Writing – original draft, Writing – review & editing. CC: Methodology, Supervision, Writing – review & editing. RK: Conceptualization, Data curation, Formal analysis, Funding acquisition, Investigation, Methodology, Project administration, Resources, Supervision, Writing – original draft, Writing – review & editing.
Funding
The author(s) declare that financial support was received for the research, authorship, and/or publication of this article. This study was supported by the Fondo Nacional de Desarrollo Científico y Tecnológico (no. 11170225) from the Comisión Nacional de Investigación Científica y Tecnológica of the Chilean government. The publication costs of this article were partially supported by a grant from the University of Chile’s Faculty of Medicine’s Research and Innovation Department through the 2024 Indexed Publications Financing Support Competition.
Acknowledgments
We thank Ruth Charrondière for her helpful suggestions during the conceptualization of this study.
Conflict of interest
The authors declare that the research was conducted in the absence of any commercial or financial relationships that could be construed as a potential conflict of interest.
Publisher’s note
All claims expressed in this article are solely those of the authors and do not necessarily represent those of their affiliated organizations, or those of the publisher, the editors and the reviewers. Any product that may be evaluated in this article, or claim that may be made by its manufacturer, is not guaranteed or endorsed by the publisher.
Supplementary material
The Supplementary material for this article can be found online at: https://www.frontiersin.org/articles/10.3389/fsufs.2025.1496063/full#supplementary-material
References
Allen, T., Prosperi, P., Cogill, B., Padilla, M., and Peri, I. (2019). A Delphi approach to develop sustainable food system metrics. Soc. Indic. Res. 141, 1307–1339. doi: 10.1007/s11205-018-1865-8
Arrieta, E. M., and González, A. D. (2018). Impact of current, National Dietary Guidelines and alternative diets on greenhouse gas emissions in Argentina. Food Policy 79, 58–66. doi: 10.1016/j.foodpol.2018.05.003
Asaad, G., Sadegian, M., Lau, R., Xu, Y., Soria-Contreras, D. C., Bell, R. C., et al. (2015). The reliability and validity of the perceived dietary adherence questionnaire for people with type 2 diabetes. Nutrients 7, 5484–5496. doi: 10.3390/nu7075231
Azzini, E., Maiani, G., Turrini, A., Intorre, F., Feudo, G. L., Capone, R., et al. (2018). The health-nutrition dimension: a methodological approach to assess the nutritional sustainability of typical agro-food products and the Mediterranean diet. J. Sci. Food Agric. 98, 3684–3705. doi: 10.1002/jsfa.8877
Bai, Y., Alemu, R., Block, S. A., Headey, D., and Masters, W. A. (2021). Cost and affordability of nutritious diets at retail prices: evidence from 177 countries. Food Policy 99:101983. doi: 10.1016/j.foodpol.2020.101983
Barrientos-De la Rosa, C., Duran-Aguero, S., Mardones, M. J., Morejón, Y., García-Milla, P., Albornoz, P., et al. (2023). Comparison of consumption of pulses in two seasons of the year in Chile. Nutrients 15:2635. doi: 10.3390/nu15112635
BCFN (2016). Double pyramid 2016—a more sustainable future depends on us. Parma, Italy: The Barilla Center for Food and Nutrition (BCFN).
Berendsen, A. A. M., van Lieshout, L. E. L. M., van den Heuvel, E. G. H. M., Matthys, C., Péter, S., and de Groot, L. C. P. G. M. (2016). Conventional foods, followed by dietary supplements and fortified foods, are the key sources of vitamin D, vitamin B6, and selenium intake in Dutch participants of the NU-AGE study. Nutr. Res. 36, 1171–1181. doi: 10.1016/j.nutres.2016.05.007
Berry, E. M., Dernini, S., Burlingame, B., Meybeck, A., and Conforti, P. (2015). Food security and sustainability: can one exist without the other? Public Health Nutr. 18, 2293–2302. doi: 10.1017/S136898001500021X
Burlingame, B., and Dernini, S. (2012). Sustainable diets and biodiversity: Directions and solutions for policy, research and action: Proceedings of the international scientific symposium biodiversity and sustainable diets united against hunger, 3–5 November 2010, FAO headquarters, Rome, food and agriculture Organization of the United Nations and Bioversity. Rome: FAO.
Cáceres, P., Troncoso, C., Buhring, R., and Lataste, C. (2024). Sustainable food dishes: selection of indicators for their evaluation and communication in Chilean foodservices. Int. J. Gastron. Food Sci. 35:100873. doi: 10.1016/j.ijgfs.2024.100873
Carreño, P., and Silva, A. (2019). Fruit and vegetable expenditure disparities: evidence from Chile. Br. Food J. 121, 1203–1219. doi: 10.1108/BFJ-06-2018-0365
de Moraes Prata Gaspar, M. C., Garcia, A. M., and Larrea-Killinger, C. (2020). How would you define healthy food? Social representations of Brazilian, French and Spanish dietitians and young laywomen. Appetite 153:104728. doi: 10.1016/j.appet.2020.104728
Donini, L. M., Dernini, S., Lairon, D., Serra-Majem, L., Amiot, M.-J., del Balzo, V., et al. (2016). A consensus proposal for nutritional indicators to assess the sustainability of a healthy diet: the Mediterranean diet as a case study. Front. Nutr. 3:37. doi: 10.3389/fnut.2016.00037
Downs, S. M., Payne, A., and Staromiejska, W. (2023). “Sustainable diets: their definition, measurement and promotion” in Encyclopedia of human nutrition. ed. B. Caballero. Fourth ed (Oxford: Academic Press), 612–623.
Drewnowski, A. (2009). Defining nutrient density: development and validation of the nutrient rich foods index. J. Am. Coll. Nutr. 28, 421S–426S. doi: 10.1080/07315724.2009.10718106
Drewnowski, A., Gupta, S., and Darmon, N. (2020). An overlap between “Ultraprocessed” foods and the preexisting nutrient rich foods index? Nutr Today 55, 75–81. doi: 10.1097/nt.0000000000000400
Drewnowski, A., Henderson, S. A., Levine, A., and Hann, C. (1999). Taste and food preferences as predictors of dietary practices in young women. Public Health Nutr. 2, 513–519. doi: 10.1017/S1368980099000695
Edwards, P., and Roberts, I. (2009). Population adiposity and climate change. Int. J. Epidemiol. 38, 1137–1140. doi: 10.1093/ije/dyp172
Elmor, L., Ramos, G. A., Vieites, Y., Andretti, B., and Andrade, E. B. (2024). Environmental sustainability considerations (or lack thereof) in consumer decision making. Int. J. Res. Mark. doi: 10.1016/j.ijresmar.2024.08.003
FAO (2023a). A guidance note to enhance nutrition sensitivity in global environment facility (GEF) investments and programming. Rome: FAO.
FAO (2023b). FAOSTAT Statistical Database. Available at: https://www.fao.org/faostat/en/?&data.#data/SCL (accessed December 6, 2023).
FAO, IFAD, UNICEF, WFP, WHO (2023). The state of food security and nutrition in the world 2023: Urbanization, agrifood systems transformation and healthy diets across the rural–urban continuum, the state of food security and nutrition in the world (SOFI). Rome: FAO, IFAD, UNICEF, WFP, WHO.
FAO, IFAD, UNICEF, WFP, WHO (2024). The state of food security and nutrition in the world 2024. Rome: FAO, IFAD, UNICEF, WFP, WHO.
FAO, PAHO, WFP, UNICEF (2019). Regional overview of food security and nutrition in Latin America and the Caribbean 2019. Rome: FAO, IFAD, UNICEF, WFP, WHO.
Fulgoni, V. L., Keast, D. R., and Drewnowski, A. (2008). Development and validation of the nutrient-rich foods index: a tool to measure nutritional quality of foods. J. Nutr. 139, 1549–1554. doi: 10.3945/jn.108.101360
Garnett, T., Appleby, M. C., Balmford, A., Benton, T. G., Bloomer, P., Burlingame, B., et al. (2014). What is a sustainable healthy diet? A discussion paper. Oxford: Food Climate Research Network (FCRN).
Garnett, T., Mathewson, S., Angelides, P., and Borthwick, F. (2015). Policies and actions to shift eating patterns: What works? A review of the evidence of the effectiveness of interventions aimed at shifting diets in more sustainable and healthy directions. London: Chatham House.
Gattás Zaror, V. (2011). Guía de la composición nutricional de alimentos naturales, de la industria y preparaciones chilenas habituales. INTA, Santiago: Universidad de Chile.
Global Footprint Network (2022). Global footprint network. Advancing the science of sustainability. Available at: https://www.footprintnetwork.org/ (accessed June 9, 2021).
Goel, M., Nathavani, V., Dharaiya, S., Kothadia, V., Srivastava, S., and Bagler, G. (2023). Cultural context shapes the carbon footprints of recipes. Int. J. Gastr. Food Sci. 38:101017. doi: 10.48550/arXiv.2311.08416
Gormaz, T., Cortés, S., Tiboni-Oschilewski, O., and Weisstaub, G. (2022). The Chilean diet: is it sustainable? Nutrients 14:3103. doi: 10.3390/nu14153103
Gustafson, D. I., Decker, E. A., Drewnowski, A., Hamm, M. W., Hwang, J., and Merrigan, K. A. (2022). Making healthy, sustainable diets accessible and achievable: a new framework for assessing the nutrition, environmental, and equity impacts of packaged foods. Curr. Dev. Nutr. 6:nzac136. doi: 10.1093/cdn/nzac136
Gutiérrez, S., Cortés, S., Ruedlinger, J., Ojeda, M. J., and Fresán, U. (2023). Geographic variability in the Chilean dietary carbon footprint: major food contributors and associated factors. J. Clean. Prod. 427:139118. doi: 10.1016/j.jclepro.2023.139118
Hallström, E., Davis, J., Woodhouse, A., and Sonesson, U. (2018). Using dietary quality scores to assess sustainability of food products and human diets: a systematic review. Ecol. Indic. 93, 219–230. doi: 10.1016/j.ecolind.2018.04.071
Harris, P. A., Taylor, R., Minor, B. L., Elliott, V., Fernandez, M., O’Neal, L., et al. (2019). The REDCap consortium: building an international community of software platform partners. J. Biomed. Inform. 95:103208. doi: 10.1016/j.jbi.2019.103208
Harris, P. A., Taylor, R., Thielke, R., Payne, J., Gonzalez, N., and Conde, J. G. (2009). Research electronic data capture (REDCap)--a metadata-driven methodology and workflow process for providing translational research informatics support. J. Biomed. Inform. 42, 377–381. doi: 10.1016/j.jbi.2008.08.010
Heo, S., Moser, D. K., Lennie, T. A., Payne-Emerson, H., Welch, J. L., and Weaver, M. (2015). Development and testing of the feasibility and acceptability of a tailored dietary intervention in patients with heart failure. J. Cardiovasc. Nurs. 30, 213–221. doi: 10.1097/JCN.0000000000000148
Herforth, A., Arimond, M., Álvarez-Sánchez, C., Coates, J., Christianson, K., and Muehlhoff, E. (2019). A global review of food-based dietary guidelines. Adv. Nutr. 10, 590–605. doi: 10.1093/advances/nmy130
Herforth, A., Bai, Y., Venkat, A., Mahrt, K., Ebel, A., and Masters, W. A. (2020). Cost and affordability of healthy diets across and within countries: background paper for the state of food security and nutrition in the world 2020. FAO agricultural development economics technical study no. 9, FAO agricultural development economics technical studies. Rome: FAO.
James-Martin, G., Baird, D. L., Hendrie, G. A., Bogard, J., Anastasiou, K., Brooker, P. G., et al. (2022). Environmental sustainability in national food-based dietary guidelines: a global review. Lancet Planet. Health 6, e977–e986. doi: 10.1016/S2542-5196(22)00246-7
Jones, A. D., Hoey, L., Blesh, J., Miller, L., Green, A., and Shapiro, L. F. (2016). A systematic review of the measurement of sustainable diets. Adv. Nutr. Bethesda Md 7, 641–664. doi: 10.3945/an.115.011015
Jury, G., Urteaga, C., and Taiba, M. (1995). Porciones de intercambio y composición química de los alimentos de la piramide alimentaria chilena - Universidad Autónoma de Chile. Santiago: Universidad de Chile, INTA.
Kanter, R., and Gittelsohn, J. (2020). Measuring food culture: a tool for public health practice. Curr. Obes. Rep. 9, 480–492. doi: 10.1007/s13679-020-00414-w
Kanter, R., and León Villagra, M. (2020). Participatory methods to identify perceived healthy and sustainable traditional culinary preparations across three generations of adults: results from Chile’s metropolitan region and region of La Araucanía. Nutrients 12:489. doi: 10.3390/nu12020489
Kinnunen, P., Guillaume, J. H. A., Taka, M., D’Odorico, P., Siebert, S., Puma, M. J., et al. (2020). Local food crop production can fulfil demand for less than one-third of the population. Nat. Food 1, 229–237. doi: 10.1038/s43016-020-0060-7
Krebs-Smith, S. M., Pannucci, T. E., Subar, A. F., Kirkpatrick, S. I., Lerman, J. L., Tooze, J. A., et al. (2018). Update of the healthy eating index: HEI-2015. J. Acad. Nutr. Diet. 118, 1591–1602. doi: 10.1016/j.jand.2018.05.021
Lisa Clodoveo, M., Tarsitano, E., Crupi, P., Pasculli, L., Piscitelli, P., Miani, A., et al. (2022). Towards a new food labelling system for sustainable food production and healthy responsible consumption: the med index checklist. J. Funct. Foods 98:105277. doi: 10.1016/j.jff.2022.105277
Liu, A., Hou, A., and Chai, L. (2024). Assessing human and environmental health in global diets from a perspective of economic growth. Sustain. Prod. Consum. 45, 306–315. doi: 10.1016/j.spc.2024.01.011
Llorca-Jaña, M., Nazer, R., and Morales-Campos, D. (2022). La temporalidad y naturaleza de la transición nutricional en Chile, 1930-2019. RIVAR 9:5534. doi: 10.35588/rivar.v9i26.5534
Mannheim, V., and Avató, J. L. (2023). Life-cycle assessments of meat-free and meat-containing diets by integrating sustainability and lean: meat-free dishes are sustainable. Sustain. For. 15:12014. doi: 10.3390/su151512014
Marrero, A., Anderson, E., de la Vega, C., Beltran, V., Haneuse, S., Golden, C., et al. (2022). An integrated assessment of environmental sustainability and nutrient availability of food consumption patterns in Latin America and the Caribbean. Am. J. Clin. Nutr. 116, 1265–1277. doi: 10.1093/ajcn/nqac220
Masson-Delmotte, V., Zhai, P., Pirani, A., Connors, S. L., Péan, C., Berger, S., et al. (2021). Climate change 2021: the physical science basis. Contribution of working group I to the sixth assessment report of the intergovernmental panel on climate change. United Kingdom, USA, Australia, India, Singapore: IPCC.
Ministerio de Medio Ambiente, Chile, Programa de las Naciones Unidas para el Desarrollo, GEF (2017). Estrategia Nacional de Biodiversidad 2017–2030. Chile: Ministerio del Medio Ambiente, Chile.
Ministerio de Salud Chile (2017a). Encuesta Nacional de Salud 2016-2017. Ministerio de Salud. Subsecretaría de Salud Pública División de Planificación Sanitaria Departamento de Epidemiología. Santiago, Chile: Ministerio de Salud Chile.
Ministerio de Salud Chile (2017b). Política Nacional de Alimentación y Nutrición. Chile. Ministerio de Salud. Subsecretaría de Salud Pública. División de Políticas Públicas Saludables y Promoción. Departamento de Nutrición y Alimentos. Santiago, Chile: Ministerio de Salud Chile.
Ministerio de Salud Chile (2018). Informe encuesta nacional de salud 2016-2017: Estado Nutricional. Ministerio de Salud. Subsecretaría de Salud Pública División de Planificación Sanitaria Departamento de Epidemiología. Santiago: Ministerio de Salud Chile.
Ministerio de Salud Chile (2022). Guías Alimentarias para Chile. Ministerio de Salud Subsecretaría de Salud Pública División de Políticas Públicas Saludables y Promoción. Santiago: Ministerio de Salud Chile.
Moreno-Miranda, C., and Dries, L. (2022). Integrating coordination mechanisms in the sustainability assessment of Agri-food chains: from a structured literature review to a comprehensive framework. Ecol. Econ. 192:107265. doi: 10.1016/j.ecolecon.2021.107265
Mozaffarian, D., Rosenberg, I., and Uauy, R. (2018). History of modern nutrition science-implications for current research, dietary guidelines, and food policy. BMJ 361:k2392. doi: 10.1136/bmj.k2392
Muñoz-Martínez, J., Cussó-Parcerisas, I., and Carrillo-Álvarez, E. (2024). Exploring the barriers and facilitators for following a sustainable diet: a holistic and contextual scoping review. Sustain. Prod. Consum. 46, 476–490. doi: 10.1016/j.spc.2024.03.002
Nicklas, T. A., Jahns, L., Bogle, M. L., Chester, D. N., Giovanni, M., Klurfeld, D. M., et al. (2013). Barriers and facilitators for consumer adherence to the dietary guidelines for Americans: the health study. J. Acad. Nutr. Diet. 113, 1317–1331. doi: 10.1016/j.jand.2013.05.004
Observatorio Social, Ministerio de Desarrollo Social y Familia, Gobierno de Chile (2023). Valor de la canasta básica de alimentos y líneas de pobreza. Available at: https://observatorio.ministeriodesarrollosocial.gob.cl/storage/docs/cba/nueva_serie/2023/Valor_CBA_y_LPs_23.09.pdf (Accessed November 12, 2023).
Pinheiro, A., Ivanovic, C., Rodríguez, L., Pinheiro, A., Ivanovic, C., and Rodríguez, L. (2018). Consumo de legumbres en Chile. Perspectivas y desafíos. Rev. Chil. Nutr. 45, 14–20. doi: 10.4067/S0717-75182018000200014
Ponzo, V., Rosato, R., Tarsia, E., Goitre, I., De Michieli, F., Fadda, M., et al. (2017). Self-reported adherence to diet and preferences towards type of meal plan in patient with type 2 diabetes mellitus. A cross-sectional study. NMCD 27, 642–650. doi: 10.1016/j.numecd.2017.05.007
Poore, J., and Nemecek, T. (2018). Reducing food’s environmental impacts through producers and consumers. Science 360, 987–992. doi: 10.1126/science.aaq0216
Ran, Y., Cederberg, C., Jonell, M., Bergman, K., Boer, I. J. M. D., Einarsson, R., et al. (2024). Environmental assessment of diets: overview and guidance on indicator choice. Lancet Planet. Health 8, e172–e187. doi: 10.1016/S2542-5196(24)00006-8
Reger, C., Leitzmann, M. F., Rohrmann, S., Kühn, T., Sedlmeier, A. M., and Jochem, C. (2024). Sustainable diets and risk of overweight and obesity: a systematic review and meta-analysis. Obes. Rev. 25:e13707. doi: 10.1111/obr.13707
Rei, M., Costa, A., Sosa, S., da Costa, S., Torres, D., Sage, C., et al. (2024). Multicriteria measures to assess the sustainability of diets: a systematic review. Nutr. Rev. 28:nuae081. doi: 10.1093/nutrit/nuae081
Richardson, K., Steffen, W., Lucht, W., Bendtsen, J., Cornell, S. E., Donges, J., et al. (2023). Earth beyond six of nine planetary boundaries | science advances. Sci. Adv. 9:adh2458. doi: 10.1126/sciadv.adh2458
Ridoutt, B. G., Baird, D., and Hendrie, G. A. (2021). Diets within planetary boundaries: what is the potential of dietary change alone? Sustain. Prod. Consum. 28, 802–810. doi: 10.1016/j.spc.2021.07.009
Saez, L., Torres, V., and Cáceres, L. (2010). Caracterización de las ferias libres como canal de comercialización en la Región Metropolitana de Chile. Econ. Agrar. 14, 1–7. doi: 10.22004/ag.econ.104271
Sala, S., Crenna, E., Secchi, M., and Sanyé-Mengual, E. (2020). Environmental sustainability of European production and consumption assessed against planetary boundaries. J. Environ. Manag. 269:110686. doi: 10.1016/j.jenvman.2020.110686
Springmann, M., Clark, M., Mason-D’Croz, D., Wiebe, K., Bodirsky, B. L., Lassaletta, L., et al. (2018). Options for keeping the food system within environmental limits. Nature 562, 519–525. doi: 10.1038/s41586-018-0594-0
Streppel, M. T., Sluik, D., van Yperen, J. F., Geelen, A., Hofman, A., Franco, O. H., et al. (2014). Nutrient-rich foods, cardiovascular diseases and all-cause mortality: the Rotterdam study. Eur. J. Clin. Nutr. 68, 741–747. doi: 10.1038/ejcn.2014.35
Sugimoto, M., Temme, E. H. M., Biesbroek, S., Kanellopoulos, A., Okubo, H., Fujiwara, A., et al. (2022). Exploring culturally acceptable, nutritious, affordable and low climatic impact diet for Japanese diets: proof of concept of applying a new modelling approach using data envelopment analysis. Br. J. Nutr. 128, 2438–2452. doi: 10.1017/S0007114522000095
Torstensson, L., Johansson, R., and Mark-Herbert, C. (2021). Food dishes for sustainable development: a Swedish food retail perspective. Food Secur. 10:932. doi: 10.3390/foods10050932
Toti, E., Di Mattia, C., and Serafini, M. (2019). Metabolic food waste and ecological impact of obesity in FAO World’s region. Front. Nutr. 6:126. doi: 10.3389/fnut.2019.00126
Verdugo, G., Arias, V., and Perez-Leighton, C. (2016). Comparison of price between a healthy and unhealthy diet in the metropolitan region. Chile. Arch. Latinoam. Nutr. 66, 272–278.
WHO and FAO (2024). What are healthy diets? Joint statement by the food and agriculture Organization of the United Nations and the World Health Organization. Geneva: World Health Organization and Food and Agriculture Organization of the United Nations.
Willett, W., Rockström, J., Loken, B., Springmann, M., Lang, T., Vermeulen, S., et al. (2019). Food in the Anthropocene: the EAT–lancet commission on healthy diets from sustainable food systems. Lancet 393, 447–492. doi: 10.1016/S0140-6736(18)31788-4
Wong, L. P. (2008). Focus group discussion: a tool for health and medical research. Singapore Med. J. 49, 256–260.
Keywords: sustainable diets, traditional preparations, estimation method, sociocultural, food based dietary guidelines
Citation: Tiboni-Oschilewski O, Corvalán C and Kanter R (2025) A sustainability comparison of different traditional Chilean culinary preparations through an innovative method. Front. Sustain. Food Syst. 9:1496063. doi: 10.3389/fsufs.2025.1496063
Edited by:
Anand Mohan, University of Georgia, United StatesReviewed by:
Lucia Briamonte, Council for Agricultural Research and Agricultural Economy Analysis (CREA), ItalyAurup Ratan Dhar, University of Minnesota, United States
Copyright © 2025 Tiboni-Oschilewski, Corvalán and Kanter. This is an open-access article distributed under the terms of the Creative Commons Attribution License (CC BY). The use, distribution or reproduction in other forums is permitted, provided the original author(s) and the copyright owner(s) are credited and that the original publication in this journal is cited, in accordance with accepted academic practice. No use, distribution or reproduction is permitted which does not comply with these terms.
*Correspondence: Rebecca Kanter, UmViZWNjYS5LYW50ZXJAdWNoaWxlLmNs