
94% of researchers rate our articles as excellent or good
Learn more about the work of our research integrity team to safeguard the quality of each article we publish.
Find out more
ORIGINAL RESEARCH article
Front. Sustain. Food Syst., 20 March 2025
Sec. Agroecology and Ecosystem Services
Volume 9 - 2025 | https://doi.org/10.3389/fsufs.2025.1443215
This article is part of the Research TopicOptimizing Natural Features and BMPs in Agroecosystems Through a One-Health ApproachView all 5 articles
 Angeli Sahdra1,2*†
 Monica R. Young2
 Lori A. Phillips3Niloofar Alavi4David R. Lapen2
 Jeremy T. Kerr1
 Marla D. Schwarzfeld2
Soil mesofauna critically support organic matter decomposition and nutrient cycling, as well as regulating pests and diseases. Agricultural activities can physically and chemically influence soil mesofauna communities, thereby impacting the ecosystem services they provide. Conserving natural features in agricultural environments is well known to support biodiversity and associated ecosystem services, yet soil mesofauna communities and their functions in such features require further study. We sampled the soil mesofaunal communities (focusing on Acari [mites] and Collembola [springtails]) in agriculturally-dominated landscapes in southeastern Ontario, Canada. Semi-natural features were represented by drainage ditch banks with varying amounts of woody vegetation to different kinds of forested blocks. Specimens were extracted using Berlese funnels, and COI metabarcoding was conducted on the bulk specimen samples. A total of 585 operational taxonomic units (OTUs; a proxy for species) were identifiable based on DNA sequences, 390 of which belonged to either Acari (273) or Collembola (117); however, it was rarely possible to identify specimens to species-level. Mesofaunal richness did not differ among habitat types but community composition varied between low woody-vegetation drainage bank sites and forested blocks. Maintaining heterogeneous natural and semi-natural features appears to increase the overall diversity of mesofauna on the landscape, and even small forest patches support forest-associated soil biodiversity in this agricultural region.
Soil is home to a vast number of species, including microorganisms (e.g., bacteria, fungi, protists); microfauna (<200 μm in size, e.g., nematodes, rotifers); mesofauna (~0.2–2 mm, e.g., mites, springtails, enchytraeids); and macrofauna (>2 mm, e.g., earthworms, snails, many insects) (Lavelle et al., 2006; FAO et al., 2020). This fauna is critically important for maintaining essential ecosystem functions, such as soil formation, nutrient and carbon cycling, and pest and disease control in both natural and human-dominated landscapes (Lavelle et al., 2006; Barrios, 2007; Mishra and Singh, 2020; Guerra et al., 2021). Threats to soil biodiversity such as habitat loss and fragmentation, agricultural intensification/extensification, and soil erosion may consequently degrade the important functions that these communities provide (Gardi et al., 2013; Geisen et al., 2019; Tibbett et al., 2020; Prăvălie et al., 2021). However, the extreme complexity and sheer diversity of these communities make it especially challenging to monitor their taxa (Thakur et al., 2020; Gongalsky, 2021; FAO, 2022), which is a key step in identifying how their diversity (and its loss) will impact ecosystem services across the globe (Remelli et al., 2024).
Agricultural activities can cause large reductions in the abundance and richness of soil fauna by physically disrupting the soil habitats via tillage and field traffic (Ouellet et al., 2008; Müller et al., 2022), and through chemical influences like fertilizer and pesticide use (de Graaff et al., 2019). Recent efforts to conserve soil biodiversity and soil health have focused on within-field methods to conserve soil biodiversity, such as conservation tillage or cover cropping (van Capelle et al., 2012; Carmona et al., 2021). However, landscape-based approaches have the potential to benefit both agricultural productivity and local biodiversity (Haan et al., 2021). In particular, a mosaicked landscape that retains forest patches and linear features, such as hedgerows, fence lines, and watercourse margins, among agricultural plots can provide crucial habitat and refugia for soil biodiversity in otherwise depauperate zones (Rusch et al., 2010; Schirmel et al., 2016; Udawatta et al., 2019; Bennewicz and Barczak, 2020; Montgomery et al., 2020). While these features may reduce the amount of arable land, introduce shading influences on crops, and provide refugia for pests, such cases are context dependant (Mesman, 2016; Rempel et al., 2017; Marais et al., 2022). Increasingly, natural features are being lost at the expense of agricultural and urban development, as documented in the focal region of this study—eastern Ontario, Canada (Noteboom et al., 2021), and many other regions in the world (Hu et al., 2021; Pendrill et al., 2022). An additional yet often overlooked semi-natural feature that may act as effective refugia for soil biodiversity in agro-ecosystems includes uncultivated and semi-cultivated field margins (Clark et al., 2006; de Zwaan et al., 2024; Guo et al., 2024), but these features remain poorly documented in the context of soil mesofaunal communities.
Understanding how agricultural extensification or conversely, mosaicked landscapes affect soil mesofaunal diversity is a missing component in soil health surveys. A number of relevant soil health indices and models have been developed for soil physicochemical properties (Vereecken et al., 2016; Vogel et al., 2019; Maurya et al., 2020). Despite the increasing interest in developing similar indices and models for soil fauna (Parisi et al., 2005; Caoduro et al., 2014; Menta et al., 2018; Buchkowski and Lindo, 2020), there remain large gaps in our knowledge of how mesofauna interact with their physical and chemical environment (Deckmyn et al., 2020; Potapov et al., 2022). Collecting baseline data on soil faunal communities and the physical and chemical matrix in which they reside is an essential step in developing testable hypotheses about soil ecological processes, and ultimately, the development of more robust soil health models and indices.
The soil mesofauna is dominated by microarthropods, of which the most diverse and abundant taxa are mites (Acari) and springtails (Collembola) (Behan-Pelletier, 2003). Acari, in particular, are one of the most diverse and abundant arthropod taxa within soil communities and fill a wide range of ecological roles (Beaulieu et al., 2019). For example, predatory mites, such as Mesostigmata (Parasitiformes) and some Prostigmata (Trombidiformes), can influence prey populations by exerting top-down effects on the abundance of prey taxa (e.g., nematodes, Collembola) (Koehler, 1999; Schneider and Maraun, 2009), and have even been used as biological control for arthropod pests, such as thrips and phytophagous mites (McMurtry et al., 2015; Knapp et al., 2018). Conversely, oribatid (Sarcoptiformes) mites are responsible for nutrient cycling within the soil by feeding on dead organic matter and microbial residues and contribute strongly to soil structural development by producing nutrient rich faecal pellets that act as a natural fertilizer (FAO et al., 2020; Potapov et al., 2022). While Collembola are often less diverse than Acari, they are frequently as abundant in soil systems and serve as an important prey source for other small arthropods, such as beetles, mites, and spiders (Bilde et al., 2000). They also contribute to nutrient-cycling by breaking down organic matter and impact soil food-webs by feeding on microorganisms (Coulibaly et al., 2019).
Due to the vast abundance and diversity of soil mesofauna, assessing species richness and composition of the entire community is rarely feasible using pure morphological methods; for this reason, most studies focus on selected taxa (Postma-Blaauw et al., 2012; Baumann, 2021), or else only identify organisms to high taxonomic levels (Ruf and Beck, 2005; Meehan et al., 2019). In contrast, DNA metabarcoding couples DNA taxonomy with high-throughput sequencing to identify multiple species within a given sample (Coissac et al., 2012). This method shows great promise for efficiently and accurately assessing soil communities (Yang et al., 2014), including for Acari (Arribas et al., 2016; Hoage, 2018; Young and Hebert, 2022) and Collembola (Saitoh et al., 2016). While metabarcoding has been used to assess soil arthropod communities within a variety of different ecosystems: i.e., Arctic, temperate, tropical, freshwater, and grassland habitats (Arribas et al., 2016; Oliverio et al., 2018; Schenk et al., 2020; Basset et al., 2022; Young and Hebert, 2022), its application in agricultural settings is very limited (Kestel et al., 2022).
The objectives of this study were: (a) to conduct a baseline survey of soil mesofauna (Acari and Collembola) in natural and semi-natural features in an agricultural landscape in eastern Ontario, Canada; (b) to analyze soil mesofaunal diversity and community composition in a variety of semi-natural habitats (ranging from grassy un-treed field margins to larger forested blocks), using specimen-based metabarcoding; and (c) to explore relationships between soil physicochemical parameters and the mesofaunal community at each site.
This study was conducted east of Ottawa, ON, Canada in the South Nation river watershed (Figure 1). This region has a temperate climate, categorized as Dfb (cold winter, no dry season, warm summer) in the Köppen-Geiger climate classification system (Beck et al., 2018). The area is primarily agricultural and has experienced a notable loss of natural features, as 4.1% of its forest was lost in just 6 years (Mesman, 2016). The region’s main agricultural land uses are livestock/cash corn, soybean, and forage (i.e., hay and alfalfa for livestock feed) (Ontario Data Catalogue, 2024). The average field size in the study area is approximately 8.3 ha, based on calculations in ArcGIS, and fields are typically bordered by linear features, such as hedgerows, vegetated fencelines, and agricultural drainage ditches (de Zwaan et al., 2024; Guo et al., 2024). The banks of these drainage ditches are generally semi-natural, uncultivated habitats, ranging from narrow strips of herbaceous vegetation, which may or may not include scattered trees and shrubs, to (less commonly) wider, forested areas. The study region is dominated by soils classified as Orthic Humic Gleysols and Gleyed Melanic Brunisols (Canadian System of Soil Classification).
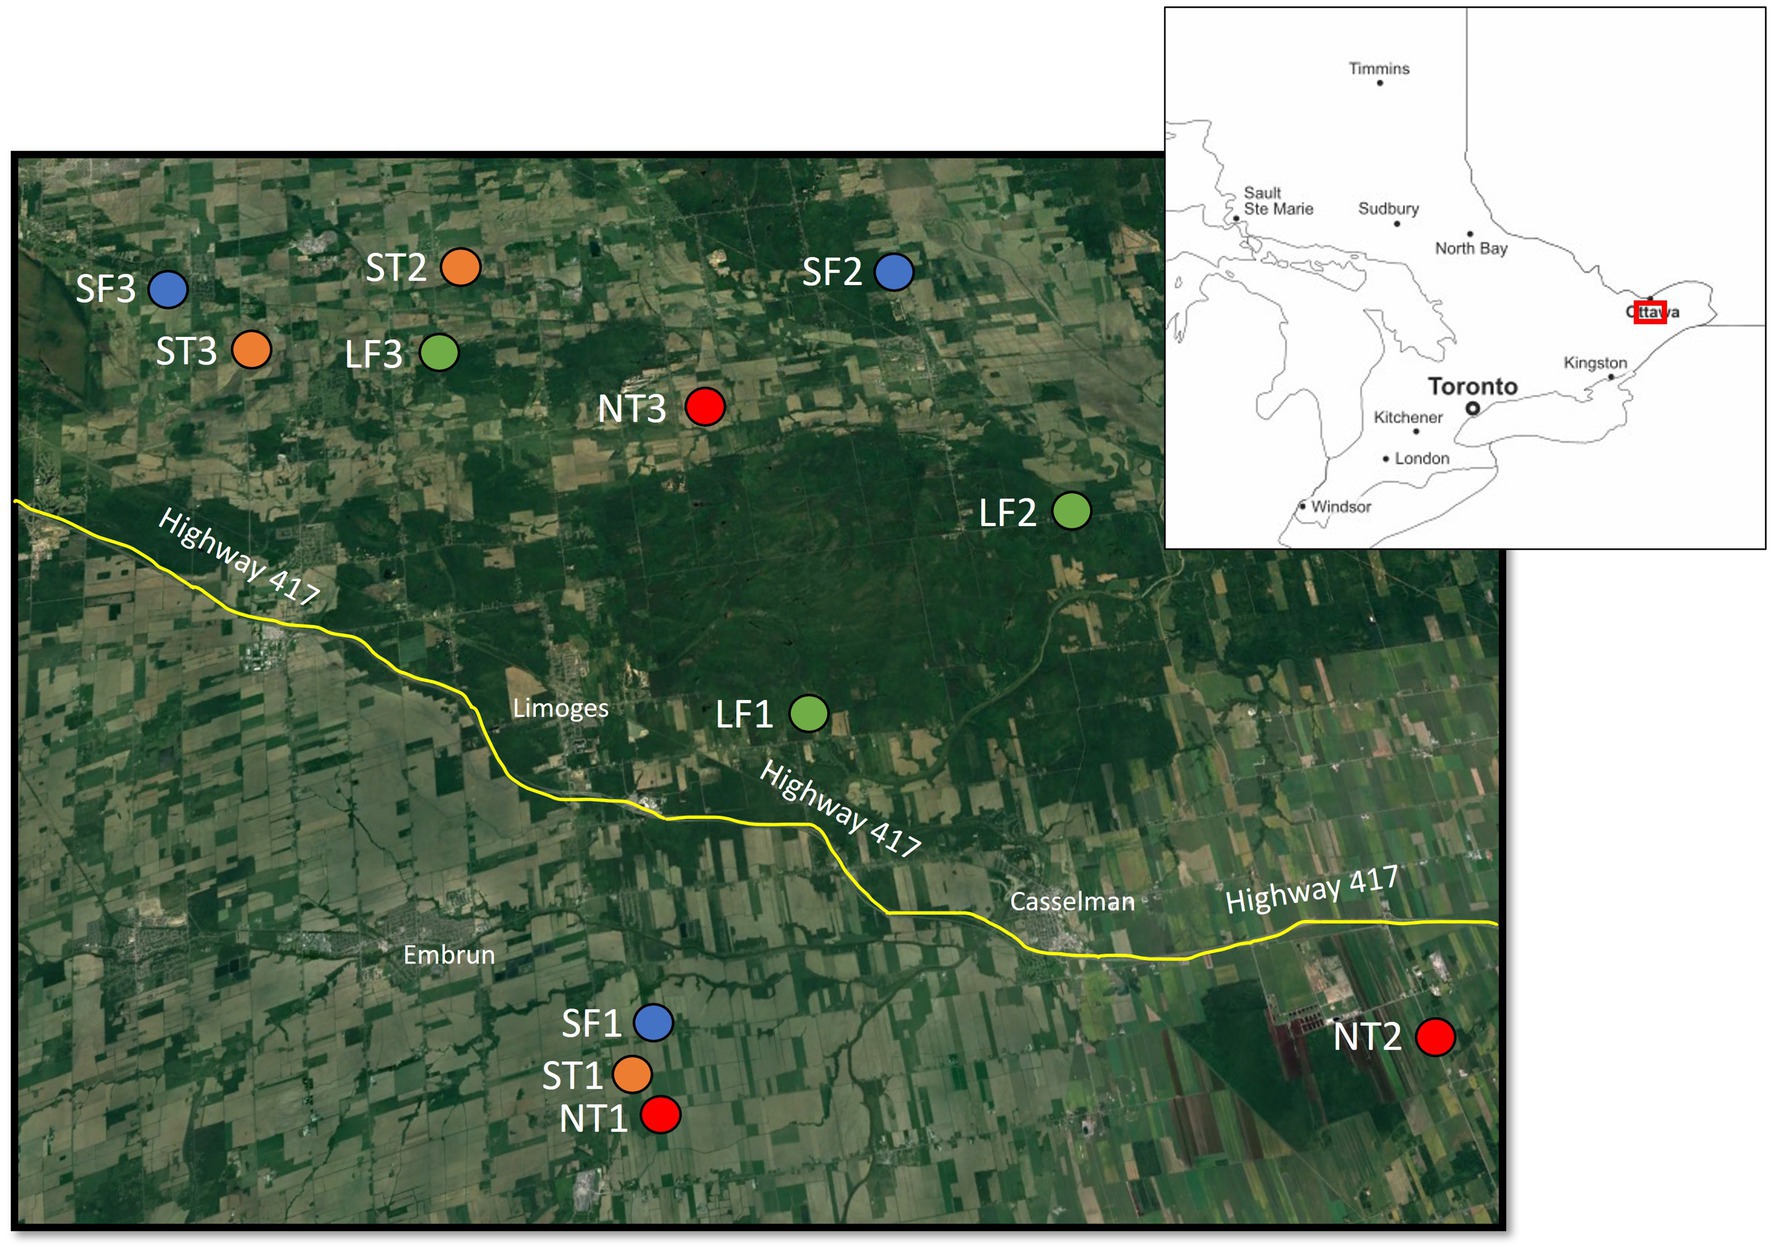
Figure 1. Map showing the location of the 12 sites that were sampled in this study. Source: Main map modified from https://www.google.com/earth (accessed August 20, 2023), inset map modified from https://d-maps.com/ (accessed February 18, 2025).
We collected soil samples along agricultural drainage ditch margins and forested areas along waterways in this agricultural matrix in June 2022 (Figure 1). Twelve sites were selected and were categorized as one of four habitat types, with three replicates of each type. Two site categories were classified as “unforested,” including “No trees” = agricultural ditches brushed of woody vegetation (as per Guo et al., 2024) and “Scattered trees” = agricultural ditches with a few scattered shrubs and trees (less than 20% tree canopy cover). These uncultivated strips, including the ditch proper, were less than 10 m in width and were dominated by grasses, particularly smooth brome grass (Bromus inermis), and included both native herbaceous plants (e.g., Solidago canadensis [Canada goldenrod]) and invasive alien species (primarily Pastinaca sativa [wild parsnip]) (Supplementary Table S1). At most ditch sites, the litter layer was predominantly a dense cover of dead brome grass that protected the soil surface from excessive soil desiccation during drier periods. The other two categories were classified as “forested” and included “Small forest” = small patches of forest ranging from 30 to 300 m in width and either isolated, or narrowly connected to larger forested areas, and “Large forest” = large patches of forest ranging from 400 to 2,000 m in width, and connected to more extensive forested areas (Figure 2). Due to the availability of suitable sites, there was limited ability to standardize the vegetation composition of these forested stands. However, they were mostly deciduous-dominated (one site was mixed-wood), with the most common native trees being Fraxinus americana (white ash), Acer saccharum (sugar maple), Fagus grandifolia (American beech) and Tsuga canadensis (Eastern hemlock); the most common non-native tree was Rhamnus cathartica (European buckthorn), which was particularly abundant in the small forest sites (Supplementary Table S1). The forests had distinct canopy, shrub, and herb layers; at many sites, the herb layer (most commonly fern-dominated) was sparse, with the moist forest floor primarily covered in deciduous leaf litter. Soil texture across all sites was highly variable, though clay soils were more common in the ditch sites compared to the forested sites (Supplementary Table S1).
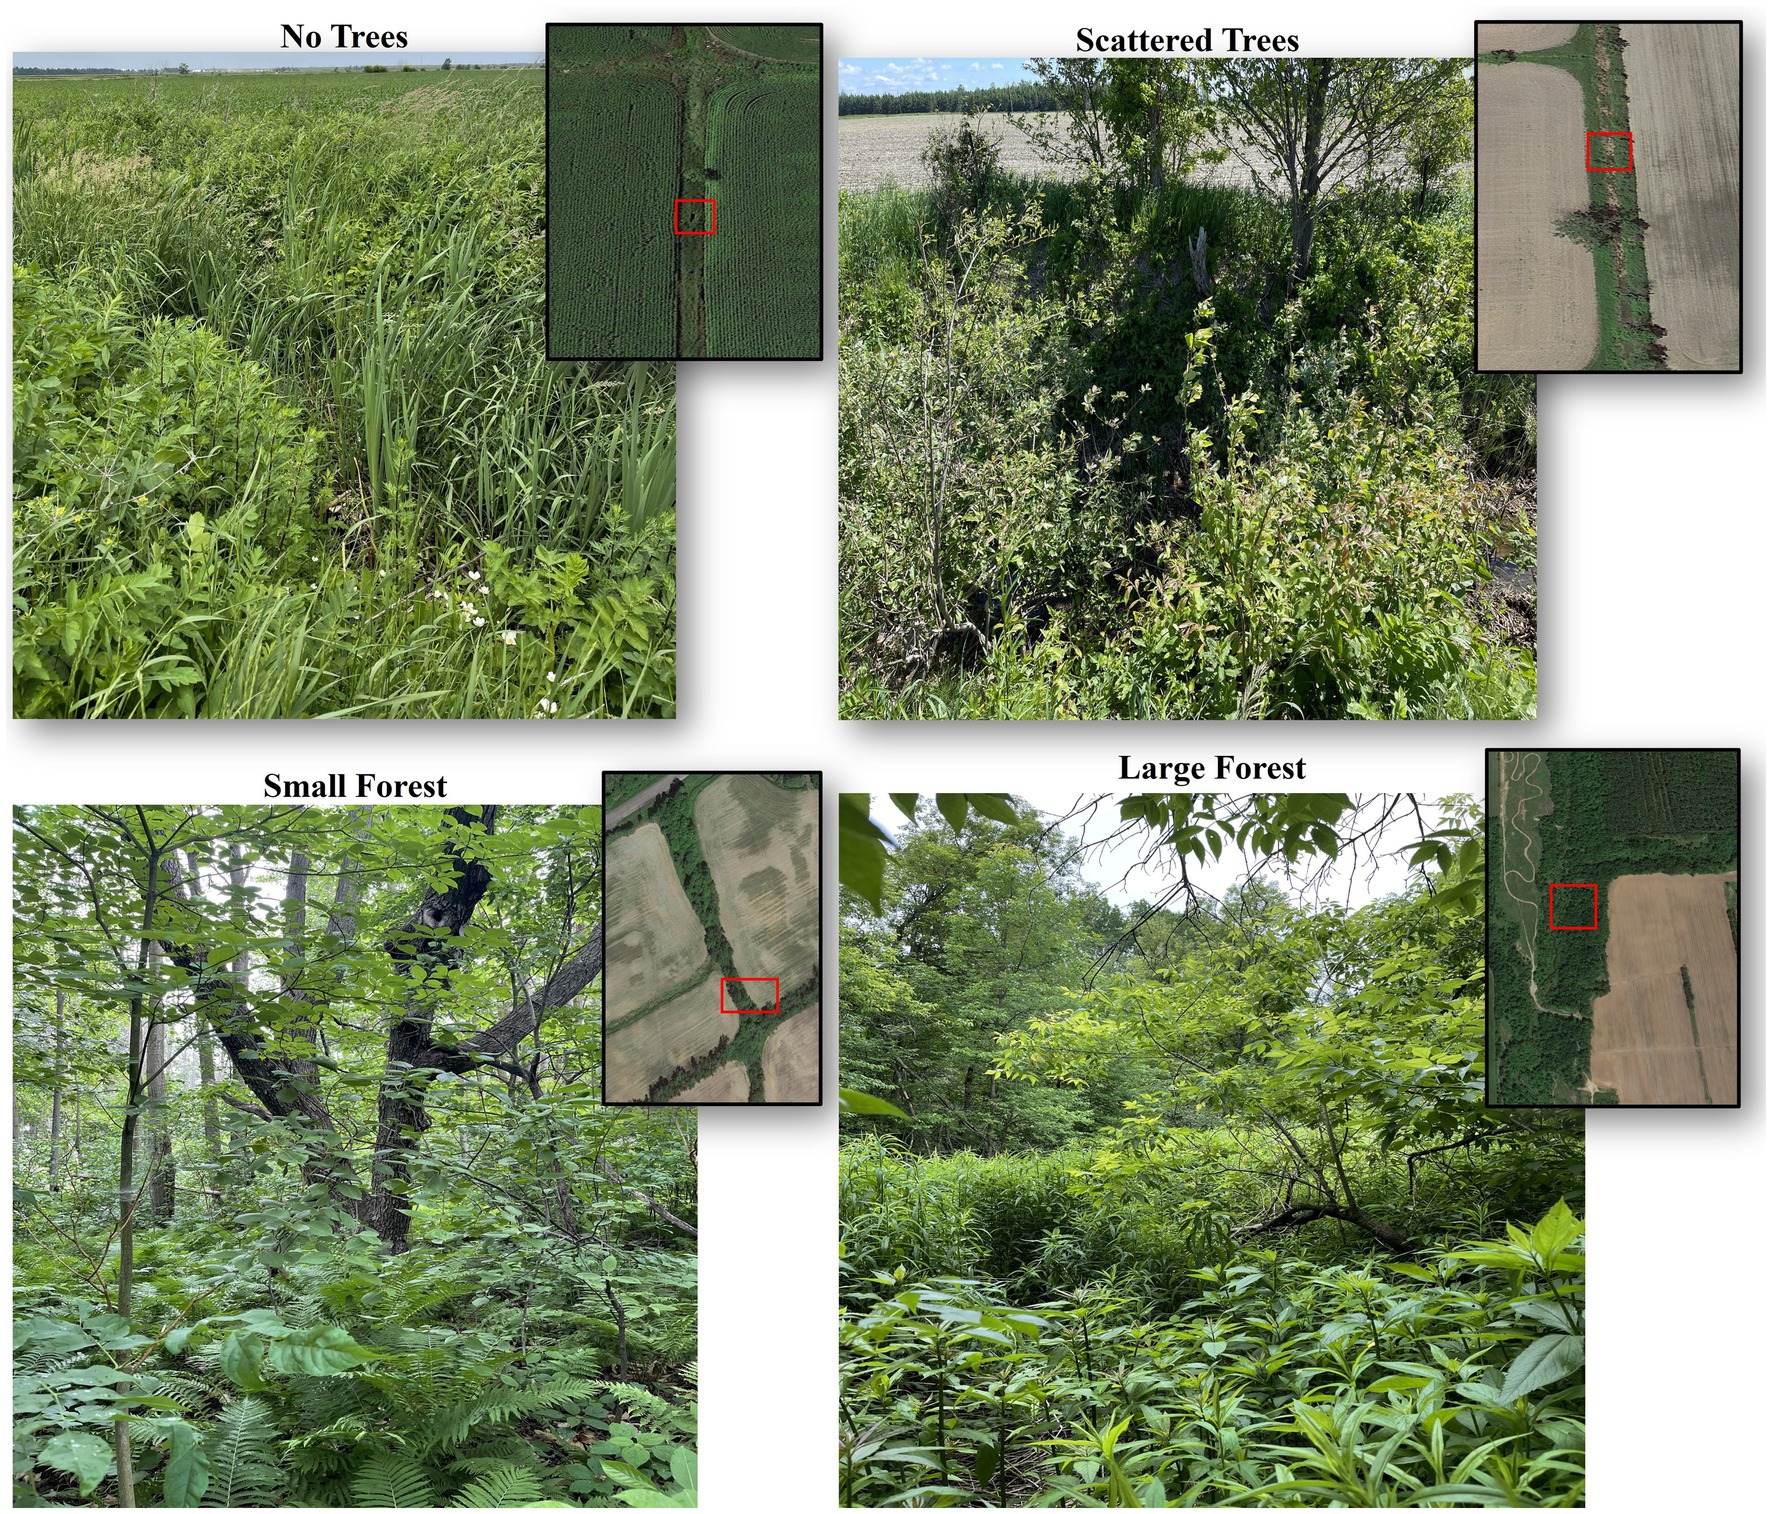
Figure 2. Representative satellite images and photographs of each of the four habitat types.
Six sampling points were randomly selected at each of the 12 sites by first overlaying each site with a 10 m × 10 m grid in Google Earth. A random number generator was then used to select six cells of the grid to be sampled, and a GPS point was arbitrarily selected in the approximate centre of each cell. Sampling points were evenly divided across the ditch/waterway (three per side) and were at least 20 m apart. The ditch samples were collected at the mid-slope of the bank. Paired samples (immediately adjacent to each other) were collected at each sampling point; one for mesofaunal metabarcoding, and the other for soil physicochemical analysis. Each of these two samples was collected by using a tulip bulb planter to extract two soil cores/sample (each approximately 6 cm in diameter and 11 cm deep) that were combined in a Ziploc bag, totaling approximately 2.5 L of soil per sample. Tree canopy cover was also measured at each sampling point using a convex spherical crown densiometer; four measurements were taken, one at each cardinal direction, and the mean of these measurements was then calculated.
The mesofaunal samples were kept in the fridge overnight, and then specimens were extracted on Berlese funnels lined with cheesecloth for 4 days using heat from a 60 W bulb, with specimens collected into 95% ethanol. Specimens were then filtered through a 45-μm sieve into 2 mL tubes filled with 95% ethanol and stored at −20°C until DNA extraction. Specimens were not cleaned prior to DNA extraction, resulting in some sediment being included in the extraction.
The soil samples collected for physicochemical analysis were stored at −20°C prior to processing. The samples were thawed at 20°C for 1 h, sieved through a 2 mm mesh, and then subsampled for downstream analyses. Gravimetric moisture was measured by drying a 20 g field moist subsample at 105°C for 48 h. A separate 100 g subsample was then air dried at 20°C for 1 week. These air-dried subsamples were sent to A&L Canada Laboratories Inc., London, ON, for physicochemical analysis, which included measurements of organic matter (loss on ignition), phosphorus (Bray-P1), total and percent base saturation of potassium, magnesium, and calcium (ammonium acetate extraction), and cation exchange capacity (CEC).
DNA was extracted non-destructively from the mesofaunal specimens with a Qiagen DNeasy Blood and Tissue kit (Qiagen), modified to allow for the recovery of voucher specimens. Specifically, the ethanol was first evaporated from the tubes containing specimens using a vacuum centrifuge (Vacufuge, V-AL, ambient temperature, 10 min). 270 μL of buffer ATL and 30 μL of proteinase K were then added to the tubes without grinding the specimens, and tubes were incubated overnight at 56°C. Following incubation, 200 μL of solution was withdrawn from the top and placed into a 1.5 mL tube, being careful not to disturb or pipette up any specimens. The tubes containing the voucher specimens were then refilled with 95% ethanol for storage. The remainder of the DNA extraction steps followed the standard kit protocol, with the final elution step repeated once to maximize DNA yield, for a total elution volume of 200 μL. Following the extraction, the spin column filters were rinsed with 95% ethanol and inspected under a microscope to check for any specimens that were drawn up with the extraction buffer; any specimens found during this step were added to the voucher specimen tube. Initial PCR tests had high failure rates, possibly due to PCR inhibitors from soil residue that was extracted with the specimens. Diluting the DNA improved PCR results, and it was determined that a 20% dilution was most successful across samples; consequently, all DNA extracts were diluted with water to 20% prior to sequencing.
Based on the recommendation of Krehenwinkel et al. (2016), we sequenced a 313 bp region of COI, using the mICOIintF (Brandon-Mong et al., 2015) and FoldR (Arribas et al., 2016) primer pair, with modified adapters that had 0–6 “N” bases between the amplicon-specific primer and the adapter sequence to increase base diversity. PCR was replicated 3 times for each DNA extract; therefore, a total of 216 samples were sequenced (12 sites × 6 sampling points × 3 PCR replicates). Two extraction negatives × 3 PCR replicates and 10 PCR negatives were also sequenced. Each PCR reaction consisted of 16.75 μL nuclease-free water, 2.3 μL 10× Titanium buffer, 2.3 μL of 2 mM dNTPs, 0.575 μL each of the forward and reverse primers, 0.5 μL Titanium Taq, and 2 μL of DNA. Cycling was conducted in an Eppendorf thermocycler, with the following program: 95°C for 3 min, 40 cycles of 94°C for 30 s, 45°C for 90 s, 72°C for 90 s, and a final extension of 72°C for 3 min, before being held at 4°C. The remaining steps in the protocol were conducted at the Molecular Technologies Laboratory of the Ottawa Research and Development Centre. In brief, samples were purified and normalized using an NGS Normalization 96-Well Kit (Norgen Biotek Corporation, Canada). A second round of PCR was then performed wherein samples were tagged using i3 and i5 indices of the Nextera Index Kit (Illumina, San Diego, CA, USA), followed by PCR clean-up and normalization as above. The samples were then pooled, quality was assessed using a Tapestation (Agilent, Santa Clara, CA, USA), and quantification was done using a KAPA Library Quantification Kit (KAPA Biosystems, Wilmington, MA, USA). Finally, next-generation sequencing was performed using a single MiSeq v3 600 Kit (Illumina, San Diego, CA, USA). Raw sequences were submitted to NCBI Sequence Read Archives (BioProject ID PRJNA1197472).
The raw sequence data were analyzed and grouped into operational taxonomic units (OTUs) using the ‘JAMP’ package available in R (Elbrecht, 2018). Paired end merging was conducted with USEARCH (Edgar, 2010), with a minimum 75% alignment match. Primer trimming (maximum error of 0.2) and length filtering (301–319 bp) were done using Cutadapt (Martin, 2011). Error filtering was conducted with USEARCH (Emax = 1). Finally, singleton reads were discarded and OTUs were clustered with 3% similarity using VSEARCH (Rognes et al., 2016). In addition, any replicates that contained less than 5 mesofaunal OTUs were considered a failed replicate and were excluded from the dataset. By these criteria, a total of 34 PCR replicates failed and were removed from the dataset; this resulted in the complete removal of some samples (two samples from Site NT3 and one sample from each of Sites LF1, SF3, and LF3). Two sampling points (Sites NT2-3 and NT2-6) were also excluded from the final dataset, as they were outliers with far more than the expected number of OTUs; examination of the voucher specimens confirmed that the sequencing data greatly overestimated the number of mesofaunal OTUs. All voucher specimens were databased and submitted to the Canadian National Collection of Insects, Arachnids, and Nematodes.
Following OTU clustering, abundance filtering was performed on all OTUs, using a dynamic approach; any OTU occurrence with less than 0.01% of the total read count in a sample was removed, as well as occurrences totaling <0.01% of the total read count for that OTU. To reduce the possible impact of tag switching or other sources of contamination, the maximum read count for each OTU in the negative controls was subtracted from all other instances of that OTU. PCR replicates were then pooled for each sample, only including OTUs that were present in at least two out of three PCR replicates; however, in instances where one or two PCR replicates failed, OTUs were kept if they were in a single replicate. OTU read counts were then converted to presence-absence data. Finally, taxonomy was assigned to each OTU using the BOLDigger program (Buchner and Leese, 2020) and the Barcode of Life Database (BOLD; Ratnasingham and Hebert, 2007); accessed June 2023. OTUs were designated as classified (at least to kingdom level) or unclassified (no taxon assigned). Taxonomy was assigned according to the best hit selected by BOLDigger, using the BOLD API correction tool (Buchner and Leese, 2020). All figures and the majority of statistical analyses were conducted in R (v4.2.3; R Core Team, 2023).
All statistical analyses were conducted on mesofauna taxa only, defined for the purposes of this study as those taxa assigned to Acari or Collembola. We compared the total mesofaunal OTU richness between habitats, as well as the richness of each order of Acari and Collembola using generalized linear mixed models (GLMM). Analyses were conducted in R, using the lme4 (Bates et al., 2015) and glmmTMB packages (Brooks et al., 2017), with the diagnostics of the model (uniformity, dispersion, heteroscedasticity) tested using the DHARMa package (Hartig, 2024). Data were initially analyzed using the Poisson distribution model, as recommended for count data. However, data that were overdispersed (a dispersion ratio of >1.2; Payne et al., 2018), or otherwise failed to meet the assumptions of the model, were analyzed using negative binomial distribution models, following the same diagnostic testing as above. In these cases, the two models were compared using AIC, to confirm the better fit of the negative binomial model. Each model included fixed effects for “habitat” and random intercepts for “site” (to control for sample interdependence among sites). The “No Trees” habitat type was selected as the intercept for the model. Post-hoc tests were conducted using Estimated Marginal Means from the emmeans package in R (Lenth, 2025).
We tested whether the mesofaunal community composition differed between habitat types with a nested permutational multivariate analysis of variance (PERMANOVA, 1,000 randomizations) using the incidence-based Sorensen’s dissimilarity metric as implemented by the vegan package (Oksanen et al., 2015) in R. We conducted post-hoc testing using a nested pairwise PERMANOVA test with the pairwiseAdonis package (Martinez Arbizu, 2020). Overlap in mesofaunal OTUs between the three sites for each habitat type were compared using Venn diagrams constructed with the BioVenn package (Hulsen, 2021). In order to visualize differences in mesofaunal community composition, as well as the level of correlation with the environmental variables, non-metric multidimensional scaling (NMDS) using Sorenson’s dissimilarity calculations for community data (i.e., Acari + Collembola OTUs), and correlation vectors of the environmental variables, were constructed with the metaMDS function using vegan (Oksanen et al., 2015). The number of dimensions for the final NMDS analysis was selected by repeating the NMDS analysis with increasing numbers of dimensions (from 1 to 10), graphing the stress of each analysis, and determining at what number of dimensions a plateau was reached.
To determine whether soil physicochemical properties differed between habitats, we used linear mixed models (LMM), implemented in R, using the lmerTest package (Kuznetsova et al., 2017). To test the assumptions of the model, the Shapiro-Wilks test for normality was conducted using base R (R Core Team, 2023), while the Levene test for homogeneity of variance was conducted using the DHARMa package (Hartig, 2024). Initial analyses used a Gaussian distribution model with untransformed values; if the assumptions were not met, the data were log-transformed and re-tested with the same model and diagnostics as above. Post-hoc tests were conducted using Estimated Marginal Means from the emmeans package in R (Lenth, 2025). Data were only included for those sites that were successfully sequenced for mesofauna (n = 65), however one sample from the large forest sites was not analyzed successfully by the external laboratory, and is thus missing for all parameters except gravimetric moisture.
Mantel’s test (10,000 randomizations) was used to assess for correlations between geographical distance matrices or soil physicochemical properties distance matrices and community composition distance matrices (using Sorenson’s dissimilarity based on mesofaunal OTU presence-absence) with vegan (Oksanen et al., 2015). Possible correlations between pairs of soil parameters were also examined by calculating the Pearson correlation coefficients for each pair of soil parameters using R, with the strength of the relationship based on Evan’s table (Evans, 1996).
After abundance-filtering, a total of 1,036 OTUs were detected from over 600,000 reads. Once reads were removed from the PCR and extraction negatives, and replicates were pooled, a total of 844 OTUs were recovered from all 12 sites; however, only 585 of these could be assigned to any taxon (Table 1; Supplementary Table S2). These classified OTUs consisted of 19 classes, 37 orders, and 100 families (Supplementary Table S2). Of the animal taxa found (551 OTUs), only 24% (131 OTUs) were assigned to the species level, and many OTUs (36%) had no identifications below the family level (Supplementary Tables S2, S3).
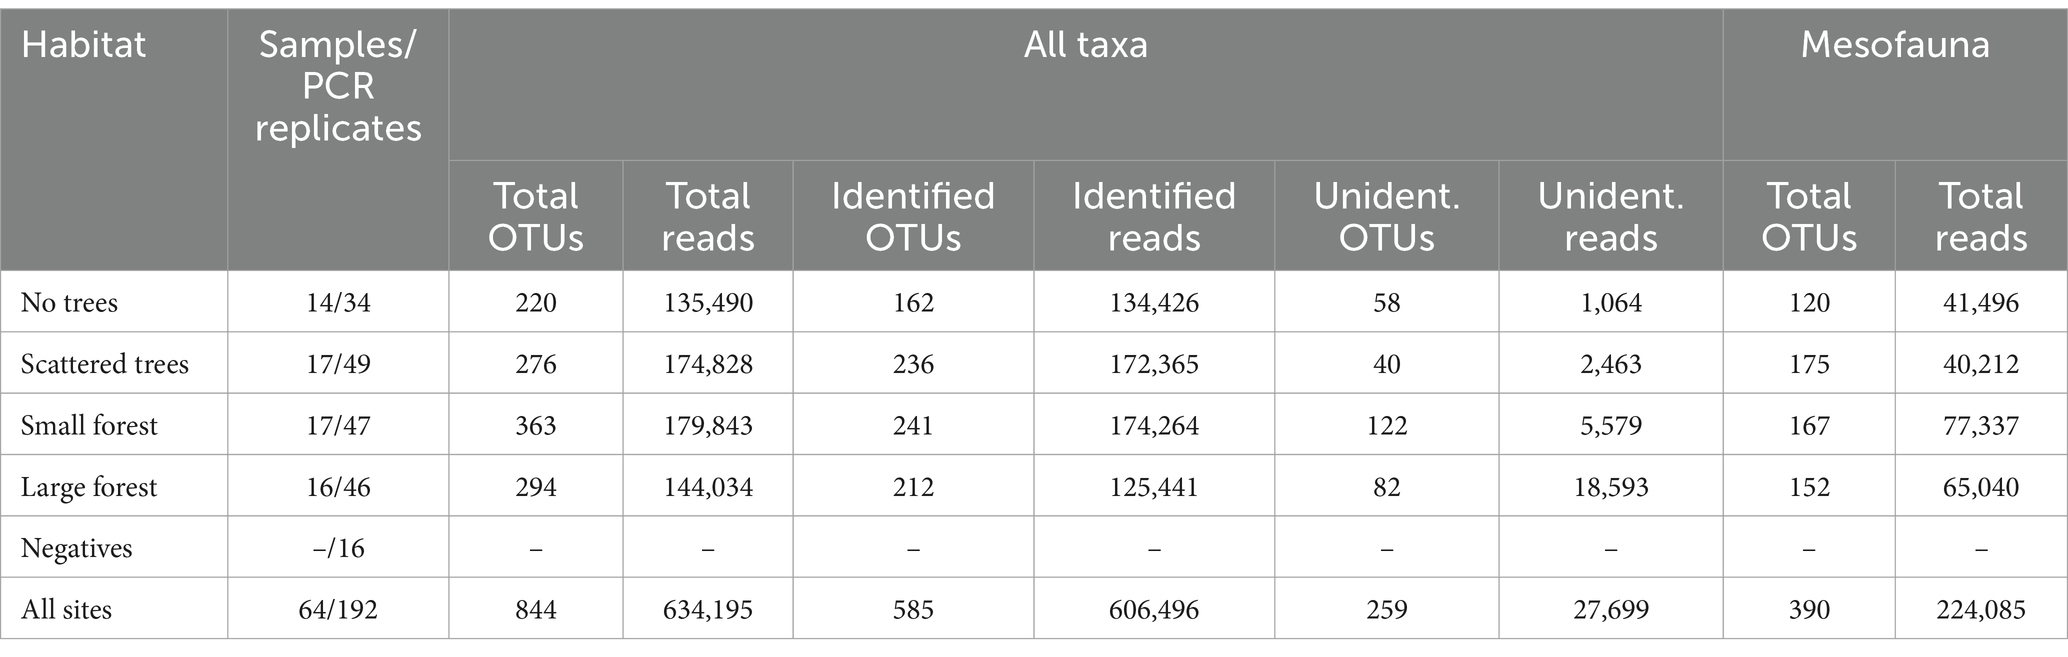
Table 1. Summary of OTUs and reads (following abundance-filtering and pooling) for each habitat type.
A total of 390 mesofauna OTUs were detected, of which 70% (273 OTUs) were Acari and 30% (117 OTUs) were Collembola (Supplementary Table S3). Within Acari, Trombidiformes (Prostigmata) and Sarcoptiformes (primarily Oribatida) were each far more OTU-rich than Mesostigmata (Figure 3). The most OTU-rich families were Eupodidae (44 OTUs), Tydeidae (20 OTUs), and Oppiidae (16 OTUs), while 14 families were only represented by a single OTU (Supplementary Table S3). Twenty-eight Acari OTUs (10%) were assigned to species, 57 (31%) were assigned only to the genus level, while the majority (47%) could only be assigned to family (129 OTUs) or order (59 OTUs) (Supplementary Table S3). For the Collembola, the orders Entomobryomorpha and Poduromorpha contained the majority of OTUs (52 and 36, respectively) in comparison with the other orders (Figure 3; Supplementary Table S3). The most OTU-rich families were Isotomidae (32 OTUs) and Entomobryidae (11 OTUs), while 2 families were only represented by a single OTU. Twenty-six springtail OTUs (22%) were assigned to species, 28 OTUs (24%) were assigned only to the genus level, 46 OTUs (39%) could only be assigned to family, and 17 OTUs (15%) were assigned only to order (Supplementary Table S3).
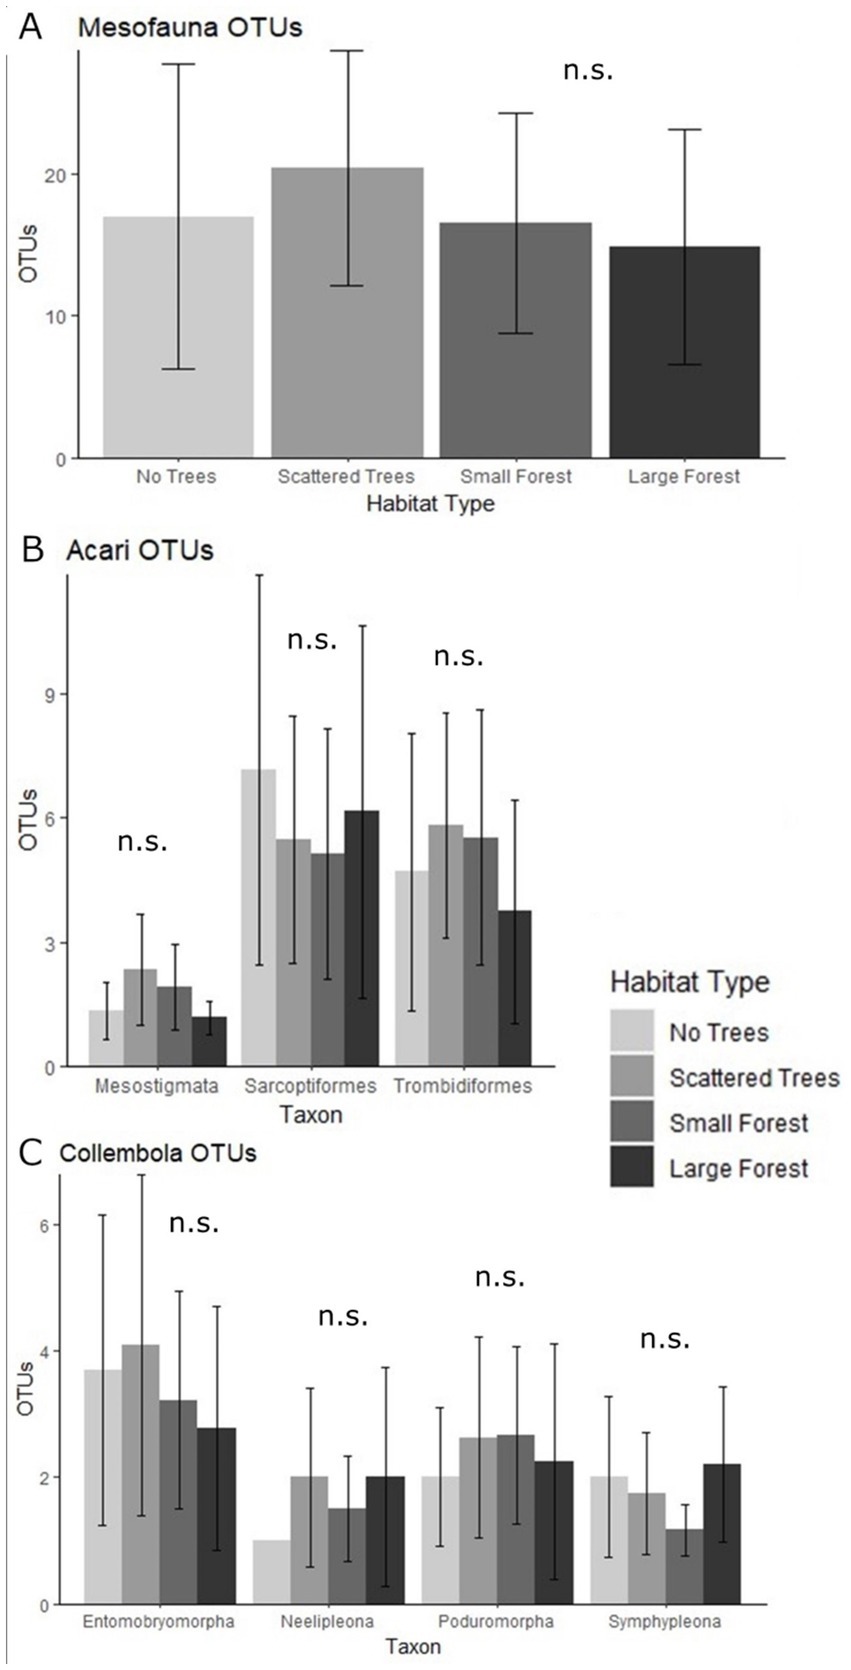
Figure 3. Mean (± SD) number of mesofauna OTUs for each habitat type; (A) All mesofauna taxa combined; (B) Acari orders; (C) Collembola orders. GLMM analysis did not find any significant differences between habitats for the total mesofauna OTU richness, or for OTU richness of any order. n.s. = no significant differences.
The total mesofauna OTU richness did not differ significantly between habitats (Figure 3A; Supplementary Tables S4, S5). At the ordinal level, OTU richness was highly variable within each habitat (Figures 3B,C), however there were no significant differences between the habitats (Supplementary Tables S4, S5).
The PERMANOVA results indicated significantly different mesofaunal community composition between habitats (df = 3, F = 2.45, R2 = 0.10, p < 0.001), as well as between sites within a habitat type (df = 8, F = 1.95, R2 = 0.21, p < 0.001). Post-hoc pairwise testing indicated that all habitat types differed significantly in their mesofaunal community composition, as well as all sites within each pair of habitats (p < 0.001; Supplementary Table S6). This is supported by how few taxa overlap between different sites, even within the same habitat type (Figure 4).
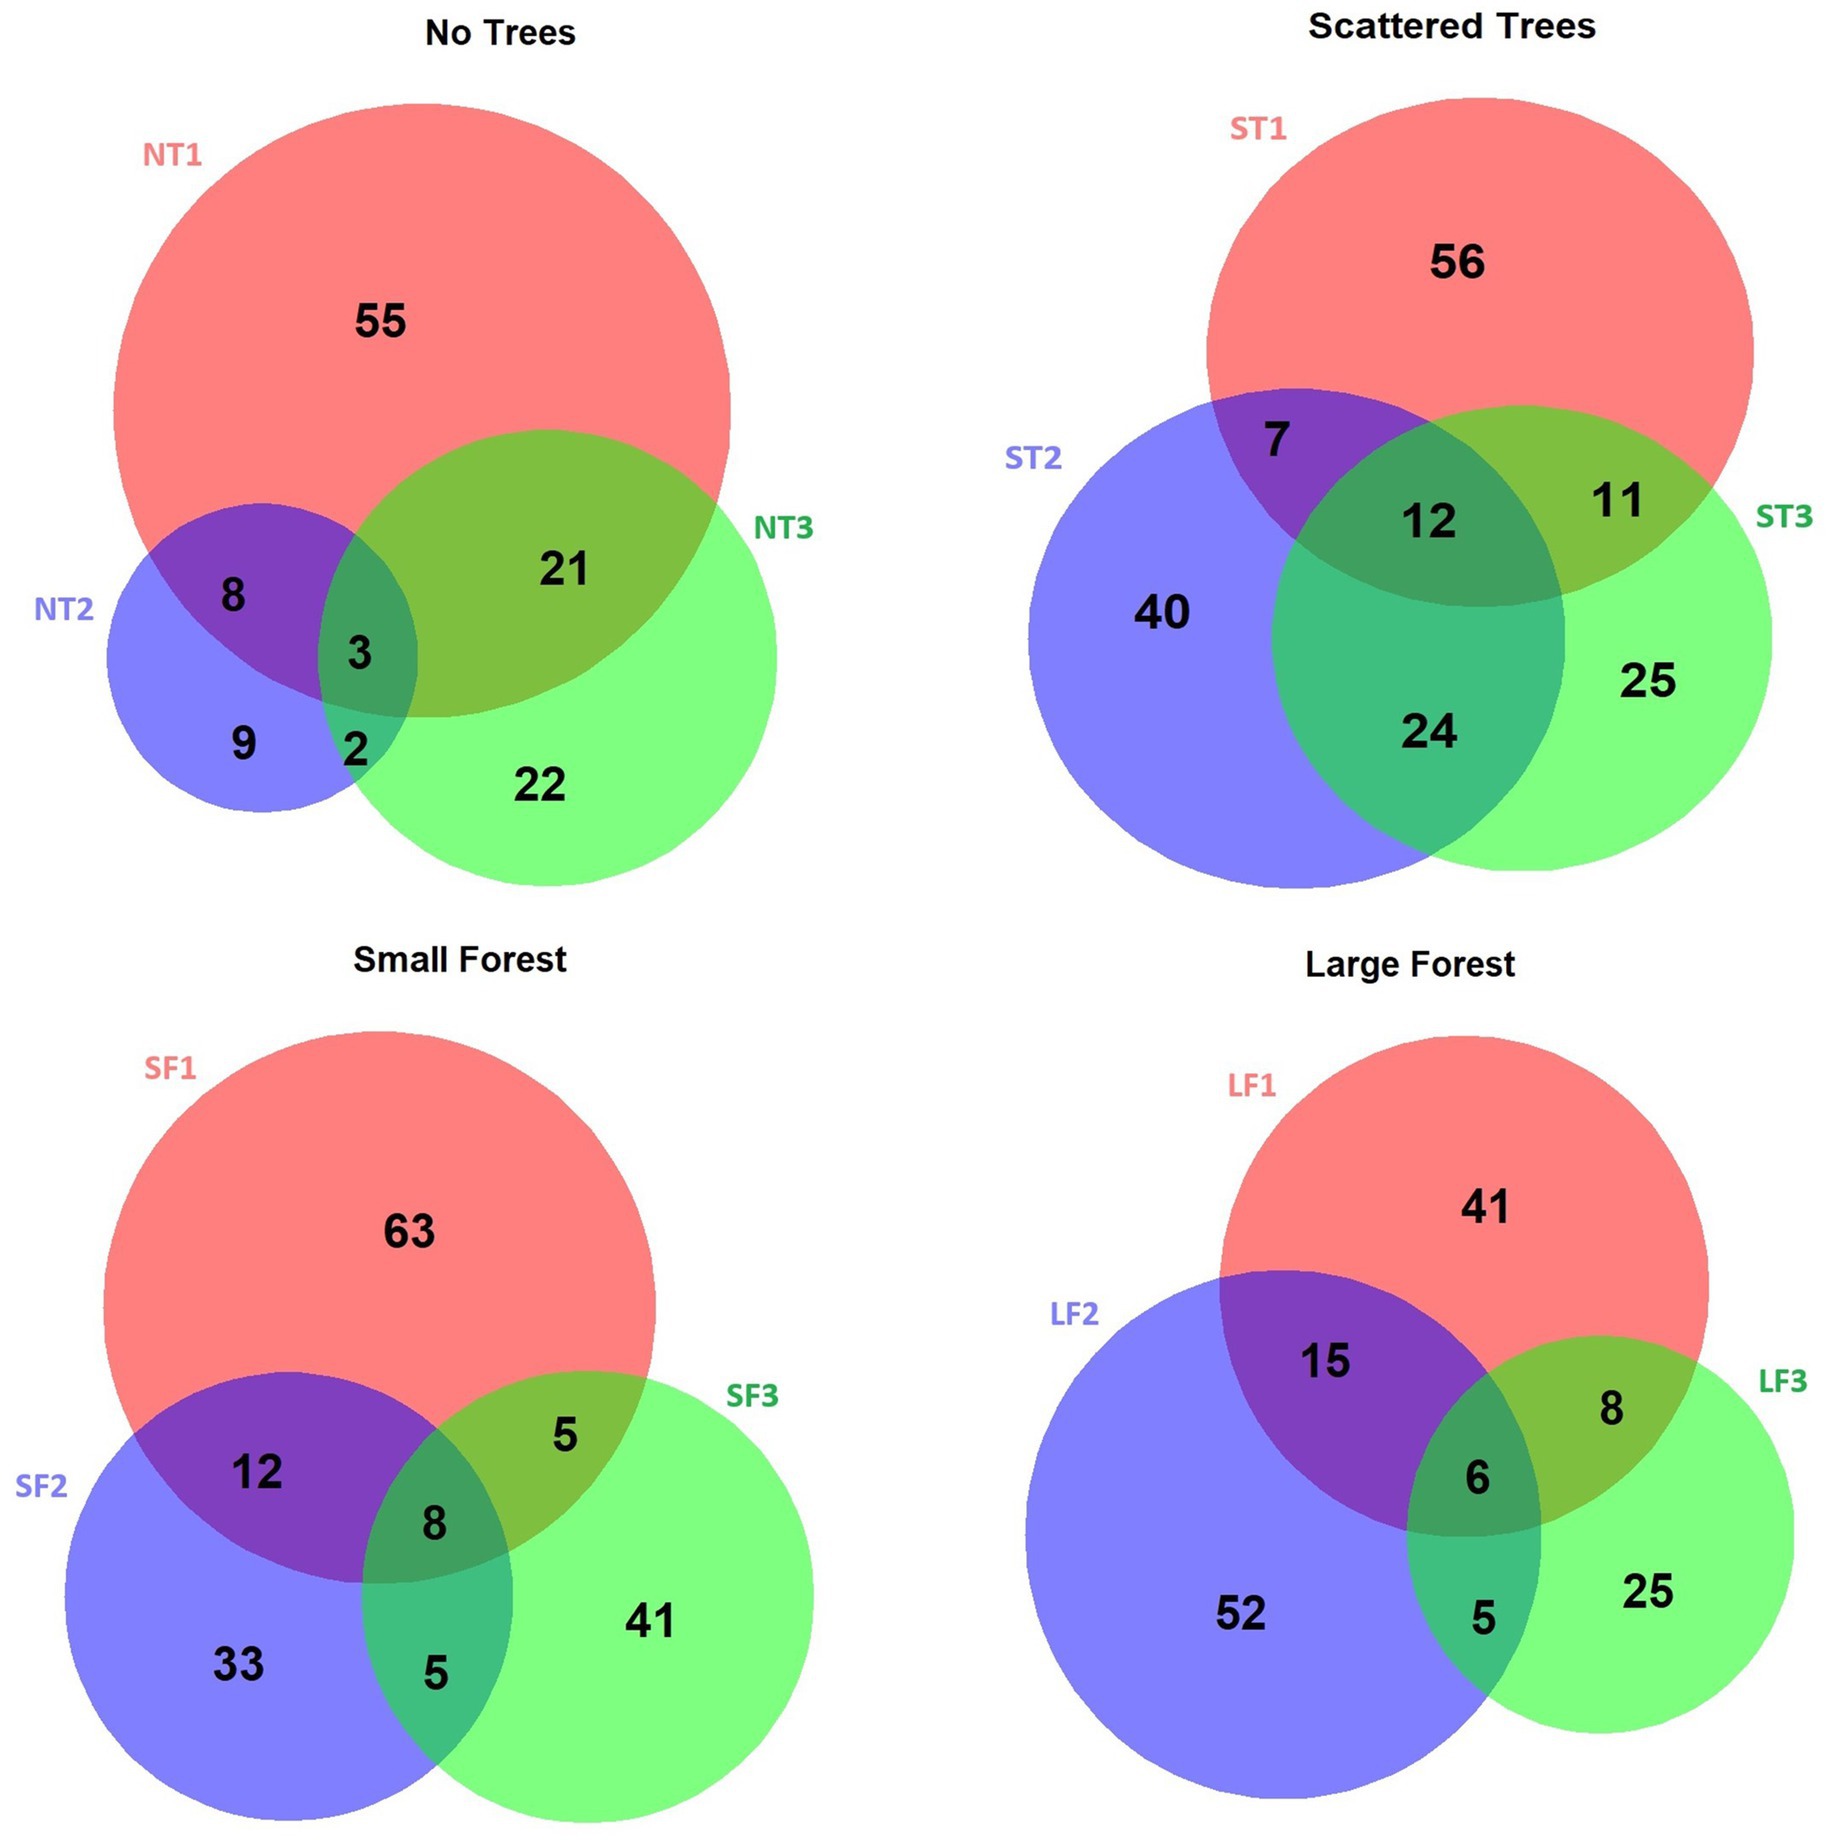
Figure 4. Overlap of mesofauna OTUs detected from the three sites within each habitat type.
Based on preliminary testing, a 3-dimensional solution was selected as the best NMDS result; however, the analysis failed to converge, even with running up to 100 iterations, and the final stress (0.19) was only marginally acceptable (Clarke, 1993). The NMDS analysis showed extensive overlap between the sites and habitat types, despite the results of the PERMANOVA; there was however an apparent distinction between unforested (no trees and scattered trees) and forested (large forest and small forest) sites along the NMDS2 axis (Figure 5). We did not observe a strong ecological signal with respect to habitat across the other axes (NMDS1 or NMDS3; Figure 5).
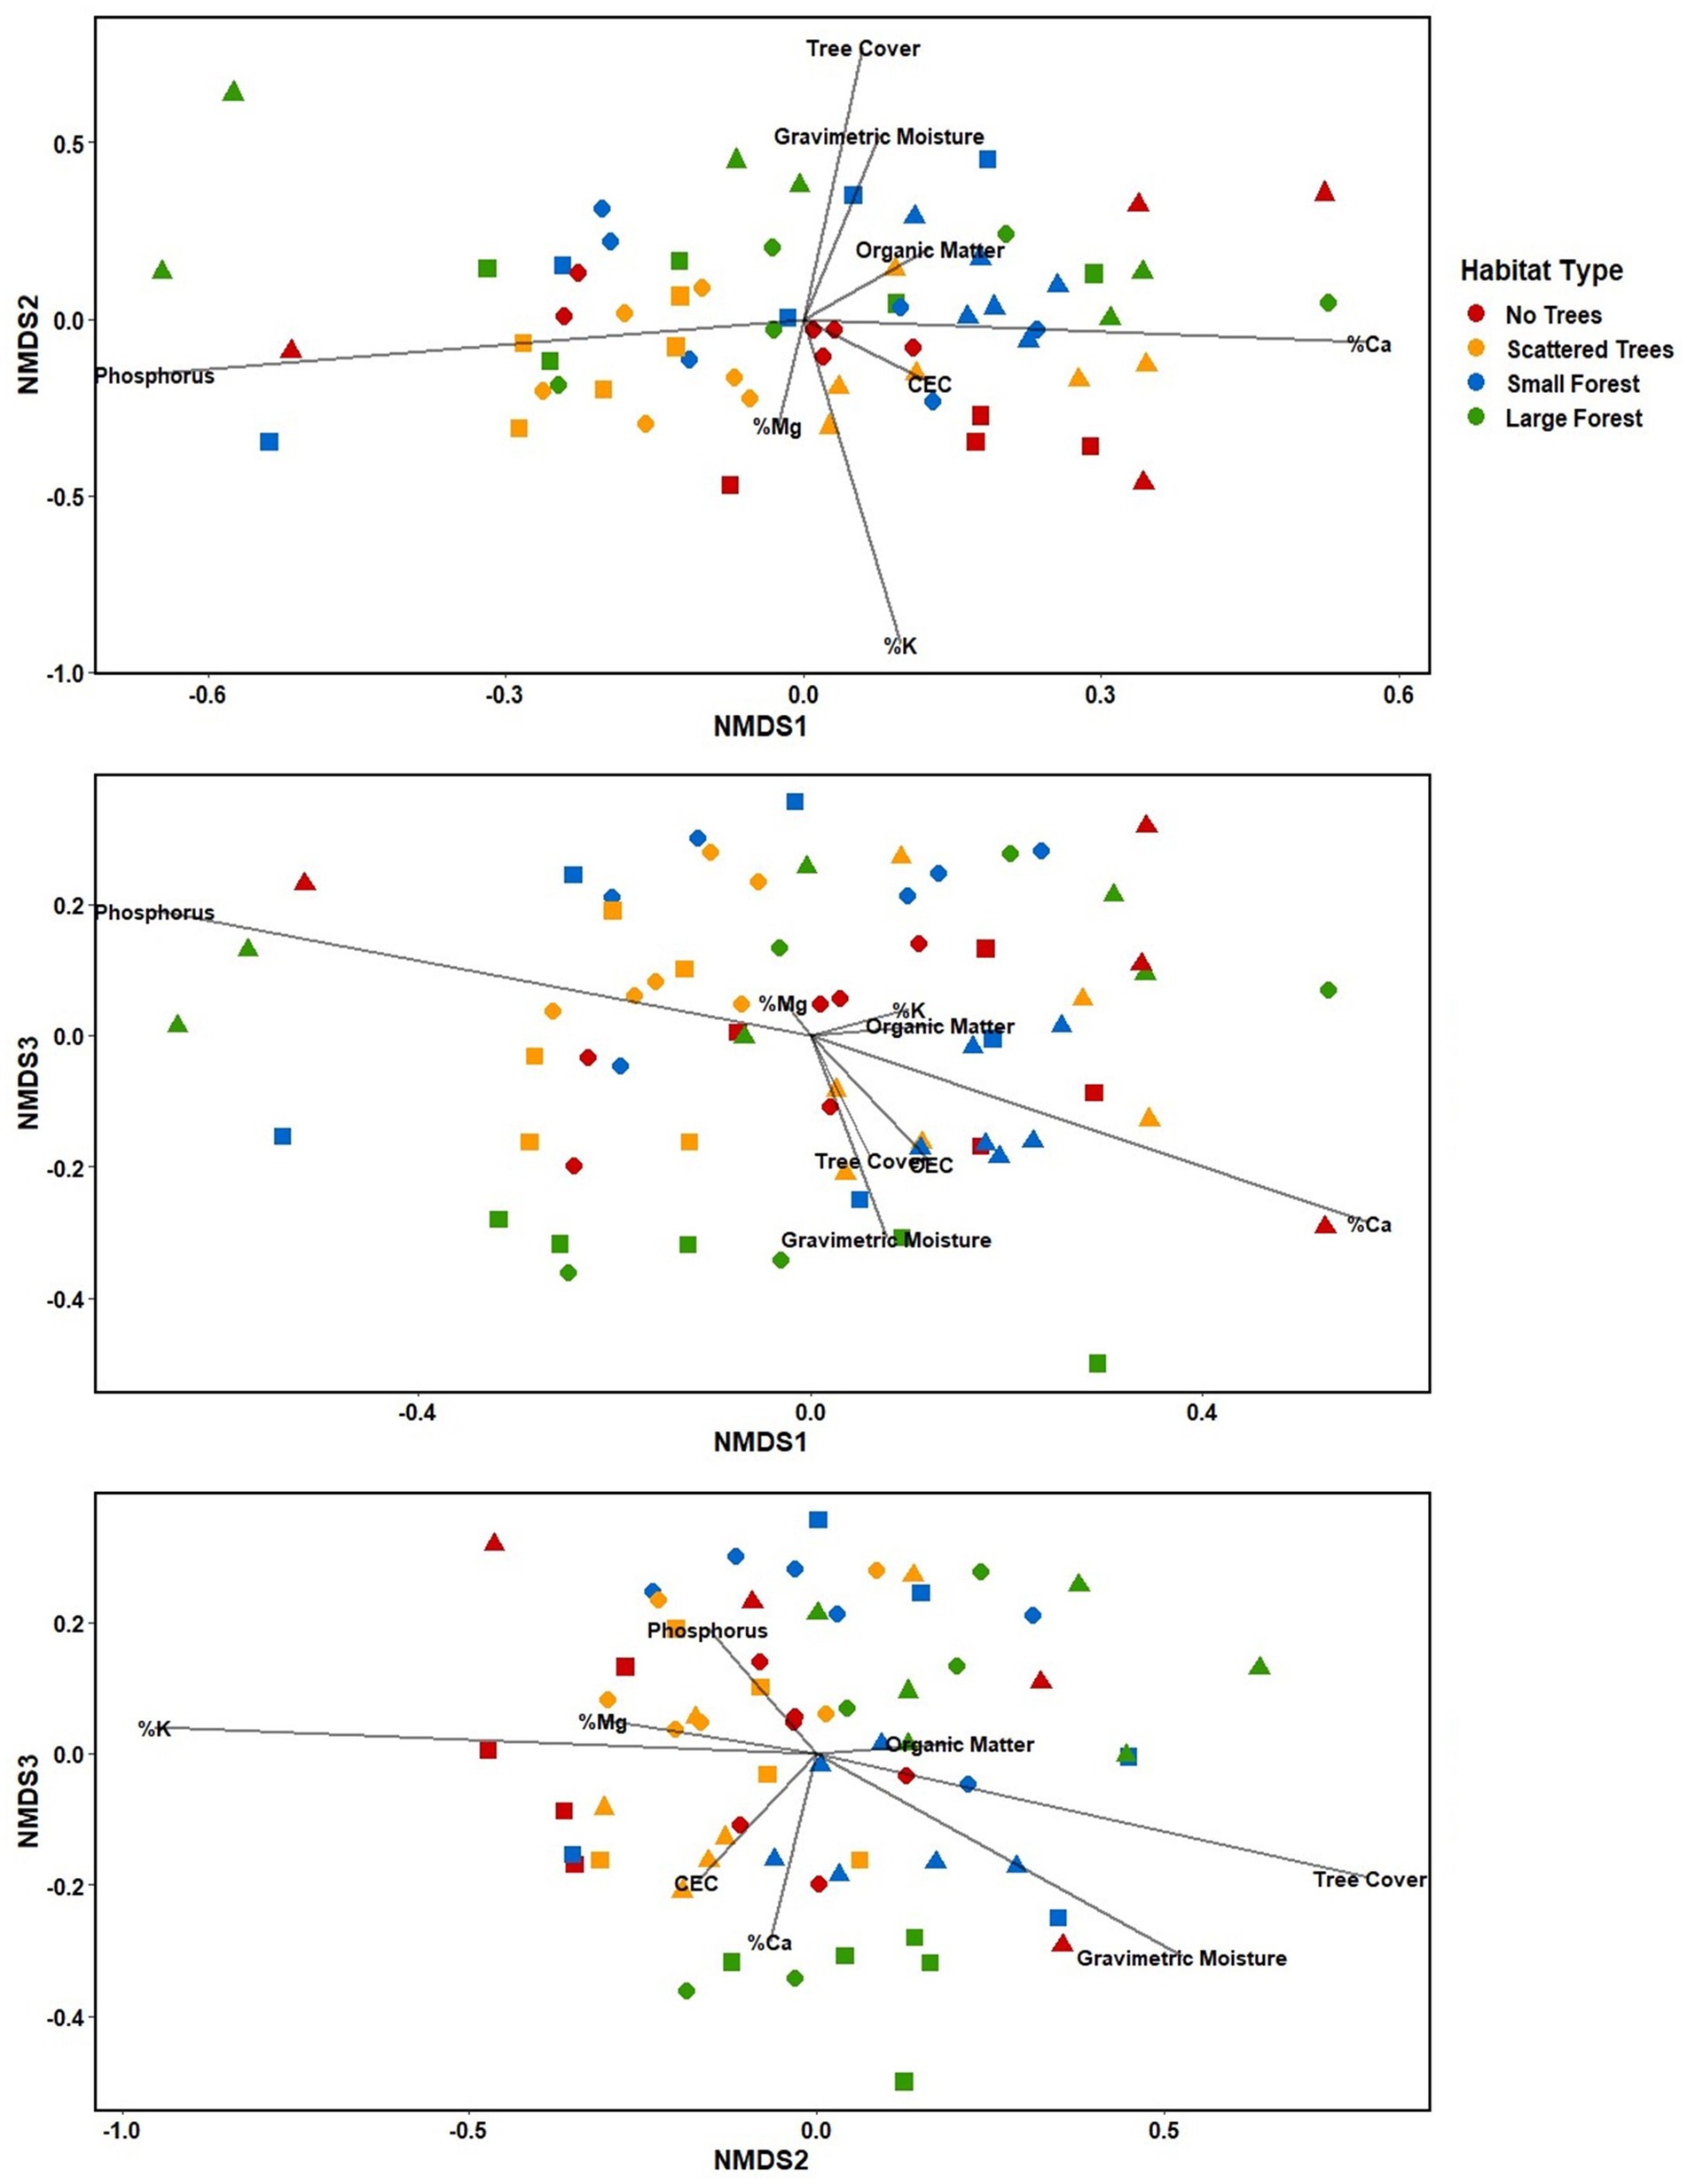
Figure 5. Three-dimensional non-metric multidimensional scaling (NMDS) of mesofaunal community composition at each site, with soil parameters represented as vectors (stress value = 0.19). Red = No trees: circles = NT1, triangles = NT2, squares = NT3. Yellow = Scattered trees: circles = ST2, triangles = ST1, and squares = ST3. Blue = Small forest: circles = SF2, triangles = SF1, and squares = SF3. Green = Large forest: circles = LF1, triangles = LF2, and squares = LF3.
Samples within each site mostly clustered together, however there were several exceptions (Figure 5). For example, the samples from Sites NT2, SF2, and LF1 were widely dispersed across the ordination. The samples from Site NT1 formed two distinct clusters, with four samples in one cluster among the unforested sites and two samples clustering toward the forested sites. The samples from Site ST1 form three clusters, two among the unforested sites, and one sample among the forested sites. Samples from Site LF3 also formed two distinct clusters, with three samples in one cluster and two samples in the other. One sample from Site SF3 was also highly distinct from the rest of the site, and the six samples from Site LF2 formed three distinct clusters.
Significant differences between habitats were only found for Potassium. It was lower in forested than unforested habitats, however the only significant differences were between the large forests and the two unforested habitats (scattered trees and no trees) (Figure 6C, Supplementary Tables S7, S8). Although not statistically significant, there was an observable pattern of increasing gravimetric moisture with increasing tree cover/forest patch size (Figure 6G).
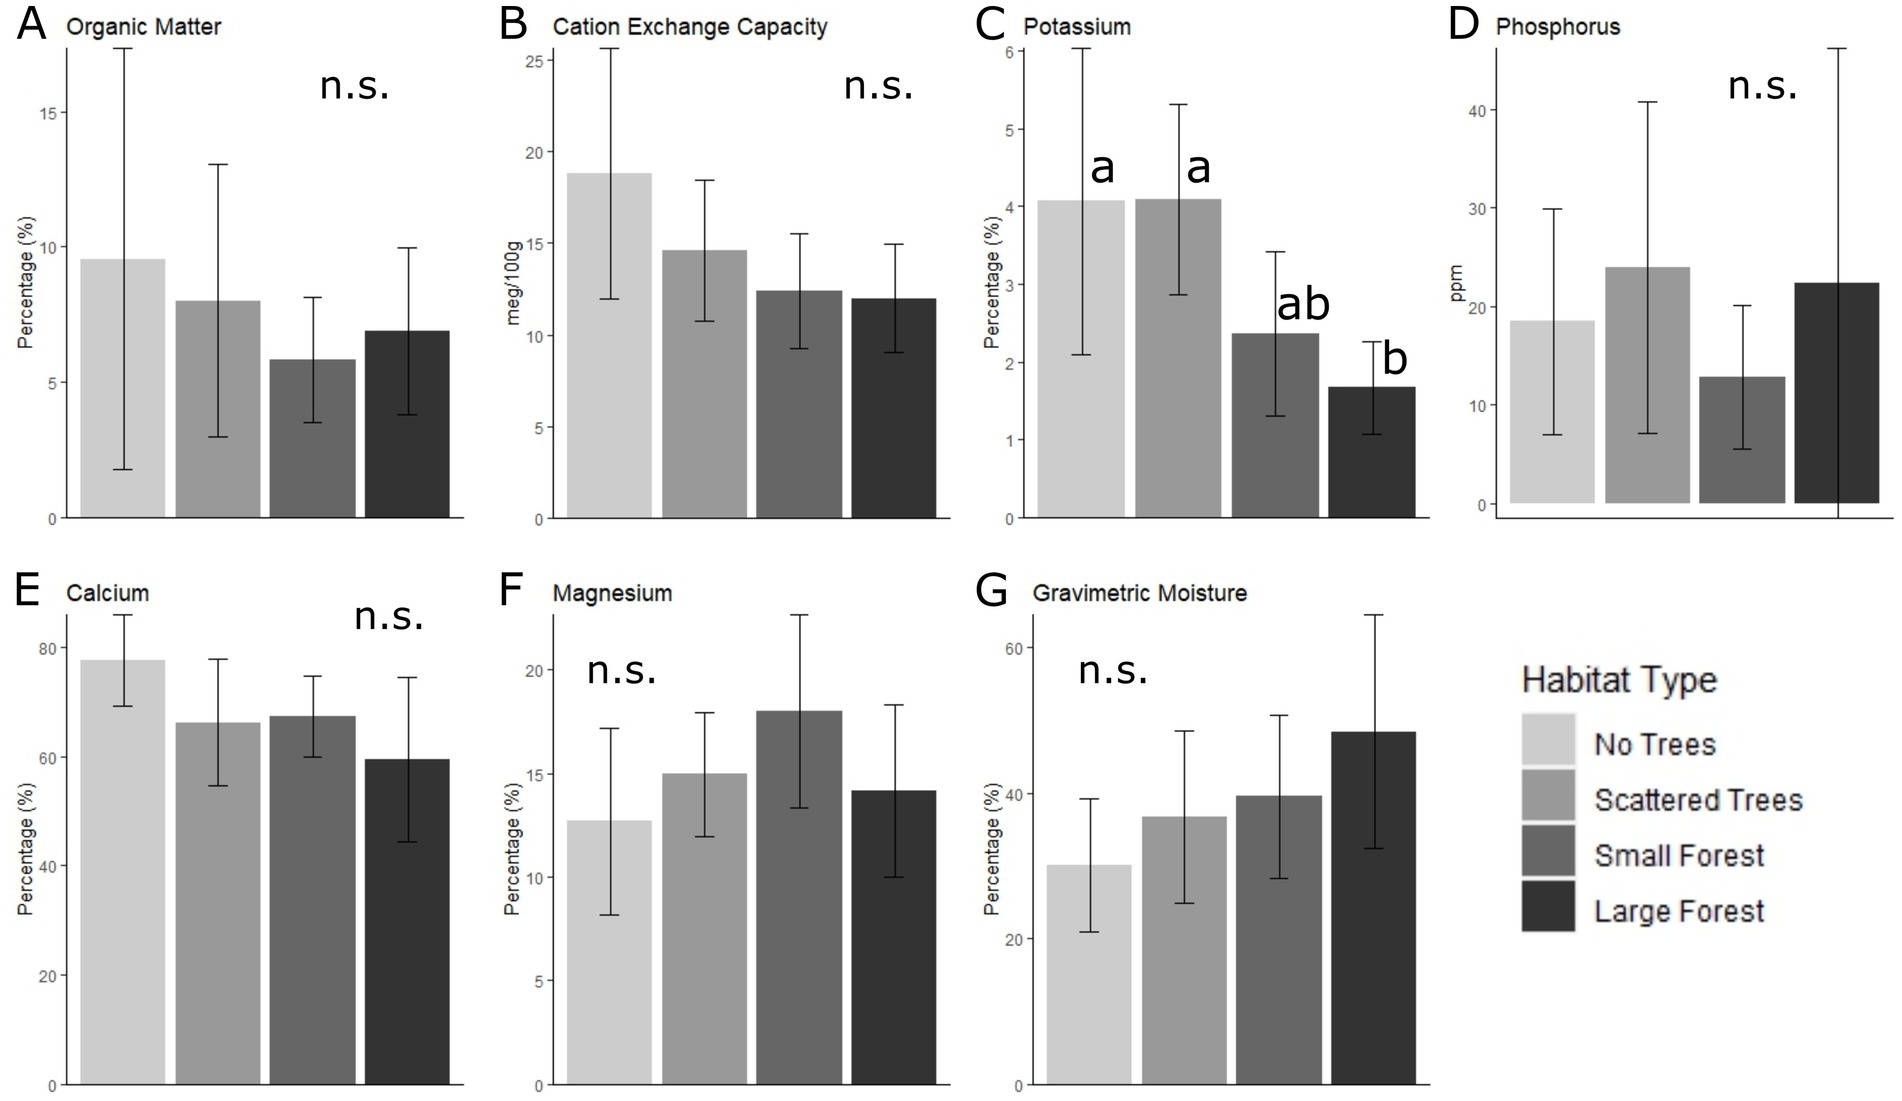
Figure 6. Mean (± SD) for seven soil parameters in each habitat type. (A) Organic matter; (B) Cation exchange capacity; (C) Percent saturation potassium; (D) Phosphorus (Bray-PI); (E) Percent saturation calcium; (F) Percent saturation magnesium; (G) Gravimetric moisture. Bars marked with different letters are significantly different, according to an LMM analysis, with post-hoc tests based on estimated marginal means and adjusted p-values for multiple comparisons. n.s. = no significant differences.
Based on the Mantel tests, there was a significant correlation between community composition and organic matter (p = 0.002), cation exchange capacity (CEC) (p = 0.008), percent base saturation of magnesium (p = 0.004), and calcium (p = 0.005) (Table 2). As well, community composition was significantly correlated with the geographic distance between samples (p < 0.001) and with tree cover (p = 0.001; Table 2). These patterns were also apparent in the NMDS graph, which depicts tree cover, gravimetric moisture, and organic matter correlation vectors being associated with NMDS2, with all three increasing toward the forested sites (Figure 5). Pearson coefficients showed a strong correlation between CEC and organic matter; correlations were moderate or weak for all other pairs of parameters (Supplementary Figure S1).
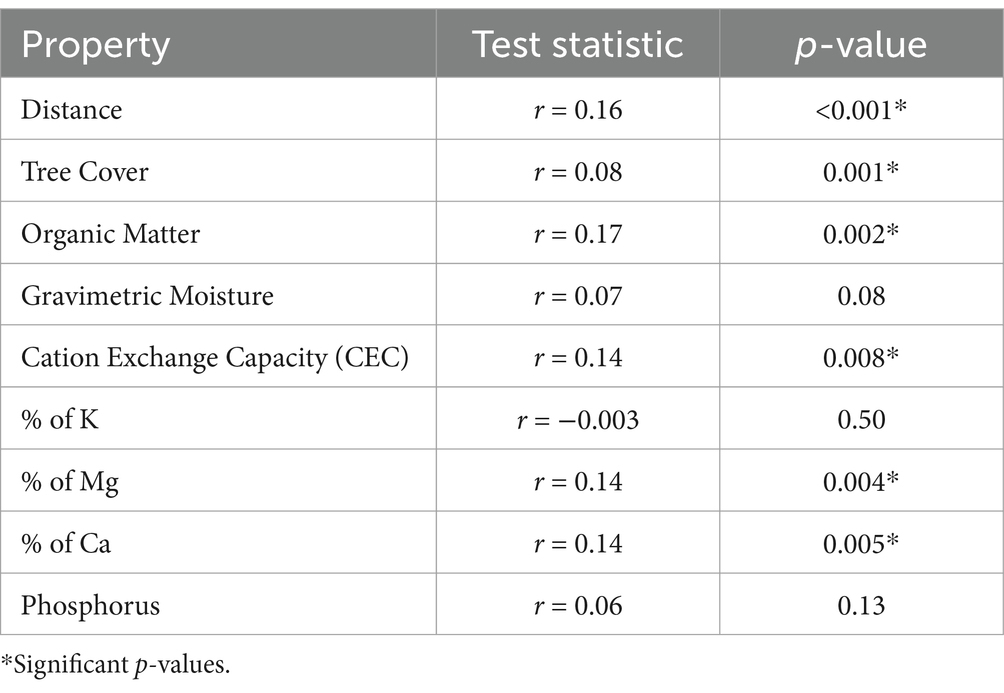
Table 2. Correlation of community similarity with distance, tree cover, and soil physicochemical properties, based on Mantel tests.
Agricultural ecosystems are home to a large diversity of soil organisms, particularly along field edges or other semi-natural habitats (Morris et al., 2010; Bennewicz and Barczak, 2020). Gathering baseline information on these soil organisms is essential in order to monitor and mitigate threats to soil biodiversity (FAO et al., 2020) and retain the ecosystem services they provide. However, surveys of soil mesofauna are still relatively rare in Canadian agroecosystems, particularly with identifications beyond the family level (exceptions being Berg and Pawluk, 1984; Osler et al., 2008; Walter et al., 2014; Walter and Lumley, 2021). Taxonomic richness is thus more often explored at the family or subfamily level, which may mask more fine-grained patterns of diversity (e.g., Reeleder et al., 2006; Carter and Noronha, 2007; Carter et al., 2009; Miller et al., 2014; Miller et al., 2017; Lupardus et al., 2021). For the habitats sampled in this agro-ecosystem, metabarcoding enabled the detection of over 1,000 OTUs (as a proxy for species) belonging to a wide range of taxa, including both the target mesofauna, as well as many other soil dwelling fauna. From this, 500 arthropod OTUs were detected, of which almost 400 OTUs were mesofauna.
The majority of mesofaunal taxa (75%) could not be assigned to the species level, and 44% could not be assigned past family. This lack of taxonomic resolution is unsurprising considering the number of undescribed mesofaunal species; for example, the majority of Acari species in Canada have yet to be described (Lumley et al., 2013; Beaulieu et al., 2019) and it is estimated that only 13% of Canadian Collembola have been described (Turnbull and Stebaeva, 2019). A lack of species designation for an OTU can also stem from incomplete reference sequence libraries, particularly for mesofauna (Young and Hebert, 2022; Recuero et al., 2023). For example, it is estimated that only 10% of the described Acari species have been assigned Barcode Index Numbers (BINs; a formal OTU designation) in BOLD’s COI reference library (Beaulieu et al., 2019). Although many of these species may be represented in BOLD, given the >16,000 Acari BINs from Canada alone (accessed November 2024), many BINs have yet to be identified beyond the family or genus level. Consequently, even OTUs that closely match a record in the reference library may not gain a lower-level identification. Taxonomic biases likely also exist in the database, as noted for Collembola, whose records in BOLD are skewed toward larger, surface-dwelling taxa, leaving the smaller soil-dwelling taxa far less complete (Turnbull and Stebaeva, 2019).
These taxonomic issues are further exacerbated by the possibility of incongruence between OTUs (or BINs in the BOLD database) and true biological species. While COI has been used extensively to distinguish arthropod species (Hebert et al., 2003; Virgilio et al., 2010; Wilson et al., 2017), it is not always successful for closely related species with low interspecific divergences (Kaila and Ståhls, 2006; Meier et al., 2006; Elias et al., 2007; Carew and Hoffmann, 2015; Keck et al., 2023). Alternatively, species with high intraspecific COI variability can be over-split by this method (Lukic et al., 2021; Keck et al., 2023), artificially inflating estimates of species richness (Song et al., 2008). Although in some cases these may represent cryptic species that have not yet been described (Beaulieu et al., 2019; Zhang et al., 2019), disentangling these alternatives can be challenging without detailed taxonomic work. Clearly, increased efforts are needed to update mesofaunal reference libraries, through faunistic surveys, assessing concordance between BINs and biological species, describing new taxa, and by morphologically identifying BINs that are already present in BOLD.
Despite the challenges in obtaining species-level data, evidence suggests that higher taxonomic levels can still be highly informative from an ecological lens (Bacci et al., 2009; George et al., 2017; Meehan et al., 2019). On top of this, OTU richness (even without named taxa) can be used as an effective proxy for species richness, allowing detailed comparisons of biological diversity (Ji et al., 2013), thus enabling a fine-grained understanding of ecological relationships within the soil.
Maintaining natural areas in agricultural landscapes has been shown to benefit soil biodiversity (Bennewicz and Barczak, 2020) and forested habitats are known to contain more soil mesofaunal biodiversity than do unforested areas (Tomlin and Miller, 1987). This difference has been attributed not only to increased soil moisture and organic matter in forested sites (Arroyo et al., 2013; George et al., 2017; Szigeti et al., 2022), but also to the less disturbed soil environments in forests (Kuznetsova, 2006), compared to arable land that is, for example, tilled seasonally. Even the increased amount of vegetation found in shrub habitats, relative to grasslands, was found to be advantageous for soil arthropod diversity, as it increased soil moisture and provided microclimates more suitable for these organisms (Ferguson, 2001). It was therefore surprising that we did not find significant differences in OTU richness between the unforested and forested sites in this study.
While the overall patterns of mesofaunal diversity may have masked more pronounced patterns among specific taxonomic groups, this was not observed, at least at the ordinal level, in our data. For example, the three orders of Acari collected in this study (Sarcoptiformes [primarily Oribatida], Trombidiformes [Prostigmata] and Mesostigmata have widely varying life strategies that should respond differently to the habitats we sampled). More specifically, Prostigmata and Mesostigmata are primarily made up of “r-selected” species, with high fecundity and shorter lifespans (Behan-Pelletier, 2003); because of this adaptability, it is less surprising that these groups had no differences in diversity between habitat types. Oribatids, conversely, are “K-selected” soil organisms that reproduce relatively slowly, have low fecundity, and have longer lifespans (Behan-Pelletier, 2003). Consequently, oribatids are often associated with more stable and less disturbed environments (Maraun and Scheu, 2000), but in this study we found no differences in their richness between seemingly very different habitat types (e.g., un-treed field ditches vs. forested habitats). Kokořovǎ and Starý (2017) found an increase in more tolerant and resilient oribatid species in disturbed forested ecosystems; further analysis at a finer taxonomic resolution would be necessary to test this hypothesis in this system. However, while at an earlier successional stage than the forested habitats, soils in the ditch habitats were nonetheless relatively undisturbed and often protected by a thick layer of brome grass litter. This observation may explain the suitability of ditches as habitat for oribatid mites which are known to be abundant and diverse in natural grassland habitats as well (Behan-Pelletier and Kanashiro, 2010). Future work comparing the ditch and forest mesofaunal communities with those of the adjacent cultivated fields would help determine the impact of disturbance on these soil communities and illuminate the extent to which adjacent habitats influence the in-field taxa.
Despite these observations, the possibility remains that this pattern of unchanged OTU richness between habitat types was simply due to high sample variability and insufficient sampling effort. Because of logistical constraints, we were only able to sample three sites per habitat type, and significant variability was found in the number of OTUs detected even between the sampling points within each site. Increasing the number of sites within each habitat type, as well as the number of replicates within each site, would likely improve our understanding of species richness patterns in these settings. In addition, we were only able to include a single time point in early summer for this study. Since Acari and Collembola abundance and richness have been shown to change over the year (Ferguson and Joly, 2002; Rochefort et al., 2006; Kaczmarek et al., 2011), increasing the temporal range of sampling would have improved our understanding of the species richness at these sites.
Significant differences in mesofaunal community composition were detected by PERMANOVA, both between habitat types and between sites within a habitat type. However, the NMDS ordination revealed considerable overlap in community composition between sites and habitats. This discrepancy is likely because PERMANOVA methods consider both the centroid and the spread of samples (Anderson, 2017). As noted in our OTU richness analysis, these samples were also characterized by highly variable community composition data. Therefore, the significant differences observed by PERMANOVA may reflect changes in the variability within groups, in addition to overall community dissimilarity. As well, the high stress of the ordination indicates that the pattern of points in the ordination space should be considered cautiously; including more dimensions in the analysis would likely have improved the fit, but would also become increasingly challenging to interpret (McCune and Grace, 2002). This further emphasizes the high variability within and between each site.
While we expected microhabitats (and consequently sampling points) in forested sites to be heterogeneous, and thus to contain more heterogeneous groups of mesofauna (Kuznetsova, 2006), unforested sites appeared more homogeneous at the macro-scale, and we expected to find a more homogeneous array of fauna in these samples. In fact, we found little overlap in species presence between sites in any of the habitats, and no distinct clustering of the communities. This indicates that the scale at which the communities are being structured is more fine-grained than the large-scale habitats defined here. For example, despite relative homogeneity on a landscape scale, the ditch sites varied in terms of grass density, herbaceous species present, and distance to the nearest shrub or tree; soil moisture and other physicochemical traits also varied across a very small scale. In forested sites, these small-scale differences are even more pronounced, with overstory trees, understory vegetation, litter layer quality and quantity, and dead wood features all varying throughout the habitat. In all habitats, therefore, differences in community composition between samples could be attributed to small-scale habitat features or associated vegetation of each sampling location (Hansen, 2000; Heydari et al., 2020), or in differences in the underlying soil layer (George et al., 2017). Geographical distance can also impact mesofaunal species composition (Lehmitz et al., 2012; Arribas et al., 2020; Andújar et al., 2022), with the similarity of these communities decreasing as spatial distance increases (Gao et al., 2014); an observation that was supported in our study.
One factor that limited our ability to detect differences in community composition is the lack of abundance data for the collected taxa. Read counts are likely a poor indicator of abundance due to issues arising from primer bias and specimen biomass (Elbrecht and Leese, 2015). The very large specimen diversity detected here limited the capacity to identify and count all voucher specimens, which would have revealed details about richness and evenness at each site, as well as specifically which taxa were dominant. Using presence-absence data treats all taxa equally, which excludes consideration of abundance or strength of association with particular habitats. As well, it is possible to detect gut contents of predatory taxa, potentially resulting in higher numbers of OTUs for prey species, such as Collembola (Eitzinger et al., 2013). Finally, these methods can detect DNA from dead organisms or their remains that are not actively living in that habitat (Deiner et al., 2017; van der Heyde et al., 2022). These factors may have resulted in more diffuse patterns of community compositions within and between sites.
Despite high sample to sample, and site to site variability, we nonetheless found that forested sites (regardless of size) contained apparently distinct mesofaunal communities than did the unforested sites (whether with or without scattered trees). These communities are strongly associated with increasing tree cover, unsurprisingly associated with increased moisture, and to a lesser extent, organic matter. This indicates that even small, fragmented forest patches are maintaining a forest-like community, reinforcing the important ecological role that forest patches play in supporting biodiversity in agricultural systems (Hendrickx et al., 2007; Vanbergen et al., 2007; Decocq et al., 2016). However, even in the larger forest patches, our samples were collected relatively near edges, due to logistical constraints. Sampling in the interior of large forest patches may have resulted in more distinct forest specialist communities (Vanbergen et al., 2007). Consequently, our data do not reveal whether small forest patches are similar to larger ones in terms of the mesofaunal communities, but rather that they support communities that are distinct from unforested field margins. Further work to explore the connectedness of habitat patches would be beneficial to understand the soil biodiversity patterns in these ecosystems (Rantalainen et al., 2005).
Understanding the relationship between soil physicochemical parameters and soil mesofauna communities is valuable to predict when environmental changes may create shifts in soil community composition that alter ecosystem function for both agroecosystems and adjacent semi-natural (or natural) areas. Here, we found that ecological characteristics associated with forest areas (e.g., high canopy cover, elevated soil moisture, and soil organic matter) help to structure mesofaunal communities observed from forested sites. However, these trends were less pronounced than we predicted, further emphasizing the high variability between samples within sites, and sites within habitats, both in terms of environmental parameters and community composition. The thick layer of grass litter in many of the non-forested sites may also have resulted in more protected soils than would otherwise be expected in such exposed habitats. More detailed work at a finer scale would help shed additional light on the mechanistic relationships between soil mesofauna and their environment. Expanding sample sizes would also be valuable, but challenges remain regarding the identification of organisms within soil communities, whether future work relies on morphological or molecular techniques, or a combination of both.
This study examined soil mesofaunal OTU richness and community composition from a range of natural features within an agriculturally dominated landscape. Gathering this baseline information helps fill a knowledge gap in our understanding of mesofauna function and habitat in agroecosystems within Canada, and perhaps even more broadly across other humid temperate regions in the world. This study also highlighted a need for more robust taxonomic efforts to be made in order to update mesofaunal reference libraries for future metabarcoding work. Differences in OTU richness were not detected between the four habitat types or between most sites within habitats; however, community composition differences were found to be significant. Due to the small scale at which the mesofauna operate, community patterns were probably influenced more strongly by microhabitats within sites, rather than by the macrohabitat scale of this study. Nevertheless, it is clear that uncultivated natural features in otherwise arable cropland environments are home to a vast diversity of soil organisms. We also demonstrated that even small, forested patches can contain mesofaunal communities similar to those of larger forested patches, highlighting the importance of preserving these features as small yet robust sources of biodiversity within an agricultural matrix.
The datasets presented in this study can be found in online repositories. The names of the repository/repositories and accession number(s) can be found in the article.
The manuscript presents research on animals that do not require ethical approval for their study.
AS: Conceptualization, Data curation, Formal analysis, Investigation, Methodology, Writing – original draft, Writing – review & editing. MY: Formal analysis, Methodology, Writing – review & editing. LP: Methodology, Investigation, Resources, Writing – review & editing. NA: Data curation, Methodology, Investigation, Writing – review & editing. DL: Conceptualization, Methodology, Project administration, Funding acquisition, Resources, Writing – review & editing. JK: Conceptualization, Supervision, Writing – original draft, Writing – review & editing. MS: Conceptualization, Formal analysis, Funding acquisition, Investigation, Methodology, Supervision, Writing – original draft, Writing – review & editing.
The author(s) declare that financial support was received for the research and/or publication of this article. This research was funded by the University of Ottawa and the Environmental Change One Health Observatory (ECO2) project, Agriculture and Agri-Food Canada (J-002305).
We thank Tori Miller and Jennifer Lafave for help with field sampling and lab work. We also thank Mark Sunohara, Emilia Craiovan, and Amanda Halstead for help with site selection and field logistics. We would like to thank Lisa Koziol for her assistance with Illumina sequencing, and Brent Seuradge for assisting with the soil physicochemical analyses. Finally, we would also like to thank Joe Bennett and Heather Kharouba for their guidance and insight into this study. For all sites sampled in this study, permission was granted from the land owners, as part of the larger ECO2 project.
The authors declare that the research was conducted in the absence of any commercial or financial relationships that could be construed as a potential conflict of interest.
All claims expressed in this article are solely those of the authors and do not necessarily represent those of their affiliated organizations, or those of the publisher, the editors and the reviewers. Any product that may be evaluated in this article, or claim that may be made by its manufacturer, is not guaranteed or endorsed by the publisher.
The Supplementary material for this article can be found online at: https://www.frontiersin.org/articles/10.3389/fsufs.2025.1443215/full#supplementary-material
Anderson, M. J. (2017). “Permutational multivariate analysis of variance (PERMANOVA)” in Wiley StatsRef: Statistics Reference Online. John Wiley & Sons, Ltd. 1–15. doi: 10.1002/9781118445112.stat07841
Andújar, C., Arribas, P., López, H., Arjona, Y., Pérez-Delgado, A., Oromí, P., et al. (2022). Community assembly and metaphylogeography of soil biodiversity: insights from haplotype-level community DNA metabarcoding within an oceanic island. Mol. Ecol. 31, 4078–4094. doi: 10.1111/mec.16560
Arribas, P., Andújar, C., Hopkins, K., Shepherd, M., and Vogler, A. P. (2016). Metabarcoding and mitochondrial metagenomics of endogean arthropods to unveil the mesofauna of the soil. Methods Ecol. Evol. 7, 1071–1081. doi: 10.1111/2041-210X.12557
Arribas, P., Andujar, C., Salces-Castellano, A., Emerson, B. C., and Vogler, A. P. (2020). The limited spatial scale of dispersal in soil arthropods revealed with whole-community haplotype-level metabarcoding. Mol. Ecol. 30, 48–61. doi: 10.1111/mec.15591
Arroyo, J., Keith, A. M., Schmidt, O., and Bolger, T. (2013). Mite abundance and richness in an Irish survey of soil biodiversity with comments on some newly recorded species. Irish Nat. J. 33, 19–27.
Bacci, T., Trabucco, B., Marzialetti, S., Marusso, V., Lomiri, S., Vani, D., et al. (2009). Taxonomic sufficiency in two case studies: where does it work better? Mar. Ecol. 30, 13–19. doi: 10.1111/j.1439-0485.2009.00324.x
Barrios, E. (2007). Soil biota, ecosystem services and land productivity. Ecol. Econ. 64, 269–285. doi: 10.1016/j.ecolecon.2007.03.004
Basset, Y., Hajibabaei, M., Wright, M. T., Castillo, A. M., Donoso, D. A., Segar, S. T., et al. (2022). Comparison of traditional and DNA metabarcoding samples for monitoring tropical soil arthropods (Formicidae, Collembola and Isoptera). Sci. Rep. 12:10762. doi: 10.1038/s41598-022-14915-2
Bates, D., Mächler, M., Bolker, B., and Walker, S. (2015). Fitting linear mixed-effects models using lme4. J. Stat. Softw. 67, 1–48. doi: 10.18637/jss.v067.i01
Baumann, J. (2021). Patterns of intraspecific morphological variability in soil mites reflect their dispersal ability. Exp. App. Acarol. 83, 241–255. doi: 10.1007/s10493-020-00587-y
Beaulieu, F., Knee, W., Nowell, V., Schwarzfeld, M., Lindo, Z., Behan-Pelletier, V. M., et al. (2019). Acari of Canada. ZooKeys 819, 77–168. doi: 10.3897/zookeys.819.28307
Beck, H. E., Zimmerman, N. E., McVicar, T. R., Vergopolan, N., Berg, A., and Wood, E. F. (2018). Present and future Köppen-Geiger climate classification maps at 1-km resolution. Sci. Data 5:180214. doi: 10.1038/sdata.2018.214
Behan-Pelletier, V. M. (2003). Acari and Collembola biodiversity in Canadian agricultural soils. Can. J. Soil Sci. 83, 279–288. doi: 10.4141/S01-063
Behan-Pelletier, V. M., and Kanashiro, D. (2010). Acari in grassland soils of Canada. Arthropods Canad. Grasslands 1, 137–166. doi: 10.3752/9780968932148.ch7
Bennewicz, J., and Barczak, T. (2020). Ground beetles (Carabidae) of field margin habitats. Biologia 75, 1631–1641. doi: 10.2478/s11756-020-00424-y
Berg, N. W., and Pawluk, S. (1984). Soil mesofauna studies under different vegetative regimes in north Central Alberta. Can. J. Soil Sci. 64, 209–223. doi: 10.4141/cjss84-022
Bilde, T., Axelsen, J. A., and Toft, S. (2000). The value of Collembola from agricultural soils as food for a generalist predator. J. Appl. Ecol. 37, 672–683. doi: 10.1046/j.1365-2664.2000.00527.x
Brandon-Mong, G. J., Gan, H. M., Sing, K. W., Lee, P. S., Lim, P. E., and Wilson, J. J. (2015). DNA metabarcoding of insects and allies: an evaluation of primers and pipelines. B. Entomol. Res. 105, 717–727. doi: 10.1017/S0007485315000681
Brooks, M. E., Kristensen, K., van Benthem, K. J., Magnusson, A., Berg, C. W., Nielsen, A., et al. (2017). glmmTMB balances speed and flexibility among packages for zero-inflated generalized linear mixed modeling. R J. 9, 378–400. doi: 10.32614/RJ-2017-066
Buchkowski, R. W., and Lindo, Z. (2020). Stoichiometric and structural uncertainty in soil food web models. Funct. Ecol. 35, 288–300. doi: 10.1111/1365-2435.13706
Buchner, D., and Leese, F. (2020). BOLDigger – a Python package to identify and organise sequences with the barcode of life data systems. Metabarcod. Metagenom. 4:e53535. doi: 10.3897/mbmg.4.53535
Caoduro, G., Battiston, R., Giachino, P. M., Guidolin, L., and Lazzarin, G. (2014). Biodiversity indices for the assessment of air, water and soil quality of the “biodiversity friend” certification in temperate areas. Biod. J. 5, 69–86.
Carew, M. E., and Hoffmann, A. A. (2015). Delineating closely related species with DNA barcodes for routine biological monitoring. Freshw. Biol. 60, 1545–1560. doi: 10.1111/fwb.12587
Carmona, G. I., Delserone, L. M., Campos, J. N. D., Ferreira de Almeida, T., Ozório, D. V. B., Cardona, J. D. B., et al. (2021). Does cover crop management affect arthropods in the subsequent corn and soybean crops in the United States? A systematic review. Ann. Entomol. Soc. Am. 114, 151–162. doi: 10.1093/aesa/saaa049
Carter, M. R., and Noronha, C. (2007). Soil micro-arthropod communities and microbial parameters in the potato ridge under two field management systems on sandy loams in Atlantic Canada. Can. J. Soil Sci. 87, 399–404. doi: 10.4141/CJSS06013
Carter, M. R., Peters, R. D., Noronha, C., and Kimpinski, J. (2009). Influence of 10 years of conservation tillage on some biological properties of a fine sandy loam in the potato phase of two crop rotations in Atlantic Canada. Can. J. Soil Sci. 89, 391–402. doi: 10.4141/cjss08054
Clark, R. G., Boutin, C., Jobin, B., Forsyth, D. J., Shutler, D., Leeson, J. Y., et al. (2006). Living on the edge: field boundary habitats, biodiversity and agriculture. Top. Can. Weed Sci. 1, 113–134.
Clarke, K. R. (1993). Non-parametric multivariate analyses of changes in community structure. Aust. J. Ecol. 18, 117–143. doi: 10.1111/j.1442-9993.1993.tb00438.x
Coissac, E., Riaz, T., and Puillandre, N. (2012). Bioinformatic challenges for DNA metabarcoding of plants and animals. Mol. Ecol. 21, 1834–1847. doi: 10.1111/j.1365-294X.2012.05550.x
Coulibaly, S. F., Winck, B. R., Akpa-Vinceslas, M., Mignot, L., Legras, M., Forey, E., et al. (2019). Functional assemblages of Collembola determine soil microbial communities and associated functions. Front. Env. Sci. 7:52. doi: 10.3389/fenvs.2019.00052
de Graaff, M. A., Hornslein, N., Throop, H. L., Kardol, P., and van Diepen, L. T. (2019). Effects of agricultural intensification on soil biodiversity and implications for ecosystem functioning: a meta-analysis. Adv. Agron. 155, 1–44. doi: 10.1016/bs.agron.2019.01.001
de Zwaan, D. R., Hannah, K. C., Alavi, N., Mitchell, G. W., Lapen, D. R., Duffe, J., et al. (2024). Local and regional-scale effects of hedgerows on grassland-and forest-associated bird populations within agroecosystems. Ecol. Appl. 34:e2959. doi: 10.1002/eap.2959
Deckmyn, G., Flores, O., Mayer, M., Domene, X., Schnepf, A., Kuka, K., et al. (2020). KEYLINK: towards a more integrative soil representation for inclusion in ecosystem scale models. I. review and model concept. PeerJ 8:e9750. doi: 10.7717/peerj.9750
Decocq, G., Andrieu, E., Brunet, J., Chabrerie, O., De Frenne, P., De Smedt, P., et al. (2016). Ecosystem services from small forest patches in agricultural landscapes. Curr. For. Rep. 2, 30–44. doi: 10.1007/s40725-016-0028-x
Deiner, K., Bik, H. M., Mächler, E., Seymour, M., Lacoursière-Roussel, A., Altermatt, F., et al. (2017). Environmental DNA metabarcoding: transforming how we survey animal and plant communities. Mol. Ecol. 26, 5872–5895. doi: 10.1111/mec.14350
Edgar, R. C. (2010). Search and clustering orders of magnitude faster than BLAST. Bioinformatics 26, 2460–2461. doi: 10.1093/bioinformatics/btq461
Eitzinger, B., Micic, A., Körner, M., Traugott, M., and Scheu, S. (2013). Unveiling soil food web links: new PCR assays for detection of prey DNA in the gut of soil arthropod predators. Soil Biol. Biochem. 57, 943–945. doi: 10.1016/j.soilbio.2012.09.001
Elbrecht, V. (2018). JAMP: just another metabarcoding pipeline. R Package Version 0.67. Available at: https://github.com/VascoElbrecht/JAMP (Accessed June 23, 2023).
Elbrecht, V., and Leese, F. (2015). Can DNA-based ecosystem assessments quantify species abundance? Testing primer bias and biomass—sequence relationships with an innovative metabarcoding protocol. PLoS One 10:e0130324. doi: 10.1371/journal.pone.0130324
Elias, M., Hill, R. I., Willmott, K. R., Dasmahapatra, K. K., Brower, A. V., Mallet, J., et al. (2007). Limited performance of DNA barcoding in a diverse community of tropical butterflies. Proc. R. Soc. B 274, 2881–2889. doi: 10.1098/rspb.2007.1035
Evans, J. D. (1996). Straightforward statistics for the behavioral sciences. Pacific Grove, California: Brooks/Cole Publishing.
FAO (2022). Framework for action on biodiversity for food and agriculture. Rome: FAO Commission on Genetic Resources for Food and Agriculture.
FAO, ITPS, GSBI, CBD, EC (2020). State of knowledge of soil biodiversity - status, challenges and potentialities, report 2020. Rome, FAO: Food and Agriculture Organization.
Ferguson, S. H. (2001). Changes in trophic abundance of soil arthropods along a grass-shrub-forest gradient. Can. J. Zool. 79, 457–464. doi: 10.1139/z01-002
Ferguson, S. H., and Joly, D. O. (2002). Dynamics of springtail and mite populations: the role of density dependence, predation, and weather. Ecol. Entomol. 27, 565–573. doi: 10.1046/j.1365-2311.2002.00441.x
Gao, M., He, P., Zhang, X., Liu, D., and Wu, D. (2014). Relative roles of spatial factors, environmental filtering and biotic interactions in fine-scale structuring of a soil mite community. Soil Biol. Biochem. 79, 68–77. doi: 10.1016/j.soilbio.2014.09.003
Gardi, C., Jeffery, S., and Saltelli, A. (2013). An estimate of potential threats levels to soil biodiversity in EU. Glob. Change Biol. 19, 1538–1548. doi: 10.1111/gcb.12159
Geisen, S., Wall, D. H., and van der Putten, W. H. (2019). Challenges and opportunities for soil biodiversity in the anthropocene. Curr. Biol. 29, R1036–R1044. doi: 10.1016/j.cub.2019.08.007
George, P. B., Keith, A. M., Creer, S., Barrett, G. L., Lebron, I., Emmett, B. A., et al. (2017). Evaluation of mesofauna communities as soil quality indicators in a national-level monitoring programme. Soil Biol. Biochem. 115, 537–546. doi: 10.1016/j.soilbio.2017.09.022
Gongalsky, K. B. (2021). Soil macrofauna: study problems and perspectives. Soil Biol. Biochem. 159:108281. doi: 10.1016/j.soilbio.2021.108281
Guerra, C. A., Bardgett, R. D., Caon, L., Crowther, T. W., Delgado-Baquerizo, M., Montanarella, L., et al. (2021). Tracking, targeting, and conserving soil biodiversity. Science 371, 239–241. doi: 10.1126/science.abd7926
Guo, G., Lapen, D. R., Khan, I. U., Sunohara, M., Craiovan, E., and Chen, W. (2024). Examining the impact of agricultural drainage ditch management on in-stream bacterial communities involved in nitrogen cycling: insights from the environmental change one health observatory (ECO2). Front. Sustain. Food Syst. 8:1329422. doi: 10.3389/fsufs.2024.1329422
Haan, N. L., Iuliano, B. G., Gratton, C., and Landis, D. A. (2021). Designing agricultural landscapes for arthropod-based ecosystem services in North America. Adv. Ecol. Res. 64, 191–250. doi: 10.1016/bs.aecr.2021.01.003
Hansen, R. A. (2000). Effects of habitat complexity and composition on a diverse litter microarthropod assemblage. Ecology 81, 1120–1132. doi: 10.1890/0012-9658(2000)081[1120:EOHCAC]2.0.CO;2
Hartig, F. (2024). DHARMa: residual diagnostics for hierarchical (multi-level/mixed) regression models. R package version 0.4.7. Available at: https://github.com/florianhartig/dharma (Accessed January 7, 2025).
Hebert, P. D., Ratnasingham, S., and De Waard, J. R. (2003). Barcoding animal life: cytochrome c oxidase subunit 1 divergences among closely related species. P. Roy. Soc. Lond. B. Bio. 270 Suppl 1, S96–S99. doi: 10.1098/rsbl.2003.0025
Hendrickx, F., Maelfait, J. P., Van Wingerden, W., Schweiger, O., Speelmans, M., Aviron, S., et al. (2007). How landscape structure, land-use intensity and habitat diversity affect components of total arthropod diversity in agricultural landscapes. J. Appl. Ecol. 44, 340–351. doi: 10.1111/j.1365-2664.2006.01270.x
Heydari, M., Eslaminejad, P., Kakhki, F. V., Mirab-balou, M., Omidipour, R., Prévosto, B., et al. (2020). Soil quality and mesofauna diversity relationship are modulated by woody species and seasonality in semiarid oak forest. Forest Ecol. Manag. 473:118332. doi: 10.1016/j.foreco.2020.118332
Hoage, J. F. J. (2018). Metabarcoding soil microarthropods for soil quality assessment: Importance of integrated taxonomy, phylogenetic marker selection and sampling design. [Doctoral dissertation]. Sudbury (ON): Laurentian University.
Hu, X., Næss, J. S., Iordan, C. M., Huang, B., Zhao, W., and Cherubini, F. (2021). Recent global land cover dynamics and implications for soil erosion and carbon losses from deforestation. Anthropocene 34:100291. doi: 10.1016/j.ancene.2021.100291
Hulsen, T. (2021). BioVenn: create area-proportional Venn diagrams from biological lists. R Package Version 1.1.3. Available at: https://cran.r-project.org/package=BioVenn. (Accessed August 15, 2023).
Ji, Y., Ashton, L., Pedley, S. M., Edwards, D. P., Tang, Y., Nakamura, A., et al. (2013). Reliable, verifiable and efficient monitoring of biodiversity via metabarcoding. Ecol. Lett. 16, 1245–1257. doi: 10.1111/ele.12162
Kaczmarek, S., Faleńczyk-Koziróg, K., and Marquardt, T. (2011). Abundance dynamics of mites (Acari) in the peatland of ‘Linie’ nature reserve, with particular reference to the Gamasida. Biol. Lett. 48, 159–166. doi: 10.2478/v10120-011-0014-8
Kaila, L., and Ståhls, G. (2006). DNA barcodes: evaluating the potential of COI to diffentiate closely related species of Elachista (Lepidoptera: Gelechioidea: Elachistidae) from Australia. Zootaxa 1170, 1–26. doi: 10.11646/zootaxa.1170.1.1
Keck, F., Couton, M., and Altermatt, F. (2023). Navigating the seven challenges of taxonomic reference databases in metabarcoding analyses. Mol. Ecol. Resour. 23, 742–755. doi: 10.1111/1755-0998.13746
Kestel, J. H., Field, D. L., Bateman, P. W., White, N. E., Allentoft, M. E., Hopkins, A. J. M., et al. (2022). Applications of environmental DNA (eDNA) in agricultural systems: current uses, limitations and future prospects. Sci. Total Environ. 847:157556. doi: 10.1016/j.scitotenv.2022.157556
Knapp, M., van Houten, Y., van Baal, E., and Groot, T. (2018). Use of predatory mites in commercial biocontrol: current status and future prospects. Acarologia 58, 72–82. doi: 10.24349/acarologia/20184275
Koehler, H. H. (1999). Predatory mites (Gamasina, Mesostigmata). Agric. Ecosyst. Environ. 74, 395–410. doi: 10.1016/S0167-8809(99)00045-6
Kokořovǎ, P., and Starý, J. (2017). Communities of oribatid mites (Acari: Oribatida) of naturally regenerating and salvage-logged montane spruce forests of Šumava mountains. Biologia 72, 445–451. doi: 10.1515/biolog-2017-0050
Krehenwinkel, H., Graze, M., Rödder, D., Tanaka, K., Baba, Y. G., Muster, C., et al. (2016). A phylogeographical survey of a highly dispersive spider reveals eastern Asia as a major glacial refugium for Palaearctic fauna. J. Biogeogr. 43, 1583–1594. doi: 10.1111/jbi.12742
Kuznetsova, N. A. (2006). Long-term dynamics of Collembola in two contrasting ecosystems. Pedobiologia 50, 157–164. doi: 10.1016/j.pedobi.2005.12.004
Kuznetsova, A., Brockhoff, P. B., and Christensen, R. H. B. (2017). lmerTest package: tests in linear mixed effects models. J. Stat. Softw. 82, 1–26. doi: 10.18637/jss.v082.i13
Lavelle, P., Decaëns, T., Aubert, M., Barot, S., Blouin, M., Bureau, F., et al. (2006). Soil invertebrates and ecosystem services. Eur. J. Soil Biol. 42, S3–S15. doi: 10.1016/j.ejsobi.2006.10.002
Lehmitz, R., Russell, D., Hohberg, K., Christian, A., and Xylander, W. E. (2012). Active dispersal of oribatid mites into young soils. Appl. Soil Ecol. 55, 10–19. doi: 10.1016/j.apsoil.2011.12.003
Lenth, R. (2025). Emmeans: estimated marginal means, aka least-squares means. R package version 1.10.6–090003. Available at: https://rvlenth.github.io/emmeans/ (Accessed January 7, 2025).
Lukic, D., Eberle, J., Thormann, J., Holzschuh, C., and Ahrens, D. (2021). Excluding spatial sampling bias does not eliminate oversplitting in DNA-based species delimitation analyses. Ecol. Evol. 11, 10327–10337. doi: 10.1002/ece3.7836
Lumley, L., Beaulieu, F., Behan-Pelletier, V., Knee, W., Lindquist, E. E., Mark, M., et al. (2013). The status of systematic knowledge of the Acari of Canada: tickin’ away with some mitey progress. Newslett. Biol. Surv. Canada 32, 23–37.
Lupardus, R. C., Battigelli, J. P., Janz, A., and Lumley, L. M. (2021). Can soil invertebrates indicate soil biological quality on well pads reclaimed back to cultivated lands? Soil Tillage Res. 213:105082. doi: 10.1016/j.still.2021.105082
Marais, Z. E., Baker, T. P., Hunt, M. A., and Mendham, D. (2022). Shelterbelt species composition and age determine structure: consequences for ecosystem services. Agric. Ecosyst. Environ. 329:107884. doi: 10.1016/j.agee.2022.107884
Maraun, M., and Scheu, S. (2000). The structure of oribatid mite communities (Acari, Oribatida): patterns, mechanisms and implications for future research. Ecography 23, 374–382. doi: 10.1111/j.1600-0587.2000.tb00294.x
Martin, M. (2011). Cutadapt removes adapter sequences from high-throughput sequencing reads. EMBnet 17, 10–12. doi: 10.14806/ej.17.1.200
Martinez Arbizu, P. (2020). pairwiseAdonis: pairwise multilevel comparison using adonis. R package version 0.4. Available at: https://github.com/pmartinezarbizu/pairwiseAdonis (Accessed August 15, 2023).
Maurya, S., Abraham, J. S., Somasundaram, S., Toteja, R., Gupta, R., and Makhija, S. (2020). Indicators for assessment of soil quality: a mini-review. Environ. Monit. Assess. 192, 1–22. doi: 10.1007/s10661-020-08556-z
McMurtry, J. A., Sourassou, N. F., and Demite, P. R. (2015). “The phytoseiidae (Acari: Mesostigmata) as biological control agents,” in Prospects for biological control of plant feeding mites and other harmful organisms. Progress in biological control. Vol 19. eds. D. Carrillo, G. de Moraes, and J. Peña (Cham: Springer).
Meehan, M. L., Song, Z., Lumley, L. M., Cobb, T. P., and Proctor, H. (2019). Soil mites as bioindicators of disturbance in the boreal forest in northern Alberta, Canada: testing taxonomic sufficiency at multiple taxonomic levels. Ecol. Indic. 102, 349–365. doi: 10.1016/j.ecolind.2019.02.043
Meier, R., Shiyang, K., Vaidya, G., and Ng, P. K. (2006). DNA barcoding and taxonomy in Diptera: a tale of high intraspecific variability and low identification success. Syst. Biol. 55, 715–728. doi: 10.1080/10635150600969864
Menta, C., Conti, F. D., Pinto, S., and Bodini, A. (2018). Soil biological quality index (QBS-ar): 15 years of application at global scale. Ecol. Indic. 85, 773–780. doi: 10.1016/j.ecolind.2017.11.030
Mesman, J. (2016). Forest cover and trends analysis report, South Nation Conservation. Available at: https://www.nation.on.ca/sites/default/files/2016%20Forest%20Cover%20and%20Trends%20Analysis%20-%20September%2026.pdf (Accessed May 31, 2024).
Miller, J. J., Battigelli, J. P., Beasley, B., and Drury, C. F. (2017). Response of soil mesofauna to long-term application of feedlot manure on irrigated cropland. J. Environ. Qual. 46, 185–192. doi: 10.2134/jeq2016.08.0318
Miller, J. J., Battigelli, J. P., and Willms, W. D. (2014). Grazing protection influences soil mesofauna in ungrazed and grazed riparian and upland pastures. Rangel. Ecol. Manag. 67, 429–434. doi: 10.2111/REM-D-14-00004.1
Mishra, A., and Singh, D. (2020). “Role of soil fauna: En route to ecosystem services and its effect on soil health” in Phytobiomes: current insights and future vistas (Singapore: Springer), 105–126.
Montgomery, I., Caruso, T., and Reid, N. (2020). Hedgerows as ecosystems: service delivery, management, and restoration. Annu. Rev. Ecol. Evol. S. 51, 81–102. doi: 10.1146/annurev-ecolsys-012120-100346
Morris, A. J., Bailey, C. M., Dillon, I. A., Gruar, D. J., and Westbury, D. B. (2010). Improving floristically enhanced field margins for wildlife. Asp. Appl. Biol. 100, 353–357.
Müller, P., Neuhoff, D., Nabel, M., Schiffers, K., and Döring, T. F. (2022). Tillage effects on ground beetles in temperate climates: a review. Agron. Sustain. Dev. 42:65. doi: 10.1007/s13593-022-00803-6
Noteboom, M., Seidou, O., and Lapen, D. R. (2021). Predicting water quality trends resulting from forest cover change in an agriculturally dominated river basin in eastern Ontario, Canada. Water Qual. Res. J. Can. 56, 218–238. doi: 10.2166/wqrj.2021.010
Oksanen, J., Blanchet, F.G., Kindt, R., Legendre, P., Minchin, P.R., O’Hara, R.B., et al. (2015). Vegan: community ecology package. R Package Version 2.3. Available at: https://github.com/vegandevs/vegan (Accessed July 29, 2023).
Oliverio, A. M., Gan, H., Wickings, K., and Fierer, N. (2018). A DNA metabarcoding approach to characterize soil arthropod communities. Soil Biol. Biochem. 125, 37–43. doi: 10.1016/j.soilbio.2018.06.026
Ontario Data Catalogue. (2024). Ontario business, agri-food, and farm data profiles: East - Prescott and Russell. Available at: https://data.ontario.ca/dataset/ontario-farm-data-by-county/resource/2119d93b-127a-415e-890d-16de6f48725f (Accessed October 15, 2024).
Osler, G. H. R., Harrison, L., Kanashiro, D. K., and Clapperton, M. J. (2008). Soil microarthropod assemblages under arable crop rotations in Alberta, Canada. Appl. Soil Ecol. 38, 71–78. doi: 10.1016/j.apsoil.2007.09.003
Ouellet, G., Lapen, D. R., Topp, E., Sawada, M., and Edwards, M. (2008). A heuristic model to predict earthworm biomass in agroecosystems based on selected management and soil properties. Appl. Soil Ecol. 39, 35–45. doi: 10.1016/j.apsoil.2007.11.003
Parisi, V., Menta, C., Gardi, C., Jacomini, C., and Mozzanica, E. (2005). Microarthropod communities as a tool to assess soil quality and biodiversity: a new approach in Italy. Agric. Ecosyst. Environ. 105, 323–333. doi: 10.1016/j.agee.2004.02.002
Payne, E. H., Gebregziabher, M., Hardin, J. W., Ramakrishnan, V., and Egede, L. E. (2018). An empirical approach to determine a threshold for assessing overdispersion in Poisson and negative binomial models for count data. Commun. Stat. Simul. Comput. 47, 1722–1738. doi: 10.1080/03610918.2017.1323223
Pendrill, F., Gardner, T. A., Meyfroidt, P., Persson, U. M., Adams, J., Azevedo, T., et al. (2022). Disentangling the numbers behind agriculture-driven tropical deforestation. Science 377:eabm9267. doi: 10.1126/science.abm9267
Postma-Blaauw, M. B., De Goede, R. G., Bloem, J., Faber, J. H., and Brussaard, L. (2012). Agricultural intensification and de-intensification differentially affect taxonomic diversity of predatory mites, earthworms, enchytraeids, nematodes and bacteria. Appl. Soil Ecol. 57, 39–49. doi: 10.1016/j.apsoil.2012.02.011
Potapov, A. M., Beaulieu, F., Birkhofer, K., Bluhm, S. L., Degtyarev, M. I., Devetter, M., et al. (2022). Feeding habits and multifunctional classification of soil-associated consumers from protists to vertebrates. Biol. Rev. 97, 1057–1117. doi: 10.1111/brv.12832
Prăvălie, R., Patriche, C., Borrelli, P., Panagos, P., Roșca, B., Dumitraşcu, M., et al. (2021). Arable lands under the pressure of multiple land degradation processes. A global perspective. Environ. Res. 194:110697. doi: 10.1016/j.envres.2020.110697
R Core Team (2023). R: a language and environment for statistical computing. Vienna, Austria: R Foundation for Statistical Computing.
Rantalainen, M. L., Fritze, H., Haimi, J., Pennanen, T., and Setälä, H. (2005). Colonisation of newly established habitats by soil decomposer organisms: the effect of habitat corridors in relation to colonisation distance and habitat size. Appl. Soil Ecol. 28, 67–77. doi: 10.1016/j.apsoil.2004.06.004
Ratnasingham, S., and Hebert, P. D. N. (2007). BOLD: the barcode of life data system (http://www.barcodinglife.org). Mol. Ecol. Notes 7:355-364. doi: 10.1111/j.1471-8286.2007.01678.x
Recuero, E., Etzler, F. E., and Caterino, M. S. (2023). Most soil and litter arthropods are unidentifiable based on current DNA barcode reference libraries. Curr. Zool. 70, 637–646. doi: 10.1093/cz/zoad051
Reeleder, R. D., Miller, J. J., Ball Coelho, B. R., and Roy, R. C. (2006). Impacts of tillage, cover crop, and nitrogen on populations of earthworms, microarthropods, and soil fungi in a cultivated fragile soil. Appl. Soil Ecol. 33, 243–257. doi: 10.1016/j.apsoil.2005.10.006
Remelli, S., Ghobari, H., and Oliveira Filho, L. C. I. (2024). Editorial: the role of soil mesofauna as indicators of sustainable ecosystem management plans. Front. Ecol. Evol. 12:1400232. doi: 10.3389/fevo.2024.1400232
Rempel, J. C., Kulshreshtha, S. N., Amichev, B. Y., and Van Rees, K. C. J. (2017). Costs and benefits of shelterbelts: a review of producers’ perceptions and mind map analyses for Saskatchewan, Canada. Can. J. Soil Sci. 97, 341–352. doi: 10.1139/cjss-2016-0100
Rochefort, S., Therrian, F., Shetlar, D. J., and Brodeur, J. (2006). Species diversity and seasonal abundance of Collembola in turfgrass ecosystems of North America. Pedobiologia 50, 61–68. doi: 10.1016/j.pedobi.2005.10.007
Rognes, T., Flouri, T., Nichols, B., Quince, C., and Mahé, F. (2016). VSEARCH: a versatile open source tool for metagenomics. PeerJ 4:e2584. doi: 10.7717/peerj.2584
Ruf, A., and Beck, L. (2005). The use of predatory soil mites in ecological soil classification and assessment concepts, with perspectives for oribatid mites. Ecotox. Environ. Safety 62, 290–299. doi: 10.1016/j.ecoenv.2005.03.029
Rusch, A., Valantin-Morison, M., Sarthou, J. P., and Roger-Estrade, J. (2010). Biological control of insect pests in agroecosystems: effects of crop management, farming systems, and seminatural habitats at the landscape scale: a review. Adv. Agron. 109, 219–259. doi: 10.1016/B978-0-12-385040-9.00006-2
Saitoh, S., Aoyama, H., Fujii, S., Sunagawa, H., Nagahama, H., Akutsu, M., et al. (2016). A quantitative protocol for DNA metabarcoding of springtails (Collembola). Genome 59, 705–723. doi: 10.1139/gen-2015-0228
Schenk, J., Kleinbölting, N., and Traunspurger, W. (2020). Comparison of morphological, DNA barcoding, and metabarcoding characterizations of freshwater nematode communities. Ecol. Evol. 10, 2885–2899. doi: 10.1002/ece3.6104
Schirmel, J., Thiele, J., Entling, M. H., and Buchholz, S. (2016). Trait composition and functional diversity of spiders and carabids in linear landscape elements. Agric. Ecosyst. Environ. 235, 318–328. doi: 10.1016/j.agee.2016.10.028
Schneider, K., and Maraun, M. (2009). Top-down control of soil microarthropods–evidence from a laboratory experiment. Soil Biol. Biochem. 41, 170–175. doi: 10.1016/j.soilbio.2008.10.013
Song, H., Buhay, J. E., Whiting, M. F., and Crandall, K. A. (2008). Many species in one: DNA barcoding overestimates the number of species when nuclear mitochondrial pseudogenes are coamplified. Proc. Natl. Acad. Sci. 105, 13486–13491. doi: 10.1073/pnas.0803076105
Szigeti, N., Berki, I., Vityi, A., and Winkler, D. (2022). Soil mesofauna and herbaceous vegetation patterns in an agroforestry landscape. Agrofor. Syst. 96, 773–786. doi: 10.1007/s10457-022-00739-6
Thakur, M. P., Phillips, H. R., Brose, U., De Vries, F. T., Lavelle, P., Loreau, M., et al. (2020). Towards an integrative understanding of soil biodiversity. Biol. Rev. 95, 350–364. doi: 10.1111/brv.12567
Tibbett, M., Fraser, T. D., and Duddigan, S. (2020). Identifying potential threats to soil biodiversity. PeerJ 8:e9271. doi: 10.7717/peerj.9271
Tomlin, A. D., and Miller, J. J. (1987). Composition of the soil fauna in forested and grassy plots at Delhi, Ontario. Can. J. Zool. 65, 3048–3055. doi: 10.1139/z87-462
Turnbull, M. S., and Stebaeva, S. (2019). Collembola of Canada. ZooKeys 819, 187–195. doi: 10.3897/zookeys.819.23653
Udawatta, R. P., Rankoth, L. M., and Jose, S. (2019). Agroforestry and biodiversity. Sustainability 11:2879. doi: 10.3390/su11102879
van Capelle, C., Schrader, S., and Brunotte, J. (2012). Tillage-induced changes in the functional diversity of soil biota–a review with a focus on German data. Eur. J. Soil Biol. 50, 165–181. doi: 10.1016/j.ejsobi.2012.02.005
van der Heyde, M., Bunce, M., and Nevill, P. (2022). Key factors to consider in the use of environmental DNA metabarcoding to monitor terrestrial ecological restoration. Sci. Total Environ. 848:157617. doi: 10.1016/j.scitotenv.2022.157617
Vanbergen, A. J., Watt, A. D., Mitchell, R., Truscott, A. M., Palmer, S. C., Ivits, E., et al. (2007). Scale-specific correlations between habitat heterogeneity and soil fauna diversity along a landscape structure gradient. Oecologia 153, 713–725. doi: 10.1007/s00442-007-0766-3
Vereecken, H., Schnepf, A., Hopmans, J. W., Javaux, M., Or, D., Roose, T., et al. (2016). Modeling soil processes: review, key challenges, and new perspectives. Vadose Zone J. 15:1. doi: 10.2136/vzj2015.09.0131
Virgilio, M., Backeljau, T., Nevado, B., and De Meyer, M. (2010). Comparative performances of DNA barcoding across insect orders. BMC Bioinformatics 11, 1–10. doi: 10.1186/1471-2105-11-206
Vogel, H. J., Eberhardt, E., Franko, U., Lang, B., Ließ, M., Weller, U., et al. (2019). Quantitative evaluation of soil functions: potential and state. Front. Environ. Sci. 7:463905. doi: 10.3389/fenvs.2019.00164
Walter, D. E., Latonas, S., Byers, K., and Lumley, L. (2014). Almanac of Alberta Oribatida part I. Ver. 2.4, vol. 542. Edmonton: Royal Alberta Museum.
Walter, D. E., and Lumley, L. M. (2021). Almanac of Alberta Acari part II, version 3.0. Edmonton, AB, Canada.
Wilson, J. J., Sing, K. W., Floyd, R. M., and Hebert, P. D. (2017). “DNA barcodes and insect biodiversity,” in Insect biodiversity: science and society, Volume I, Second Edition. eds. R. G. Foottit and P. H. Adler (John Wiley & Sons), Chapter 17, pp. 575–592.
Yang, C., Wang, X., Miller, J. A., de Blécourt, M., Ji, Y., Yang, C., et al. (2014). Using metabarcoding to ask if easily collected soil and leaf-litter samples can be used as a general biodiversity indicator. Ecol. Indic. 46, 379–389. doi: 10.1016/j.ecolind.2014.06.028
Young, M. R., and Hebert, P. D. (2022). Unearthing soil arthropod diversity through DNA metabarcoding. PeerJ 10:e12845. doi: 10.7717/peerj.12845
Keywords: Acari, agricultural landscape, Collembola, metabarcoding, soil biodiversity
Citation: Sahdra A, Young MR, Phillips LA, Alavi N, Lapen DR, Kerr JT and Schwarzfeld MD (2025) Exploring the influence of natural features on soil mesofaunal communities in agricultural landscapes through DNA metabarcoding. Front. Sustain. Food Syst. 9:1443215. doi: 10.3389/fsufs.2025.1443215
Edited by:
Zhou Li, Guizhou University, ChinaReviewed by:
Mauricio Gonzalez-Chang, Austral University of Chile, ChileCopyright © 2025 Niloofar Alavi, Jeremy T. Kerr, and His Majesty the King in Right of Canada, as represented by the Minister of Agriculture and Agri-Food Canada for the contribution of Angeli Sahdra, Monica R. Young, Lori A. Phillips, David R. Lapen and Marla D. Schwarzfeld. This is an open-access article distributed under the terms of the Creative Commons Attribution License (CC BY). The use, distribution or reproduction in other forums is permitted, provided the original author(s) and the copyright owner(s) are credited and that the original publication in this journal is cited, in accordance with accepted academic practice. No use, distribution or reproduction is permitted which does not comply with these terms.
*Correspondence: Angeli Sahdra, YW5nZWxpc2FoZHJhQGhvdG1haWwuY29t
†Present address: Angeli Sahdra, Department of Chemistry and Biology, Toronto Metropolitan University, Toronto, ON, Canada
Disclaimer: All claims expressed in this article are solely those of the authors and do not necessarily represent those of their affiliated organizations, or those of the publisher, the editors and the reviewers. Any product that may be evaluated in this article or claim that may be made by its manufacturer is not guaranteed or endorsed by the publisher.
Research integrity at Frontiers
Learn more about the work of our research integrity team to safeguard the quality of each article we publish.