- 1BioTeC+, Chemical & Biochemical Process Technology & Control, KU Leuven, Ghent, Belgium
- 2Department of Food Sciences and Nutrition, University of Malta, Msida, Malta
- 3Department of Chemistry, National and Kapodistrian University of Athens, Athens, Greece
Transforming the food system while addressing climate change requires proactive measures based on quantitative projections of anticipated future conditions. A key component of the food system that must be considered during this transformation is food safety, which is the focus of this paper. Milk safety has been selected as a case study. Future milk contamination levels in Europe, in terms of total bacterial counts, are evaluated under various climate change scenarios. Projections from multiple climate models are integrated into a data-driven milk contamination model, validated using data from Malta, Spain, and Belgium. The modeling framework accounts for variability among dairy farms and the inherent uncertainties in climate projections. Results are presented through geographical heatmaps, highlighting coastal and southern areas such as Portugal, Western Spain, Southern Italy, and Western France as regions expected to face the highest bacterial counts. The analysis underlines the significant roles of humidity and wind speed, alongside temperature. It also examines compliance with the regulatory threshold for raw milk, revealing an increased frequency of summer weeks exceeding the threshold of 100,000 colony-forming units. Based on this analysis, regions are classified into low-risk, high-risk, and emerging-risk categories. This classification can guide the selection of farm strategies aimed at meeting future food safety standards. By informing these decisions with the anticipated impacts of climate change, the food system can be future-proofed.
1 Introduction
The food sector is significantly affected by climate change, with numerous studies highlighting the challenge of feeding a growing population (Mbow et al., 2022). Beyond food availability, ensuring food safety for human consumption is crucial. Increased food production to meet the demands of a growing population can lead to a rise in unsafe food consumption, posing a complex public health challenge (Rohr et al., 2019). Food safety is also under threat from climate change (Tirado et al., 2010). Climate-proofing the food sector means minimizing the likelihood of unsafe food by accounting for the effects of climate change on food safety hazards. This must be achieved through specifically designed mitigation strategies based on an objective quantification of expected climate shifts and their impacts.
In this paper, the focus is on bovine milk production. Milk and dairy products, with their high nutritional value, are a core element of our diets. They are recognized for promoting bone health and preventing fractures, primarily due to their high calcium content, and are included in the EAT-Lancet diet (Willett et al., 2019). The dairy sector also holds significant importance for Europe, as the EU is the largest global supplier of dairy products (European Commission, 2022).
The anticipated effects of climate change on milk production include reduced milk yield and quality, as well as increased susceptibility of bovine animals to microbial infections related to heat stress (North et al., 2023; Gauly et al., 2013). Milk contamination is also expected to rise as a result of climate change (Feliciano et al., 2020). Furthermore, the use of antibiotics to treat mastitis can exacerbate antimicrobial resistance (Al-harbi et al., 2021). While modeling studies predicting reduced milk production due to heat stress caused by climate change are well-established (Guzmán-Luna et al., 2022; Gunn et al., 2019; Fodor et al., 2018; Mauger et al., 2014), similar models for predicting milk contamination under climate change are lacking.
Milk safety is ensured at multiple stages of production. Milk from a healthy cow does not contain pathogenic bacteria (Sujata et al., 2022). Initial contamination occurs within the farm environment, with the primary sources of bacterial contamination being the udder surface, and secondarily, the milking equipment or the hands of the farmer, depending on the method of milking. Manure, bedding, and the farm environment are potential sources of udder contamination (Neculai-Valeanu and Ariton, 2022; Priyashantha et al., 2021a; Robles et al., 2020).
Total bacterial counts (TBC) of raw milk, also known as the standard plate count, are monitored in all dairy farms as they are an indicator of bacterial contamination and a regulatory standard in both the EU and the USA (Neculai-Valeanu and Ariton, 2022; Priyashantha et al., 2021b). According to Regulation (EC) No. 853/2004, the TBC of raw milk must be below 100,000 colony-forming units (CFU) per milliliter [or 5 log10(TBC)]. These regulations underscore the importance of controlling bacterial contamination at the farm level. Bacterial contamination is a critical determinant of milk quality and safety and exhibits seasonality, with higher counts in summer and lower counts in winter, making it directly influenced by climate change (Toghdory et al., 2022).
The impact modeling framework is a widely used methodology for quantifying future risks resulting from climate change (Wagener et al., 2022). This framework is essential for designing proactive mitigation and adaptation strategies to create a climate-resilient food system. While food security models are well-established, the impact modeling framework has been beneficial in several cases (Mbow et al., 2022; Janssens et al., 2020). However, there are a limited number of applications related to food safety (Katsini et al., 2021). For example, Battilani et al. (2016) and Van der Fels-Klerx et al. (2019) quantified aflatoxin contamination in maize and milk, respectively, and Ndraha and Hsiao (2019) assessed the risk of Vibrio parahaemolyticus in oysters under climate change. Additionally, Liu et al. (2015) presented an illustrative example of utilizing the impact modeling methodology to quantify Lactoplantibacillus plantarum levels under climate change.
This research quantifies future milk contamination levels (in terms of TBC) under anticipated climate change scenarios in Europe. These milk contamination levels are computed by integrating projections from multiple climate models into a milk contamination model, which is trained and validated using long-term, extensive data sets from farms in Malta, Spain, and Belgium. To the authors' knowledge, this is the first study to consider both the uncertainty of climate models and inter-farm variability. The milk contamination projections cover the European region and are presented as heatmaps with a resolution of ~100 km. Results are further analyzed in relation to the regulatory TBC threshold, revealing alarmingly frequent violations in some regions. Additionally, European regions are classified based on the anticipated risk of regulatory violations.
2 Methodology
In this section, the impact modeling framework and its constituent elements are introduced. First, an overview of the framework is provided. Second, the strategy used to obtain the climate projections is presented. Third, the method applied for the development of the data-driven impact model is discussed. In the final subsection, the necessary steps for coupling the climate change projections with the data-driven impact model are summarized. Data pre-treatment and impact model development were implemented in MATLAB, while the multi-model mean ensemble of climate models, coupling, and visualization of the results were implemented in Python.
2.1 Impact modeling framework
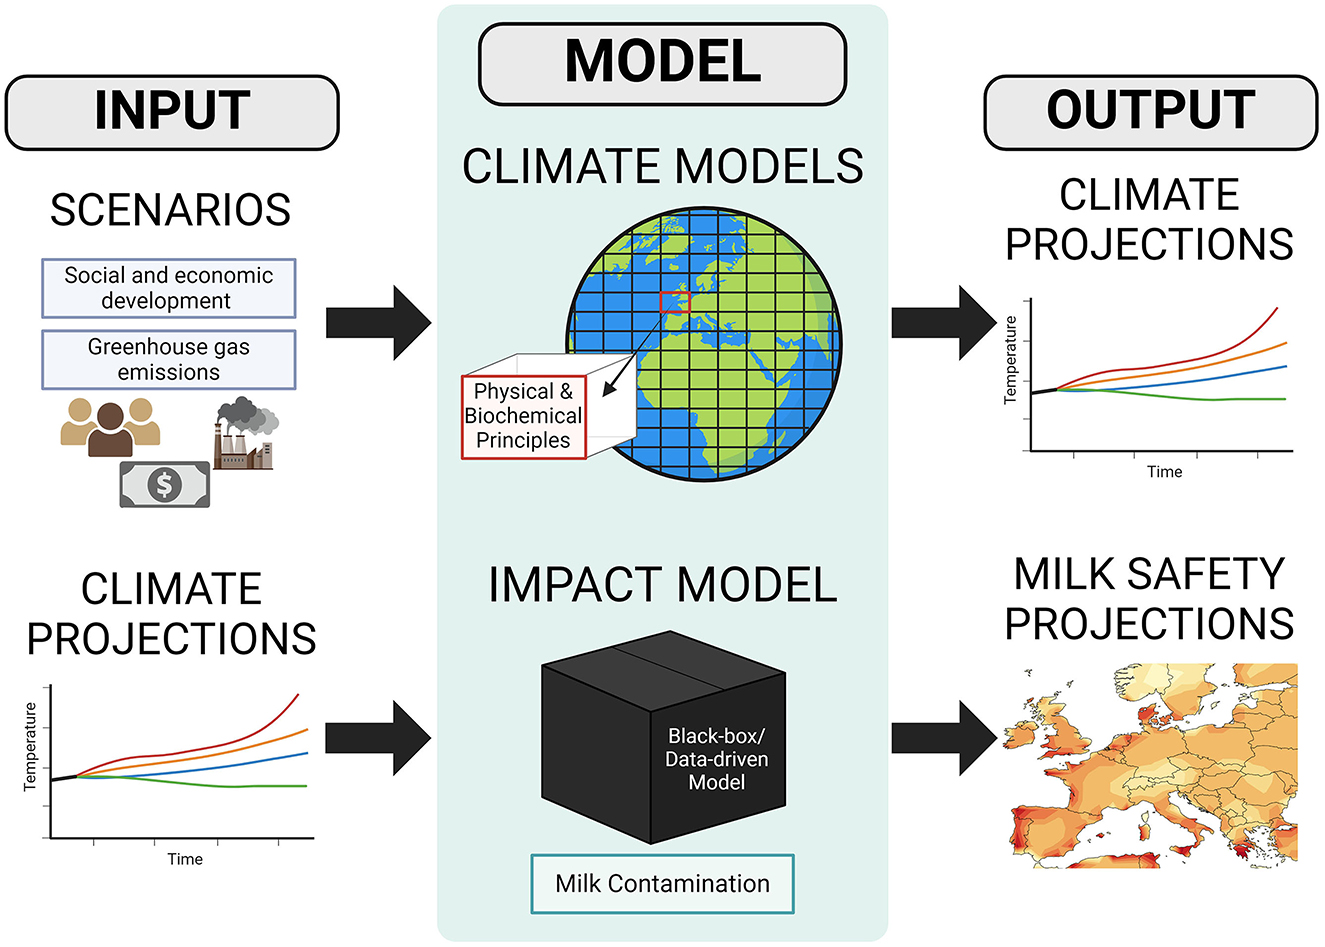
Following the impact modeling framework, climate models were coupled with impact models to evaluate risks under different climate change scenarios (Figure 1). These scenarios correspond to different emission pathways associated with various levels of adaptation and mitigation strategies and are used to initialize the climate models. The most recent emission scenarios, the Shared Socioeconomic Pathways (SSPs), were utilized. These represent narratives of the future that span a range of mitigation and adaptation strategies through to the year 2100 (Meinshausen et al., 2020).
Climate models serve as digital representations of the Earth's climate system. These highly complex models are based on the principles of physics and chemistry, simulating the processes and interactions between different components of the climate system (Eyring et al., 2016). Although they were initially developed to enhance our understanding of the climate system, they have become increasingly accurate over recent decades (Anderson et al., 2016). Consequently, their application has expanded, positioning them at the center of climate change-related policy-making (Edwards, 2010). The outputs of climate models are known as climate projections (O'Neill et al., 2016).
Climate projections represent plausible future trajectories of climate variables for timeframes ranging from decades (short-term; Boer et al., 2016) to centuries (long-term; Meinshausen et al., 2020). In the context of the impact modeling framework, these climate projections were fed into the impact model, which in turn provided estimates of the risk of interest, factoring in the scenario used to initialize the climate models (Katsini et al., 2021).
2.2 Multi-model mean ensemble of climate models
Climate models are continuously developed and refined, with the most recent models belonging to the Coupled Model Intercomparison Project Phase 6 (CMIP6) (Eyring et al., 2016). However, there is no single best-performing climate model. Therefore, a multi-model mean ensemble was computed from CMIP6 climate models (Raju and Kumar, 2020). Based on daily data availability and land coverage of the Mediterranean region, nine climate models were selected: ACCESS-CM2 (Australia), CESM2 (USA), CESM2-WACCM (USA), CanESM5 (Canada), CMCC-CM2-SR5 (Italy), GFDL-ESM4 (USA), CMCC-ESM2 (Italy), MIROC6 (Japan), and MRI-ESM2-0 (Japan). The model simulations covering the European region (latitude from 34 to 72 and longitude from -17 to 41) were accessed through the Copernicus Climate Change Service, Climate Data Store (2021). For each model, the average, minimum, and maximum temperature, precipitation, wind speed, and specific humidity for each scenario were downloaded and used to compute the multi-model ensemble.
Four scenarios were considered: SSP1-2.6, SSP2-4.5, SSP3-7.0, and SSP5-8.5 (hereafter referred to as SSP1, SSP2, SSP3, and SSP5, respectively). SSP1 (Sustainability) corresponds to low challenges for mitigation and adaptation, with an associated global temperature increase of around 1.5°C. SSP2 (Middle of the Road) corresponds to intermediate challenges for mitigation and adaptation, with an expected global temperature increase of ~2.5°C. SSP3 (Regional Rivalry) corresponds to high challenges for both mitigation and adaptation, with a global temperature rise of around 3.5°C. SSP5 (Fossil-fueled Development) corresponds to high challenges for mitigation and low challenges for adaptation, with an expected temperature increase of around 4.5°C. A detailed explanation of these scenarios can be found in Meinshausen et al. (2020), Riahi et al. (2017), and O'Neill et al. (2017). The selected timeframe for all scenarios extends until the year 2100.
Spatial alignment of the individual models was achieved by re-gridding the climate projections to a universal grid scheme using the nearest-neighbor method (Valcke et al., 2022). A major advantage of the multi-model mean ensemble is that the range of models provides a metric of uncertainty for the climate projections. In this work, both the multi-model mean and the 95th percentile of the spread were used to account for uncertainty in the climate projections. Additionally, as milk contamination does not occur at sea, grid values covering sea areas were excluded.
The climate projections contain inherent errors, as certain elements of the climate system are parameterized in the models (Cannon et al., 2020). Bias correction aimed to eliminate these errors by analyzing observations alongside model simulations for the same time period (Maraun, 2016). The quantile mapping method was used to bias-correct the models by comparing projections with observations from 2015 to 2019. This method assumes that the error remains constant over time (Thrasher et al., 2012), matching the distribution function of simulated data to that of the observations through a delta-type transfer function (Maraun, 2016). The necessary observations were obtained from the AGRI4CAST resources portal of the Joint Research Center (accessed on 14-07-2023) of the European Commission, as well as from the Copernicus Climate Change Service, Climate Data Store (2022).
2.3 Impact model for milk contamination
The impact model developed in this study aimed to quantify the influence of climate on the TBC levels of raw milk. Milk contamination data collected from 123 farms in Malta (2015–2020) were used to build a regression model, while data from 53 farms in Galicia, Spain (2014–2017), and 80 farms in Limburg, Belgium (2016–2022) were utilized for validation.
The dataset from Malta was chosen for model training, as it included the largest number of farms, enabling the calculation of inter-farm variability via standard deviation. Following Katsini et al. (2022), temperature (average, minimum, and maximum), relative humidity, precipitation, wind speed, and the temperature-humidity index were used as predictors. The first response variable of the developed model was the average log10(TBC), while the second was the standard deviation of log10(TBC) across all farms. This allowed the model to predict both the farm average and the inter-farm variability. The climatic data used for model development and validation were obtained from the AGRI4CAST resources portal of the Joint Research Centre of the European Commission (accessed on 03-03-2023). The supervised learning method, Partial Least Squares (PLS), was employed for model development, and k-fold cross-validation was applied to prevent overfitting (Katsini et al., 2022, 2024). The impact model performance details can be found in the Supplementary Figures 1–3.
2.4 Integration into the impact modeling framework
The integration of the multi-model ensemble (described in Section 2.2) with the impact model (described in Section 2.3) was facilitated through the use of climate projections. These climate projections, derived from the multi-model ensemble, served as inputs for the impact model. To enable this, the following steps were taken: (1) unit alignment (e.g., converting precipitation from kg per square meter per second to mm per day), (2) temporal alignment (e.g., converting from daily to weekly frequency), and (3) variable transformations (e.g., converting specific humidity to relative humidity).
Two sources of uncertainty were quantified: (1) inter-farm variability, expressed as the standard deviation of log10(TBC), which was the second response variable of the impact model, and (2) uncertainty in the climate projections, as reflected by the spread of the multi-model ensemble. The influence of these uncertainties on future milk contamination projections was examined both independently and in combination. For the worst-case scenario, the 95th percentile of the spread was used for the climate projections. Similarly, for farm variability, the 95th percentile (mean plus two times the standard deviation) of log10(TBC) levels was applied.
Milk contamination projections were divided into two regions based on latitude, with a threshold of 45° North. For simplicity, these regions are referred to as North Europe (above or equal to the threshold) and South Europe (below the threshold) in the remainder of this manuscript.
Since this paper focuses on milk production, it was essential to focus on the top milk-producing regions in Europe. These regions were selected based on datasets “Animal populations by NUTS 2 regions” and “Production of cow's milk on farms by NUTS 2 regions,” published by Eurostat (2022) (accessed on 15-5-2024). The selected regions, in order of increasing production (2019–2022), are: South Ireland, Brittany (France), Lombardy (Italy), Pays de la Loire (France), Weser-Ems (Germany), Mazowiecki (Poland), Normandy (France), Poldaskie (Poland), Schleswig-Holstein (Germany), Galicia (Spain), Lüneburg (Germany), and Friesland (Netherlands).
3 Results
This section is divided into two subsections. In Section 3.1, the milk contamination projections for Europe are presented. In Section 3.2, an analysis focusing on the frequency of TBC exceeding the regulatory threshold is included. In both cases, the results refer to the summer months of June, July, and August, as TBC peaks during this period. Additionally, to facilitate comparison between scenarios, only the first 30 years (2020–2049) and the last 30 years (2071–2100) are visualized. The figures in this section correspond to the case where both sources of uncertainty – climate model uncertainty and inter-farm variability – are considered. Results where either no sources of uncertainty or only one source (separately) is considered can be found in the Supplementary Figures 4–12.
3.1 Milk contamination projections
Based on the distributions of milk contamination projections in Europe (Figure 2), there is no clear difference in the mean of the distribution between the first 30 years and the last 30 years. However, an increase in the frequencies in the tail of the distribution is observed during the last 30 years for SSP2, SSP3, and SSP5. This is more evident when focusing on the distribution values above the regulatory threshold of 5 log10(TBC). For the first 30 years, the counts at the value of 5 are around 1,500 across all scenarios, while for the last 30 years, the counts increase to ~1,600 for SSP1, 1,700 for SSP2, 1,750 for SSP3, and 1,800 for SSP5.
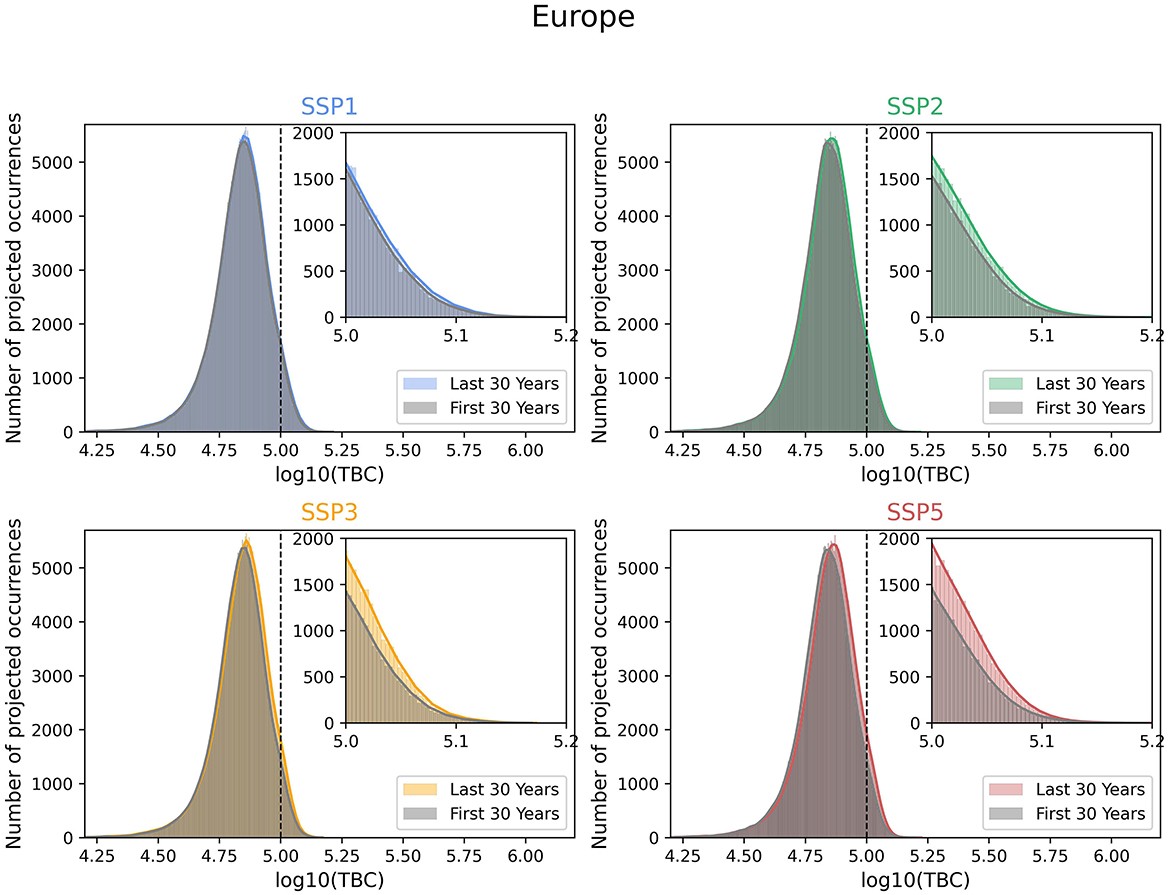
Figure 2. Distributions of milk contamination projections for the first and last 30 years per scenario in Europe. The values correspond to the weekly sample for the months June, July, and August.
Comparing North and South Europe shows that the mean of the distribution is higher in the South compared to the North. The distribution in the Northern region (Figure 3) shows a low count of around 400 for the bin at the value of 5 during the first 30 years. In contrast, the Southern region's distribution (Figure 4) has around 1,500 counts for the same bin. Additionally, values above 5 represent a significantly smaller portion of the tail of the distribution in North Europe compared to South Europe under all scenarios. The first four moments of all distributions, along with the median and the value-at-risk (95% confidence interval), are included in the Supplementary Table 1.
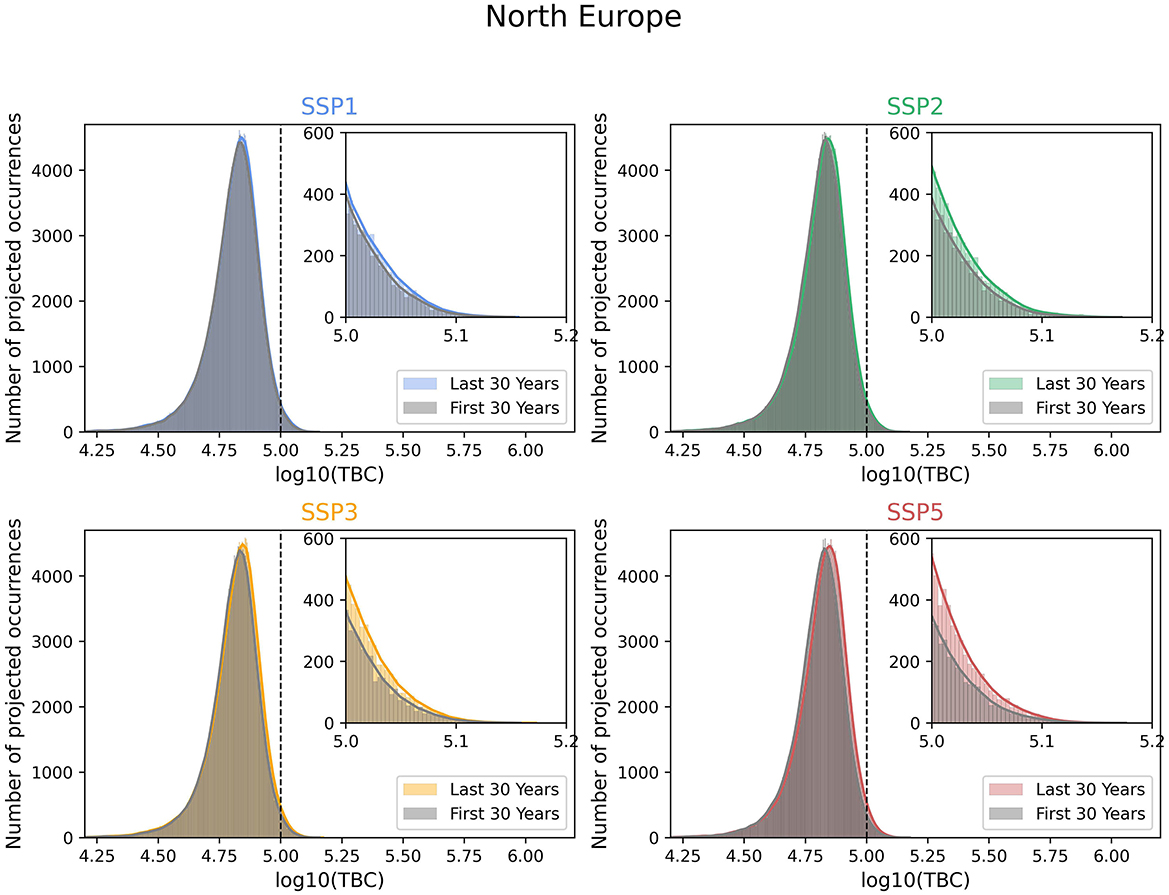
Figure 3. Distributions of milk contamination projections for the first and last 30 years per scenario in North Europe. The values correspond to the weekly sample for the months June, July, and August.
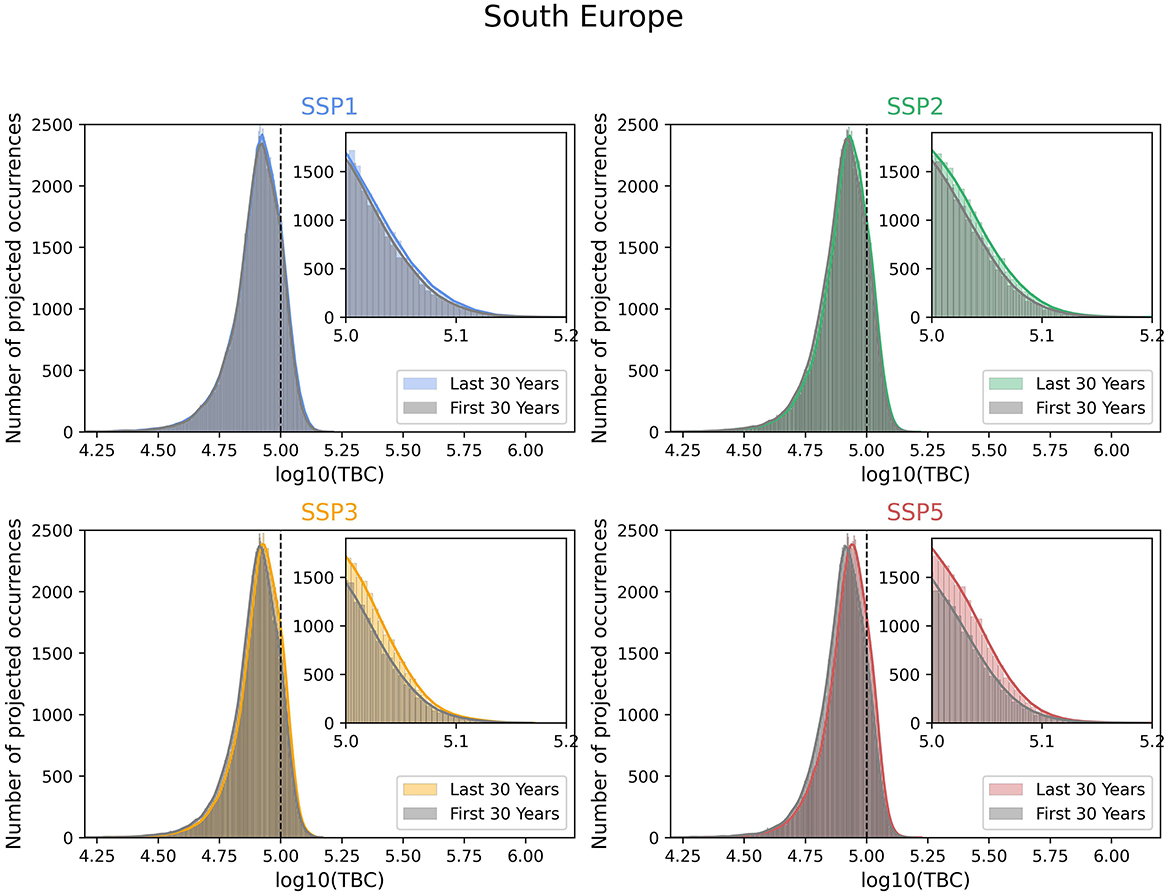
Figure 4. Distributions of milk contamination projections for the first and last 30 years per scenario in South Europe. The values correspond to the weekly sample for the months June, July, and August.
When plotting the average of the first 30 years for all scenarios in a single geographical heatmap, further spatial insights are revealed, as illustrated in Figure 5A. Coastal and southern areas of Europe show the highest TBC levels. However, the average relative change for the last 30 years (Figure 5B) is not significantly high, with maximum values around 1% under SSP5. By comparing the scenarios, SSP1 shows the lowest increase overall, while SSP5 shows the highest.
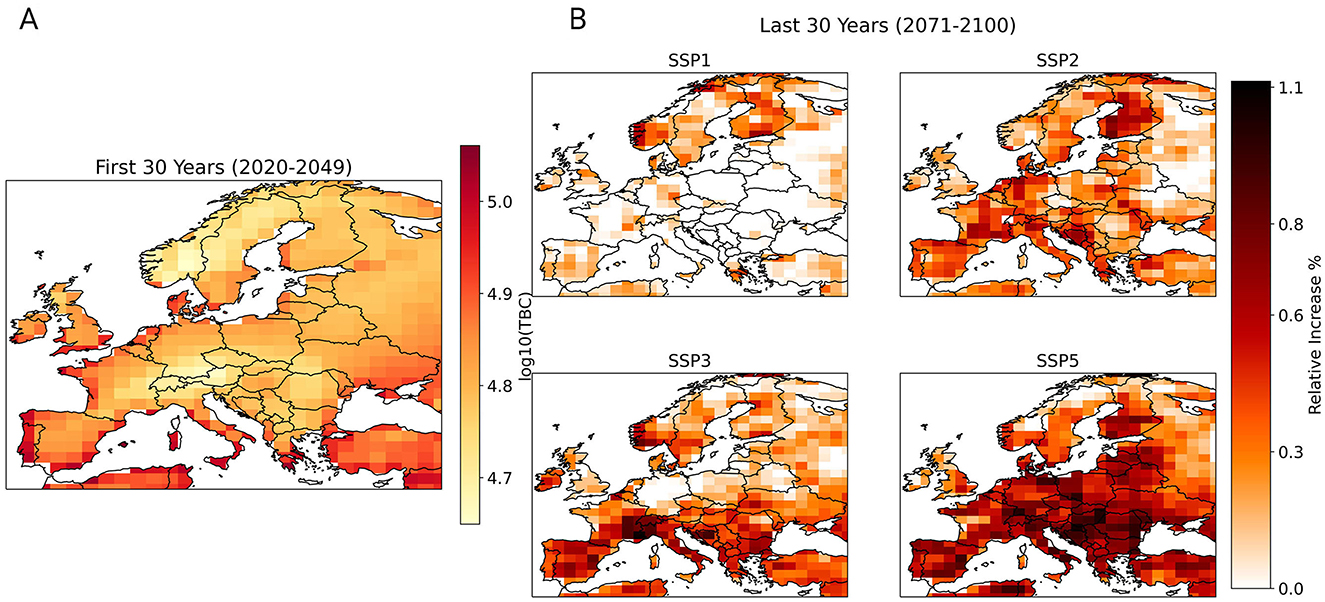
Figure 5. European geographical heatmaps of milk contamination levels for the first 30 years (A) and the relative increase per scenario for the last 30 years (B). The values correspond to the weekly sample for the months June, July, and August.
3.2 Projections exceeding the regulatory threshold
As an additional indicator of climate change impact, the annual frequency of non-compliance with the regulatory threshold is examined. Figure 6 presents geographical heatmaps showing the average of all scenarios for the first 30 years, as well as the last 30 years for each scenario.
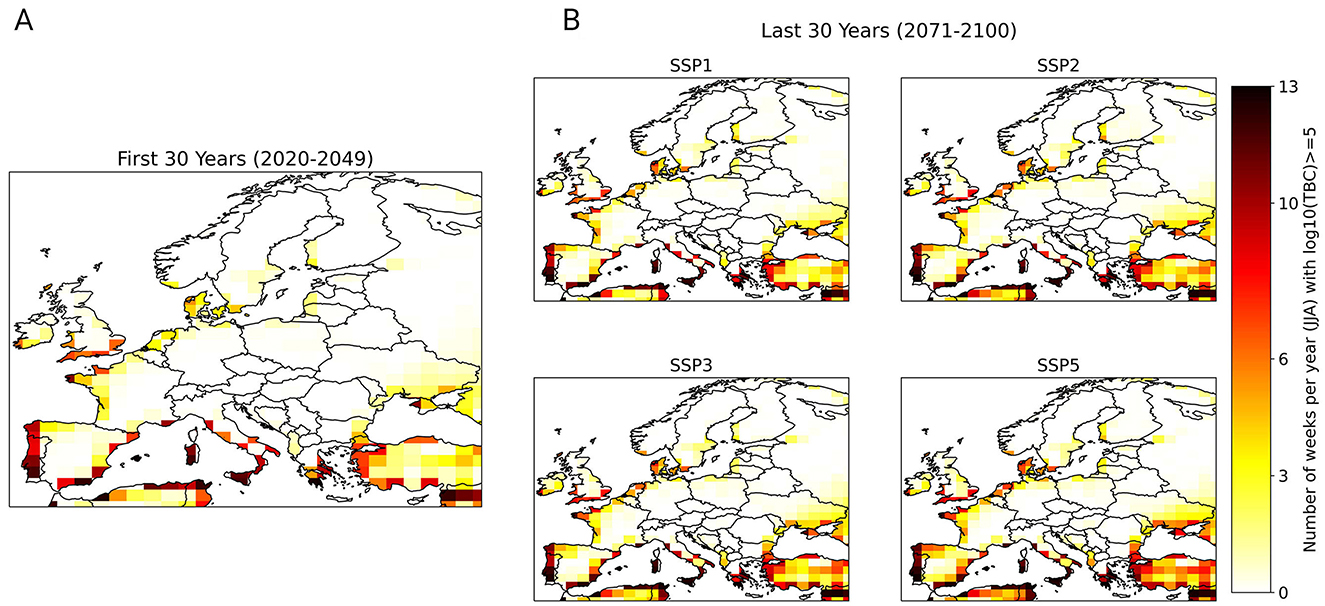
Figure 6. European geographical heatmaps of the number of weeks per year, for which the regulatory threshold is exceeded, for the first (A) and the last (B) 30 years. The values correspond to the weekly sample for the months June, July, and August.
When dividing the regions into North and South Europe, as mentioned earlier, the differences in occurrences where the regulatory threshold is exceeded between the two regions and across scenarios become apparent (Figure 7). In South Europe, all scenarios show a higher number of occurrences exceeding the regulatory threshold for both the first and last 30 years (Figure 7A). However, when comparing the first 30 years with the last 30 years, North Europe shows the highest relative increase in non-compliance for all scenarios (Figure 7B).
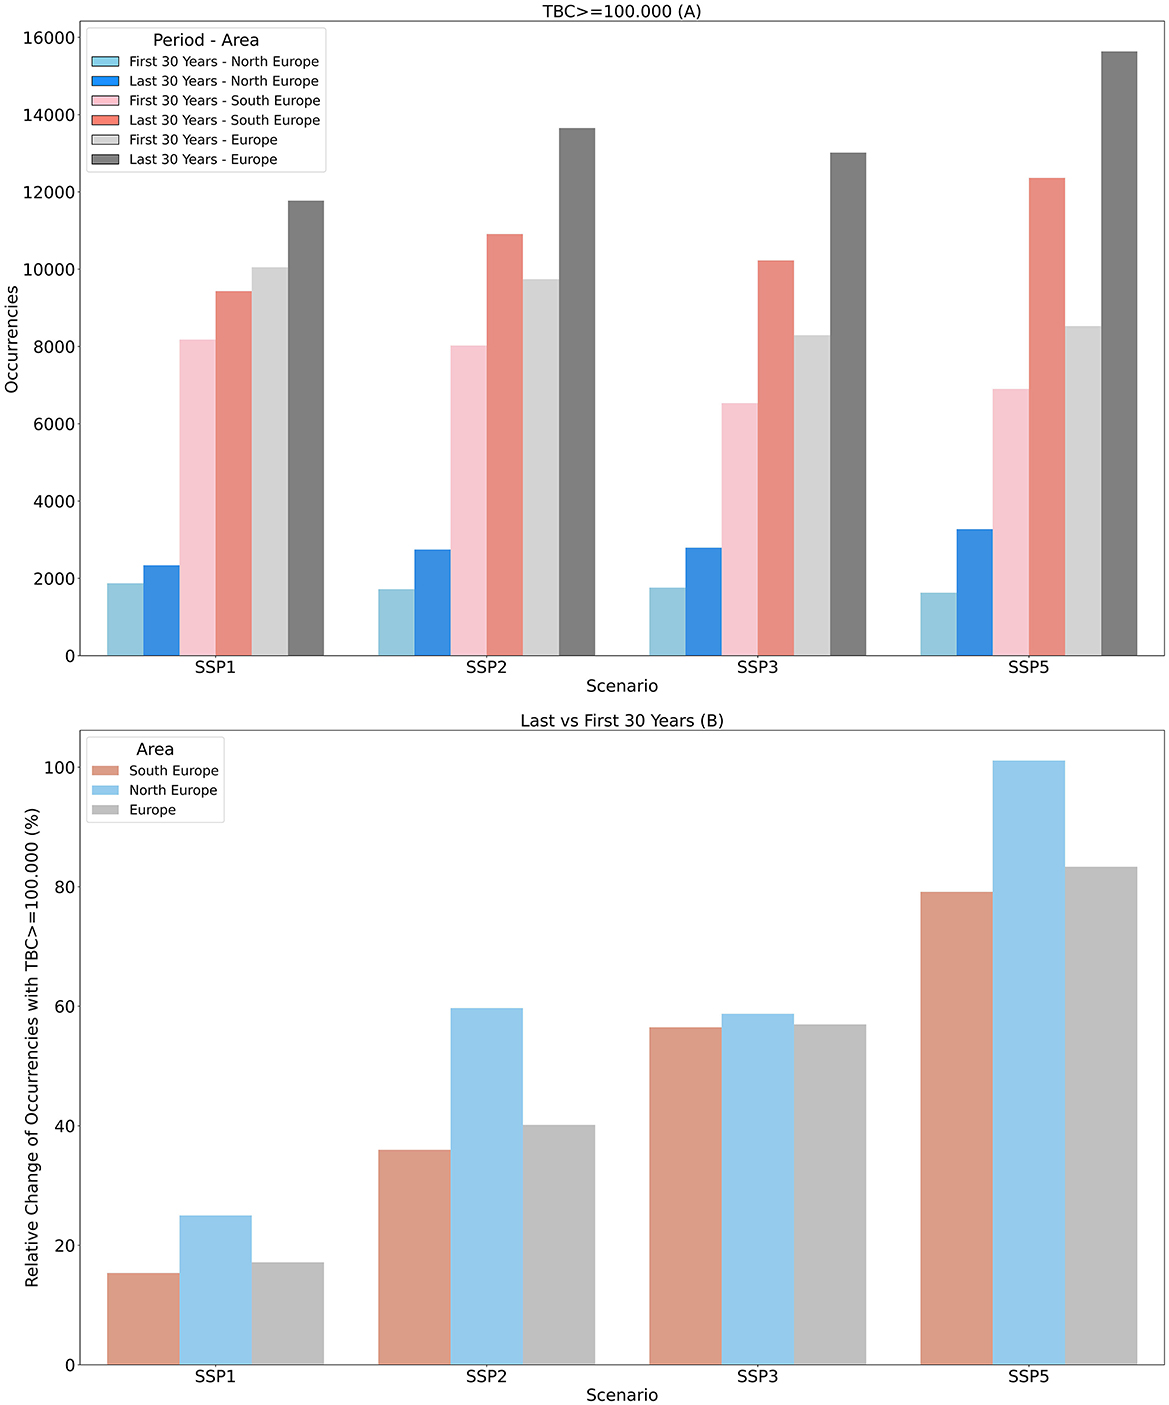
Figure 7. Occurrences, for which the regulatory threshold is exceeded, for the first and last 30 Years in North, South, and whole Europe (A) and the relative change between the first and last 30 years (B). The values correspond to the weekly sample for the months June, July, and August.
Figures 8–11 display the annual frequencies of non-compliance for four representative top milk-producing regions across scenarios. The corresponding results for the remaining regions are provided in the Supplementary Figures 13–19 and Supplementary Table 2. The region of Lombardy (Italy) consistently shows TBC levels that comply with the regulation, so it was excluded from the results. The data, including fitted linear trends and 95% confidence intervals, are illustrated. As seen in Figures 8–11, there was an upward trend in all areas for SSP3 and SSP5, while for SSP1 and SSP2, the trend was either stable or only slightly increasing.
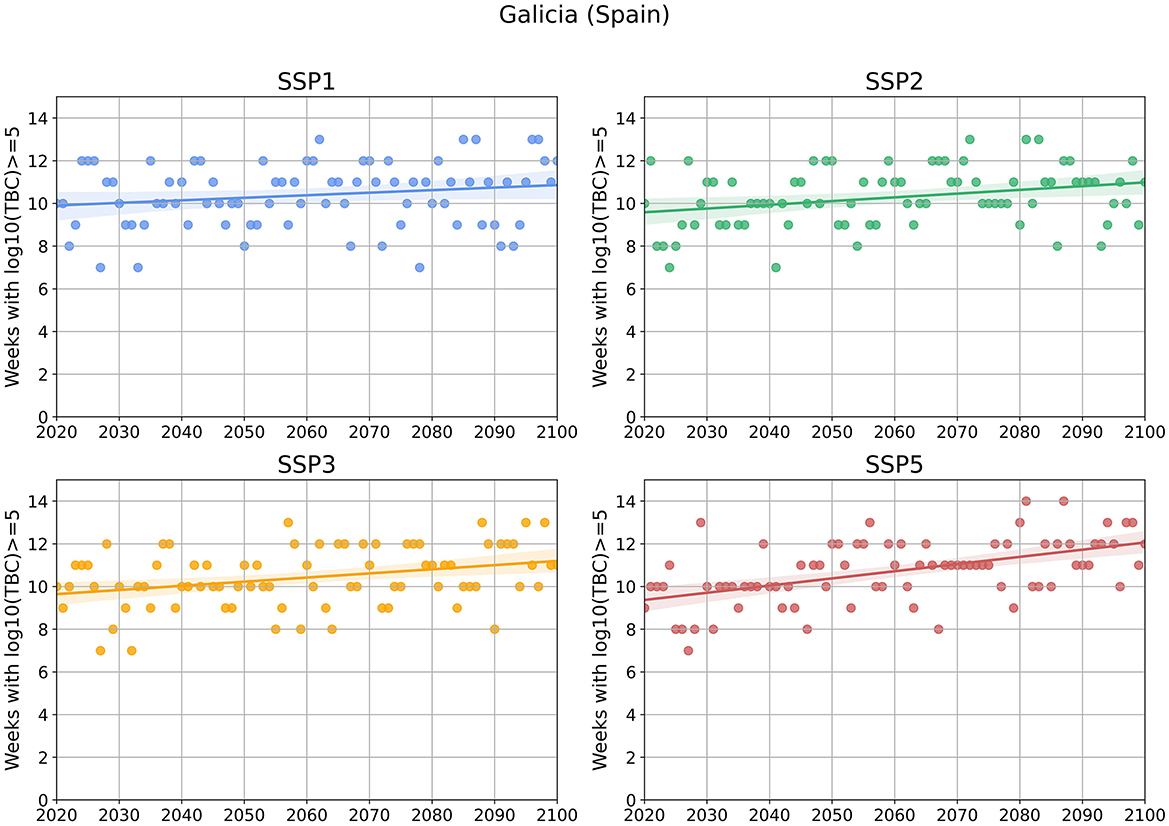
Figure 8. Weeks, for which the regulatory threshold is exceeded, for the region of Galicia (Spain) per scenario. The values correspond to the weekly sample for the months June, July, and August.
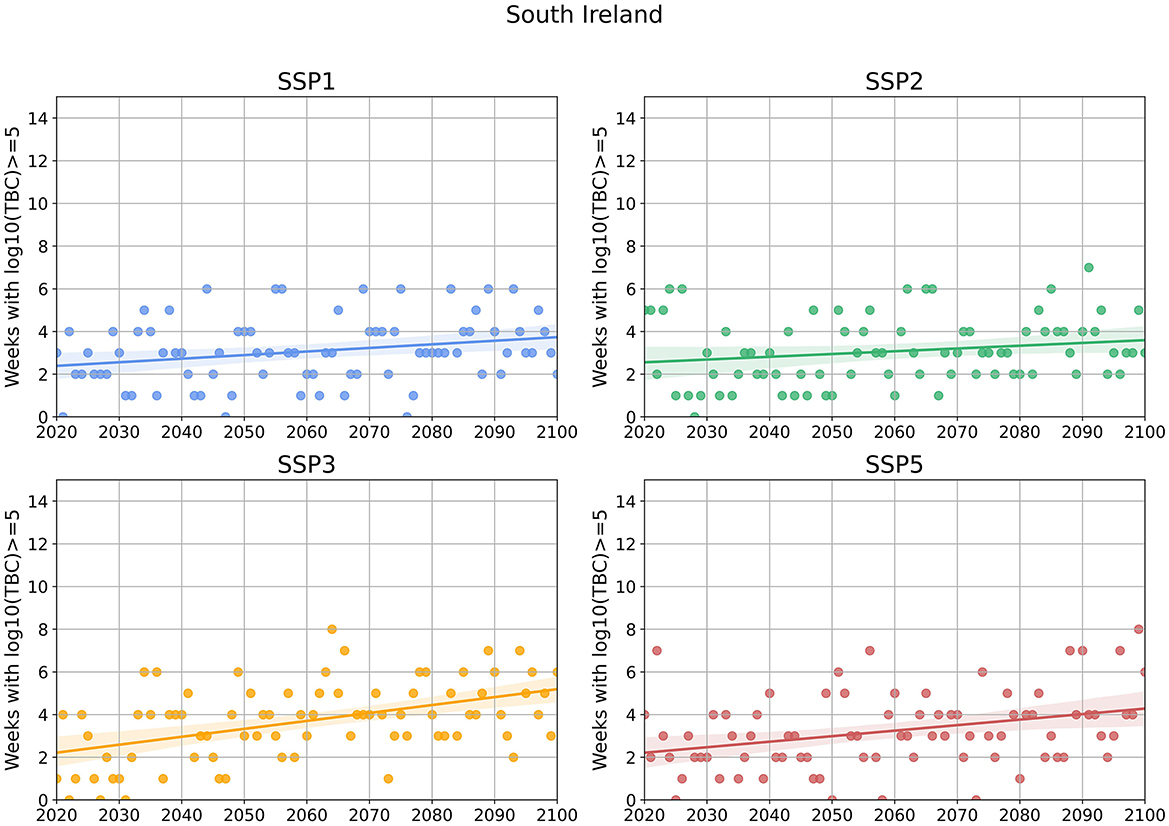
Figure 9. Weeks, for which the regulatory threshold is exceeded, for the region of South Ireland per scenario. The values correspond to the weekly sample for the months June, July, and August.
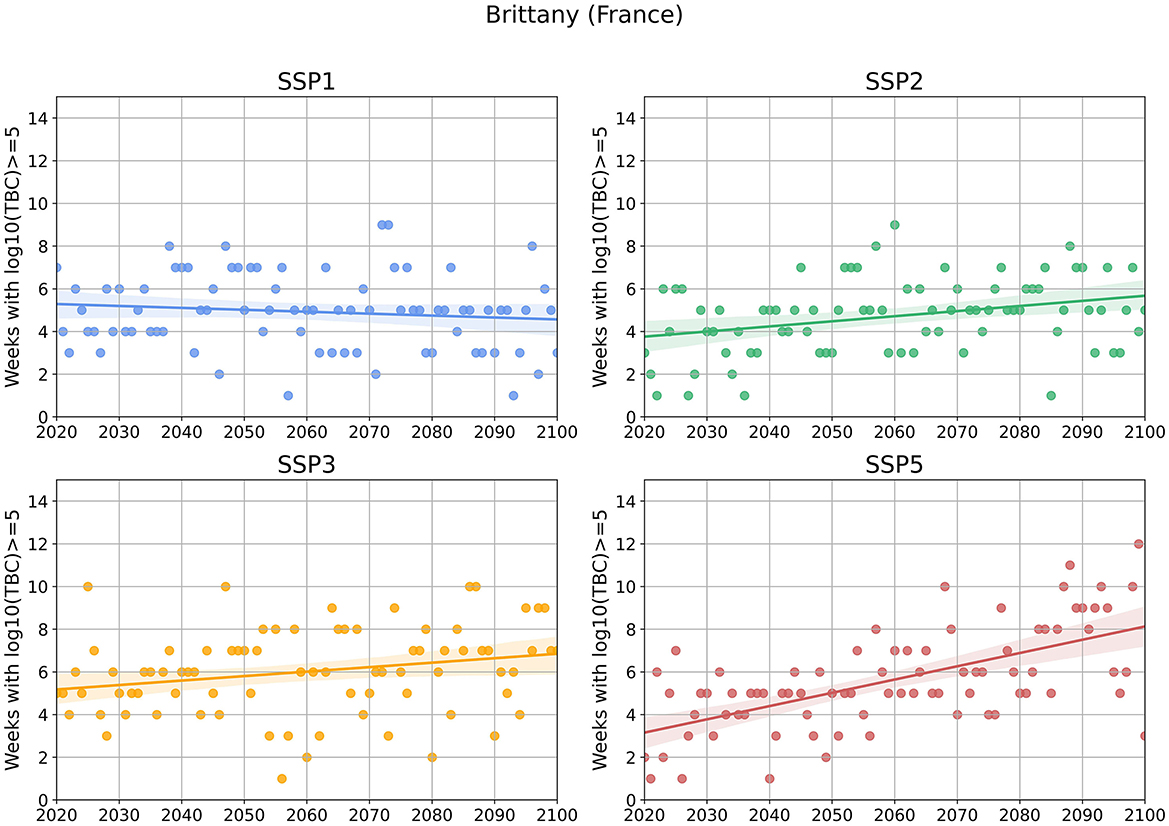
Figure 10. Weeks, for which the regulatory threshold is exceeded, for the region of Brittany (France) per scenario. The values correspond to the weekly sample for the months June, July, and August.
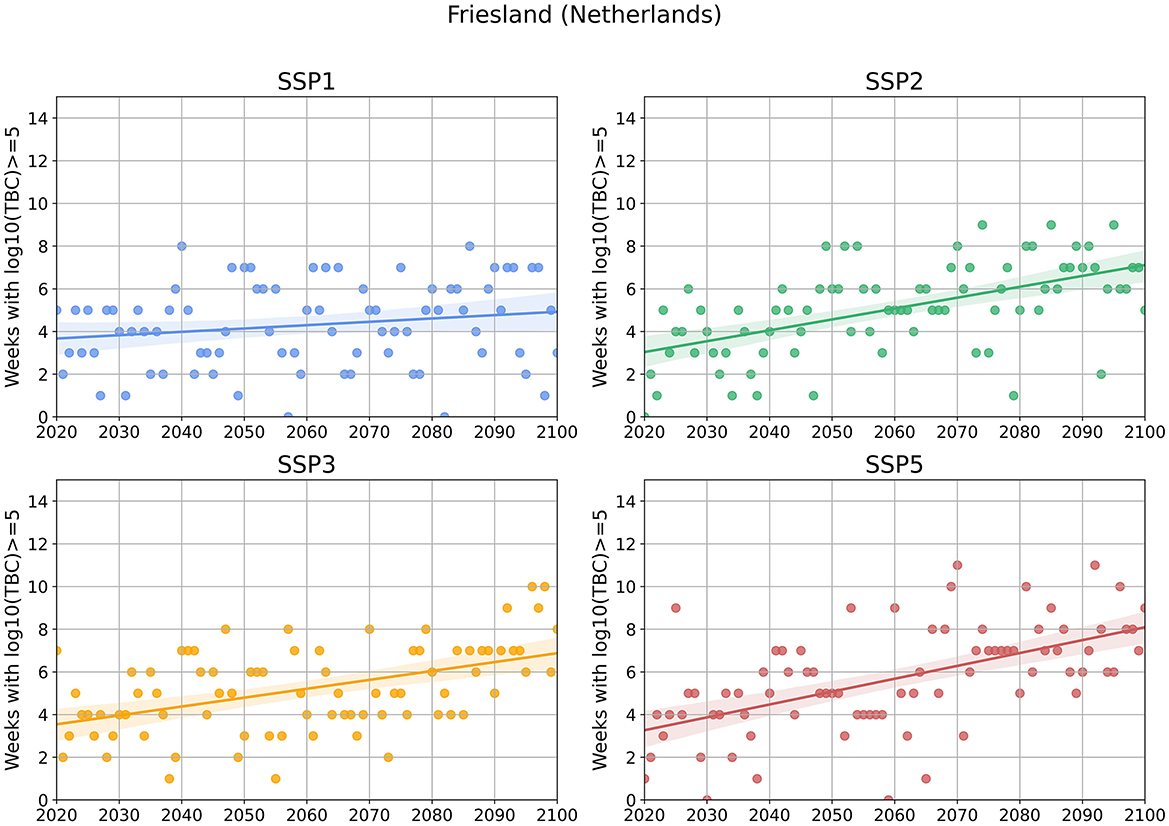
Figure 11. Weeks, for which the regulatory threshold is exceeded, for the region of Friesland (Netherlands) per scenario. The values correspond to the weekly sample for the months June, July, and August.
4 Discussion
Overall, when comparing the scenarios, SSP1, as the best-case scenario in terms of climate change mitigation, yields the lowest milk contamination projections, while SSP5, the worst-case scenario, results in the highest projections. Furthermore, when analyzing the influence of inter-farm variability compared to the uncertainty of the climate models (corresponding figures can be found in the Supplementary material), the former has a much greater impact. This can be attributed to the fact that TBC is a key indicator of farm hygiene and is significantly affected by farm management practices (Kelly et al., 2009). Consequently, the development of climate change adaptation strategies should be farm-oriented, focusing on improving on-farm practices, such as implementing stricter milking protocols, more frequent cleaning of barns, and regular renewal of bedding materials.
4.1 Milk contamination projections
The results indicate that, while the difference in the means of the distributions is not substantial, the divergence in the upper tail of the distributions is notably significant. This suggests that when aiming to quantify the effect of climate change, attention should be given not only to the mean but also to the tails of the distributions. Similarly, non-Gaussian tails are often reported in temperature distributions, and analyzing these tails is crucial for both quantifying the impact of climate change and determining the probabilities of extreme events, such as heatwaves (Bekris et al., 2023; Ruff and Neelin, 2012). In this study, while the mean of milk contamination may not increase significantly, the upper tail of the distribution will become thicker due to climate change, implying that raw milk is expected to be more frequently heavily contaminated. Additionally, comparing the distributions between North and South Europe reveals a shift in the mean, which aligns with the spatial temperature patterns of Europe (Figure 12C).
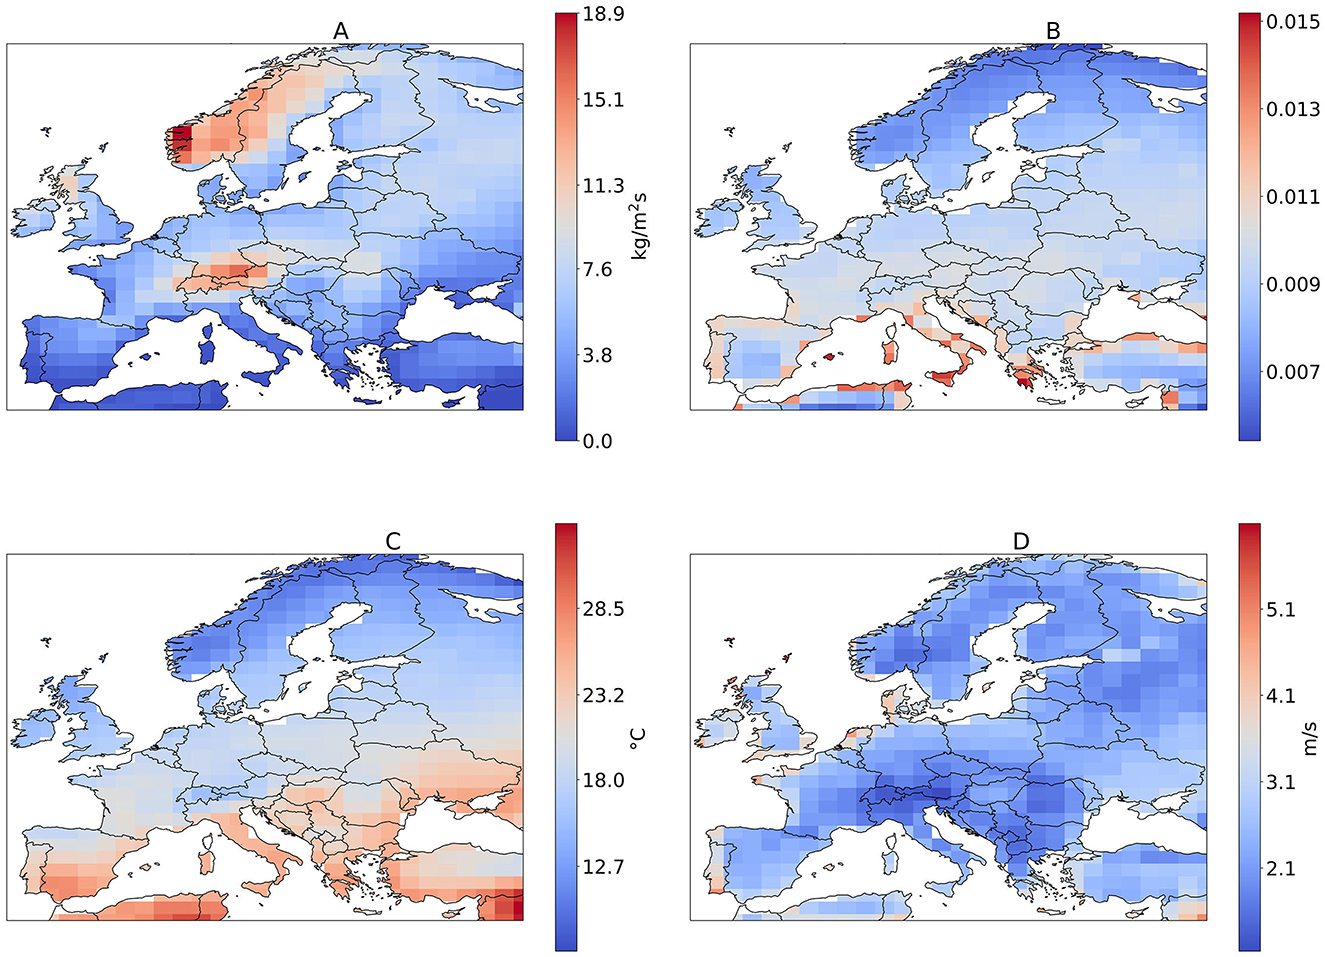
Figure 12. European geographical heatmaps of precipitation (A), specific humidity (B), average temperature (C), and wind speed (D) for the first 30 years based on scenario SSP5. The values correspond to the weekly sample for the months June, July, and August.
The spatial pattern illustrated in Figure 5A is considered a combination of the spatial patterns of wind speed, precipitation, and specific humidity, with less influence from temperature (Figure 12). This finding is consistent with Katsini et al. (2024), who reported that relative humidity, precipitation, and wind speed are more important predictors than temperature for predicting TBC. Qiu et al. (2022) also emphasized the role of humidity in bacterial growth. Furthermore, Bekris et al. (2023) concluded that humidity distribution plays a larger role than temperature distribution in the context of heat stress. Unlike the first 30 years, no clear spatial pattern is observed for the relative increase during the last 30 years.
4.2 Threshold analysis
As illustrated in Figure 6A, even during the first 30 years, the regulatory threshold is exceeded in several areas. It is important to note that the annual frequency of non-compliance results correspond to the months of June, July, and August, meaning that the maximum number of weeks per year is 14. The pattern of higher values in coastal and southern areas, as seen in Figure 6A, re-emerges here. In the maps depicting the last 30 years (Figure 6B), this pattern dominates across all scenarios. While there are slight differences between the scenarios, the distinction between them is not particularly clear.
The difference between scenarios becomes more evident in Figure 7, where most violations correspond to South Europe and SSP5. However, North Europe exhibits the highest relative increase in non-compliance across almost all scenarios. In most cases, the regulatory threshold is exceeded for up to three consecutive weeks. This is particularly concerning as it indicates that regions currently unaffected by heavily contaminated milk will face this challenge in the future due to climate change.
Further regional analysis reveals different temporal trends of annual non-compliance for each region (Figures 8–11). Three distinct patterns can be identified: (i) regions with an increasing number of violations, which are expected to continue rising depending on the scenario (e.g., Galicia, Spain—Figure 8), (ii) regions with a low number of violations, expected to remain low or slightly increase under all scenarios (e.g., South Ireland—Figure 9), and (iii) regions with a low number of violations, which could either significantly increase or stay low, depending on the scenario (e.g., Brittany, Friesland—Figures 10, 11). Based on these patterns, three regional categories can be identified: high-risk regions requiring extra caution, low-risk regions, and emerging-risk regions that need close monitoring. Even under current climatic conditions, some areas exceed the regulatory threshold, and these insights are valuable for developing adaptation and mitigation strategies. Lessons can be drawn from current practices implemented during extreme conditions, such as using fans at farms, more frequent cleaning, lowering the temperature of bulk tanks, and ensuring stricter hygiene during milking. These practices could be extended beyond heatwaves to cover all summer months or even the entire year.
To ensure that the findings of this study are as realistic as possible, the majority of future anticipated climate change scenarios (four out of five developed SSPs) are considered. From a scenario likelihood perspective, SSP5 is regarded as the most probable. Schwalm et al. (2020) found close agreement between the emissions observed from 2005 to 2020 and those considered in SSP5, further noting that SSP5 best aligns with current and planned policies.
5 Conclusions
This study aimed to evaluate raw bovine milk contamination levels under anticipated climate change scenarios, with a particular focus on addressing sources of uncertainty. One limitation of the study is that the climate models used are not downscaled, resulting in a coarser resolution compared to what would be obtained from regional models (Sørland et al., 2021). Additionally, the average of the multi-model ensemble was computed instead of assigning weights to each climate model based on its performance (Eyring et al., 2019). Another limitation is that TBC (Total Bacterial Count) was used as a proxy for food safety instead of performing an analysis for a specific pathogen. While TBC is an indicator of hygiene rather than a direct measure of food safety, past research has shown a correlation between poor hygiene and the presence of specific bacteria, such as Staphylococcus aureus, in raw milk (Deddefo et al., 2023). Furthermore, standard practice involves enumerating TBC rather than specific pathogens (Murphy et al., 2016). As a result, the data available for this study were only in terms of TBC and not specific hazards.
The main conclusion of this study is that, regardless of the scenario considered, the climate change impact is primarily found in the change in the upper tail of the distribution, not the mean. It is crucial to avoid neglecting the changes in the tail of a milk production trait with an upper regulatory threshold.
The findings also highlighted that coastal and southern areas are expected to face the greatest challenges related to climate change. However, some non-coastal areas, which do not currently experience heavily contaminated milk, may encounter such issues in the future due to climate change.
Interestingly, the study underlined the effect of humidity on milk contamination, with humidity becoming even more impactful as temperatures rises. This provides new insight into the underlying phenomena and suggests the need to reconsider the use of sprinklers as a mitigation strategy for heat stress in cows, given its potential impact on milk contamination.
Lastly, this study underscores the importance of high-resolution results. When examining the results for Europe as a whole, or even by dividing it into North and South Europe, temporal patterns that emerge at the regional level are hidden. Only at a finer grid level do more insights become evident, leading to the identification of three risk categories for regions: low, high, and emerging. This granularity is valuable, as it allows for the design and implementation of region-specific adaptation strategies tailored to the needs of each region. Overall, this study contributes to the evidence-based development of strategies that support the transformation of the food system, offering an objective, quantitative approach to assessing the impact of climate change on food hygiene and safety.
Data availability statement
The raw data supporting the conclusions of this article will be made available by the authors, without undue reservation.
Author contributions
LK: Writing – original draft, Visualization, Validation, Software, Methodology, Investigation, Formal analysis, Data curation, Conceptualization, Writing – review & editing. SB: Writing – review & editing, Visualization, Validation, Supervision, Software, Methodology, Investigation, Conceptualization. SR: Writing – review & editing. SG: Writing – review & editing, Supervision. VV: Writing – review & editing, Supervision, Resources, Project administration, Funding acquisition. SA: Writing – review & editing, Supervision. MP: Writing – review & editing, Resources, Project administration, Funding acquisition. JV: Writing – review & editing, Validation, Supervision, Resources, Project administration, Methodology, Investigation, Funding acquisition, Conceptualization.
Funding
The author(s) declare financial support was received for the research, authorship, and/or publication of this article. This work was supported by the European Union's Horizon 2020 Research and Innovation Programme (Marie Skłodowska-Curie Grant Agreement Number: 813329) (http://www.protect-itn.eu/) and by the European Commission within the framework of the Erasmus+ FOOD4S Programme (Erasmus Mundus Joint Master Degree in Food Systems Engineering, Technology and Business 619864-EPP-1-2020-1-BE-EPPKA1-JMD-MOB) (www.food4s.eu). SA was supported by the Research Foundation-Flanders under Grant: 1224623N.
Acknowledgments
We acknowledge the World Climate Research Programme, which, through its Working Group on Coupled Modeling, coordinated and promoted CMIP6. We thank the climate modeling groups for producing and making available their model output, the Earth System Grid Federation (ESGF) for archiving the data and providing access, and the multiple funding agencies who support CMIP6 and ESGF.
Conflict of interest
The authors declare that the research was conducted in the absence of any commercial or financial relationships that could be construed as a potential conflict of interest.
The author JV declared that they were an editorial board member of Frontiers, at the time of submission. This had no impact on the peer review process and the final decision.
Publisher's note
All claims expressed in this article are solely those of the authors and do not necessarily represent those of their affiliated organizations, or those of the publisher, the editors and the reviewers. Any product that may be evaluated in this article, or claim that may be made by its manufacturer, is not guaranteed or endorsed by the publisher.
Supplementary material
The Supplementary Material for this article can be found online at: https://www.frontiersin.org/articles/10.3389/fsufs.2024.1468698/full#supplementary-material
References
Al-harbi, H., Ranjbar, S., Moore, R. J., and Alawneh, J. I. (2021). Bacteria isolated from milk of dairy cows with and without clinical mastitis in different regions of Australia and their AMR profiles. Front. Vet. Sci. 8:743725. doi: 10.3389/fvets.2021.743725
Anderson, T. R., Hawkins, E., and Jones, P. D. (2016). CO2, the greenhouse effect and global warming: from the pioneering work of arrhenius and callendar to today's earth system models. Endeavour 40, 178–187. doi: 10.1016/j.endeavour.2016.07.002
Battilani, P., Toscano, P., der Fels-Klerx, H. J. V., Moretti, A., Leggieri, M. C., Brera, C., et al. (2016). Aflatoxin b1 contamination in maize in europe increases due to climate change. Sci. Rep. 6:24328. doi: 10.1038/srep24328
Bekris, Y., Loikith, P. C., and Neelin, J. D. (2023). Short warm distribution tails accelerate the increase of humid—heat extremes under global warming. Geophys. Res. Lett. 50:2164. doi: 10.1029/2022gl102164
Boer, G. J., Smith, D. M., Cassou, C., Doblas-Reyes, F., Danabasoglu, G., Kirtman, B., et al. (2016). The decadal climate prediction project (DCPP) contribution to CMIP6. Geosci. Mod. Dev. 9, 3751–3777. doi: 10.5194/gmd-9-3751-2016
Cannon, A. J., Piani, C., and Sippel, S. (2020). “Bias correction of climate model output for impact models,” in Climate Extremes and Their Implications for Impact and Risk Assessment (Elsevier), 77–104. doi: 10.1016/b978-0-12-814895-2.00005-7
Copernicus Climate Change Service, Climate Data Store. (2022). Near Surface Meteorological Variables From 1979 to 2018 Derived From Bias-Corrected Reanalysis, Version 2.1. doi: 10.24381/CDS.20D54E34
Copernicus Climate Change Service, Climate Data Store. (2021). CMIP6 Climate Projections. doi: 10.24381/CDS.C866074C
Deddefo, A., Mamo, G., Asfaw, M., and Amenu, K. (2023). Factors affecting the microbiological quality and contamination of farm bulk milk by Staphylococcus aureus in dairy farms in Asella, Ethiopia. BMC Microbiol. 23:2746. doi: 10.1186/s12866-022-02746-0
Edwards, P. N. (2010). History of climate modeling. WIREs Clim. Change 2, 128–139. doi: 10.1002/wcc.95
European Commission, D. (2022). EU Agricultural Outlook for Markets, Income and Environment 2022–2032. Technical Report. Publications Office of the European Union. Available at: https://data.europa.eu/doi/10.2762/29222
Eurostat (2022). Production of Cow's Milk on Farms By Nuts 2 Regions. Eurostat. doi: 10.2908/TGS00046
Eyring, V., Bony, S., Meehl, G. A., Senior, C. A., Stevens, B., Stouffer, R. J., et al. (2016). Overview of the coupled model intercomparison project phase 6 (CMIP6) experimental design and organization. Geosci. Mod. Dev. 9, 1937–1958. doi: 10.5194/gmd-9-1937-2016
Eyring, V., Cox, P. M., Flato, G. M., Gleckler, P. J., Abramowitz, G., Caldwell, P., et al. (2019). Taking climate model evaluation to the next level. Nat. Clim. Change 9, 102–110. doi: 10.1038/s41558-018-0355-y
Feliciano, R. J., Boué, G., and Membré, J.-M. (2020). Overview of the potential impacts of climate change on the microbial safety of the dairy industry. Foods 9:1794. doi: 10.3390/foods9121794
Fodor, N., Foskolos, A., Topp, C. F. E., Moorby, J. M., Pásztor, L., and Foyer, C. H. (2018). Spatially explicit estimation of heat stress-related impacts of climate change on the milk production of dairy cows in the United Kingdom. PLoS ONE 13:e0197076. doi: 10.1371/journal.pone.0197076
Gauly, M., Bollwein, H., Breves, G., Brügemann, K., Dänicke, S., Daş, G., et al. (2013). Future consequences and challenges for dairy cow production systems arising from climate change in central europe – a review. Animal 7, 843–859. doi: 10.1017/s1751731112002352
Gunn, K. M., Holly, M. A., Veith, T. L., Buda, A. R., Prasad, R., Rotz, C. A., et al. (2019). Projected heat stress challenges and abatement opportunities for U.S. milk production. PLoS ONE 14:e0214665.
Guzmán-Luna, P., Nag, R., Martínez, I., Mauricio-Iglesias, M., Hospido, A., and Cummins, E. (2022). Quantifying current and future raw milk losses due to Bovine mastitis on European dairy farms under climate change scenarios. Sci. Tot. Environ. 833:155149. doi: 10.1016/j.scitotenv.2022.155149
Janssens, C., Havlík, P., Krisztin, T., Baker, J., Frank, S., Hasegawa, T., et al. (2020). Global hunger and climate change adaptation through international trade. Nat. Clim. Change 10, 829–835. doi: 10.1038/s41558-020-0847-4
Katsini, L., Bhonsale, S., Akkermans, S., Roufou, S., Griffin, S., Valdramidis, V., et al. (2021). Quantitative methods to predict the effect of climate change on microbial food safety: a needs analysis. Trends Food Sci. Technol. 7:41. doi: 10.1016/j.tifs.2021.07.041
Katsini, L., Muñoz Lopéz, C., Bhonsale, S., Roufou, S., Griffin, S., Valdramidis, V., et al. (2022). “Data-driven modelling of the climatic impact on the microbial food safety of raw milk,” in FOODSIM'2022, eds. J. F. M. Van Impe and M. Polanska (Ghent: EUROSIS-ETI), 28–32.
Katsini, L., Muñoz Lopéz, C. A., Bhonsale, S., Roufou, S., Griffin, S., Valdramidis, V., et al. (2024). Modeling climatic effects on milk production. Comput. Electr. Agri. 225:109218. doi: 10.1016/j.compag.2024.109218
Kelly, P., O'Sullivan, K., Berry, D., More, S., Meaney, W., O'Callaghan, E., et al. (2009). Farm management factors associated with bulk tank total bacterial count in Irish dairy herds during 2006/07. Ir. Vet. J. 62:109218.
Liu, C., Hofstra, N., and Leemans, R. (2015). Preparing suitable climate scenario data to assess impacts on local food safety. Food Res. Int. 68, 31–40. doi: 10.1016/j.foodres.2014.08.017
Maraun, D. (2016). Bias correcting climate change simulations—a critical review. Curr. Clim. Change Rep. 2, 211–220. doi: 10.1007/s40641-016-0050-x
Mauger, G., Bauman, Y., Nennich, T., and Salathé, E. (2014). Impacts of climate change on milk production in the United States. Prof. Geograph. 67, 121–131. doi: 10.1080/00330124.2014.921017
Mbow, C., Rosenzweig, C., Barioni, L., Benton, T., Herrero, M., Krishnapillai, M., et al. (2022). “Food security,” in Climate Change and Land: an IPCC Special Report on Climate Change, Desertification, Land Degradation, Sustainable Land Management, Food Security, and Greenhouse Gas Fluxes in Terrestrial Ecosystems (Cambridge: Cambridge University Press), 437–550.
Meinshausen, M., Nicholls, Z. R. J., Lewis, J., Gidden, M. J., Vogel, E., Freund, M., et al. (2020). The shared socio-economic pathway (SSP) greenhouse gas concentrations and their extensions to 2500. Geosci. Mod. Dev. 13, 3571–3605. doi: 10.5194/gmd-13-3571-2020
Murphy, S. C., Martin, N. H., Barbano, D. M., and Wiedmann, M. (2016). Influence of raw milk quality on processed dairy products: how do raw milk quality test results relate to product quality and yield? J. Dairy Sci. 99, 10128–10149.
Ndraha, N., and Hsiao, H.-I. (2019). The risk assessment of vibrio parahaemolyticus in raw oysters in taiwan under the seasonal variations, time horizons, and climate scenarios. Food Contr. 102, 188–196. doi: 10.1016/j.foodcont.2019.03.020
Neculai-Valeanu, A.-S., and Ariton, A.-M. (2022). Udder health monitoring for prevention of Bovine mastitis and improvement of milk quality. Bioengineering 9:608. doi: 10.3390/bioengineering9110608
North, M. A., Franke, J. A., Ouweneel, B., and Trisos, C. H. (2023). Global risk of heat stress to cattle from climate change. Environ. Res. Lett. 18:e094027. doi: 10.1088/1748-9326/aceb79
O'Neill, B. C., Kriegler, E., Ebi, K. L., Kemp-Benedict, E., Riahi, K., Rothman, D. S., et al. (2017). The roads ahead: narratives for shared socioeconomic pathways describing world futures in the 21st century. Glob. Environ. Change 42, 169–180. doi: 10.1016/j.gloenvcha.2015.01.004
O'Neill, B. C., Tebaldi, C., van Vuuren, D. P., Eyring, V., Friedlingstein, P., Hurtt, G., et al. (2016). The scenario model intercomparison project (ScenarioMIP) for CMIP6. Geosci. Mod. Dev. 9, 3461–3482. doi: 10.5194/gmd-9-3461-2016
Priyashantha, H., Lundh, Å., Höjer, A., Bernes, G., Nilsson, D., Hetta, M., et al. (2021a). Composition and properties of bovine milk: a study from dairy farms in Northern Sweden; part I. Effect of dairy farming system. J. Dairy Sci. 104, 8582–8594. doi: 10.3168/jds.2020-19650
Priyashantha, H., Lundh, Å., Höjer, A., Bernes, G., Nilsson, D., Hetta, M., et al. (2021b). Composition and properties of bovine milk: A study from dairy farms in Northern Sweden; part II. Effect of monthly variation. J. Dairy Sci. 104, 8595–8609. doi: 10.3168/jds.2020-19651
Qiu, Y., Zhou, Y., Chang, Y., Liang, X., Zhang, H., Lin, X., et al. (2022). The effects of ventilation, humidity, and temperature on bacterial growth and bacterial genera distribution. Int. J. Environ. Res. Publ. Health 19:15345. doi: 10.3390/ijerph192215345
Raju K. S. and Kumar, D. N.. (2020). Review of approaches for selection and ensembling of GCMs. J. Water Clim. Change 11, 577–599. doi: 10.2166/wcc.2020.128
Riahi, K., van Vuuren, D. P., Kriegler, E., Edmonds, J., O'Neill, B. C., Fujimori, S., et al. (2017). The shared socioeconomic pathways and their energy, land use, and greenhouse gas emissions implications: an overview. Glob. Environ. Change 42, 153–168. doi: 10.1016/j.gloenvcha.2016.05.009
Robles, I., Kelton, D., Barkema, H., Keefe, G., Roy, J., von Keyserlingk, M., et al. (2020). Bacterial concentrations in bedding and their association with dairy cow hygiene and milk quality. Animal 14, 1052–1066. doi: 10.1017/s1751731119002787
Rohr, J. R., Barrett, C. B., Civitello, D. J., Craft, M. E., Delius, B., DeLeo, G. A., et al. (2019). Emerging human infectious diseases and the links to global food production. Nat. Sustainabil. 2, 445–456. doi: 10.1038/s41893-019-0293-3
Ruff, T. W., and Neelin, J. D. (2012). Long tails in regional surface temperature probability distributions with implications for extremes under global warming. Geophys. Res. Lett. 39:610. doi: 10.1029/2011gl050610
Schwalm, C. R., Glendon, S., and Duffy, P. B. (2020). Rcp8.5 tracks cumulative CO2 emissions. Proc. Natl. Acad. Sci. U. S. A. 117, 19656–19657. doi: 10.1073/pnas.2007117117
Sørland, S. L., Brogli, R., Pothapakula, P. K., Russo, E., de Walle, J. V., Ahrens, B., et al. (2021). COSMO-CLM regional climate simulations in the coordinated regional climate downscaling experiment (CORDEX) framework: a review. Geosci. Mod. Dev. 14, 5125–5154. doi: 10.5194/gmd-14-5125-2021
Sujata, Dubey, K. K., Raj, T., and Kumar, P. (2022). Pathogenic Microorganisms in Milk: Their Source, Hazardous Role and Identification (Elsevier), 145–161. doi: 10.1016/b978-0-323-85793-2.00005-9
Thrasher, B., Maurer, E. P., McKellar, C., and Duffy, P. B. (2012). Technical note: bias correcting climate model simulated daily temperature extremes with quantile mapping. Hydrol. Earth Syst. Sci. 16, 3309–3314. doi: 10.5194/hess-16-3309-2012
Tirado, M., Clarke, R., Jaykus, L., McQuatters-Gollop, A., and Frank, J. (2010). Climate change and food safety: a review. Food Res. Int. 43, 1745–1765. doi: 10.1016/j.foodres.2010.07.003
Toghdory, A., Ghoorchi, T., Asadi, M., Bokharaeian, M., Najafi, M., and Nejad, J. G. (2022). Effects of environmental temperature and humidity on milk composition, microbial load, and somatic cells in milk of holstein dairy cows in the northeast regions of Iran. Animals 12:2484. doi: 10.3390/ani12182484
Valcke, S., Piacentini, A., and Jonville, G. (2022). Benchmarking regridding libraries used in earth system modelling. Math. Comput. Appl. 27:31. doi: 10.3390/mca27020031
Van der Fels-Klerx, H. J., Vermeulen, L. C., Gavai, A. K., and Liu, C. (2019). Climate change impacts on aflatoxin b1 in maize and aflatoxin m1 in milk: a case study of maize grown in eastern europe and imported to the Netherlands. PLoS ONE 14:e0218956. doi: 10.1371/journal.pone.0218956
Wagener, T., Reinecke, R., and Pianosi, F. (2022). On the evaluation of climate change impact models. WIREs Clim. Change 13:772. doi: 10.1002/wcc.772
Keywords: climate change, milk contamination, predictive modeling, food safety, projections, impact study
Citation: Katsini L, Bhonsale SS, Roufou S, Griffin S, Valdramidis V, Akkermans S, Polanska M and Van Impe JFM (2024) Milk contamination in Europe under anticipated climate change scenarios. Front. Sustain. Food Syst. 8:1468698. doi: 10.3389/fsufs.2024.1468698
Received: 22 July 2024; Accepted: 15 October 2024;
Published: 05 November 2024.
Edited by:
Vasco Augusto Pilão Cadavez, Agricultural College of Bragança, PortugalReviewed by:
Kebede Amenu, International Livestock Research Institute, EthiopiaMyrsini Kakagianni, University of Thessaly, Greece
Copyright © 2024 Katsini, Bhonsale, Roufou, Griffin, Valdramidis, Akkermans, Polanska and Van Impe. This is an open-access article distributed under the terms of the Creative Commons Attribution License (CC BY). The use, distribution or reproduction in other forums is permitted, provided the original author(s) and the copyright owner(s) are credited and that the original publication in this journal is cited, in accordance with accepted academic practice. No use, distribution or reproduction is permitted which does not comply with these terms.
*Correspondence: Jan F. M. Van Impe, amFuLnZhbmltcGVAa3VsZXV2ZW4uYmU=
 Lydia Katsini
 Satyajeet S. Bhonsale
 Styliani Roufou2
 Sholeem Griffin
 Simen Akkermans
 Monika Polanska
 Jan F. M. Van Impe