 Guihua Wang1†
 Shilin Feng
 Xiaodong Han
 Guofen Zhao
95% of researchers rate our articles as excellent or good
Learn more about the work of our research integrity team to safeguard the quality of each article we publish.
Find out more
ORIGINAL RESEARCH article
Front. Sustain. Food Syst. , 02 May 2024
Sec. Crop Biology and Sustainability
Volume 8 - 2024 | https://doi.org/10.3389/fsufs.2024.1387728
Soybean and corn strip cropping takes full advantage of the root characteristics and plant height differences between soybean and corn, which can improve crop photosynthesis and nutrient uptake as well as capitalize on the marginal effect of corn. However, there is not enough in-depth research on the effects of soybean and corn strip cropping modes on inter-root microbial communities and crop yield traits and their correlations, and the functional genes of inter-root microbes. In this study, the structural composition and functional genes of soil inter-root microbial communities under different strip cropping patterns of soybean and maize, Mode 1, Mode 2, and Mode 3, were studied using macro-genome high-throughput sequencing, and the yield traits of soybean and maize were determined and the correlation was understood, taking Zhonglian Soybean 1505 and Tiyu 108 maize as test materials at the experimental base of the Research Institute of Agricultural and Livestock Sciences, Xing'anmeng, Inner Mongolia. correlation between the two. The following results were found. Redundancy analysis found that rhizosphere microorganisms are mainly bacteria, followed by viruses, followed by archaea, and fungi are the least. Relatively speaking, viruses and bacteria are more susceptible to the influence of planting patterns than fungi. Alpha diversity analysis shows that the diversity index changes significantly during the peak flowering period. There is no difference between the other two stages. The diversity of maize rhizosphere microorganisms under Mode 1 or Mode 2 modes is higher than that under Mode 3 modes, while the diversity of soybean rhizosphere microorganisms under Mode 3 modes is higher than the other two modes. Profiling analysis found that different growth periods and planting patterns lead to varying degrees of changes in community structure. The dominant bacterial phyla include Pseudomonas, Actinobacteria, Bacteroidetes, and Streptococcus. The dominant genera of bacteria are rhizobia, pseudomonas, erythrobacteria, and pseudomonas. The relative abundance of slow root rhizobia in the three growth stages of maize rhizosphere is relatively low. The results of yield traits showed that corn yield under Mode 1 and Mode 2 planting was significantly higher than that under pattern III; soybean yield under pattern III planting was significantly higher than that under the other two patterns, indicating that pattern I or II planting is suitable for corn production, while Mode 3 planting mode is more suitable for soybean production. Correlation analysis showed that S_Massilis_putida was significantly and positively correlated with maize yield, and S_lysobacter_capsici was highly significantly and significantly positively correlated with the number of soybean plants per square meter, and the number of plants in 2 square meters. This study contributes to our further understanding of the classification of inter-root microorganisms and their functional relationships in maize and soybean under different conditions.
Intercropping is a planting pattern that diversifies crops in agricultural ecosystems worldwide. There is a long history in agricultural production in China (Li, 2016; He et al., 2023). Reasonable intercropping can fully utilize resources such as light, space, and soil, reduce resource input, and utilize mutually beneficial factors between crops to create natural environmental conditions that are more conducive to crop growth and development, improve field ecological diversity (Brooker et al., 2015), effectively prevent and control the occurrence of diseases and pests, reduce environmental pollution and adverse factors, further improve crop resource utilization, increase crop replanting index, crop yield, and nutrient utilization rate (Hauggaard-Nielsen and Jensen, 2005).
The intercropping mode between leguminous crops and rhizobia can fully utilize the symbiotic nitrogen fixation effect of leguminous crops and rhizobia, change soil enzyme activity, enhance soil fertility, reduce nitrogen fertilizer application in leguminous crops, and improve the agricultural ecological environment. This mode is widely accepted by farmers as an efficient ecological planting mode (Zou et al., 2015; Lin et al., 2022; Tang et al., 2022). Belt planting is developed on the basis of traditional intercropping 36. Belt planting of soybean and corn fully utilizes the advantages of intercropping between grasses and beans. By utilizing the root characteristics and plant height differences of soybean and corn, it can not only improve crop photosynthesis and nutrient absorption, but also fully utilize the marginal effects of corn. It is one of the main autumn crop planting modes promoted by the Ministry of Agriculture and Rural Affairs of China (Lv et al., 2014; Liang et al., 2021; Wang et al., 2023). Therefore, there have been many studies on the yield, photosynthesis, intercropping corn density, mechanization, the impact of soybean at different maturity stages on intercropping, the interaction between soybean and corn, and pests and diseases in soybean corn intercropping (Wang et al., 2007; Cai et al., 2021; Feng et al., 2021). However, there is limited research on the impact on soil microbial communities and the correlation between soil microbial community structure and production performance. Soil health is one of the most important essential conditions for crop growth in the agricultural system. The changes in community structure and diversity of soil microorganisms can reflect the internal stability of the soil ecosystem, the buffering ability of the soil to ecological degradation, and the nutritional status of the soil. It is considered one of the most sensitive potential biological indicators (Sun et al., 1997; Elasa et al., 2006; Jiang et al., 2016).
To investigate the response of the rhizosphere microbial community structure and production performance of corn and soybean to strip planting mode and their correlation, this study focused on the rhizosphere soil of Zhonglian Bean 1505 and Tianyu 108 corn planted in the experimental soybase of the Agricultural and Animal Husbandry Science Research Institute in Xing'an League Inner Mongolia, under different planting modes. High-throughput metagenomic sequencing technology was used to analyze the diversity and community structure of rhizosphere microorganisms in maize and soybean under modes 1, 2, and 3, determine their production traits, and perform correlation analysis between the two. To provide theoretical basis for maize and soybean strip planting and soil health, and achieve sustainable agricultural development.
The experimental materials were Tianyu 108 corn and Zhonglian bean1505, as shown in Table 1.
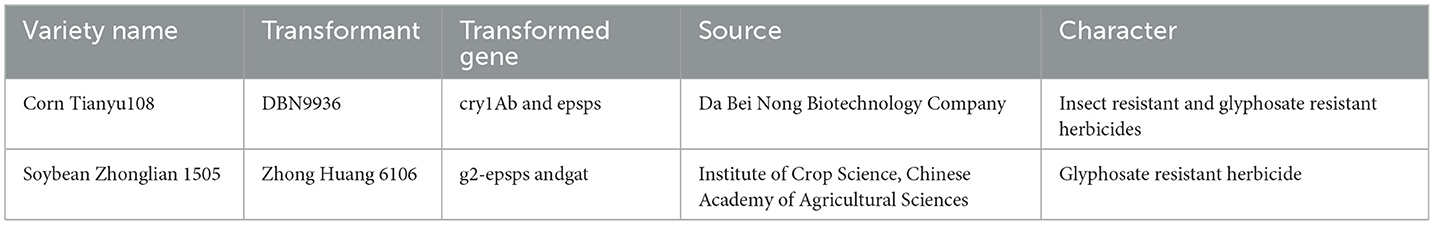
Table 1. Detailed information of experimental materials.
The experimental site was located in Tumen Gacha, Ergetu Town, Keyouqian Banner, Xing'an League, and Inner Mongolia. The geographical location was 46 ° 15'50.35 “N, 122 ° 24'17.35” E, with an altitude of 296 meters. It belongs to a temperate continental monsoon climate, with sufficient sunshine and an average annual temperature of 4.2°C. The terrain was characterized by shallow mountains and hills, high in the north and low in the south. The frost free period in 2022 is 142 days, and the rainfall during the growth period is 316 millimeters. The average temperature in summer ranges from 13 to 26°C, with an active accumulated temperature of 2872.6°C. Soil was mainly composed of black calcareous soil and chestnut calcareous soil, with a pH value of neutral or slightly alkaline. Organic matter (34.76 g/kg), total nitrogen 3.437 g/kg, total potassium 2.22%, alkaline nitrogen 0.253 g/kg, available phosphorus 0.021 g/kg, and available potassium 0.089 g/kg.
Liu (2016) research has found that when the bandwidth is 200 cm, the row spacing between soybean and corn is 60 cm, and the row spacing between soybean and soybean is 40 cm, the land equivalent ratio of corn soybean strip composite planting can reach 1.42. Based on the local characteristics, corn and soybean strip planting Modes 1, 2, and 3 have been established.
Mode 1 set as: 2 rows of corn and 4 rows of soybean, with a width of 2.70 meters for multiple cropping, a row spacing of 0.40 meters for corn, a density of 7–9 plants/square meter, and a plant spacing of 0.09–0.10 meters. The row spacing of soybeans was 0.30 meters, the plant spacing was 0.06 meters, the planting density of 28 plants/square meter and the strip spacing between corn and soybeans was 0.70 meters.
Mode 2 set as: 2 rows of corn and 3 rows of soybeans, with a width of 2.20 meters for multiple cropping, a row spacing of 0.40 meters for corn, a density of 7–9 plants/square meter, and a plant spacing of 0.11–0.12 meters. The spacing between soybean rows was 0.30 meters, the spacing between plants was 0.06 meters, planting density of 28 plants/square meter and the spacing between corn and soybean bands was 0.60 meters.
Mode 3 set as: 4 rows of corn and 6 rows of soybeans. Corn was planted in narrow and wide rows with a spacing of 0.40 meters between narrow rows and 0.80 meters between wide rows, with a density of 6–7 plants/square meter and a spacing of 0.09–0.11 meters between plants. Soybeans adopt double seedling belts on ridges, Soybeans adopt double seedling belts on ridges, plant spacing of 0.06 meters, with row spacing is 0.10–0.12 meters and a ridge spacing of 0.60 meters, planting density of 28 plants/square meter. The distance between the corn belt and the soybean belt was 0.60 meters; The width of corn is 2.40 meters, the width of soybeans is 3.60 meters, and the total width is 6.00 meters.
Soil sampling and treatment: WHY for corn and WHD for soybeans (W represented the abbreviation of the experimental site; H represents strip planting, Y represented corn and D represented soybeans). Due to the shorter growth period of soybeans compared to corn, specific sampling periods were selected based on the growth stage of soybeans to ensure that the sampled products were divided into seedling stage (627), flowering stage (728), and podding stage (819) during the growth period of both crops. There were a total of 9 combinations, each with 3 replicates. The specific numbers are shown in Table 2. Sample number 627 with table on June 27th is the seedling stage of the crop, sample number 728 with table on July 28th is the flowering stage of the crop, sample number 819 with table on August 19th is the podding stage of the crop. Soybeans and corn have been processed separately.
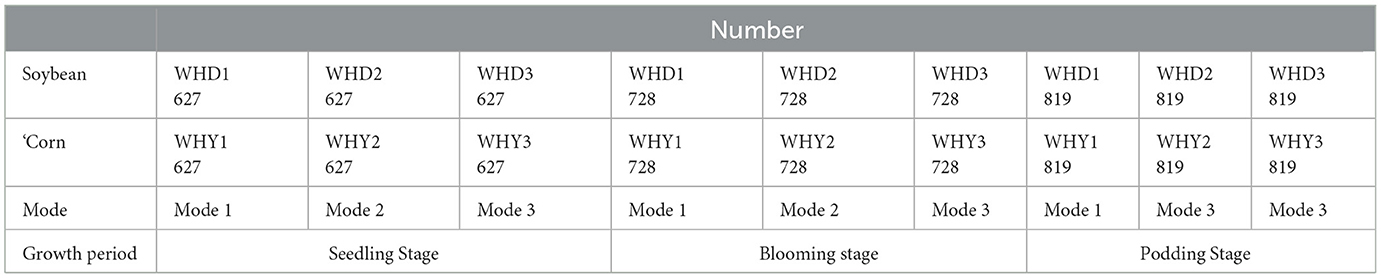
Table 2. Sampling numbers for corn and soybean strip planting.
To ensure that the DNA source in the sampled soil was from rhizosphere soil microorganisms, dead branches and fallen leaves were removed from the ground and surface soil. Soil samples from corn and soybean roots were processed separately. The specific details were to excavate the soil at a depth of 10–20 centimeters from the plant roots and shake it to remove large pieces of soil and debris. Then, by vigorously shaking the root system and using flame disinfection forceps to scrape off a thin layer of soil (<0.1 cm) attached to the crop root system, a sterile 0.2 cm sieve was used as a sample to screen the rhizosphere soil samples were placed in sterile bags and sent to Nanjing Jisihuiyuan Biotechnology Co., Ltd. for DNA extraction and high-throughput metagenomic sequencing.
DNA extraction was performed using the HiPure universal DNA extraction kit.
Metagenomes were sequenced using shotgun sequencing.
The production performance of corn:
The number ears (ear/m2): the total number of ears actually harvested per unit area, counted at harvest.
Ear weight (kg): The total harvested ear weight per unit area, measured using an electronic platform scale with an accuracy of 0.05.
20Axle weight (kg): Weigh the axle weight of 20 ears after threshing using an electronic platform scale with an accuracy of 0.05.
Seed yield (%): Seed yield (%) = [20 ear weight (kg) - axle weight (kg)]/20 ear weight (kg).
Moisture: moisture meter was used to measure the moisture content of seeds during harvest, with three measurements taken for each treatment and the average value taken.
Yield (kg/hm2): Yield (kg/hm2) = panicle weight (kg) /unit harvest area (hm2) × 10000 × Seed yield (%) × [1–Moisture (%)] ÷ (1–14%) (14% was the default moisture value for corn).
The production performance of soybeans:
Two square meters of plants: avoiding the boundaries of planting areas, a 5-point sampling method was adopted, with a sampling area of 2 square meters per point. Calculate the actual number of plants received within 2 square meters.
Plants per square meter: Plants per square meter = Plants per square meter =2 square meters of plants/2.
Number of grains per plant: within a sampling area of 2 square meters, three complete plants were randomly selected and the average number of grains per plant was calculated.
100 seeds weight (g): 100 seeds were randomly selected and weighed using an electronic platform scale with an accuracy of 0.05 g, and the average value was taken three times.
Moisture content (%): Use a moisture meter to measure the moisture content at harvest, measure 3 times for each treatment, and take the average value.
Theoretical yield (kg/hm2): number of plants per square meter × 1000 × number of grains per plant × Weight of 100 grains (g) × 10−5 × 0.9 (0.9 was the coefficient of theoretical yield).
The brief steps of raw data processing included sample DNA library construction, bridge PCR, high throughput genome sequencing. Firstly, the sequencing data is optimized through filtering and quality pruning to improve the quality and accuracy of data. Then, Megahit splicing software (version: v1.2.9) is used to splice and assemble the clean sequence according to different KMER sizes. Then, the predicted gene sequences were clustered using CD-HIT software (version 4.8.1 CD HIT set specifically designed for metagenomes), with a default identity of 95% and a coverage rate of 90%. Selecting the longest sequence as the representative sequence to construct an initial non redundant gene set to avoid fragmentation and prevent information loss. Compare the Clean Data of each sample with the initial non redundant gene set using BWA (version 0.7.71), and count the number of gene reads and gene abundance information for each sample in the corresponding sample comparison. Select genes with a reading of ≤2 from each sample to obtain the final non redundant gene set. Use Kraken (version 2.1.2) software to annotate the sequencing sample data and obtain species classification and abundance information. Compare Unigenes with KEGG functional database using DIAMOND software (version 2.0.6) (blast, evaluation ≤ 1e-5) and provide functional annotations. ANOVA using SPSS 17.0 and correlation analysis using Paisennuo's cloud platform (P < 0.05).
Table 3 shows the original data, with the meanings represented by each column. Sample ID: sample name; Read Number: The total number of pair end reads in Clean Data; Number: Assembly sequence number Base Number: Clean Data total base number; A (%): The proportion of A bases; C (%): The proportion of C bases; G (%): The proportion of G bases; T (%): The proportion of T bases; GC (%): The GC content in Clean Data, which refers to the percentage of G and C bases in Clean Data to the total number of bases; Q30 (%): The percentage of bases with a Clean Data quality value ≥30. Table 4 shows the number of non-redundant genes among groups.
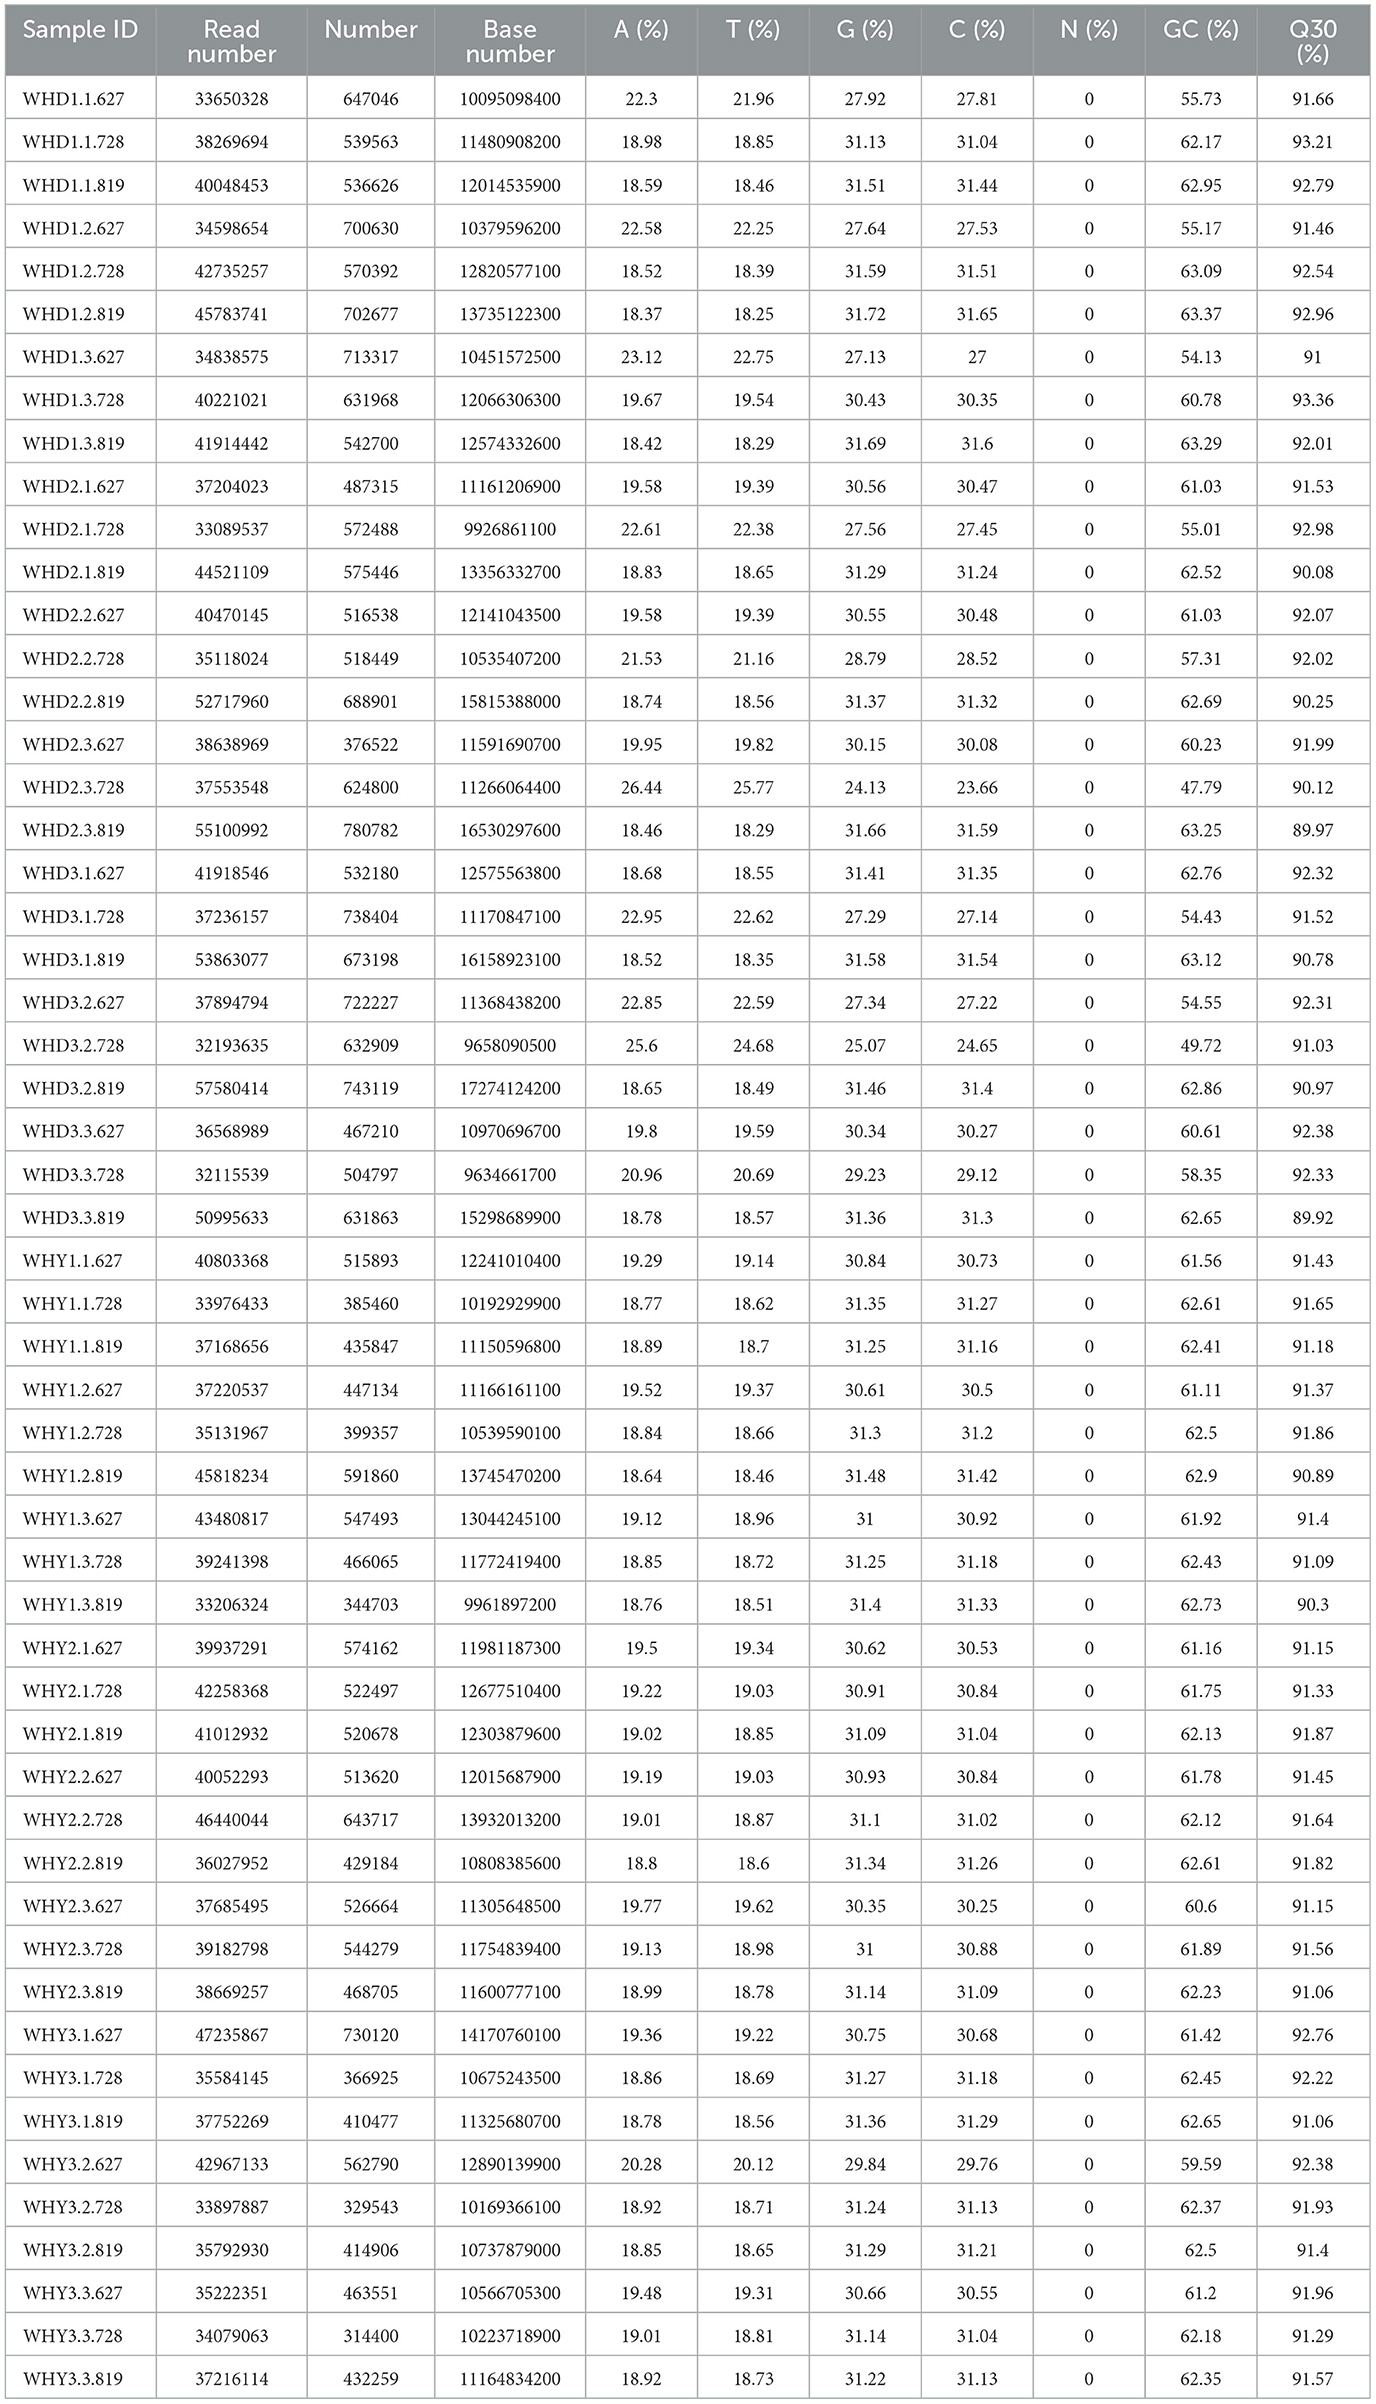
Table 3. Statistical table for evaluation of sample sequencing data.
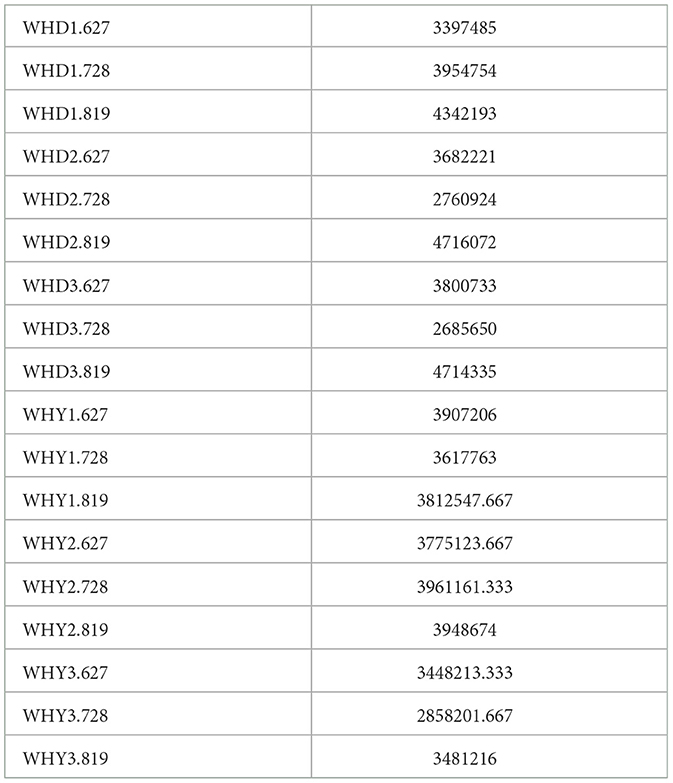
Table 4. Number of genes between groups.
This study measured that there are four communities of rhizosphere microorganisms under strip planting mode: bacteria, fungi, viruses, and archaea. Differences in community structure of rhizosphere microorganisms at the phylum level among different planting modes. Corn rhizosphere viruses at the phylum level (Figure 1A) showed during the flowering period, the virus abundance in Mode 2 was the highest and showed a significant difference from Mode 1, while there was no difference between Modes 2 and 3. During the podding stage, the virus abundance in mode 1 is the highest, with a significant difference from modes 2 and 3. There is no difference between modes 2 and 3. At the phylum level (Figure 1A), among the three planting modes, there was no significant difference in the virus abundance of soybean at each growth stage. During the peak flowering period of corn, the virus abundance in Mode 2 is the highest, significantly higher than that in Mode 1. During the podding stage, the virus abundance in Mode 1 is the highest, and there is a significant difference compared to Modes 2 and 3. There is no significant difference between Modes 2 and 3. At the phylum level (Figure 1B), Mode 2 showed higher bacterial abundance in corn at all growth stages compared to other modes. There is a significant difference between the peak flowering period and Mode 3. During the flowering period, the abundance of phylum bacteria in soybean in Mode 2 was lower than that in other planting modes, and there was no significant difference in the abundance of phylum bacteria among the three modes during the pod setting period (Figure 1B). During the corn seedling stage, there was no significant difference between Mode 1, Mode 2, and Mode 3, but Mode 1 had a higher abundance of archaea. During the flowering period, there was no difference in the abundance of archaea among the three modes. During the pod setting period, the abundance of archaea in Mode 3 corn is lower than that in the other two models. There was no difference in the abundance of archaea among the three soybean seedling stages. Mode 3 during the peak flowering period is significantly lower than Mode 1. The abundance of archaea in pod setting Mode 2 was not significantly different from the other two modes, but higher than the other two planting modes (Figure 1C). At the phylum level, there was no significant difference in fungal abundance between corn and soybean rhizosphere fungi under different planting modes and periods (Figure 1D).
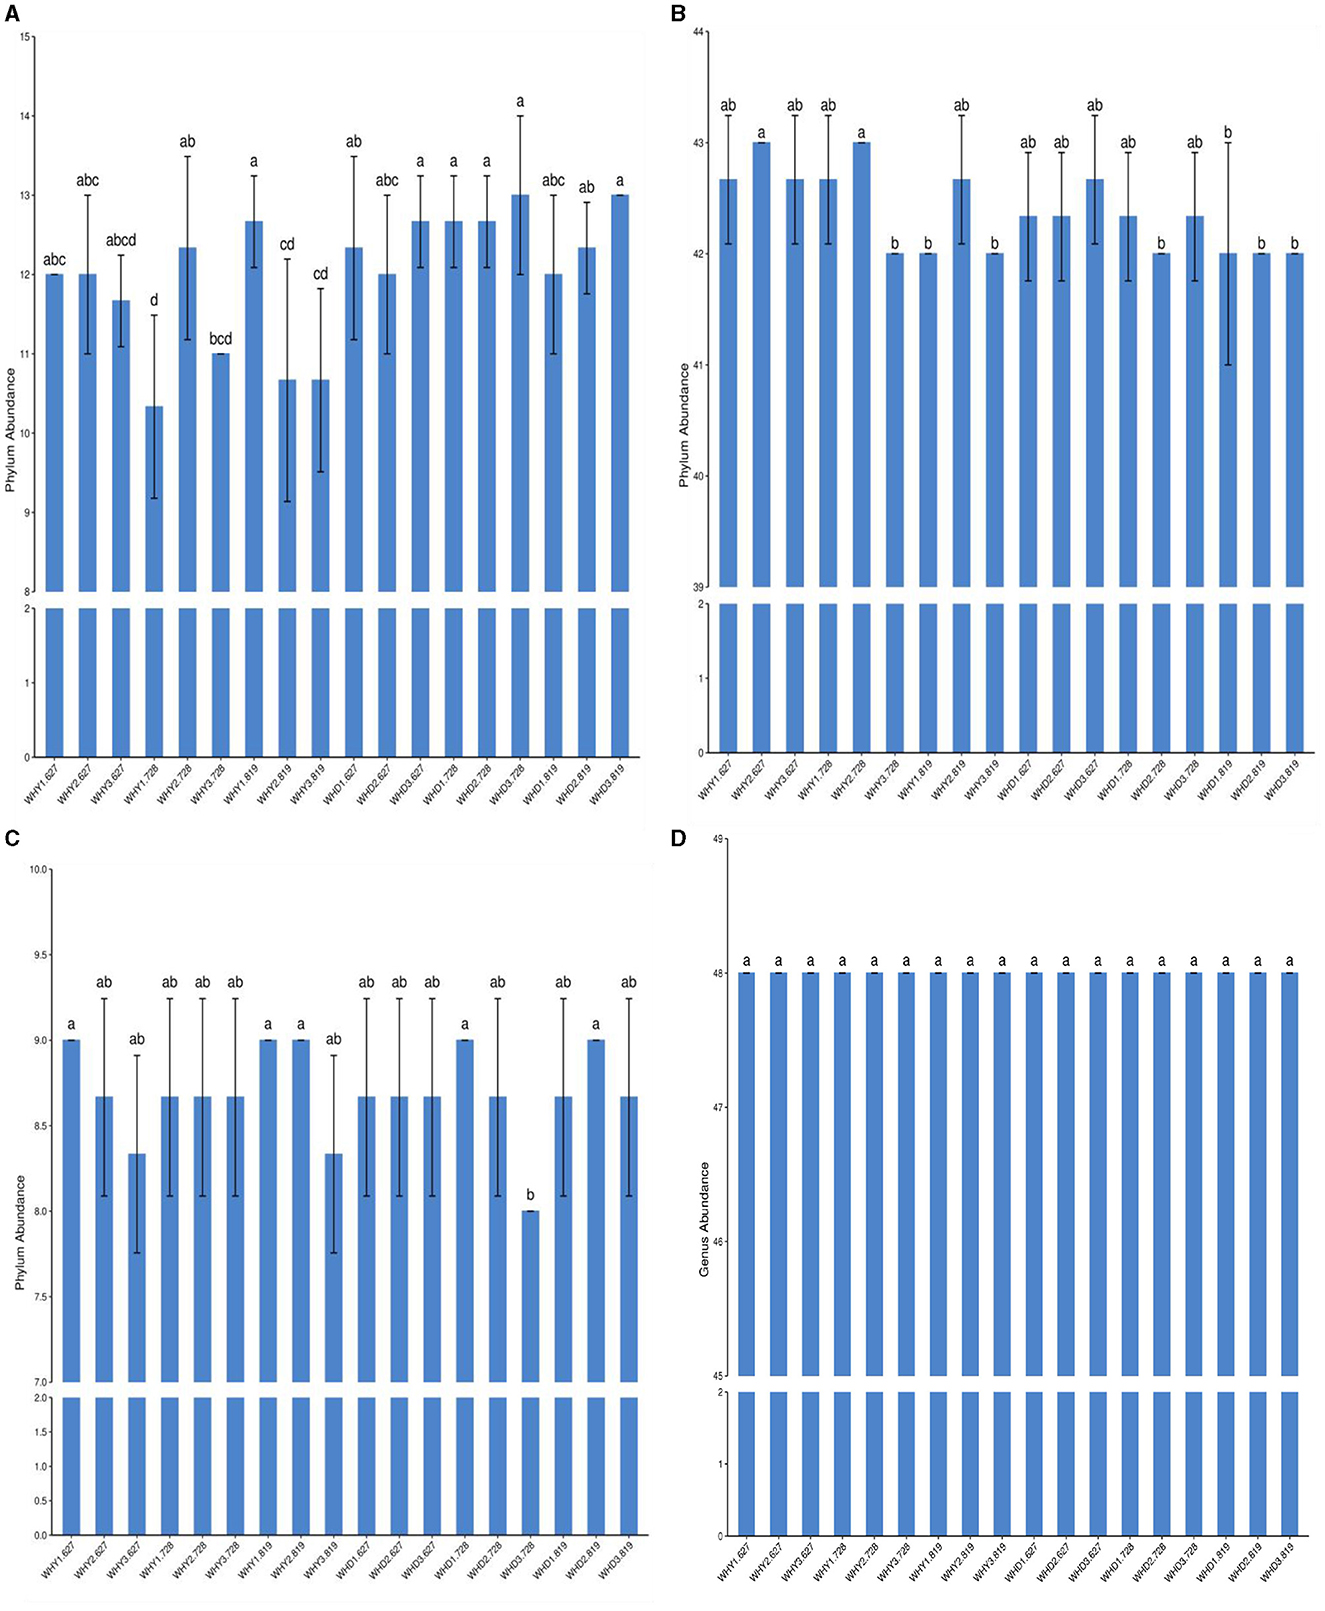
Figure 1. Horizontal differences in rhizosphere microbial communities between groups. a, in the figure: virus; b, bacteria; c, archaea; d, fungi. At the phylum level (A), the abundance of corn rhizosphere viruses was highest in Mode 2 during the peak flowering period, and there was a significant difference compared to Mode 1. At the phylum level (B), the total bacterial count of corn rhizosphere bacteria was highest in Mode 2 during the three stages, but there was a significant difference compared to Mode 1 and Mode 3 during the seedling and pod stages. At the phylum level (C), the abundance of soybean rhizosphere archaea was basically the same in the seedling stage. At the phylum level, there was no significant difference in the abundance of corn and soybean rhizosphere fungi among different planting modes and stages (D).
From Figure 2, it can be seen that there are differences among different microorganisms in different groups, including bacteria, archaea, and viruses. At the genus level (Figure 2A), compared to other planting modes, the abundance of corn rhizosphere viruses is highest in seedling stage mode 3 (Figure 2A), but the differences among the three modes are not significant. There were significant differences among the three modes during the blooming period, with Mode 2 > Mode 1 > Mode 3. During the podding period, Mode 2 had the highest abundance and was significantly higher than Mode 1, but there was no significant difference between Mode 3 and Mode 1. Soybean rhizosphere virus during the seedling stage, Mode 3 had the highest level. There was no significant difference among the three modes during the blooming period, but Mode 1 had the highest. There was no significant difference among the three modes during the podding stage, but Mode 3 had the highest. At the genus level (Figure 2B), the bacteria in the corn rhizosphere were the most abundant in Type 2 during all three periods. There was no significant difference among the three modes during the seedling stage, but Mode 2 had the highest; During the flowering period, Mode 1 and Mode 2 were significantly higher than Mode 3, but the difference between Mode 1 and Mode 2 was not significant. During the podding period, Mode 2 was higher than Mode 1 and Mode 3, but the differences among the three modes were not significant. At the genus level (Figure 2B), soybean rhizosphere bacteria in seedling stage Mode 3 were significantly higher than Mode 2, but there was no significant difference compared to Mode 1, and there was no significant difference between Mode 1 and Mode 2. During the flowering period, Mode 1 was significantly higher than Modes 2 and 3, but the difference between Modes 2 and 3 was not significant. There is no significant difference among the three modes during the podding stage.
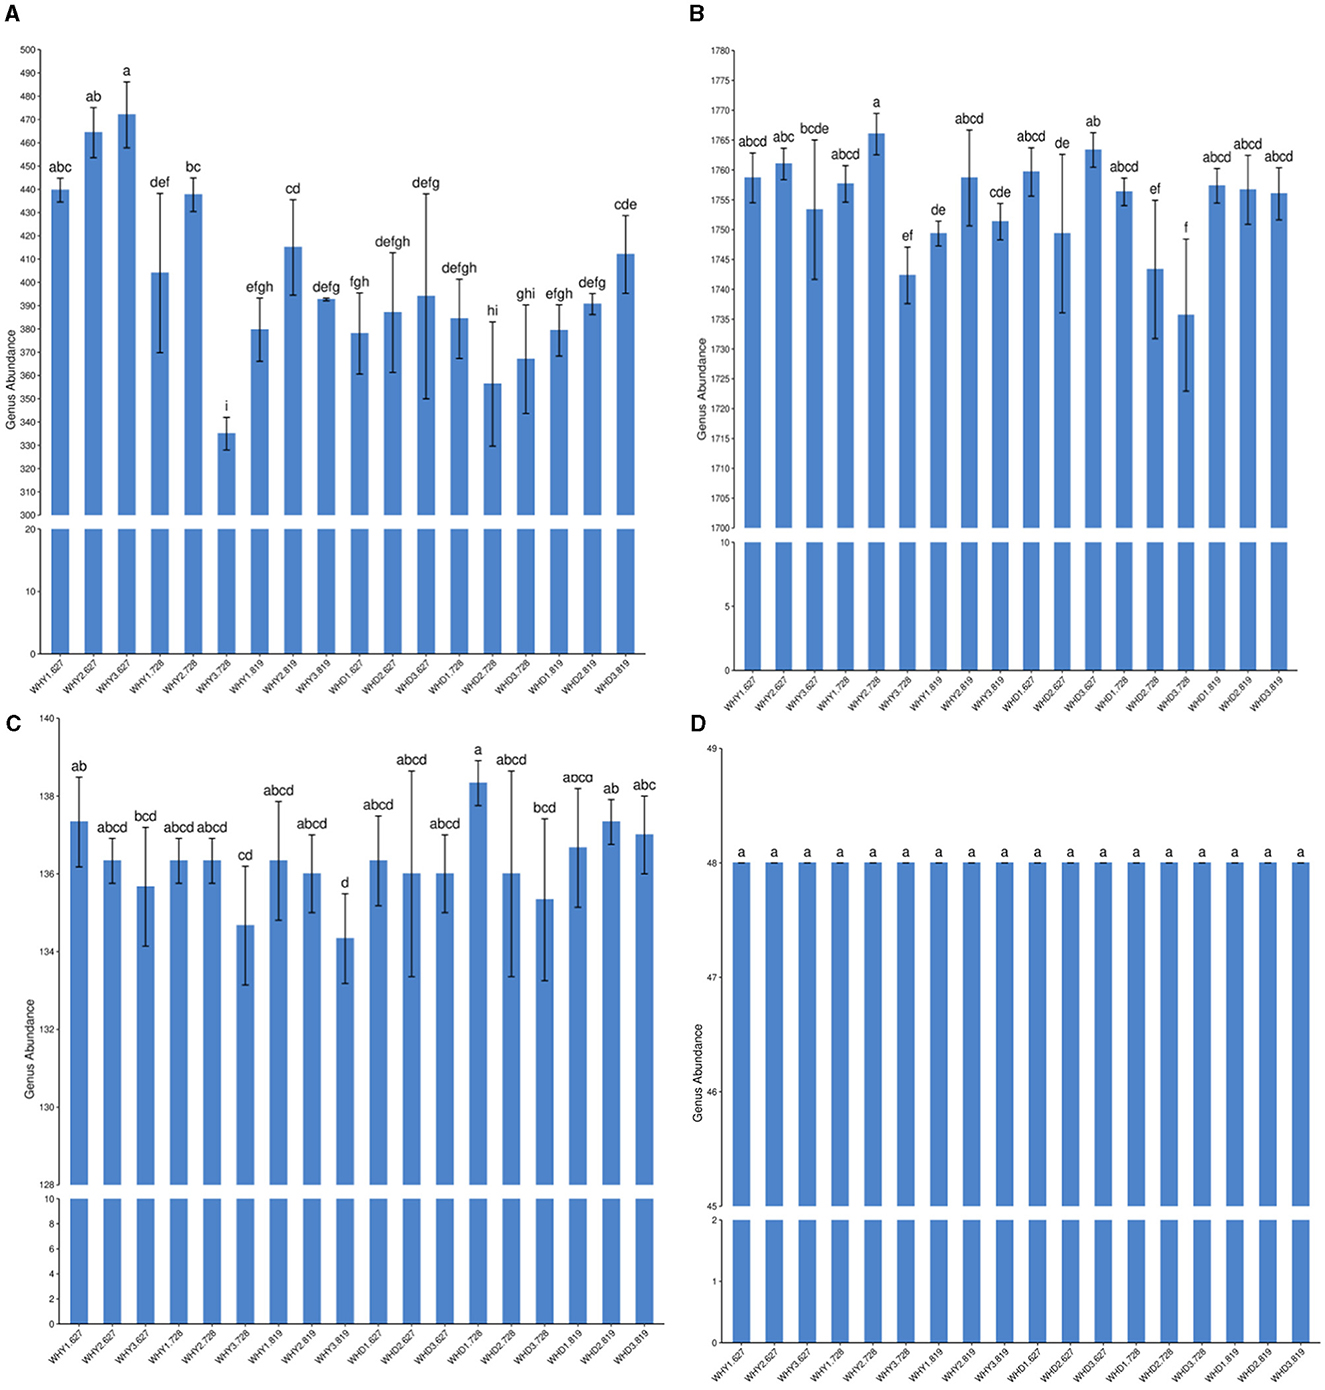
Figure 2. Differences in the Genus Levels of Rhizosphere Microbial Communities between Groups. a, in the figure: virus; b, bacteria; c, archaea; d, fungi. At the genus level (A), the abundance of maize rhizosphere viruses is highest in seedling stage mode 3, with significant differences compared to other modes, At the genus level (B), the bacteria in the maize rhizosphere were the most abundant in Type 2 at all three stages; At the genus level (B), the rhizosphere bacteria in soybean showed significantly higher levels in mode 3 during the seedling stage compared to mode 2, At the genus level, there was no significant difference among the three patterns of corn rhizosphere archaea in the three stages, but the abundance of pattern 3 was the lowest.
At the genus level, there were no significant differences among the three patterns of corn rhizosphere archaea in the three stages, but the abundance of Mode 3 was the lowest. At the genus level, there were no significant differences among the three patterns of soybean root soil archaea in the three stages. There was no significant difference in the abundance of archaea among the three modes during the seedling and pod stages of soybean. However, during the peak flowering period, Mode 1 is significantly higher than Mode 3 (Figure 2C). There was no significant difference in fungal abundance between corn and soybean in different planting modes and periods (Figure 2D).
Alpha diversity analysis refers to the method of evaluating the diversity of microbial communities within an individual sample. Usually, the diversity evaluated by this method includes species richness and species evenness. Typical Alpha diversity indices include Shannon index, Simpson index, Chao1 index, etc. These indices describe the degree of species diversity in a single sample by calculating information such as microbial species types and relative species abundance. Observed specifications mainly calculate the number of organisms included in a community. The Good coverage index mainly refers to the coverage rate of microorganisms. The larger the value, the less likely it is that the biological information in the sample has not been detected. This index can actually reflect whether the measured results represent the true situation of the sample. The Simpson index is a commonly used ecological index used to measure the richness and evenness of species diversity. The higher the Chao1 index, the greater the species richness. The larger the Shannon index, the more species there are. In this study, the ace index, chao1 index, and Shannon index of rhizosphere microorganisms in corn planted in seedling stage Mode 1 were higher than those in other modes during the same period. The ace index and chao1 index of rhizosphere microorganisms in soybean planting Mode 3 and corn planting Mode 2 during blooming stage were higher than those in other modes during the same period. The ace index, chao1 index, and Shannon index of rhizosphere microorganisms in soybean planting Mode 1 during the blooming period were higher than those in other modes. The ace index of rhizosphere microorganisms in corn planted in podding stage Mode 2 was higher than that in other modes during the same period. Goods_coverage index of WHY3.728 is significantly smaller than other groups.
However, except for the significant differences between the WHY3.728 indices and other components, and between the WHD2.728 and WHD3.728 indices and other components, all other differences are not significant (Table 5).
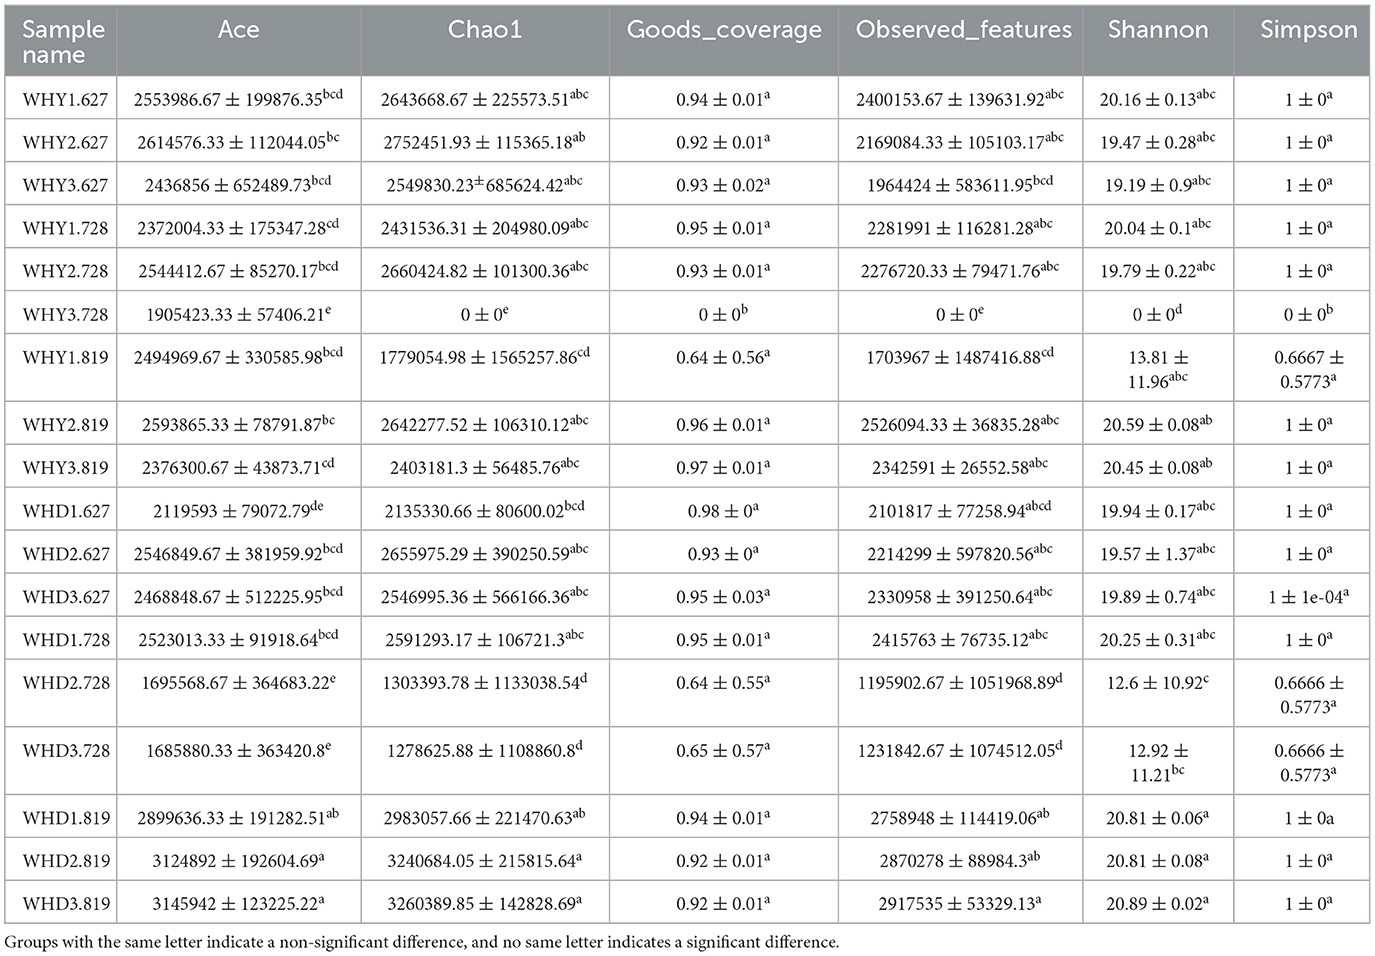
Table 5. Microbial communities in the rhizosphere between groups alpha diversity analysis.
The response of rhizosphere microorganisms at the phylum level to different planting modes are shown in the profiling bar chart in Figure 3A. Pseudomonas, Actinobacteria, Bacteroidota, and Myxococcota are all dominant phyla in the rhizosphere soil of soybean and corn under different strip planting patterns. During various stages of growth, the relative abundance of Pseudomonas is the highest. Under the three planting modes, there was no specific pattern of changes in Pseudomonas, Actinobacteria, and Bacteroidota. During the seedling and pod stage, the abundance pattern of Pseudomonas in the corn rhizosphere is Mode 3 > Mode 2 > Mode 1, while the abundance pattern of Actinobacteria is exactly the opposite. During the flowering period, the abundance of Pseudomonas aeruginosa in Mode 3 is the lowest. The abundance of Pseudomonas during the flowering and podding stages of soybeans is Mode 3 > Mode 2 > Mode 1, while the abundance of Actinobacteria is the opposite. During the seedling stage, the abundance of Pseudomonas in the rhizosphere of Mode 1 was the highest. The abundance of actinomycetes in the rhizosphere of Mode 3 is the highest.
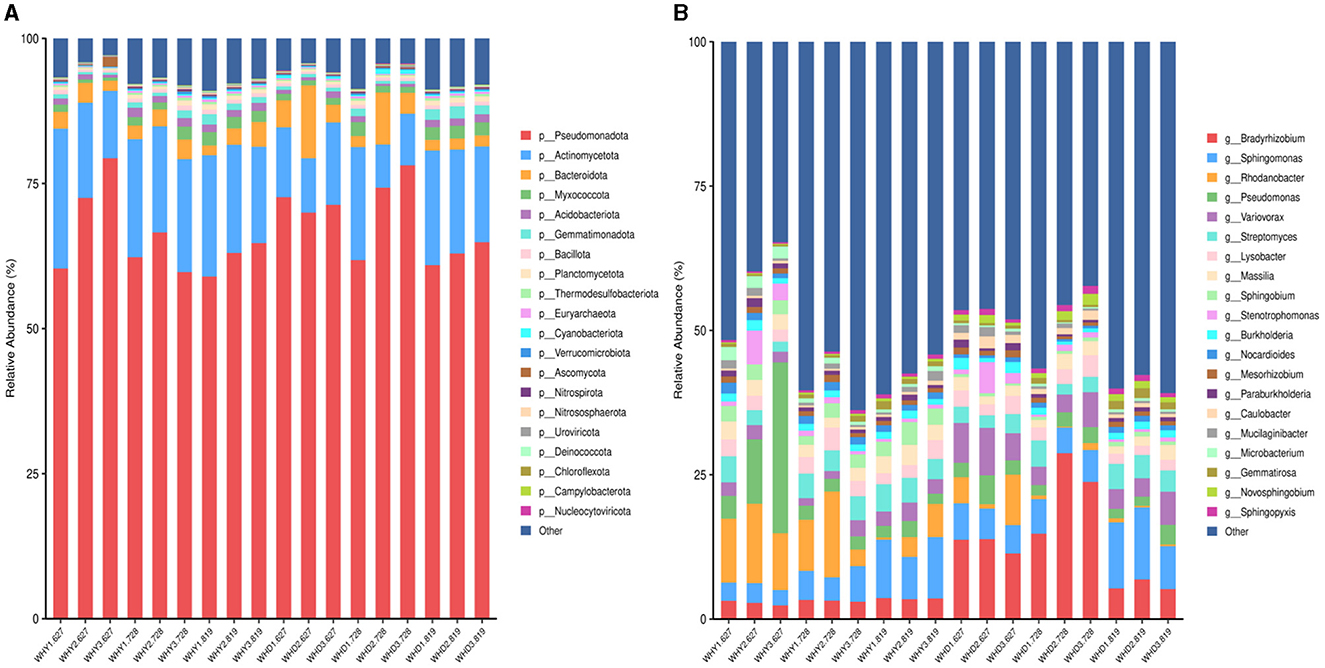
Figure 3. Bar chart of microbial community species profiling between groups. (A) in the figure refers to the level of the door; (B) Genus level.
The differences in microbial communities in the rhizosphere of crops under different planting modes at the genus level are shown in the rofiling bar chart in Figure 3B. A total of 20 main bacterial genera (relative abundance >1%) were detected in the rhizosphere of corn and soybean under three banded planting modes, including Bradyrhizobium, Sphingomonas, Rhodanobacter, and Pseudomonas, Variovorax and Streptomyces are both dominant genera in soybeans and corn.
The relative abundance of Bradyrhizobium in the rhizosphere of soybean follows this pattern: flowering stage > seedling stage > podding stage. With Mode 2 having the highest abundance in each growth stage; The relative abundance of Bradyrhizobiumin the three growth stages of corn rhizosphere is similar, but the content is relatively low. The relative abundance of Rhodanobacter genus is relatively high during the flowering and seedling stages of maize, during these two periods, the abundance of Mode 2 was higher. Except for Mode 3 and Mode 1 during the seedling stage, the abundance in the soybean rhizosphere is relatively low. During the seedling stage, the abundance of Pseudomonas genus in corn is higher than that in other stages of maize, and soybeans planted under Mode 3 of seedling stage have a higher abundance of Pseudomonas genus.
The top 20 phylum clustering of rhizosphere microbial communities in different planting patterns at the phylum level is shown in Figure 4. A total of 18 samples are clearly clustered into 2 major categories, and each major category is further clustered into three sub categories. In each group, the main dominant bacteria are Pseudomonas, Actinobacteria, and Bacteroidetes in order. The top 20 genus clustering heatmap of the differences in rhizosphere microbial communities at the genus level among different planting modes is shown in Figure 5. Pseudomonas has a relatively high abundance in WHD2.728, WHD3.728, WHD1.728, WHD2.627, WHD3.627, and WHD1.627, and the distance between WHD2.728 and WHD3.728, WHD1.728 and WHD2.627, WHD3.627 and WHD1.627 is relatively close. The abundance of Pseudomonas in WHD2.819, WHD1.819, WHY1.819, WHD3.819, WHY2.819, WHY3.728, and WHY3.819 is relatively high, and the distance between WHD2.819 and WHD1.819 is also relatively close. At the genus level, 18 samples were clustered into two categories, WHY3.627 alone, and the other groups were in the same category.
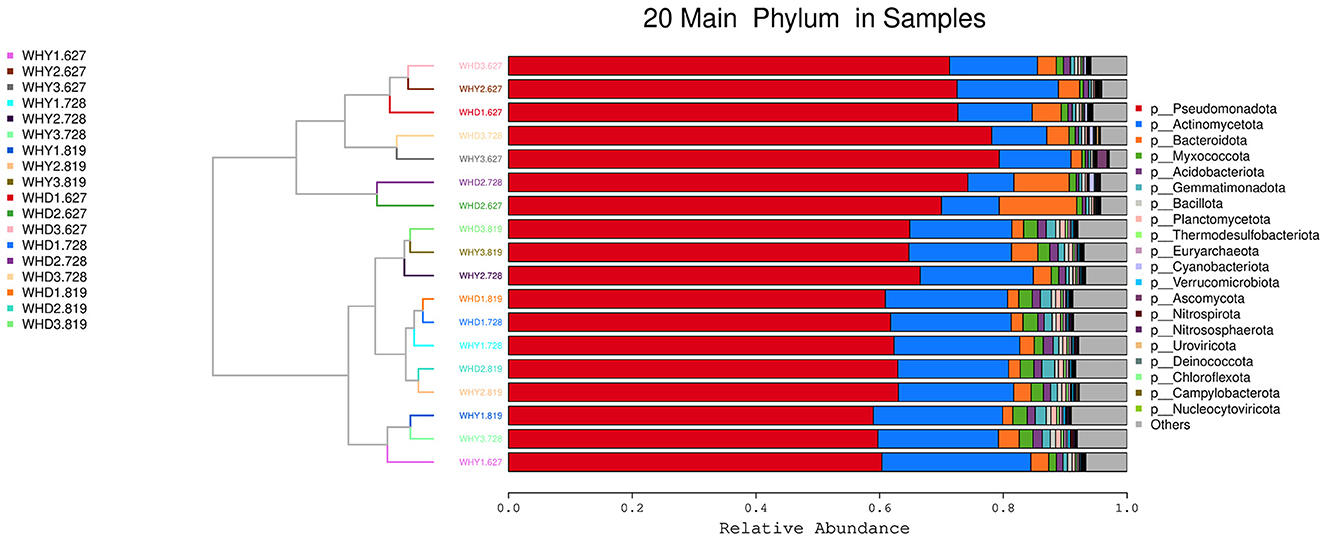
Figure 4. Top 20 species clustering diagram at the phylum level among groups.
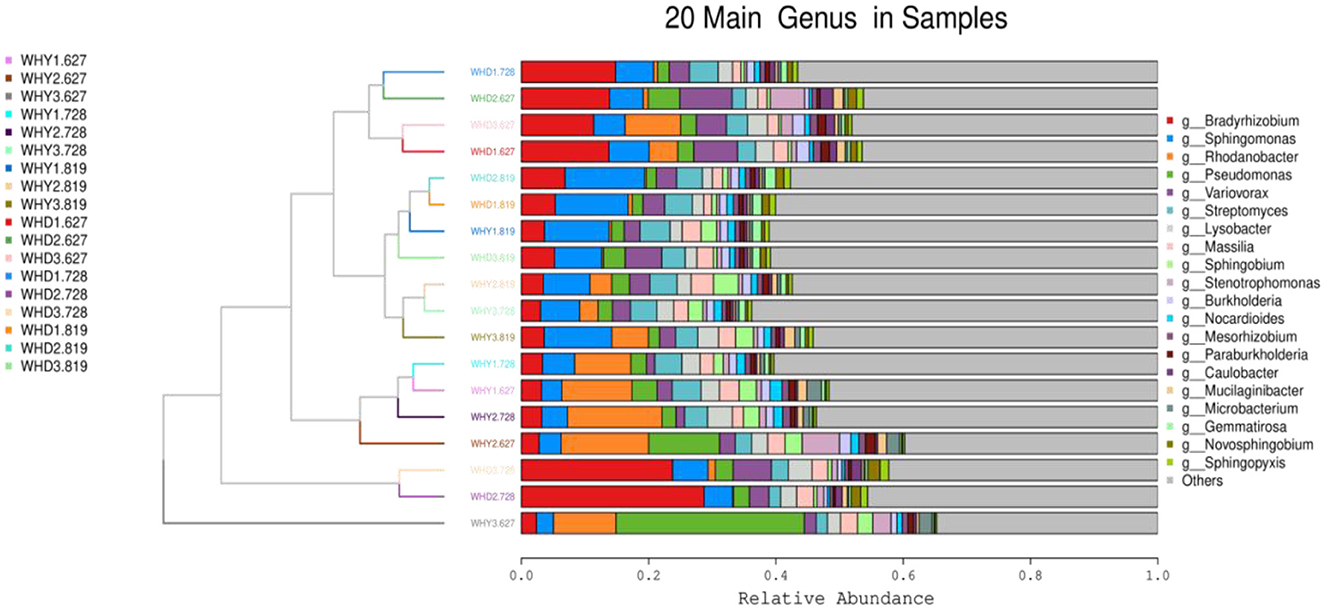
Figure 5. Top 20 species cluster diagram at genus level among groups.
Based on the KEGG database, the gene annotation results of rhizosphere microorganisms under different planting modes are shown in Figure 6. The relative abundance under 9 treatments is from high to low, followed by cellular processes, human diseases, and organic systems. The relative abundance of KEGG functional annotations at level 1 is shown in Figure 6, which shows that at level 1 (Figure 6A), six metabolic pathways are enriched, including metabolism, environmental information processing, cellular processes, genetic information processing The functional systems related to human diseases and organic systems did not show significant changes between different groups. Among them, metabolism has the highest abundance in each group and the lowest abundance in the biological system. Among them, metabolism has the highest abundance in each group and the lowest abundance in the biological system. At the second level (Figure 6B), the metabolic pathways enriched to the top 10 in abundance include carbohydrate metabolism, amino acid metabolism, signal transduction, energy metabolism, cofactor and vitamin metabolism, cell community prokaryotes, membrane transport, lipid metabolism, nucleotide metabolism, and other amino acid metabolism. Among them, carbohydrate metabolism has the highest gene abundance, followed by amino acid metabolism, and other amino acid metabolism has the lowest gene abundance.
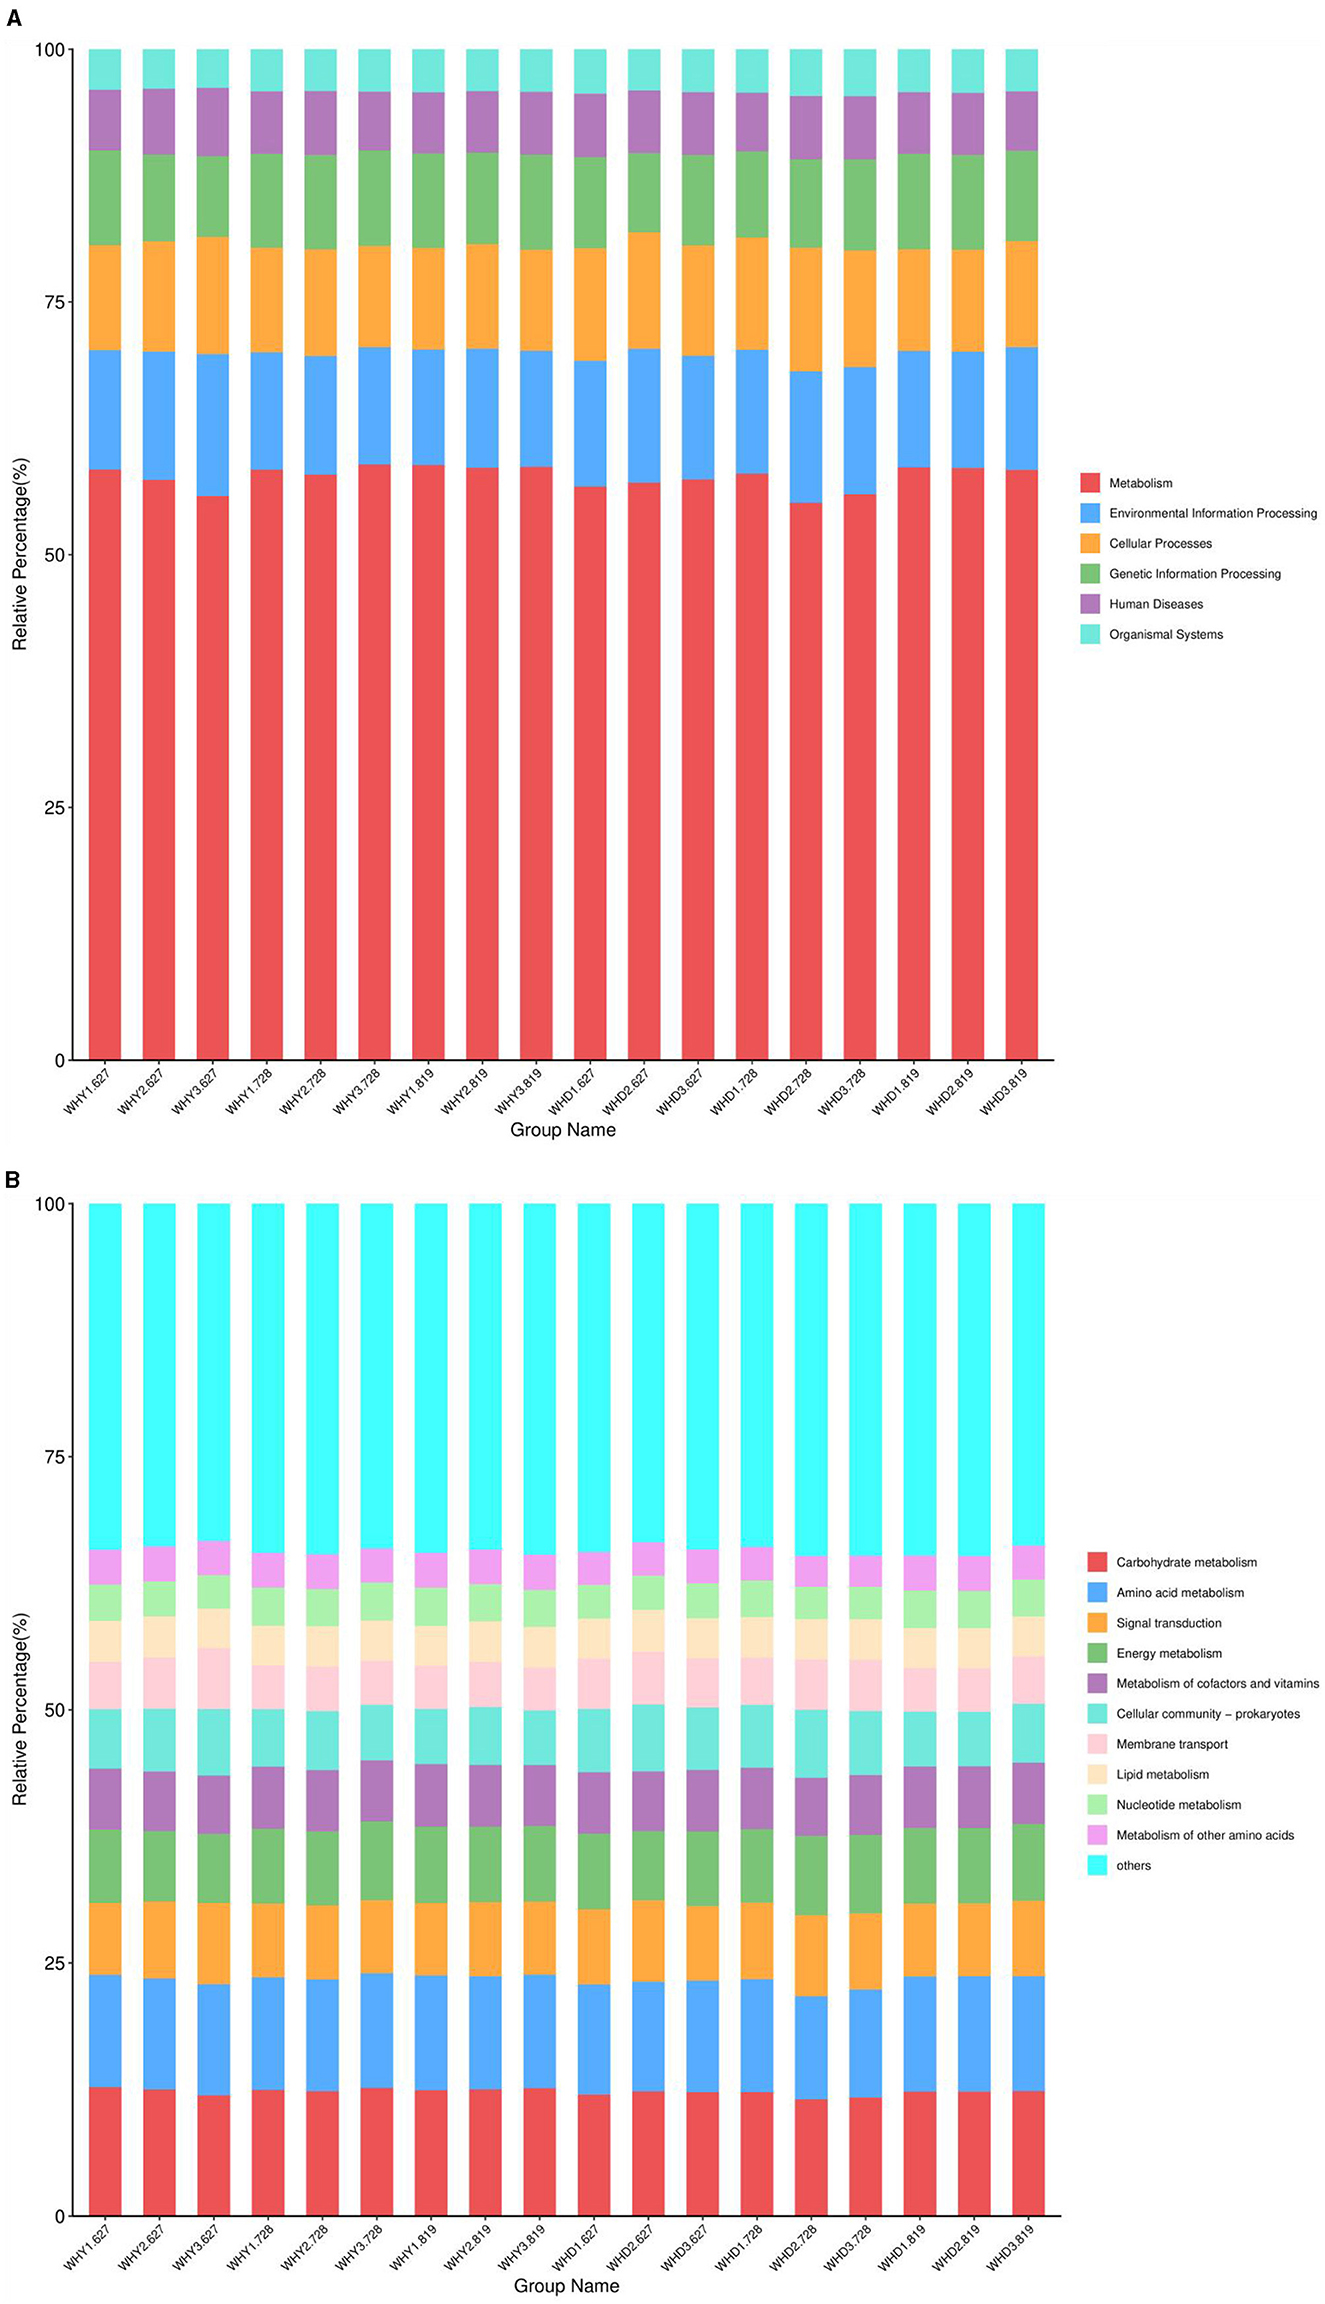
Figure 6. Relative abundance bar chart of KEGG functional annotations at level 1 (A) and level 2 (B).
Based on KEGG data analysis, select the top 35 functional genes with abundance ranking and their abundance information in each group to draw a heatmap, and perform cluster analysis from the perspective of functional differences (Figure 7). For the rhizosphere of corn seedlings, K06147 (ABCB-BAC) has the highest abundance in Mode 1, while K02014 (iron complex outer membrane receptor protein) has the highest abundance in Mode 2; The highest abundance in Mode 3 is K03406mcp (methyl receptor chemotactic protein). For the rhizosphere of corn at its peak flowering stage, the highest abundance in both mode 3 and mode 2 is K00525 (E1.17.4.1A, nrdA, nrdE). For the rhizosphere of corn during the podding stage, both Mode 3 and Mode 2 have the highest abundance of K01322 (proliyl oligopeptidase). For the rhizosphere of soybean seedlings, K01652 (E2.2.1.6L, ilvB, ilvG, ilvI; acetyllactate synthase I/II/III major subunit [EC: 2.2.1.6]) has the highest abundance in Mode 1, while K21573 (susC; TonB dependent starch binding outer membrane protein SusC), K20276 (bapA; large repeat protein), and K00059 (fabG, OAR1; 3-oxoacyl - [acyl carrier protein] reductase [EC: 1.1.100]) have the highest abundance in Mode 2. For the rhizosphere of soybean at its peak flowering stage, the highest abundance in Mode 1 is K02035 (peptide/nickel transport system substrate binding protein), and the highest abundance in Mode 2 is K03046 (rpoC; deoxyribonucleic acid polymerase) β The subunits [EC: 2.7.7.6] have the highest abundance in Mode 3, with K01652, K07497 (putative transposase), and K03469 (rnhA, RNASEH1; ribonuclease HI [EC: 3.1.26.4]). For the rhizosphere of soybean during the podding stage, the enriched gene abundance is relatively low, with K006147 having the highest abundance in Mode 1, K01652 having the highest abundance in Mode 2, and K0189 having the highest abundance in Mode 3.

Figure 7. KEGG based clustering heatmap of TOP35 functional gene abundance among different groups.
Under different belt planting modes, there was no significant difference in corn axial weight and water content. Mode 3 had more ears, which was significantly different from Mode 2 and Mode 1. Mode 1 has a higher seed yield and is significantly different from the other two modes. Mode 1 and Mode 2 have higher yields, with significant differences compared to Mode 3 (Table 6).
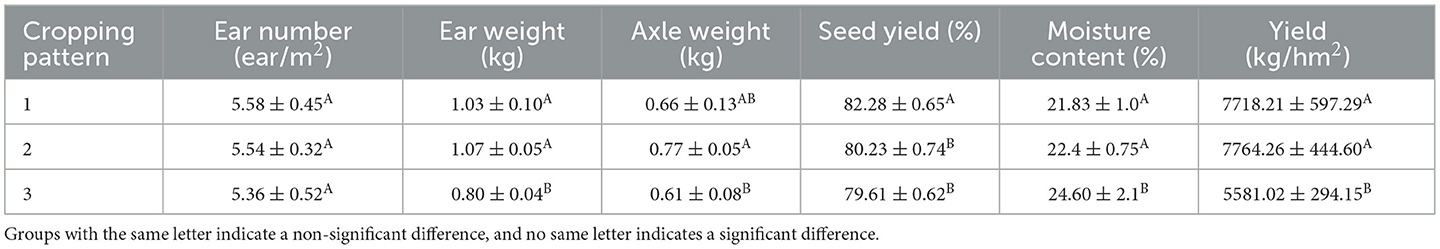
Table 6. Measurement of corn production performance under different belt planting patterns.
Under different strip planting modes, there was no significant difference in 100 seed weight and water content of soybeans. Mode 3 had more plants per square meter, trees per square meter, and seeds per plant, which were significantly different from Mode 2 and Mode 1. The yield of Mode 3 is significantly higher than that of Mode 1, and the yield of Mode 1 is significantly higher than that of Mode 2 (Table 7).
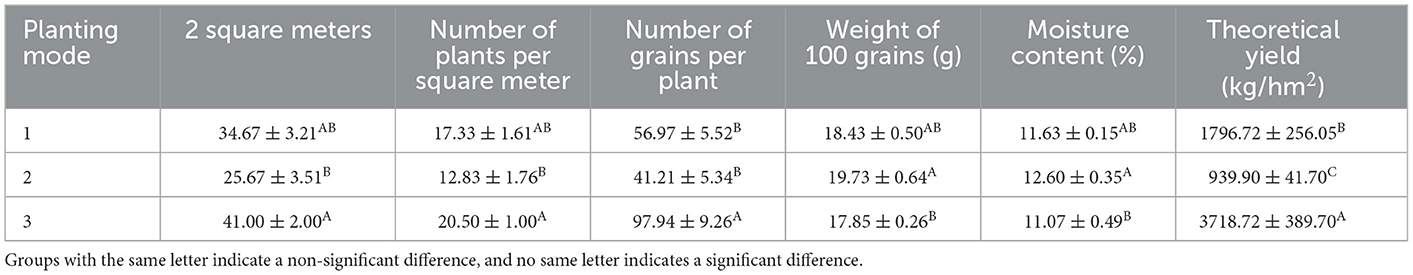
Table 7. Measurement of soybean production performance under different belt planting patterns.
To clarify whether the microbial community structure is truly related to corn production traits, we conducted a correlation analysis between the dominant bacteria of TOP 20 and corn ear number (ear/m2), ear weight (g), axle weight (g), seed yield (%), moisture content (%), and yield (kg/hm2). There are 6 types of microorganisms related to the yield and traits of large corn. S_Massilia_putida, S_Bradyrhizobium_ottawaense, S_Bradyrhizobium_japonicum, S_Bradyrhizobium_sp._TM102 are positively correlated with ear number, ear weight, axle weight, seed yield, and yield. Among them, the correlation between S_Massilia_putida and yield is significantly positive. There is a significant positive correlation between the ear number and the moisture content in S_Bradyrhizobium_ottawaense andS_Bradyrhizobium_sp._TM102. There is a significant positive correlation between S_Bradyrhizobium_japonicum, and seed yield. The S_Pseudomonas_fluorescens is significantly positively correlated with moisture content and negatively correlated with ear number. There is a significant positive correlation between S_M icilaginibacter_gossypii and moisture content (Figure 8A).
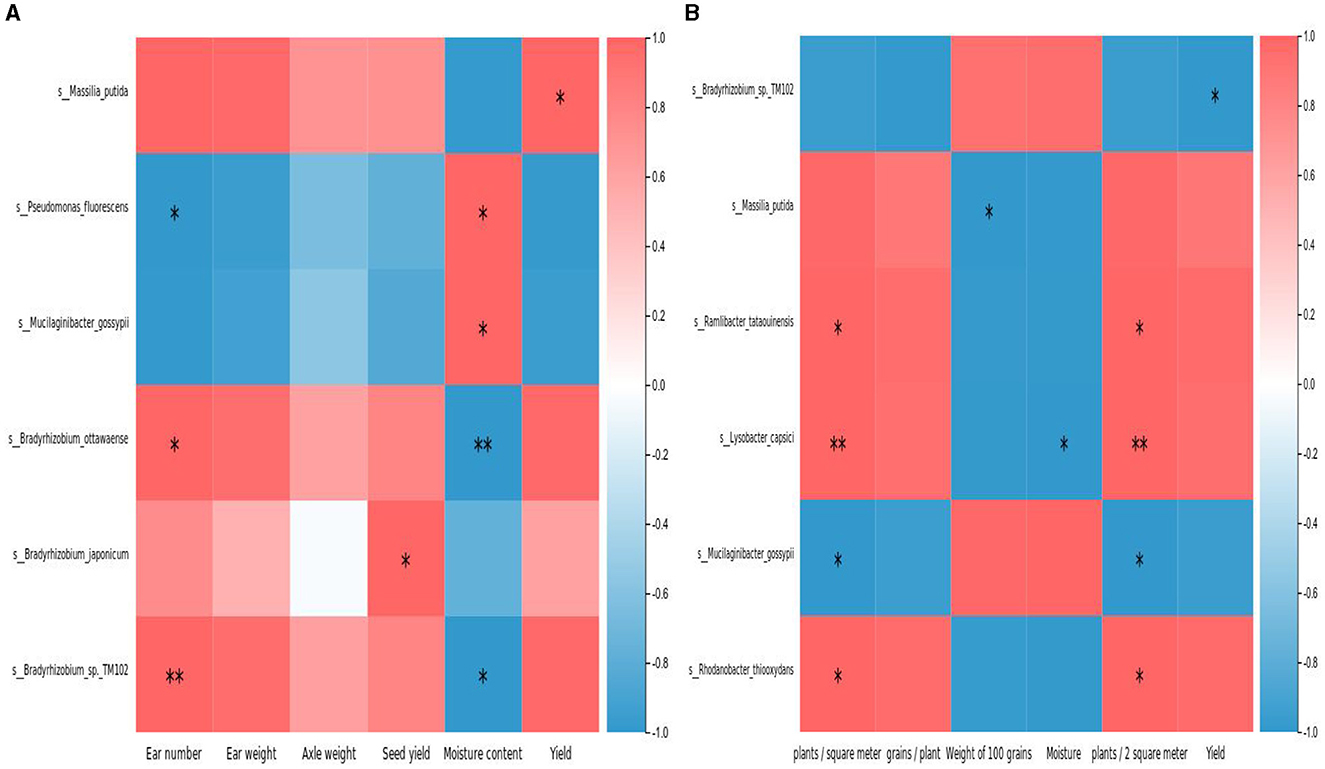
Figure 8. (A) Correlation analysis between top 20 microbial abundance and corn production traits. (B) Correlation analysis between top 20 microbial abundance and soybean production traits.
In order to clarify whether the microbial community structure is truly related to soybean production traits, we used the dominant bacteria of TOP 20 and soybean crop yield (kg/hm2), number of plants per 2 square meters, weight per 100 grains (g), moisture content (%), number of grains per plant A correlation analysis was conducted between the Number of plants per square meter, and it can be seen from Figure 8B that there are 6 types of microorganisms that are correlated with soybean yield and traits. Among them, there is a negative correlation between S_ Bradyrhizobium_sp.TM02 and yield. There is a significant negative correlation between S_ Massilis_putida and weight per 100 grains. There is a significant positive correlation between S_Ramlibacter_tataouinens is and the number of plants per square meter, as well as the number of plants per 2 square meters. S_lysobacter_capsici is significantly positively correlated with the number of plants per square meter and 2 square meters, and negatively correlated with significant moisture content. S_Mucilaginibacter_gossypii is significantly negatively correlated with the number of plants per square meter and the number of plants per 2 square meters. There is a significant positive correlation between the number of plants per square meter and the number of plants in 2 square meters, as well as the number of plants in S_Rhodanobacter_thioxydan (Figure 8B).
Rhizosphere microorganisms have been a hot field of soil environmental research in recent years. They can significantly affect and participate in the growth and development of plants/crops, the absorption and transportation of effective nutrients in the soil, and the decomposition of plant/crop litter and residues. Different planting modes can have an impact on crop rhizosphere microorganisms. Macrogenomics technology focuses on microbial diversity, population structure, evolutionary relationships, functional activity, collaborative relationships, and relationships with the environment, avoiding traditional microbial isolation and cultivation methods to directly extract total DNA from environmental samples. By constructing and screening a metagenomic library, new functional genes and bioactive substances are obtained. In this study, we used metagenomic sequencing methods to analyze the diversity and composition of rhizosphere microbial communities in soybean and corn under different strip planting conditions. It was found that bacteria were the main microbial phyla and genus levels, followed by viruses, followed by archaea, and fungi were the least. Fungi are almost unaffected by planting patterns. Viruses and bacteria are relatively influenced by planting patterns.
Liu et al. (2020) showed that the diversity of bacterial communities is more susceptible to the influence of planting patterns, as evidenced by the variation of microbial community richness and diversity index under different banded planting patterns without significant changes (Hu et al., 2022; Yi et al., 2022). The dominant groups of soil microbial communities may vary depending on planting patterns, fertilizer management, and crop development stages. This study found that the dominant phylum and genus of rhizosphere bacterial and fungal communities in soybean and corn under different strip planting modes are basically the same. The dominant bacterial phyla in all treatments are Pseudomonas and Actinobacteria, which are close to the results reported by Liu et al. (2020).
The differences in growth period and planting mode result in changes in community structure. A total of 37 Actinobacteria is a typical beneficial microbial population in agricultural soil, which can produce some antibiotics and numerous secondary metabolites, promote plant growth, and inhibit the infection of soil borne pathogenic microorganisms as the main microbial resource (Crits-Christoph et al., 2018). High abundance of actinomycetes is beneficial for crop growth. The lowest abundance of Pseudomonas in the rhizosphere of corn and soybean during the seedling and podding stages, and the highest abundance of Actinomyceta in the rhizosphere of corn during the full flowering stage, is in Mode 1, indicating that the growth of corn in Mode 1 is better. A total of 20 main bacterial genera were detected in the rhizosphere (with relative abundance >1%), among which the dominant genera of soybean and corn were Bradyrhizobium, sphaeromonas, Rhodobacterium, Pseudomonas, Aphagia, and Streptomyces. There is no significant difference in the relative abundance of slow rooted rhizobia in the rhizosphere of corn during the three growth stages, and the content is relatively low, which is related to the low nitrogen fixation ability of corn.
Saccharomycetes is an aromatic compound degrading bacterium that can protect plants by degrading harmful aromatic compounds. In this study, its abundance is relatively high, which may be related to the application of certain herbicides and the crops being herbicide tolerant genetically modified crops. The root system secretes certain substances that are beneficial for recruiting microorganisms that degrade harmful aromatic compounds. In this study, the abundance of Pseudomonas increased with the extension of the growth period, indicating that the longer the crop growth period, the stronger the protective ability. The abundance of Pseudomonas in Mode 1 of corn is relatively high, indicating that Mode 1 is more conducive to the growth of corn than other modes.
From the alpha diversity index of rhizosphere microorganisms, in this study, the ace index, chao1 index, and Shannon index of corn rhizosphere microorganisms in seedling stage Mode 1 were higher than those in other modes during the same period. The ace index and chao1 index of rhizosphere microorganisms in soybean planting Mode 3 and corn planting Mode 2 during seedling stage were higher than those in other modes during the same period. The ace index and chao1 index of rhizosphere microorganisms in soybean planting Mode 1 during the flowering period were higher than those in other modes. The Shannon index of soybean in Mode 3 during the seedling and podding stages is higher than that of other modes. The ace index of rhizosphere microorganisms in corn planted in podding stage Mode 2 was higher than that of other modes during the same period. From the perspective of microbial diversity, for corn, Mode 1 or Mode 2 has relatively high microbial diversity and is more suitable for corn cultivation, which is consistent with the highest seed yield and yield per hm2 of Mode 1 corn in Table 5. For soybeans, Modes 3 is more suitable for soybean production, which is consistent with the 2 square meter number of plants, trees per square meter, seeds per plant, and highest yield in Table 6 Soybean Mode.
The different configuration modes of corn and soybean strip planting have a significant impact on crop yield. Soybean corn intercropping mainly aims to increase soybean yield without reducing corn yield as much as possible, thereby increasing the land equivalent ratio and economic output value per unit area of land. A reasonable intercropping model of soybean and corn can improve the microclimate and soil nutrient structure in the field, increase the light energy utilization efficiency and photosynthetic rate of crops, increase the accumulation of dry matter per spike, and thus gain yield advantages (Zhu et al., 2016; Zhang et al., 2019; Wang T. et al., 2020) research found that the spacing between soybean plants and rows remains unchanged. Increasing the spacing between soybean and corn belts in the intercropping system will increase soybean yield, and the population yield will first increase and then decrease. However, when the spacing is <40 cm, corn will significantly inhibit the formation of effective soybean pods and grains. The soybean density remains unchanged, and when the total bandwidth of soybean and corn remains unchanged, the soybean yield increases with the increase of soybean rows; When the row ratio of soybean and corn remains constant, expanding the spacing between the corn and soybean belts increases the number of soybean plants per unit area, reduces the spacing between soybean plants, strengthens intra specific competition, and leads to a decrease in soybean yield. After dense planting of corn, the weight of 100 grains, number of rows per ear, and number of grains per row of corn decrease, leading to a decrease in yield per plant, a decrease in quality, and a weakening of the yield increasing effect of dense planting; Simultaneously inhibiting soybean growth, resulting in a decrease in grain quality and yield (Hu, 2018; Luo, 2020; Jiang et al., 2022).
Liu (2023) found in his study on the impact of corn soybean intercropping on crop yield that intercropping 2 rows of corn and 5 rows of soybean yields the highest yield per mu of soybean; The intercropping of two rows of corn and two rows of soybeans resulted in the highest yield per mu of corn and the highest total yield. Yan et al. (2023) found in their analysis of the impact of different field configurations and cultivation modes on yield and economic benefits of corn soybean that the maize soybean 2:4 intercropping mode has the highest land productivity and obvious intercropping advantages, resulting in higher economic benefits (Yan et al., 2023).
Studies by Feng et al. (2021) have shown that intercropping corn and soybean can increase economic benefits. When the intercropping ratio of soybean to maize is 2:2, the population yield of corn and soybean is significantly increased, and when the intercropping ratio of soybean to corn is 4:2, the ecological benefits are better. In this study, there was no significant difference in corn yield between Mode 1 and Mode 2, but both were significantly higher than Mode 3; However, there are significant differences among the three soybean modes, with the order of yield from high to low being Mode 3 > Mode 1 > Mode 2. From the perspective of corn production, Mode 1, which means corn and soybean with a ratio of 2:4, has the highest economic benefits, consistent with research conducted by Feng Liang and others; from the perspective of soybean production, Mode 3 is the most favorable for soybean production, which is consistent with the research results of Liu Fuming and others.
Plants can select soil microorganisms related to their growth and development through root exudates or litter, which in turn affect plant nutrient absorption, root morphology construction, and resistance to biotic or abiotic stress (Mo et al., 2023; Du et al., 2024). Plant growth is closely related to soil microorganisms (Wagg et al., 2011; Barker et al., 2018; Zhalnina et al., 2018) found in their study on the mixed cultivation of black wheat grass and red clover that AMF (arbuscular mycorrhizal fungi) promoted the growth of red clover, reduced the inhibitory effect of black wheat grass on it, and improved the mixed cultivation productivity (Wang X. et al., 2020). In the intercropping of sorghum/flax, AMF increased the growth of flax in the intercropping, but had no significant impact on sorghum, but could increase intercropping productivity (Walder et al., 2012). In the intensive ecosystem of farmland, fully understanding the mechanism of plant microbial interaction, optimizing management and precise regulation, exerting the positive feedback effect of beneficial microorganisms, inhibiting or removing the negative feedback effect of pathogenic bacteria on host plants, can improve crop yield and resource utilization efficiency, and promote green and sustainable development of agriculture.
In order to clarify whether the rhizosphere microbial community structure of corn and soybean in strip planting is truly related to the production performance of corn and soybean, this study conducted a correlation analysis between the dominant bacteria of TOP20 and the production performance related indicators of corn and soybean. It was found that 6 microbial abundances are correlated with the production performance indicators of corn and soybean, and 6 microorganisms are correlated with the production performance indicators of soybean. S_Massilis_putida is significantly positively correlated with Corn yield. S_ lysobacter_capsici shows a highly significant positive correlation with the number of plants per square meter and the number of plants per 2 square meters of soybeans. Therefore, in the belt planting of corn and soybean, it can be attempted to achieve further yield increase by adjusting the microbial community.
Article uses metagenomic high-throughput sequencing technology to study the diversity and community structure of rhizosphere microorganisms in Zhongliandou 1505 and Tianyu 108 corn under Modes 1, 2 and 3, and to determine their production traits and understand the correlation between the two. Redundancy analysis revealed that the richness order of rhizosphere microbial communities under different strip planting modes was bacteria > viruses > archaea > fungi. Bacteria and viruses are more affected by planting patterns than fungi, and fungi are almost unaffected by planting patterns. Alpha diversity analysis index shows that it has a significant impact on diversity during the peak flowering period, while the other two periods have no significant impact.
The high diversity of rhizosphere microorganisms in corn under Modes 1, 2, and 3 is beneficial for maize, while the high diversity of microorganisms in soybean under Mode 3 is beneficial for soybean. The profiling analysis found that Pseudomonas, Actinobacteria, Bacteroidota, and Myxococcota are all dominant bacterial phyla in the rhizosphere soil of soybean and corn under different strip planting modes. The dominant genera of soybeans and corn are Bradyrhizobium, Rhodanobacter, Pseudomonas, and others. With different growth periods and planting mode, the community structure undergoes varying degrees of change. There is no significant difference in the relative abundance of Bradyrhizobium in the rhizosphere of corn during the three growth stages, and the content is relatively low, which is related to the low nitrogen fixation ability of corn. There was no significant difference between the six metabolic pathway groups enriched by KEEG functional annotation at the first level, but at the second level, it enriched the top 10 metabolic pathways with abundances such as carbohydrate metabolism and amino acid metabolism. There is no significant difference in corn yield between Mode 1 and Mode 2, but both are significantly higher than Mode 3; The soybean yield in Mode 3 is significantly higher than that in Mode 2, and Mode 2 is significantly higher than that in Mode 1. Correlation analysis shows that there is a correlation between the abundance of 12 microorganisms and corn production performance indicators, and a correlation between 10 microorganisms and soybean production performance indicators. S_Massilis_putida is significantly positively correlated with Corn yield. S_ lysobacter_capsici shows a highly significant positive correlation with the number of plants per square meter and the number of plants per 2 square meters of soybeans.which are expected to become biological fertilizers. In summary, if corn production is the main consideration, the Mode 1 or Mode 2 is the best, and if soybean production is the main consideration, the Mode 3 is better.
The original contributions presented in the study are included in the article/supplementary material, further inquiries can be directed to the corresponding authors.
GW: Writing – original draft, Writing – review & editing, Conceptualization, Investigation, Methodology. SF: Writing – original draft, Writing – review & editing, Investigation. XH: Writing – review & editing. HZ: Writing – original draft. CB: Writing – review & editing. GL: Writing – original draft. GZ: Writing – original draft.
The author(s) declare financial support was received for the research, authorship, and/or publication of this article. This project was supported by the Germplasm Innovation and Molecular Breeding of Forage Crops and Useful Microbiology team, project number: TD202103 and Demonstration and Promotion of Integrated Breeding Technology for Industrialization project no.: RK2200002201.
We thank you for the project TD202103 from the Key Laboratory of Higher Education Institutions in the Autonomous Region for Innovative Utilization of Wheat Germplasm and the Agricultural and Animal Husbandry Science Research Institute of Xing'an League for providing a research site.
The authors declare that the research was conducted in the absence of any commercial or financial relationships that could be construed as a potential conflict of interest.
All claims expressed in this article are solely those of the authors and do not necessarily represent those of their affiliated organizations, or those of the publisher, the editors and the reviewers. Any product that may be evaluated in this article, or claim that may be made by its manufacturer, is not guaranteed or endorsed by the publisher.
Barker, P. A., Pieterse, C. M., and Berendsen, R. L. (2018). The soil-bome Legacy. Cell 172, 1178–1180. doi: 10.1016/j.cell.2018.02.024
Brooker, R. W., Bennett, A. E., Cong, W. F., Daniell, T. J., George, T. S., Hallett, P. D., et al. (2015). Improving intercropping: a synthesis of research in agronomy, plant physiology and ecology. New Phytol. 206, 107–117. doi: 10.1111/nph.13132
Cai, Q., Sun, Z. X., Zheng, J. M., Wang, W. B., Bai, W., Feng, L. S., et al. (2021). The impact of soybean corn intercropping mode on crop dry matter accumulation and distribution, yield, and land productivity in semi-arid areas of western Liaoning. Chin. J. Agric. Sci. 54, 909–920.
Crits-Christoph, A., Diamond, S., Butterfield, C. N., Thomas, B. C., and Banfield, J. F. (2018). Novel soil bacteria possess diverse genes for secondary metabolite biosynthesis. Nature 558, 440–444. doi: 10.1038/s41586-018-0207-y
Du, K., Huang, J., Wang, W., Zeng, Y., Li, X., Zhao, F., et al. (2024). Monitoring low-temperature stress in winter wheat using TROPOMI solar-induced chlorophyll fluorescence. IEEE Trans. Geosci. Remote Sens. 62, 1–11. doi: 10.1109/TGRS.2024.3351141
Elasa, J. D., Janet, K., and Jack, J. (2006). Modern Oil Microbiology, 2nd Edn. BocaRaton, IL: CRC Press, 83–146.
Feng, L., Huang, G. Q., Yang, W. T., Huang, T. B., Tang, H. Y., Ma, Q. Y., et al. (2021). The impact of maize/soybean intercropping mode on crop yield and interspecific relationships in red soil dryland of Jiangxi. Chin. J. Ecol. Agric. 29, 1127–1137.
Hauggaard-Nielsen, H., and Jensen, E. S. (2005). Facilitative root interactions in intercrops. Root Physiol. From Gene Funct. 274, 237–250. doi: 10.1007/1-4020-4099-7_13
He, M., Ren, T., Jin, Z. D., Deng, L., Liu, H., Cheng, Y., et al. (2023). Precise analysis of potassium isotopic composition in plant materials by multi-collector inductively coupled plasma mass spectrometry. Spectrochimica Acta Part B: Atomic Spectr. 209:106781. doi: 10.1016/j.sab.2023.106781
Hu, F. (2018). The Effects of Maize Density and Plant Type on Yield and Nutrient Uptake in the Intercropping System of Maize and Soybean. Yaan: Sichuan Agricultural University.
Hu, Q., Zhao, Y., Hu, X., Qi, J., Suo, L., Pan, Y., et al. (2022). Effect of saline land reclamation by constructing the “Raised Field -Shallow Trench” pattern on agroecosystems in Yellow River Delta. Agric. Water Manage. 261:107345. doi: 10.1016/j.agwat.2021.107345
Jiang, Y. Y., Zheng, Y., Tang, L., Xiao, Q. X., Zeng, J., Zhang, K. X., et al. (2016). Research progress on rhizosphere biological processes in intercropping leguminous and gramineous crops. J. Agric. Res. Environ. 33, 407–415.
Jiang, Z. W., Liu, G. Y., An, H. Y., Shi, W., Chang, S. H., Zhang, C., et al. (2022). The effects of planting density and nitrogen application on forage yield, quality, and nitrogen fertilizer utilization in maize/soybean intercropping system. J. Grassland Industry. 31, 157–171.
Li, L. (2016). Research progress and application prospects of intercropping to enhance the service function of farmland ecosystem. Chin. J. Ecol. Agric. 24, 403–415.
Liang, J. Q., Yu, X. B., He, Z. M., An, J. G., Wang, J., Zeng, Z. Q., et al. (2021). Comparative study on agronomic traits and yield of soybean varieties with different maturity types under the jade bean intercropping mode. Chinese J. Oil Crops 43, 1077–1086.
Lin, W. W., Li, N., Chen, L. H., Wu, Z. Y., Lin, W. X., Shen, L. H., et al. (2022). Effects of interspecific interactions between maize and soybean on the structure and diversity of rhizosphere bacterial communities. Chin. J. Ecol. Agric. 30, 26–37.
Liu, F. M. (2023). The effect of corn soybean intercropping on crop yield. Special Econ. Anim. Plants 8, 37–39.
Liu, X. (2016). Research on the Distribution, Interception, and Utilization of Light Energy in the Strip Intercropping System of Jade Beans. Ya'an: Sichuan Agricultural University.
Liu, Z., Liu, J., Yu, Z., Yao, Q., Li, Y., Liang, A., et al. (2020). Long-term continuous cropping of soybean is comparable to crop rotation in mediating microbial abundance, diversity and community composition. Soil Tillage Res. 197:104503. doi: 10.1016/j.still.2019.104503
Luo, W. Y. (2020). The Effects of Bandwidth and Density on the Yield of Strip Intercropping Populations of Fresh Corn and Soybean. Yaan: Sichuan Agricultural University.
Lv, Y., Wu, P., Chen, X. L., Wang, Y. B., and Zhao, X. N. (2014). Effects of aboveground and underground interactions on maize/soybean intercropping advantages. J. Agric. Mach. 45, 129–136.
Mo, X., Zhou, M., Li, Y., Yu, L., Bai, H., Shen, P., et al. (2023). Safety assessment of a novel marine multi-stress-tolerant yeast Meyerozyma guilliermondii GXDK6 according to phenotype and whole genome-sequencing analysis. Food Sci. Hum. Wellness. 13. doi: 10.26599/FSHW.2022.9250170
Sun, B., Zhao, Q. G., Zhang, T. L., and Yu, S. (1997). Soil quality and sustainable environment - III. biological indicators for soil quality evaluation. Soil. 29, 225–234.
Tang, F. Y., Liang, J., Guo, X. H., Wei, Q. Y., Chen, W. J., Chen, Y., et al. (2022). Evaluation of fresh soybean varieties suitable for strip intercropping with fresh corn in Guangxi. Soybean Sci. 41, 58–64.
Wagg, C., Jansa, J., Stadler, M., Schmid, B., and Van Der Heijden, M. G. (2011). Mycorrhizal fungal identity and diversity relaxes plant–plant competition. Ecology 92, 1303–1313. doi: 10.1890/10-1915.1
Walder, F., Niemann, H., Natarajan, M., Lehmann, M. F., Boller, T., Wiemken, A., et al. (2012). Mycorrhizal networks: common goods of plants shared under unequal terms of trade. Plant Physiol. 159, 789–797. doi: 10.1104/pp.112.195727
Wang, J. X., Chang, S. H., Wang, P. L., Li, J. H., Shu, W. T., Yang, Q. C., et al. (2023). The effect of soybean and corn strip planting mode on yield and agronomic traits of different soybean varieties. China Seed Ind. 7, 73–77.
Wang, T., Pang, T., Du, Q., Chen, P., Zhang, X. N., Zhou, Y., et al. (2020). The effect of field configuration on the photosynthetic characteristics, dry matter accumulation, and yield of intercropped soybean. North China Agric. J. 2, 107–116.
Wang, X., Huang, J., Feng, Q., and Yin, D. (2020). Winter wheat yield prediction at county level and uncertainty analysis in main wheat-producing regions of china with deep learning approaches. Remote Sens. 12:1744. doi: 10.3390/rs12111744
Wang, Z., Yang, W. Y., and Wu, Q. L. (2007). The effect of shadow on photosynthetic characteristics and yield of soybean under jade/bean intercropping. J. Crops 9, 1502–1507.
Yan, H., Zhang, J., Ding, P. J., Zhang, X. L., and Luan, J. P. (2023). Analysis of the impact of different field configurations and cultivation modes on yield and economic benefits of corn soybean. Agric. Sci. Technol. Commun. 6, 83–87.
Yi, J., Li, H., Zhao, Y., Shao, M., Zhang, H., Liu, M., et al. (2022). Assessing soil water balance to optimize irrigation schedules of flood-irrigated maize fields with different cultivation histories in the arid region. Agric. Water Manage. 265:107543. doi: 10.1016/j.agwat.2022.107543
Zhalnina, K., Louie, K. B., Hao, Z., Mansoori, N., Rocha, D. a., Shi, U. N., et al. (2018). Dynamic root exudate chemistry and microbial substrate preferences drive patterns in rhizosphere microbial community assembly. Nat. Microbiol. 3, 470–480. doi: 10.1038/s41564-018-0129-3
Zhang, X., Chen, N., Du, P. Q., Zhou, Y., Ren, J. R., Jin, F., et al. (2019). The effects of intercropping corn/soybean and corn/peanut on crop nitrogen uptake and nodulation nitrogen fixation. Chin. J. Ecol. Agric. 8, 1183–1194.
Zhu, X. T., Tan, C. Y., Chen, J. Q., Yang, C. J., Gong, L., Liu, Z., et al. (2016). The effect of intercropping row spacing between corn and soybean on the growth and quality of soybean. Guizhou Agric. Sci. 44, 22–25.
Keywords: strip cropping, corn, soybean, rhizosphericmicroorganism, metagenome
Citation: Wang G, Feng S, Han X, Zheng H, Bai C, Li G and Zhao G (2024) Response of rhizosphere microbial community structure and production performance of corn and soybean to belt planting mode. Front. Sustain. Food Syst. 8:1387728. doi: 10.3389/fsufs.2024.1387728
Received: 18 February 2024; Accepted: 01 April 2024;
Published: 02 May 2024.
Edited by:
Muhammad Saqlain Zaheer, Khwaja Fareed University of Engineering and Information Technology (KFUEIT), PakistanReviewed by:
Nazish Aijaz, Hunan University, ChinaCopyright © 2024 Wang, Feng, Han, Zheng, Bai, Li and Zhao. This is an open-access article distributed under the terms of the Creative Commons Attribution License (CC BY). The use, distribution or reproduction in other forums is permitted, provided the original author(s) and the copyright owner(s) are credited and that the original publication in this journal is cited, in accordance with accepted academic practice. No use, distribution or reproduction is permitted which does not comply with these terms.
*Correspondence: Guofen Zhao, Z3VvZmVuemhhb0AxMjYuY29t; Guoqing Li, MjY0MTQ0OTM4OUBxcS5jb20=
†These authors have contributed equally to this work and share first authorship
Disclaimer: All claims expressed in this article are solely those of the authors and do not necessarily represent those of their affiliated organizations, or those of the publisher, the editors and the reviewers. Any product that may be evaluated in this article or claim that may be made by its manufacturer is not guaranteed or endorsed by the publisher.
Research integrity at Frontiers
Learn more about the work of our research integrity team to safeguard the quality of each article we publish.