
95% of researchers rate our articles as excellent or good
Learn more about the work of our research integrity team to safeguard the quality of each article we publish.
Find out more
ORIGINAL RESEARCH article
Front. Sustain. Food Syst. , 23 January 2024
Sec. Agroecology and Ecosystem Services
Volume 8 - 2024 | https://doi.org/10.3389/fsufs.2024.1254973
This article is part of the Research Topic Optimising Management Practices to Secure Grassland Agroecosystems' Sustainability View all 18 articles
 Sangeeta Bansal1*
 Debankur Sanyal2
 Christopher Graham3
 Jose L. Gonzalez Hernandez3Hector Menendez4Sandeep Kumar3
Grazing management is a critical land-use requirement that facilitates the preservation of plant community composition, soil properties and environmental quality. Grazing density of livestock has a significant impact on soil health, and there is a need to study the interactions of grazing densities and topographical positions influencing soil biochemical and microbial properties. This study was conducted at Cottonwood Field Station in Philip, South Dakota to assess the influence of more than 7 years of low, medium, and high grazing stocking densities (0.33, 0.41, 0.72 animal units/ac, respectively) at summit and footslope landscape positions on soil carbon (C) and nitrogen (N) fractions, microbial community composition, and enzymatic activities in a mixed-grass prairie ecosystem. Medium grazing density showed a 16% increase in soil N at the footslope compared with summit. Low grazing density significantly reduced microbial biomass C (~269 μg g−1 soil) and N (~26 μg g−1 soil) at summit compared with other grazing densities and landscape positions, except, the summit at high grazing density. Medium grazing density significantly enhanced hot-water extractable N by 21–23% at footslope compared with low grazing density at the footslope and high grazing density at the summit. Low grazing density increased urease (3.64 μg NH4+ g−1 soil h−1) at footslope than all other grazing densities and landscape positions. Low grazing density enhanced β-glucosidase by 75% than high grazing density; alkaline phosphatase was significantly greater by 60% at footslope than summit. High grazing density at the summit decreased total PLFA (mean 56.53 nmol g−1 soil) due to lower AM fungi, G (+), G (−) and actinomycetes biomass. Microbial stress indicators such as G (+)/G (−), saturated/unsaturated, monosaturated/polysaturated, GNeg stress revealed that high grazing density especially at summit position posed elevated physiological stressed conditions to the microbial community. Overall, long-term medium grazing density of 0.41 animal units/ac may enhance soil N, microbial composition, microbial biomass C and N, hot-water extractable C and N fractions, and reduce stress conditions for microbial community at both footslope as well as summit landscape positions. Moreover, long-term overgrazing of pastures, particularly at summit slopes, appears to inhibit microbial populations and degrade overall soil health.
Grazing management is critical to maintain ecological sustainability and environmental quality, along with providing ecosystem services, especially after long-term grazing. Grazing can impact overall soil properties such as pH, soil organic matter, and soil nutrient concentrations (Stumpp et al., 2005; Paz-Kagan et al., 2016). The impact of grazing on soil quality is dependent on the selection of appropriate stocking density, which is the most important decision a producer can make (Gillen and Sims, 2002; Smart et al., 2010). Stocking density exceeding the “carrying capacity” can adversely impact the long-term sustainability of a grassland system (Dunn et al., 2010). Additionally, different stocking rates can enhance species diversity in grasslands with short- and long-term biological implications (Dunn et al., 2010). The purpose of using variable stocking densities in this experiment was to determine the stocking density essential to enhance the soil biochemical properties and microbial activity while maintaining the plant community composition. Apart from stocking density, landscape position can strongly influence soil health by causing changes in microclimate based on runoff, drainage, soil temperature variation, wind and water erosion, nutrient redistribution and deposition processes (Mwanjalolo Jackson-Gilbert et al., 2015). Moreover, landscape position can provide different substrates for microbes, and nutrients that can ultimately influence soil microbial biomass and communities (Sekaran et al., 2019). Hence, topography should be accounted for while assessing the influence of grazing on soil C and N cycling (Frank et al., 2011; Zhang et al., 2018).
Previous studies on lipids demonstrated that nutritional status and environmental conditions can affect phospholipid fatty acid (PLFA) markers (Findlay and White, 1983; Guckert et al., 1986), therefore fatty acid composition can subsequently be used to indicate stress in the soil microbial community (Smith et al., 2000; Willers et al., 2015). For instance, relative dominance of a bacterial group can be assessed through the ratio of gram-positive to gram-negative bacterial lipids in a particular ecosystem and several studies associate an increase in gram-negative PLFAs with stress conditions (Willers et al., 2015). The composition of microbial communities can also determine the resistance and resilience to abiotic and biotic stresses (Griffiths et al., 2000; Patra et al., 2005). Additionally, animals return part of their ingests in the form of dung and urine, thereby increasing N inputs and labile organic matter fraction in soil (Bardgett and Wardle, 2003; Prieto et al., 2011). It is evidenced that grazing can influence aboveground plant community composition over time, not only affecting the size of the organic matter input but also the soil organic matter quality (Bardgett and Wardle, 2003; Prieto et al., 2011). Soil microbial biomass and enzymes are important parts of biochemical functioning and are strongly linked to soil organic matter and nutrient cycling (Saviozzi et al., 1999; Dodor and Ali Tabatabai, 2005; Patra et al., 2005; Makoi and Ndakidemi, 2008; Bottomley et al., 2020).
Soil microbial biomass and enzyme activities have been considered as sensitive indicators of microbial activity due to their rapid response to shifts in environmental conditions and disturbances (Anderson and Domsch, 1989). Soil enzymes are involved in C (e.g., β-glucosidase), N (e.g., urease), phosphorus (P) (e.g., phosphatases), and sulfur (S) (e.g., arylsulfatase) cycling and can be influenced by landscape position (Sekaran et al., 2019). Some studies suggest that grazing may increase or decrease biochemical activity depending on the presence of animal excreta or deteriorated soil structure due to trampling (Manzano and Návar, 2000; Yates et al., 2000; Conant et al., 2001; Steffens et al., 2008). Enzyme activities and microbial composition related to nutrient composition have previously been evaluated in agricultural practices (Bending et al., 2004; Moscatelli et al., 2007), however, knowledge of similar research is scarce in terms of grassland ecosystem with existing work reporting conflicting results on microbial biomass C (Banerjee et al., 2000; Craine et al., 2009; Katsalirou et al., 2010).
Great Plains rangelands serve as vital ecological components, offering significant contributions to wildlife habitat preservation, watershed protection, recreation, and conservation of genetic diversity. During the early twentieth century, the overall condition of these rangelands declined, attributable to livestock mismanagement, extensive cultivation and abandonment and persistent drought (Schacht et al., 2011). These issues resulted in reduced vegetation cover, increased wind and water erosion, and the widespread growth of invasive plant species. Efficacious management of grazed rangelands required the strategic deployment of tools, with particular emphasis on optimal stocking rates, which play a pivotal role in maintaining or enhancing range conditions (Holechek et al., 1989). The research gap has been identified due to a complex interaction of grazing density affecting soil properties, and microbial activities. There is need to assess the impact of different grazing densities on belowground components such as soil nutrient cycling and microbial activities which are still not fully understood (Bardgett and Wardle, 2003). Additionally, there is a lack of long-term rangeland studies focusing on topographical variability and patterns of grazing stocking density on soil health. Addressing these knowledge gaps may improve grazing management and allow the validity of stocking density recommendations based on assessed biochemical and microbial parameters. These knowledge gaps restrict the potential to theorize the effect of grazing animals, grazing intensity or management practices on grassland functioning. The objectives of this study were to understand the soil C and N fractions, enzymatic activities, soil microbial community composition and microbial stress indicators as influenced by three different grazing stocking densities at two landscape positions in a long-term mixed-grass prairie system.
The experiment was established at the Cottonwood Field Station in Philip, South Dakota (43°57′41″N, 101°51′36″W) and this site has primarily been used for livestock grazing research for 70 years. It is one of five long-term rangeland study sites in the US. The Cottonwood Field Station is situated in the Northern Great Plains mixed grass prairie ecosystem in west-central South Dakota. The soil type at the study site is Kyle clay (very fine, montmorillonitic, mesic Aridic Haplusterts) and Pierre clay (fine, montmorillonitic, mesic Aridic Haplusterts) developed over a Pierre shale formation (US Department of Agriculture, Soil Conservation Service, 1987; Dunn et al., 2010). The pH of the study site ranged between 6.9 and 7.4. The mixed grass prairie ecosystem at the study site is composed primarily of C3 green needlegrass (Nassella viridula) and western wheatgrass (Pascopyrum smithii) and C4 blue grama (Bouteloua gracilis) and buffalograss (Buchloe dactyloides). Topography is slightly sloping with hills and relatively flat-topped ridges. The study site has a Köppen climate classification of continental and semiarid with hot summers and cold winters. Mean annual precipitation is approximately 440 mm. In the 1940s, six pastures at the station were assigned to 3 levels of grazing intensity (low, medium, and high), with yearling steers (Bos taurus L.) on 100-acre fields to create pastures in low, good, and excellent range condition. The study consists of three grazing stocking densities of low, 0.33; medium, 0.41; and high, 0.72 animal units/acre and two landscape positions, i.e., summit and footslope. The study design is split-plot with six replications.
Following cool-season plant dormancy, soil samples were collected randomly from 0 to 6 cm depth in Fall, 2020 using a push probe. Within each replication, 10 cores were composited from either summit or footslope positions for further analyses and immediately stored in a refrigerator at either 4°C or −20°C for microbial analysis. The moisture content of soil was determined gravimetrically after drying for 48 h at 60°C. Air-dried soil samples were passed through 2-mm sieve for C and N fractions analyses and soil pH was determined using 1:1 soil/water suspension with a pH meter (Thermo Fisher Scientific, United States).
Air-dried soil samples (<2 mm) were ground and weighed ~0.250-g in a tin foil cup for analyzing SOC and N with a LECO TruSpec Analyzer (LECO Corporation, St. Joseph, MI) using dry combustion method.
Hot and cold water extractable C and N were analyzed using the methodology of Ghani et al. (2003) and Sekaran et al. (2019). Soil samples were weighed (3-g oven dry equivalent) into 50 mL centrifuge tube and 30 mL distilled water was added for extraction of easily soluble C and N. Samples were placed on a shaker for 30 min at 30 rpm and centrifuged at 3,000 rpm for 25 min. Supernatant was filtered using 0.45 μm filter into glass scintillation vials and analyzed for cold-water extractable C and N. For hot-water extractable C and N, 30 mL of distilled water was added to the same centrifuge tubes containing 3-g soil samples. These tubes were kept in hot water bath at 80°C for ~15 h. Each tube was shaken on a vortex for about 10 s to ensure that hot-water C and N released from the soil organic matter was fully suspended in the extraction medium. The tubes were further centrifuged at 3,000 rpm for 25 min. Supernatant was filtered through 0.45 μm filter into glass scintillation vials. The cold water and hot water extractable C and N fractions were determined using the TOC-L analyzer (Shimadzu Corporation, Kyoto, Japan).
Microbial biomass C and N were assessed using the chloroform-fumigation and extraction method (Vance et al., 1987; Singh et al., 2021). Ten grams of fresh soil samples were weighed for each fumigated and non-fumigated analysis. The non-fumigated subsample was extracted immediately using 0.5 M K2SO4. However, the samples subjected to fumigation were placed in a desiccator with suspended alcohol-free chloroform and extracted with 0.5 M K2SO4 after 24 h period in the dark. These samples were shaken for 1 h on an oscillating shaker at 30 rpm and centrifuged for 3 min. Supernatant was filtered through 0.45 μm filter paper and the extractant was analyzed for C and N using TOC analyzer (Shimadzu Corporation, Kyoto, Japan). Microbial biomass C and N were calculated as the difference between non-fumigated and fumigated sample C and N concentrations and divided by a factor of 0.45 as extraction efficiency (Beck et al., 1997).
Enzymatic analysis was determined to gain insights into soil enzyme dynamics as reflected by microbial activity and nutrient cycling in the studied environment. Urease (EC 3.5.1.5) was analyzed using colorimetric determination of ammonium method by Kandeler and Gerber (1988), with results expressed as μg NH4-N g−1 soil h−1. β-glucosidase (EC 3.2.1.21) activity was assessed following the approach of Eivazi and Tabatabai (1988), and results were expressed as μmol pNP g−1 soil h−1. Alkaline Phosphatase activity (EC 3.1.3.1) was determined using the method of Tabatabai and Bremner (1969) and Eivazi and Tabatabai (1977), with results expressed as μg pNP g−1 soil h−1. Arylsulfatase activity assessment followed the procedure of Tabatabai and Bremner (1970), utilized p-nitrophenol solution as the substrate, and results were expressed as μg pNP g−1 soil h−1.
Microbial community composition was assessed by extracting total soil lipids by shaking ~1–2 g of soil in 4 mL of Blight & Dyer reagent (200 mL 50 mM K2HPO4 buffer in deionized H2O, 500 mL methanol, 250 mL chloroform) and 19:1 phosphatidylcholine (Avanti Polar Lipids, United States) internal PLFA standard followed by sonication at room temperature. Solid and liquid phases were separated by centrifuging the samples in a 5,804 R centrifuge, (Eppendorf, United States) at 4,000 rpm for 15 min. Supernatant was added with of 1 mL of each deionized water and chloroform and centrifuged again at 4,000 rpm for 15 min. Separated liquid phase was placed in a SpeedVac™ vaccum concentrator (Thermo Scientific, United States) for drying at low/ambient temperature for 1 h.
The samples were dissolved with 1 mL chloroform and transferred to conditioned HyperSep™ solid-phase extraction (SPE) columns (Thermo Scientific, United States), containing 50 mg silica per 1 mL column, and allowed to gravity drain. A 1.5 mL clean glass catch vial was placed below each column and phospholipids were eluted using 0.5 mL of the 5:5:1 chromatography eluent solution (methanol: chloroform: deionized water) to the SPE columns. The collected solution was dried in a SpeedVac™ vaccum concentrator for ~1 h at ambient temperature.
A 0.2 mL of trans-esterification reagent was added to the dried samples followed by incubation at 37°C for 15 min. A 0.4 mL of 0.075 M acetic acid and 0.5 mL of chloroform was added to each tube and bottom phase after vortex was transferred to a GC vial followed by drying in SpeedVac™ vaccum concentrator for 20–30 min at ambient temperature. The samples were further resuspended using 100 μL of hexane and analyzed using an Agilent 2030-GC equipped with a CP-7693 auto-sampler and a flame ionization detector (FID). Fatty acid peaks were identified by comparing the retention times to MIDI PLFAD2 calibration mix using SHERLOCK software v.6.2 (MIDI Inc., United States). Fatty acids were used as functional group signatures for various microorganisms and each PLFA was expressed as nmol g−1 soil.
PLFA analysis can be used to indicate the microbial community stress where the obtained signature fatty acid biomarkers allow assessment and differentiation of various microbial groups including fungi and bacteria (Frostegård and Bååth, 1996; Bertram et al., 2012). For instance, since the cell structure of gram (−) bacteria benefits in stress resistance than gram (+), an increase in gram (+)/gram (−) ratio has been used as an indicator to recognize whether a given microbial community is stressed (Kaur et al., 2005; Bertram et al., 2012). The specific microbial stress indicators included in this study were gram (+)/gram (−), monounsaturated/polysaturated, saturated/unsaturated fatty acids, and GNeg stress. The GNeg stress indicator is based on the observations of increased gram (−) stress PLFAs with stress conditions. Increased ratios of saturated to monounsaturated fatty acids, trans- to cis monoenoic fatty acids and cyclopropyl fatty acids to their monoenoic precursors are used as stress signatures (Willers et al., 2015).
The analysis was conducted using SAS 9.4 (SAS Institute Inc., Cary, United States) with mixed model ANOVA procedure. The dependent variables included soil organic C and N, hot and cold-water extractable C and N, microbial biomass C and N, PLFA, enzymatic activities and microbial stress factors. Grazing densities and landscape positions were treated as fixed effects and replicates as random effects. Data were analyzed for normality using Shapiro–Wilk’s test. Mean separation for treatments was performed using Fisher’s protected least significant difference (LSD) at a significance level of 0.05. Principal component analysis (PCA) and correlation were performed using multivariate methods in JMP® Pro 16 (SAS Institute Inc., Cary, United States) for the measured parameters. Principal component analysis was conducted to simplify the data and observe the response variables which followed a similar trend and explained greatest variation in the data. Correlation was performed to see the relationship between different C and N fractions, and microbial communities.
The summary of statistical significance (p-values) of measured soil-related parameters as affected by grazing density and landscape position is presented in Table 1. The interaction between grazing densities and landscape positions was significant (p ≤ 0.05) for most of the parameters. Although SOC did not vary under different grazing densities, it was enhanced significantly (+12%) at the footslope compared with summit position. Within medium grazing density, soil N was reduced by 25% at summit when compared to the footslope position.; however, it did not vary significantly from the low and high grazing densities at either landscape position (Figure 1).
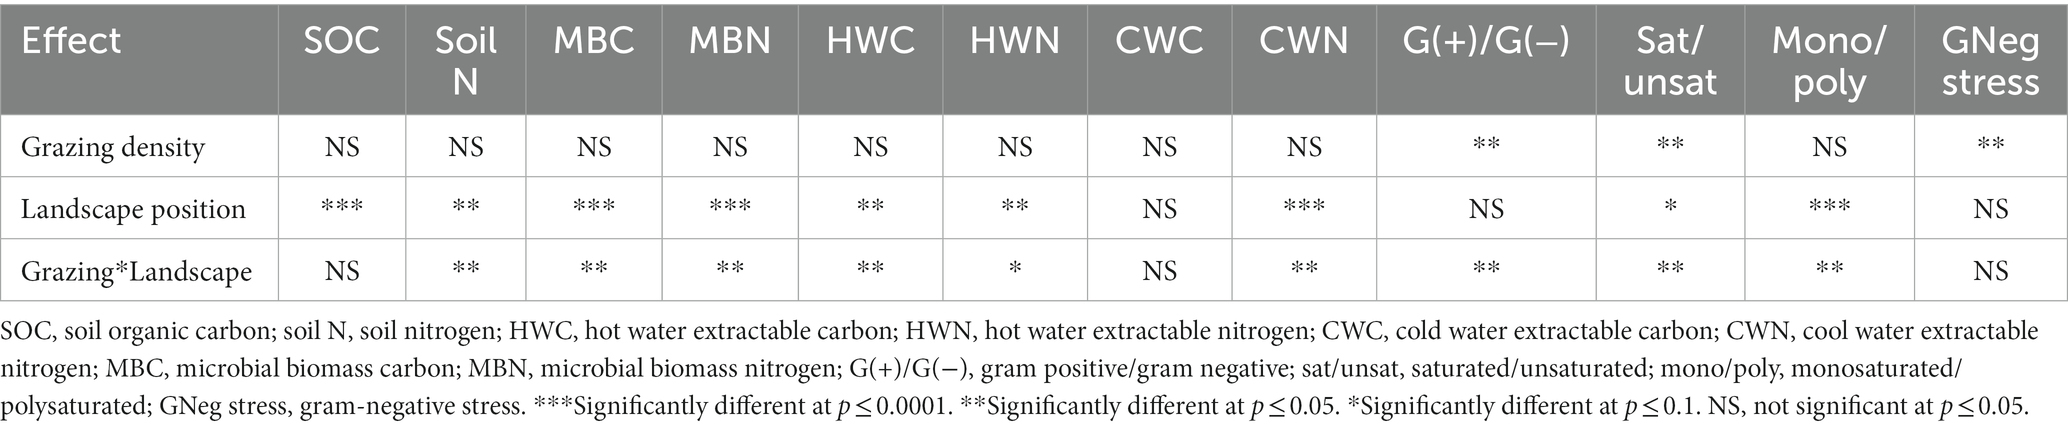
Table 1. Statistical significance (p-values) of the influence of grazing density and landscape position on soil C and N fractions and microbial stress indicators.

Figure 1. Soil organic carbon and nitrogen fractions as influenced under different grazing densities at two landscape positions. Bars with different lowercase letters represent significant differences between grazing densities and landscape positions at p ≤ 0.05. SOC, soil organic carbon; soil N, soil nitrogen; MBC, microbial biomass carbon; MBN, microbial biomass nitrogen.
In terms of C and N related to microbial biomass, the majority of the variation was observed under low and high grazing densities at both landscape positions (Figure 1). Microbial biomass C was significantly greater for medium and high grazing densities at footslope as well as summit, with a mean value between 403 and 510 μg g−1 soil. These did not vary significantly from the footslope position (445 μg g−1 soil) at low grazing density. Microbial biomass C was significantly lowered by 39–47% under low grazing density at summit position, compared to other grazing densities/landscape positions, except it did not differ from the summit position at high grazing density. Under medium grazing density, MBN was enhanced under footslope as well as summit position, when compared to low and high grazing densities (Figure 1). Microbial biomass N was reduced at summit positions under low and high grazing density by 25 and 22 μg g−1 soil, respectively, compared to the footslope. The ratio of MBC:MBN was comparatively (p < 0.05) greater at summit position (mean = 11.8) than the footslope position (mean = 9.11). At summit position, low grazing density showed significantly greater HWC:HWN ratio than the medium grazing density (Data not presented).
Medium grazing density increased HWC by ~22% at the footslope position compared with summit position (Figure 2). In terms of HWN, 21–23% increase was noted for medium grazing density at footslope position when compared with the low grazing density at footslope and high grazing density at summit position. Cold-water extractable C was not influenced by either grazing density or landscape position. Cold-water extractable N was enhanced under high grazing density at footslope (mean 11.2 mg kg−1), and it reduced significantly to 7.3, 4.9, and 4.0 mg kg−1 under low, medium, and high grazing density, respectively, at summit position.
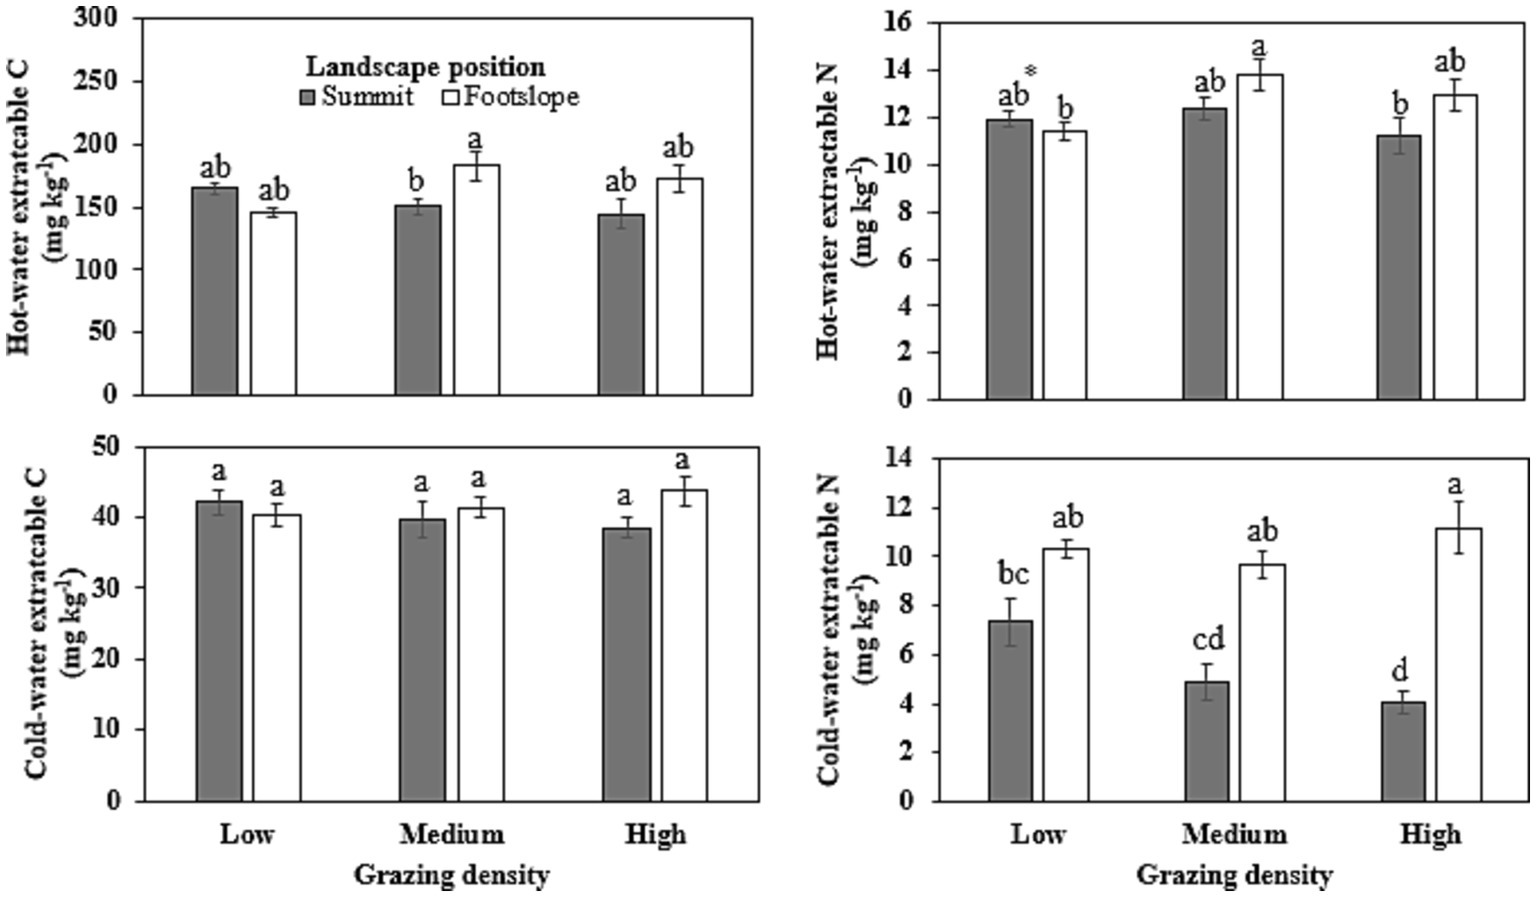
Figure 2. Hot-water and cold-water extractable carbon and nitrogen fractions as influenced under different grazing densities at two landscape positions. Bars with different lowercase letters represent significant differences between grazing densities and landscape positions at p ≤ 0.05. *Represents significant interaction at p ≤ 0.10.
Urease and arylsulfatase activities were significantly greater under low grazing density at footslope position and reduced by 25–79% under other grazing density/landscape position interactions (Table 2). However, arylsulfatase activity did not vary between medium and low grazing densities and footslope position. Averaging over landscape positions, β-glucosidase activity was enhanced significantly by 75% under low grazing density compared with the high grazing density. Moreover, alkaline phosphatase activity was higher under low grazing density by 62% than medium grazing density. Compared to footslope position, alkaline phosphatase activity decreased under summit by ~8 μg p-NP g−1 soil h−1.
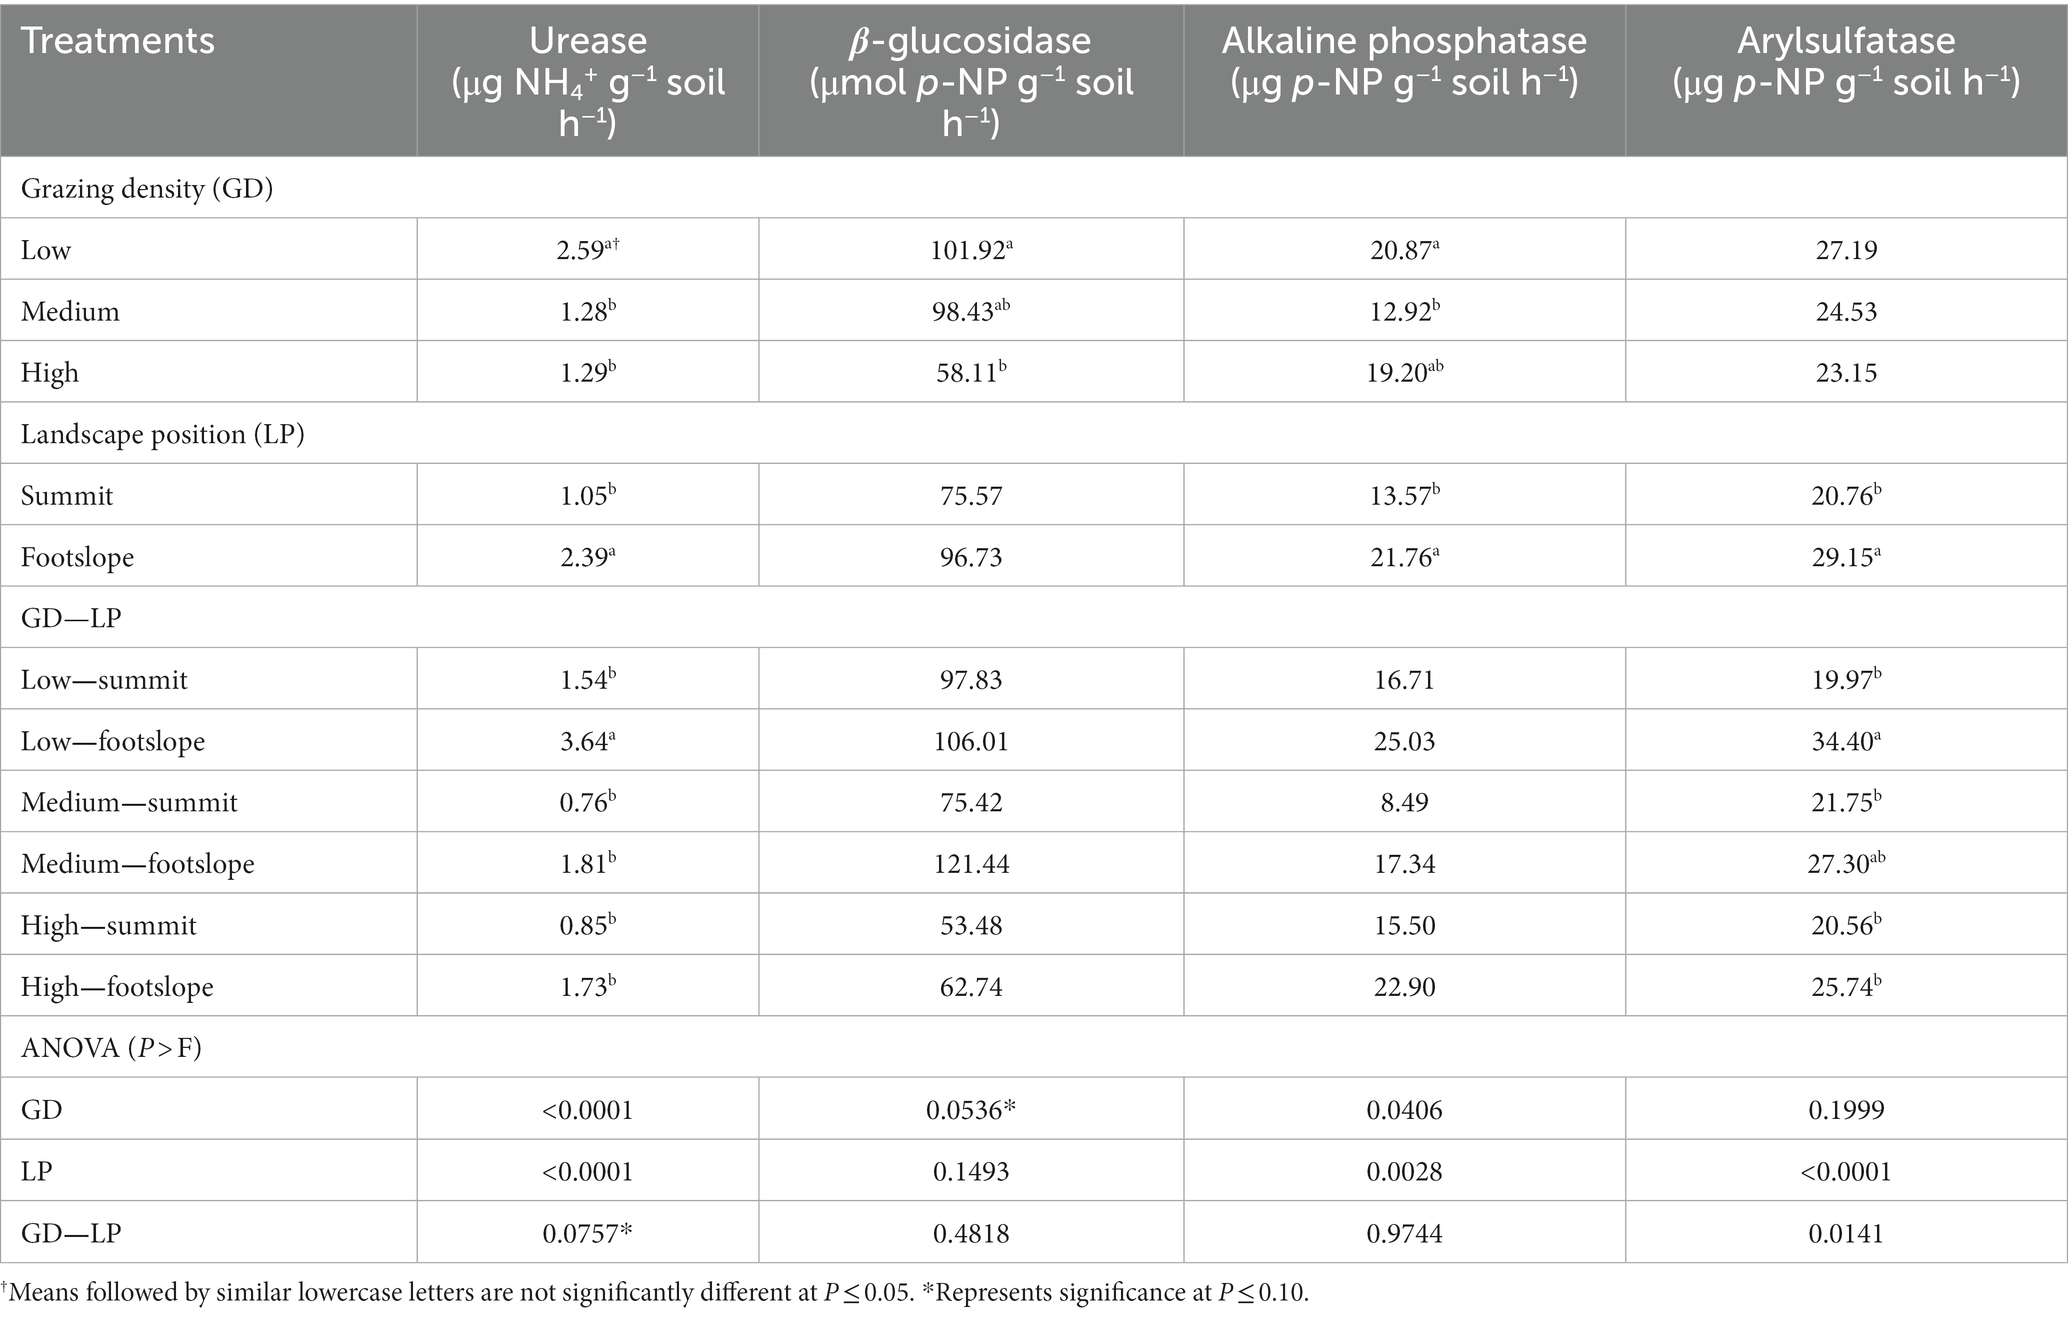
Table 2. Influence of different grazing densities at two landscape positions on soil enzyme activity.
Total PLFA was reduced significantly by 38–48% under high grazing density at summit position compared with the other grazing densities and landscape positions. In particular, high grazing density reduced the total PLFA by 43% at summit when compared with the footslope position (Table 3).

Table 3. Influence of different grazing densities at two landscape positions on soil microbial structure as identified by phospholipid fatty acid biomarkers.
Soil microbial lipid composition was significantly influenced by the interaction of grazing densities and landscape positions, except fungal population. High grazing density reduced the AM fungi population by 1.59–2.87 nmol g−1 soil at summit over the other grazing densities and landscape positions (Table 3). Medium and high grazing densities at summit position reduced the G (−) bacteria by 26 and 44%, respectively, compared with the medium grazing at footslope position. High grazing density also lowered the G (+) bacteria (20.87 nmol g−1 soil) at summit position compared with the medium grazing density at summit and footslope and high grazing density at footslope. Furthermore, the actinomycetes population was reduced under high grazing density at the summit position (8.71 nmol g−1 soil) than the other grazing densities and landscape positions. Overall, the high grazing density reduced total bacterial biomass 37% at the summit position compared to the other grazing densities, which corresponds with the observed decreases in gram (+), gram (−) and actinomycetes population. At the footslope, the fungal/bacterial ratio was significantly lower with a mean value 0.09 than the other grazing densities.
Gram (+)/gram (−) ratio did not vary between the two landscape positions under low and medium grazing densities, except at high grazing density where the summit position showed a lower ratio (0.10) than the footslope position (0.13) (Figure 3). Similar results were observed for saturated/unsaturated fatty acids, where reduced ratio was observed under high grazing density at the summit position (0.09) when compared with the other grazing densities and landscape positions, except it did not vary significantly with low grazing density at summit position (0.12). Monosaturated/ polysaturated fatty acids were significantly higher under high grazing density at the footslope position (1.76) than the other grazing densities and landscape positions, however, it did not differ significantly than the medium grazing density at footslope position (1.11). GNeg stress or gram (−) stress varied significantly only among different grazing densities; and medium grazing density showed 13 and 20% higher GNeg stress, respectively, than the low and high grazing densities.
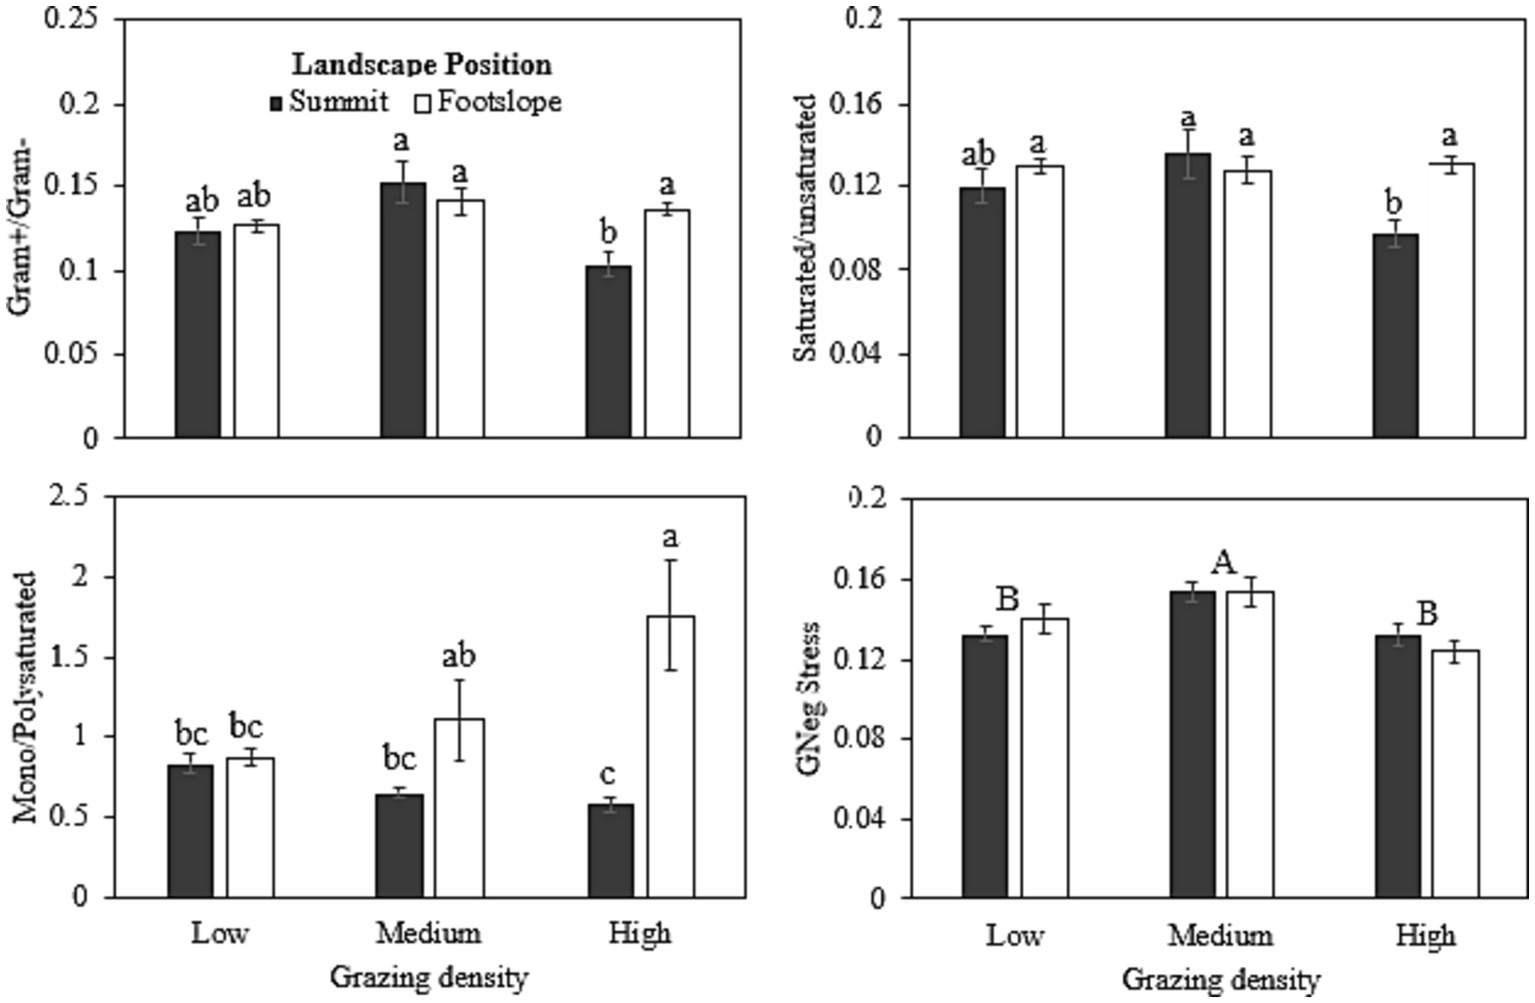
Figure 3. Stress indicators ratio calculated from PLFA analyses as influenced under different grazing densities at two landscape positions. Bars with different lowercase letters represent significant differences between grazing densities and landscape positions are significantly different at p ≤ 0.05. Capital letters in GNeg stress represent significant differences among three grazing densities.
The PCA results demonstrated that principal component 1 (PC1) and PC2 explained 36 and 15% of variation, respectively. It suggests that medium and high grazing densities influenced C and N fractions (e.g., SOC, N, HWC, HWN, CWN) and enzymes (urease, arylsulfatase, alkaline phosphatase) at the footslope position (Figure 4). However, the microbial community composition was mainly influenced by medium grazing density at both footslope and summit positions.
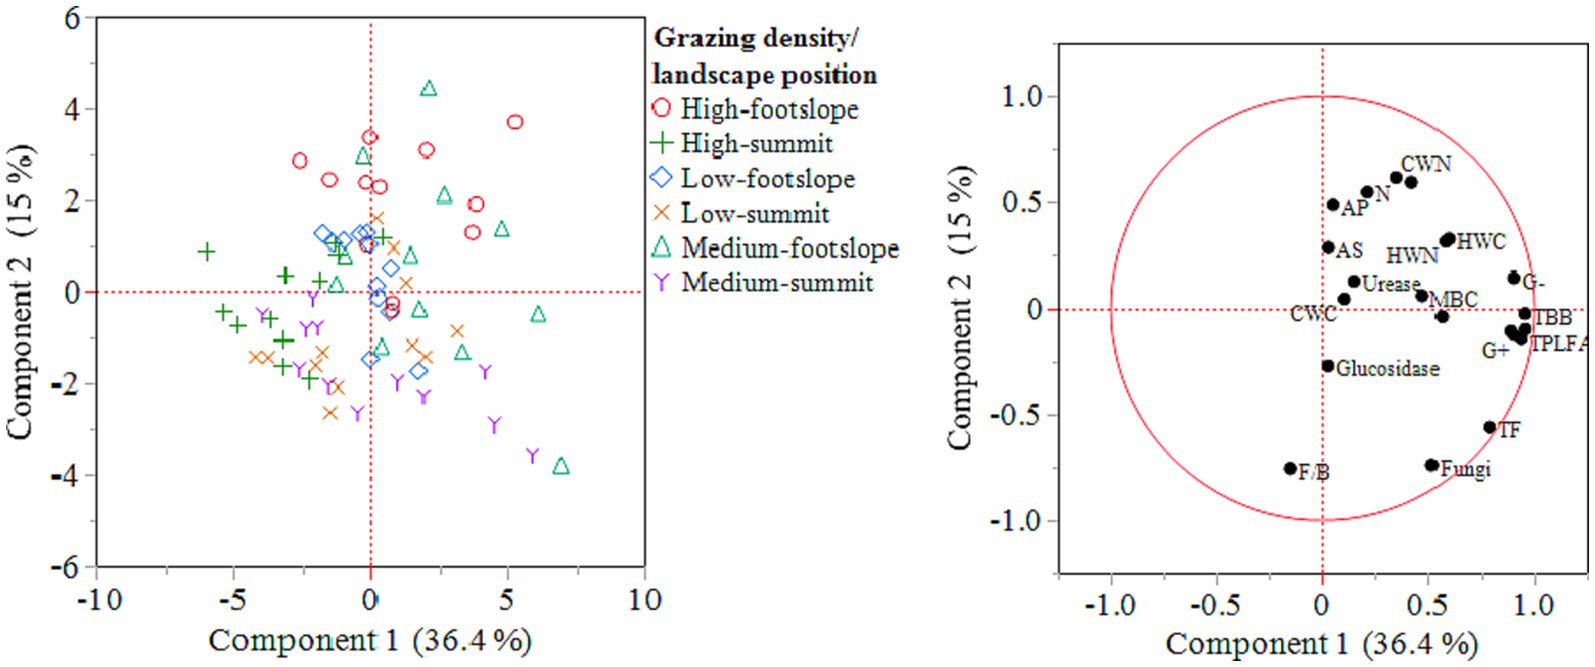
Figure 4. Score plot (left) and eigenvectors (right) of the soil physicochemical and biological parameters with principal component analysis (PCA) showing PC1 and PC2 (left) and eigenvectors (right). C, carbon; N, nitrogen; HWC, hot-water extractable carbon; HWN, hot-water extractable nitrogen; CWC, cold-water extractable carbon; CWN, cold-water extractable nitrogen; MBC, microbial biomass carbon; MBN, microbial biomass nitrogen; AM fungi, arbuscular mycorrhizal fungi; G (−), gram-negative bacteria; G (+), gram-positive bacteria; TBB, total bacterial biomass; TF, total fungi; F/B, fungi/bacteria; TPLFA, total phospholipid fatty acid; AP, alkaline phosphatase; AS, arylsulfatase.
Pearson’s correlation revealed that total PLFA or microbial community composition was positively correlated with most of the C and N fractions mainly SOC, HWC, HWN, CWN, MBC, and MBN (Figure 5). The microbial community had strong positive correlation with each other at p ≤ 0.05, e.g., AMF, G (−), G (+), fungi, actinomycetes.
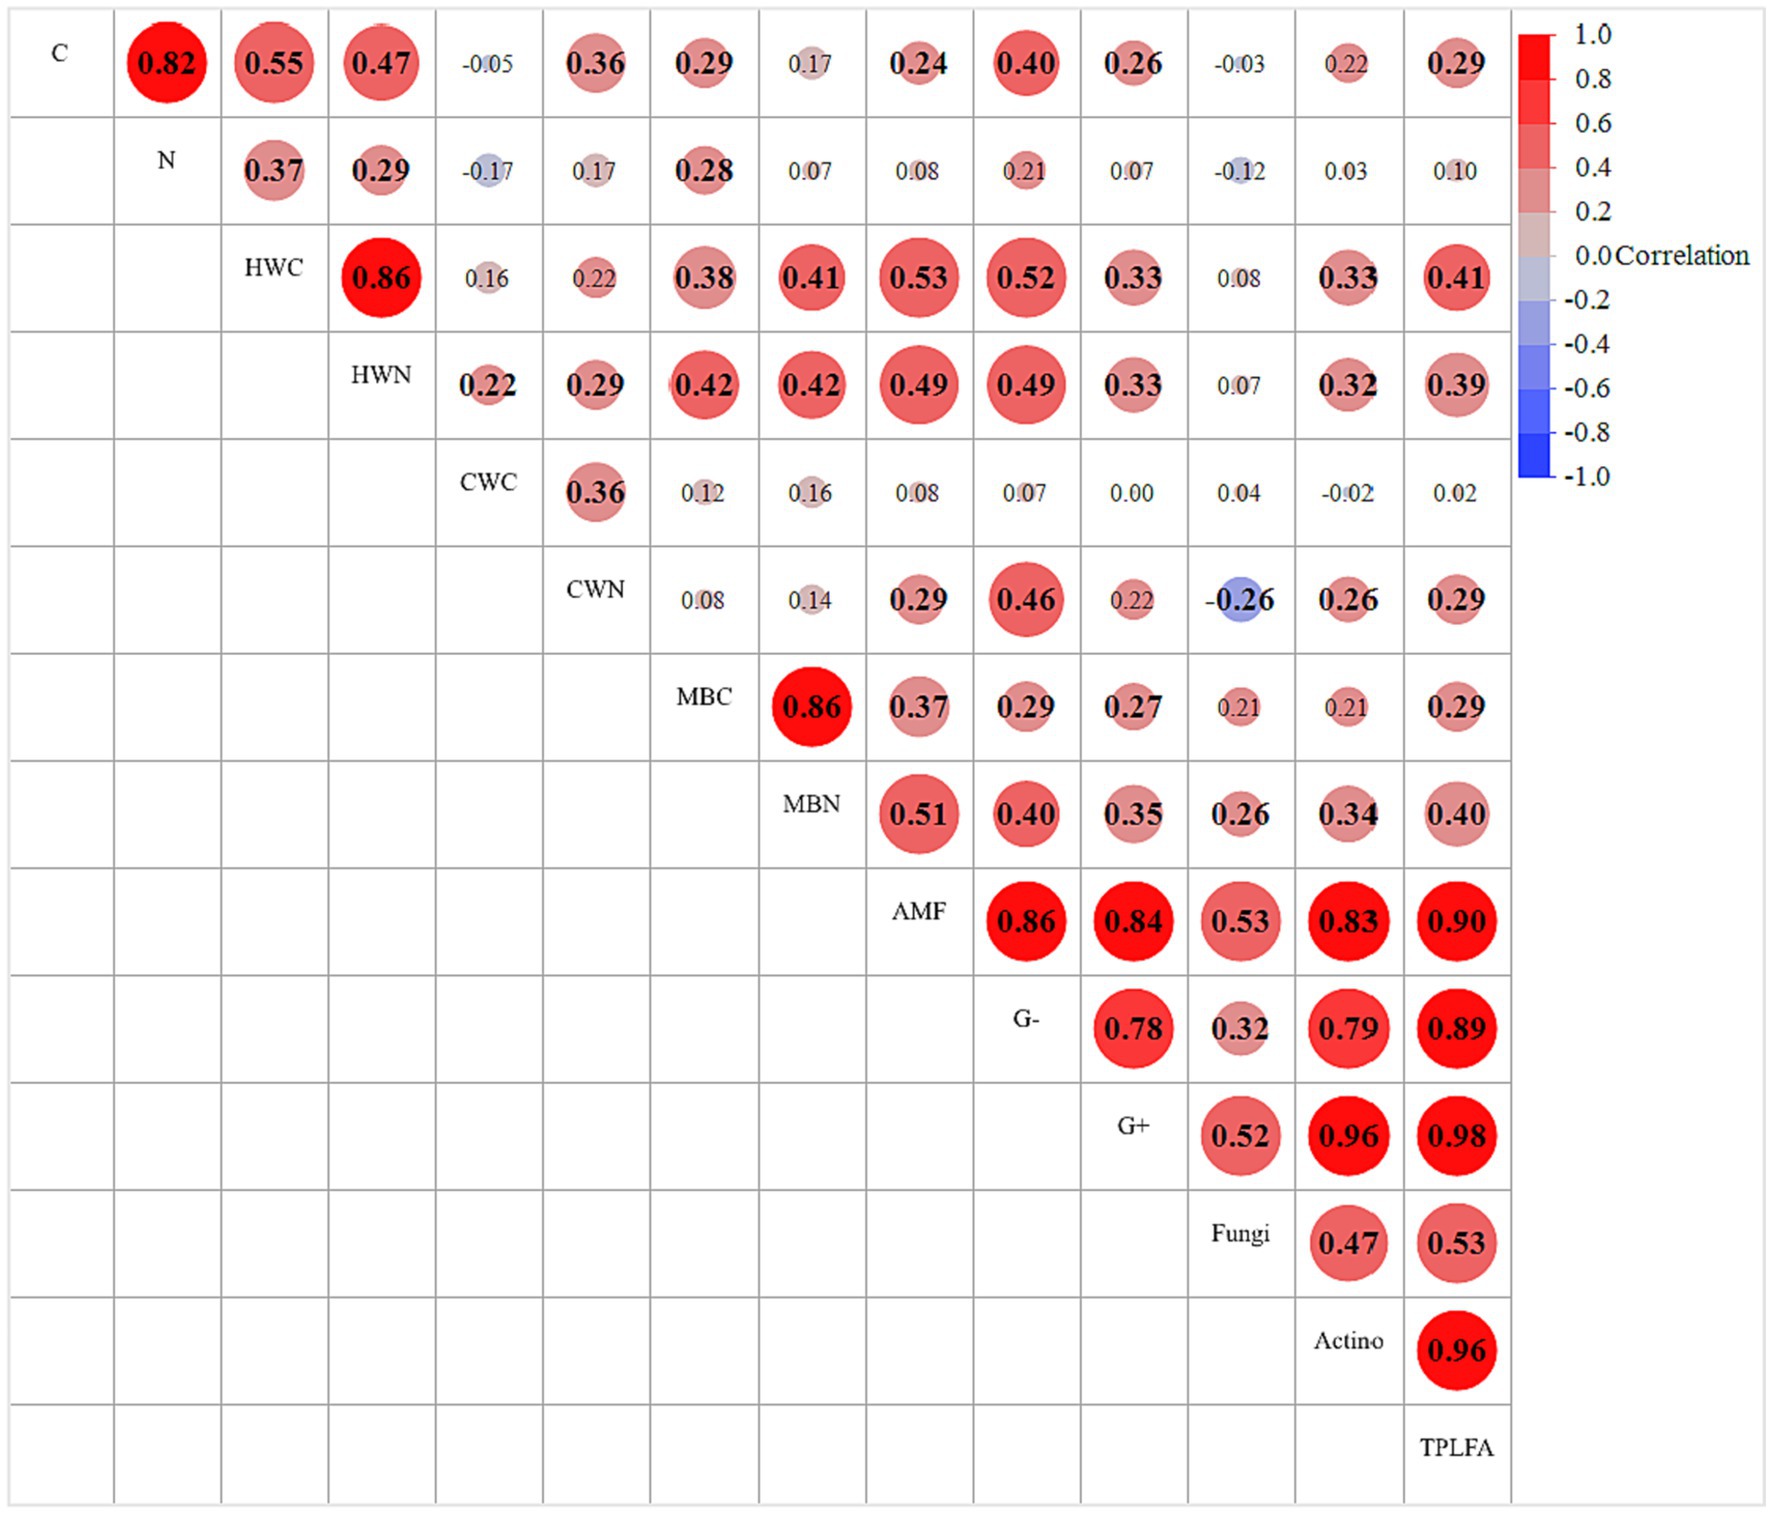
Figure 5. Pearson’s correlation coefficient (r) between soil physicochemical and biological properties observed under different grazing densities and landscape positions. C, carbon; N, nitrogen; HWC, hot-water extractable carbon; HWN, hot-water extractable nitrogen; CWC, cold-water extractable carbon; CWN, cold-water extractable nitrogen; MBC, microbial biomass carbon; MBN, microbial biomass nitrogen; AMF, arbuscular mycorrhizal fungi; G (−), gram-negative bacteria; G (+), gram-positive; TPLFA, total phospholipid fatty acid. Bold numeric values represent significance at p ≤ 0.05.
Long-term grazing can directly or indirectly influence the soil physicochemical and biological properties (Yates et al., 2000; Prieto et al., 2011). Our results suggest that labile fractions of C (e.g., HWC, MBC) can be considered as sensitive indicators while determining the subtle variations within a mixed-grass system. However, there were no discernable trends across all treatments and indicators, aligning with previous findings by Ghani et al. (2003). The effects of grazing densities were more pronounced on HWC compared to CWC at different landscape positions. The higher HWC under medium grazing density at the footslope position suggests the presence of carbohydrates, phenols, and lignin monomers compared to the summit position (Landgraf et al., 2006). Hot-water extractable C usually represents 3–6% of total organic C in soil and can serve as an early indicator of organic matter loss (Ghani et al., 2003). Our data indicate that the rate of decomposition was favored over accumulation of carbon under medium grazing density at summit position. While the lowest MBC and N were observed under low grazing density at the summit, they did not significantly differ from high grazing density at the same position. Contrary to soil C, this study showed changes in the total soil N as well as labile fraction of soil N (HWN, CWN, and MBN) as affected under different grazing densities at two landscape positions. Moreover, rhizodeposition and root exudates can greatly influence C and N turnover in soils, affecting their accrual or decomposition in rhizosphere (Kuzyakov et al., 2001).
The observed lack of variation in the SOC based on grazing density can also lead to insignificant changes in the β-glucosidase and phosphatase activities, consistent with prior studies associating reduced SOC with decreased β-glucosidase and phosphatase activities under intensive grazing (Prieto et al., 2011). Averaging over landscape positions, β-glucosidase activity was 1.8 times higher under low grazing density than the high grazing density, which suggested that the primary source of energy for the living soil microbial communities of low grazing system is attained from disaccharides such as cellobiose, a derivative of cellulose (Burns and Dick, 2002; Hewins et al., 2015). This study found no interaction effect between grazing densities and landscape positions on C cycling enzyme β-glucosidase, indicating that much of the existing soil organic matter may already be relatively stable following microbial decomposition (Fierer et al., 2009; Moore et al., 2011; Hewins et al., 2015). Urease and arylsulfatase enzymes were usually higher under low grazing density and at footslope positions, indicating a shared pattern of nitrogen and sulfur decomposition within SOM, potentially fulfilling the growth and cellular functions of microbial communities (Hewins et al., 2015). Independent of the landscape position, greater urease and alkaline phosphatase under low grazing density suggested greater mineralization with greater microbial community supported by organic nitrogen and phosphorus sources in ecosystems rich in grass production and associated litter (Mitchell et al., 2015). Lower enzymatic activities under high grazing density can also be associated with the reduced microbial abundance, especially AM fungi, G (−), G (+), fungi, actinomycetes. It is postulated that under high grazing density, microbial communities may not be supported by enzymes involved in nitrogen, carbon, and phosphorus cycling, experiencing adverse impacts compared to low or medium grazing densities.
The fungal to bacterial ratio was reduced by 26–40% under high grazing density at footslope position compared to other grazing densities and landscape positions. The non-AM fungal population was reduced significantly by 39% at the high grazing density compared to medium grazing density. Previous studies linked increased intensity of physical disturbance and decrease in the fungal biomarker (by 29.5–43.3%) and fungal:bacterial ratio in response to grazing (Kaur et al., 2005). Moreover, the AM fungi population was significantly declined under high grazing density at summit position compared to other grazing densities and landscape positions, likely due to the sensitivity of filamentous fungi to physical disturbances under high grazing pressure over low and medium grazing (Bardgett et al., 2001). In addition to fungal biomarkers, single-celled organisms showed lower abundance, particularly under high grazing density at the summit landscape position.
A physiological stress in certain bacterial species can be derived from the PLFA analysis, serving as an assessment tool for evaluating microbial community function under various treatments (Kaur et al., 2005). Microbial stress indicators revealed that gram (+)/gram (−) and saturated/unsaturated fatty acids were significantly lower under high grazing density at the footslope position. This reduction in the gram (+)/gram (−) bacterial ratio represented an increase in abundance of gram (−) bacterial PLFA, with the concomitant decrease in gram (+) bacterial PLFA, suggesting stressful conditions under high grazing density at summit. The higher saturated fatty acids reflected a well-adapted microbial community to environmental conditions in an ecosystem. However, communities experiencing stressed conditions tend to increase the proportion of unsaturated fatty acids, as noted under high grazing density at summit. The decreased ratio of sat/unsaturated fatty acids under high grazing density at summit position may indicate slightly weakened and unstable microbial community. Similarly, the observed lower mono/polysaturated ratio, especially under high grazing density at summit position, depicted prolonged stress likely due to environmental conditions such as animal trampling, intense grazing, pH, nutrient starvation, low moisture conditions. GNeg stress was calculated as the ratio of the sum of two monosaturated fatty acids (16:1ɷ7c and 18:1ɷ7c) and two cyclopropanoic fatty acids, i.e., 17:0 cyclo ɷ7c and 19:0 cyclo ɷ7c. Gram (−) bacteria generate cyclopropanoic fatty acids under stressed conditions, therefore, the higher the GNeg ratio, the less stressed the soil is. Medium grazing density represented the least stress for microbial communities among different grazing densities. Overall, these microbial stress ratios suggested that low and medium grazing densities at summit and footslope positions can provide sufficient nutrients for balanced bacterial growth through root exudates in rhizosphere. However, high grazing density, especially at summit position, might indicate elevated physiological stress for the soil microbial community, possibly due to higher exposure to radiation and evaporation rates, compared to footslope position (Saul-Tcherkas and Steinberger, 2009; Ben-David et al., 2011; Frostegård et al., 2011). While PLFA primarily focuses on changes in microbial community structure and biomass as indicators of stress, it captures diverse markers present across multiple microbial groups. Based on the PCA results, it was summarized that relatively stable and unstressed conditions for C and N fractions, enzymes related to nitrogen, phosphorus, and sulfur nutrients and microbial community might be present under medium grazing density at both summit as well as footslope positions. Positive correlations among C and N fractions and microbial communities indicate their capacity to influence each other synergistically.
High grazing density at summit landscape position mostly affected soil physicochemical and microbial composition, likely attributed to direct factors such as of trampling by hoof action and environmental exposure of the landscape position to radiation, wind erosion and evaporation. Increased grazing density of 0.72 animal units/ac at summit position declined N, C and S cycling by reducing urease, β-glucosidase, and arylsulfatase. Furthermore, microbial biomass nitrogen, hot-water extractable carbon and nitrogen, cold-water extractable nitrogen were also notably affected by high grazing density. High grazing density led to reductions in AM fungi, G (−), G (+), non-AM fungi, actinomycetes, fungi-to-bacteria ratio and total PLFA of the soil, along with an increase in microbial stress indicators. However, high grazing density, if practiced at footslope position, can partially mitigate some negative impacts on soil health parameters such as labile C and N fractions, as well as total PLFA. In contrast, medium grazing density of 0.41 animal units/ac at both summit and footslope position showed relatively stable and less stressed conditions with greater C and N fractions, enzymes associated with N, P and S nutrients, and the microbial community. Therefore, considering these positive outcomes, medium grazing density emerges as a more conducive alternative compared to high grazing density, particularly to ameliorate the potential adverse effects of overgrazing on soil health of mixed-grass prairie ecosystem. These results are important in terms of developing grazing regimes that balance livestock forage needs while maintaining a resilient and healthy ecosystem. Ongoing research on this rangeland study site is targeting to investigate microbiome diversity, abundance, and their relationship with microbial functions across distinct grazing densities. Moreover, further exploration into rhizosphere dynamics, particularly focusing on root interactions and nutrient cycling processes is needed.
The original contributions presented in the study are included in the article/supplementary material, further inquiries can be directed to the corresponding author.
SB: Data curation, Formal analysis, Methodology, Software, Writing – original draft. DS: Methodology, Writing – review & editing. CG: Conceptualization, Funding acquisition, Investigation, Project administration, Resources, Supervision, Validation, Writing – review & editing. JG: Methodology, Resources, Supervision, Validation, Writing – review & editing. SK: Investigation, Resources, Supervision, Writing – review & editing. HM: Methodology, Validation, Writing – review & editing.
The author(s) declare that no financial support was received for the research, authorship, and/or publication of this article.
The authors declare that the research was conducted in the absence of any commercial or financial relationships that could be construed as a potential conflict of interest.
All claims expressed in this article are solely those of the authors and do not necessarily represent those of their affiliated organizations, or those of the publisher, the editors and the reviewers. Any product that may be evaluated in this article, or claim that may be made by its manufacturer, is not guaranteed or endorsed by the publisher.
C, carbon; N, nitrogen; HWC, hot-water extractable carbon; HWN, hot-water extractable nitrogen; CWC, cold-water extractable carbon; CWN, cold-water extractable nitrogen; MBC, microbial biomass carbon; MBN, microbial biomass nitrogen; AM fungi, arbuscular mycorrhizal fungi; G (−), gram-negative bacteria; G (+), gram-positive bacteria; TBB, total bacterial biomass; TF, total fungi; F/B, fungi/bacteria; TPLFA, total phospholipid fatty acid; AP, alkaline phosphatase; AS, arylsulfatase.
Anderson, T.-H., and Domsch, K. H. (1989). Ratios of microbial biomass carbon to total organic carbon in arable soils. Soil Biol. Biochem. 21, 471–479. doi: 10.1016/0038-0717(89)90117-X
Banerjee, M. R., Burton, D. L., McCaughey, W., and Grant, C. (2000). Influence of pasture management on soil biological quality. J. Range Manag. 53, 127–133. doi: 10.2307/4003403
Bardgett, R. D., Jones, A. C., Jones, D. L., Kemmitt, S. J., Cook, R., and Hobbs, P. J. (2001). Soil microbial community patterns related to the history and intensity of grazing in sub-montane ecosystems. Soil Biol. Biochem. 33, 1653–1664. doi: 10.1016/S0038-0717(01)00086-4
Bardgett, R. D., and Wardle, D. A. (2003). Herbivore-mediated linkages between aboveground and belowground communities. Ecology 84, 2258–2268. doi: 10.1890/02-0274
Beck, T., Joergensen, R., Kandeler, E., Makeschin, F., Nuss, E., Oberholzer, H., et al. (1997). An inter-laboratory comparison of ten different ways of measuring soil microbial biomass C. Soil Biol. Biochem. 29, 1023–1032. doi: 10.1016/S0038-0717(97)00030-8
Ben-David, E. A., Zaady, E., Sher, Y., and Nejidat, A. (2011). Assessment of the spatial distribution of soil microbial communities in patchy arid and semi-arid landscapes of the Negev Desert using combined PLFA and DGGE analyses. FEMS Microbiol. Ecol. 76, 492–503. doi: 10.1111/j.1574-6941.2011.01075.x
Bending, G. D., Turner, M. K., Rayns, F., Marx, M.-C., and Wood, M. (2004). Microbial and biochemical soil quality indicators and their potential for differentiating areas under contrasting agricultural management regimes. Soil Biol. Biochem. 36, 1785–1792. doi: 10.1016/j.soilbio.2004.04.035
Bertram, J. E., Orwin, K. H., Clough, T. J., Condron, L. M., Sherlock, R. R., and O’Callaghan, M. (2012). Effect of soil moisture and bovine urine on microbial stress. Pedobiologia 55, 211–218. doi: 10.1016/j.pedobi.2012.03.004
Bottomley, P. J., Angle, J. S., and Weaver, R. (2020). Methods of soil analysis, part 2: microbiological and biochemical properties John Wiley & Sons, Wisconsin, Madison.
Burns, R. G., and Dick, R. P. (2002). Enzymes in the environment: activity, ecology, and applications Marcel Dekker, New York: CRC Press.
Conant, R. T., Paustian, K., and Elliott, E. T. (2001). Grassland management and conversion into grassland: effects on soil carbon. Ecol. Appl. 11, 343–355. doi: 10.1890/1051-0761(2001)011[0343:GMACIG]2.0.CO;2
Craine, J. M., Ballantyne, F., Peel, M., Zambatis, N., Morrow, C., and Stock, W. D. (2009). Grazing and landscape controls on nitrogen availability across 330 south African savanna sites. Austral Ecol. 34, 731–740. doi: 10.1111/j.1442-9993.2009.01978.x
Dodor, D. E., and Ali Tabatabai, M. (2005). Glycosidases in soils as affected by cropping systems. J. Plant Nutr. Soil Sci. 168, 749–758. doi: 10.1002/jpln.200521761
Dunn, B. H., Smart, A. J., Gates, R. N., Johnson, P. S., Beutler, M. K., Diersen, M. A., et al. (2010). Long-term production and profitability from grazing cattle in the northern mixed grass prairie. Rangel. Ecol. Manag. 63, 233–242. doi: 10.2111/REM-D-09-00042.1
Eivazi, F., and Tabatabai, M. (1977). Phosphatases in soils. Soil Biol. Biochem. 9, 167–172. doi: 10.1016/0038-0717(77)90070-0
Eivazi, F., and Tabatabai, M. (1988). Glucosidases and galactosidases in soils. Soil Biol. Biochem. 20, 601–606. doi: 10.1016/0038-0717(88)90141-1
Fierer, N., Grandy, A. S., Six, J., and Paul, E. A. (2009). Searching for unifying principles in soil ecology. Soil Biol. Biochem. 41, 2249–2256. doi: 10.1016/j.soilbio.2009.06.009
Findlay, R. H., and White, D. C. (1983). Polymeric beta-hydroxyalkanoates from environmental samples and Bacillus megaterium. Appl. Environ. Microbiol. 45, 71–78. doi: 10.1128/aem.45.1.71-78.1983
Frank, D. A., Depriest, T., McLauchlan, K., and Risch, A. C. (2011). Topographic and ungulate regulation of soil C turnover in a temperate grassland ecosystem. Glob. Chang. Biol. 17, 495–504. doi: 10.1111/j.1365-2486.2010.02219.x
Frostegård, A., and Bååth, E. (1996). The use of phospholipid fatty acid analysis to estimate bacterial and fungal biomass in soil. Biol. Fertil. Soils 22, 59–65. doi: 10.1007/BF00384433
Frostegård, Å., Tunlid, A., and Bååth, E. (2011). Use and misuse of PLFA measurements in soils. Soil Biol. Biochem. 43, 1621–1625. doi: 10.1016/j.soilbio.2010.11.021
Ghani, A., Dexter, M., and Perrott, K. (2003). Hot-water extractable carbon in soils: a sensitive measurement for determining impacts of fertilisation, grazing and cultivation. Soil Biol. Biochem. 35, 1231–1243. doi: 10.1016/S0038-0717(03)00186-X
Gillen, R. L., and Sims, P. L. (2002). Stocking rate and cow-calf production on sand sagebrush rangeland. J. Range Manag. 55, 542–550.
Griffiths, B., Ritz, K., Bardgett, R. D., Cook, R., Christensen, S., Ekelund, F., et al. (2000). Ecosystem response of pasture soil communities to fumigation-induced microbial diversity reductions: an examination of the biodiversity–ecosystem function relationship. Oikos 90, 279–294. doi: 10.1034/j.1600-0706.2000.900208.x
Guckert, J., Hood, M., and White, D. (1986). Phospholipid ester-linked fatty acid profile changes during nutrient deprivation of Vibrio cholerae: increases in the trans/cis ratio and proportions of cyclopropyl fatty acids. Appl. Environ. Microbiol. 52, 794–801. doi: 10.1128/aem.52.4.794-801.1986
Hewins, D. B., Fatemi, F., Adams, B., Carlyle, C. N., Chang, S. X., and Bork, E. W. (2015). Grazing, regional climate and soil biophysical impacts on microbial enzyme activity in grassland soil of western Canada. Pedobiologia 58, 201–209. doi: 10.1016/j.pedobi.2015.10.003
Holechek, J. L., Pieper, R. D., and Herbel, C. H. (1989). Range management. Principles and practices. Prentice-Hall.
Kandeler, E., and Gerber, H. (1988). Short-term assay of soil urease activity using colorimetric determination of ammonium. Biol. Fertil. Soils 6, 68–72. doi: 10.1007/BF00257924
Katsalirou, E., Deng, S., Nofziger, D. L., and Gerakis, A. (2010). Long-term management effects on organic C and N pools and activities of C-transforming enzymes in prairie soils. Eur. J. Soil Biol. 46, 335–341. doi: 10.1016/j.ejsobi.2010.06.004
Kaur, A., Chaudhary, A., Kaur, A., Choudhary, R., and Kaushik, R. (2005). Phospholipid fatty acid–a bioindicator of environment monitoring and assessment in soil ecosystem. Curr. Sci. :89, 1103–1112.
Kuzyakov, Y., Ehrensberger, H., and Stahr, K. (2001). Carbon partitioning and below-ground translocation by Lolium perenne. Soil Biol. Biochem. 33, 61–74. doi: 10.1016/S0038-0717(00)00115-2
Landgraf, D., Leinweber, P., and Makeschin, F. (2006). Cold and hot water–extractable organic matter as indicators of litter decomposition in forest soils. J. Plant Nutr. Soil Sci. 169, 76–82. doi: 10.1002/jpln.200521711
Makoi, J. H., and Ndakidemi, P. A. (2008). Selected soil enzymes: examples of their potential roles in the ecosystem. Afr. J. Biotechnol. 7, 181–191.
Manzano, M. G., and Návar, J. (2000). Processes of desertification by goats overgrazing in the Tamaulipan thornscrub (matorral) in North-Eastern Mexico. J. Arid Environ. 44, 1–17. doi: 10.1006/jare.1999.0577
Mitchell, J. P., Shrestha, A., Horwath, W. R., Southard, R. J., Madden, N., Veenstra, J., et al. (2015). Tillage and cover cropping affect crop yields and soil carbon in the San Joaquin Valley, California. Agron. J. 107, 588–596. doi: 10.2134/agronj14.0415
Moore, T. R., Trofymow, J., Prescott, C. E., and Titus, B. (2011). Nature and nurture in the dynamics of C, N and P during litter decomposition in Canadian forests. Plant Soil 339, 163–175. doi: 10.1007/s11104-010-0563-3
Moscatelli, M. C., Di Tizio, A., Marinari, S., and Grego, S. (2007). Microbial indicators related to soil carbon in Mediterranean land use systems. Soil Tillage Res. 97, 51–59. doi: 10.1016/j.still.2007.08.007
Mwanjalolo Jackson-Gilbert, M., Makooma Moses, T., Rao, K. P., Musana, B., Bernard, F., Leblanc, B., et al. (2015). Soil fertility in relation to landscape position and land use/cover types: a case study of the Lake Kivu pilot learning site. Adv. Agric. 2015, 1–8. doi: 10.1155/2015/752936
Patra, A. K., Abbadie, L., Clays-Josserand, A., Degrange, V., Grayston, S. J., Loiseau, P., et al. (2005). Effects of grazing on microbial functional groups involved in soil N dynamics. Ecol. Monogr. 75, 65–80. doi: 10.1890/03-0837
Paz-Kagan, T., Ohana-Levi, N., Herrmann, I., Zaady, E., Henkin, Z., and Karnieli, A. (2016). Grazing intensity effects on soil quality: a spatial analysis of a Mediterranean grassland. Catena 146, 100–110. doi: 10.1016/j.catena.2016.04.020
Prieto, L. H., Bertiller, M. B., Carrera, A. L., and Olivera, N. L. (2011). Soil enzyme and microbial activities in a grazing ecosystem of Patagonian Monte, Argentina. Geoderma 162, 281–287. doi: 10.1016/j.geoderma.2011.02.011
Saul-Tcherkas, V., and Steinberger, Y. (2009). Temporal and shrub adaptation effect on soil microbial functional diversity in a desert system. Eur. J. Soil Sci. 60, 871–882. doi: 10.1111/j.1365-2389.2009.01165.x
Saviozzi, A., Biasci, A., Riffaldi, R., and Levi-Minzi, R. (1999). Long-term effects of farmyard manure and sewage sludge on some soil biochemical characteristics. Biol. Fertil. Soils 30, 100–106. doi: 10.1007/s003740050594
Schacht, W. H., Volesky, J. D., Bauer, D. E., and Stephenson, M. B. (2011). Grazing systems for Nebraska Sandhills rangeland. Lincoln: University of Nebraska.
Sekaran, U., McCoy, C., Kumar, S., and Subramanian, S. (2019). Soil microbial community structure and enzymatic activity responses to nitrogen management and landscape positions in switchgrass (Panicum virgatum L.). Glob. Change Biol. Bioenergy. 11, 836–851. doi: 10.1111/gcbb.12591
Singh, S., Mayes, M. A., Shekoofa, A., Kivlin, S. N., Bansal, S., and Jagadamma, S. (2021). Soil organic carbon cycling in response to simulated soil moisture variation under field conditions. Sci. Rep. 11, 1–13. doi: 10.1038/s41598-021-90359-4
Smart, A., Derner, J., Hendrickson, J., Gillen, R., Dunn, B., Mousel, E., et al. (2010). Effects of grazing pressure on efficiency of grazing on north American Great Plains rangelands. Rangel. Ecol. Manag. 63, 397–406. doi: 10.2111/REM-D-09-00046.1
Smith, C. A., Phiefer, C. B., Macnaughton, S. J., Peacock, A., Burkhalter, R. S., Kirkegaard, R., et al. (2000). Quantitative lipid biomarker detection of unculturable microbes and chlorine exposure in water distribution system biofilms. Water Res. 34, 2683–2688. doi: 10.1016/S0043-1354(00)00028-2
Steffens, M., Kölbl, A., Totsche, K. U., and Kögel-Knabner, I. (2008). Grazing effects on soil chemical and physical properties in a semiarid steppe of Inner Mongolia (PR China). Geoderma 143, 63–72. doi: 10.1016/j.geoderma.2007.09.004
Stumpp, M., Wesche, K., Retzer, V., and Miehe, G. (2005). Impact of grazing livestock and distance from water source on soil fertility in southern Mongolia. Mt. Res. Dev. 25, 244–251. doi: 10.1659/0276-4741(2005)025[0244:IOGLAD]2.0.CO;2
Tabatabai, M. A., and Bremner, J. M. (1969). Use of p-nitrophenyl phosphate for assay of soil phosphatase activity. Soil Biol. Biochem. 1, 301–307. doi: 10.1016/0038-0717(69)90012-1
Tabatabai, M., and Bremner, J. (1970). Arylsulfatase activity of soils. Soil Sci. Soc. Am. J. 34, 225–229. doi: 10.2136/sssaj1970.03615995003400020016x
US Department of Agriculture, Soil Conservation Service. (1987). Jackson County soil survey. Washington, DC: Government Printing Office.
Vance, E. D., Brookes, P. C., and Jenkinson, D. S. (1987). An extraction method for measuring soil microbial biomass C. Soil Biol. Biochem. 19, 703–707. doi: 10.1016/0038-0717(87)90052-6
Willers, C., Jansen van Rensburg, P., and Claassens, S. (2015). Phospholipid fatty acid profiling of microbial communities–a review of interpretations and recent applications. J. Appl. Microbiol. 119, 1207–1218. doi: 10.1111/jam.12902
Yates, C. J., Norton, D. A., and Hobbs, R. J. (2000). Grazing effects on plant cover, soil and microclimate in fragmented woodlands in South-Western Australia: implications for restoration. Austral Ecol. 25, 36–47. doi: 10.1046/j.1442-9993.2000.01030.x
Keywords: stocking density, mixed-grass prairie, soil health, carbon, nitrogen, phospholipid fatty acid, soil enzymes
Citation: Bansal S, Sanyal D, Graham C, Gonzalez Hernandez JL, Menendez H and Kumar S (2024) Impacts of stocking densities on soil biochemical and microbial properties in a mixed-grass prairie ecosystem at two landscape positions. Front. Sustain. Food Syst. 8:1254973. doi: 10.3389/fsufs.2024.1254973
Edited by:
Zhou Li, Guizhou University, ChinaReviewed by:
Nirmalendu Basak, Central Soil Salinity Research Institute (ICAR), IndiaCopyright © 2024 Bansal, Sanyal, Graham, Gonzalez Hernandez, Menendez and Kumar. This is an open-access article distributed under the terms of the Creative Commons Attribution License (CC BY). The use, distribution or reproduction in other forums is permitted, provided the original author(s) and the copyright owner(s) are credited and that the original publication in this journal is cited, in accordance with accepted academic practice. No use, distribution or reproduction is permitted which does not comply with these terms.
*Correspondence: Sangeeta Bansal, c2FuZ2VldGEucGF1QGdtYWlsLmNvbQ==
Disclaimer: All claims expressed in this article are solely those of the authors and do not necessarily represent those of their affiliated organizations, or those of the publisher, the editors and the reviewers. Any product that may be evaluated in this article or claim that may be made by its manufacturer is not guaranteed or endorsed by the publisher.
Research integrity at Frontiers
Learn more about the work of our research integrity team to safeguard the quality of each article we publish.