 Xinzhao Zhou1,2,3,4
 Yanfeng Wu1,2,3Hewei Meng1,2,3Shujie Han1,2,3Za Kan1,2,3Yaping Li1,2,3*†Jie Zhang5*†
- 1College of Mechanical and Electrical Engineering, Shihezi University, Shihezi, China
- 2Key Laboratory of Northwest Agricultural Equipment, Ministry of Agriculture and Rural Affairs, Shihezi, China
- 3Engineering Research Center for Production Mechanization of Oasis Characteristic Cash Crop, Ministry of Education, Shihezi, China
- 4Foshan-Zhongke Innovation Research Institute of Intelligent Agriculture, Foshan, China
- 5Research Institute of Agricultural Mechanization, Xinjiang Academy of Agricultural Sciences, Urumqi, China
Efficient furrow fertilization is extremely critical for fertilizer utilization, fruit yield, and fruit quality. The precise determination of trench quality necessitates the accurate measurement of its characteristic parameters, including its shape and three-dimensional structure. Some existing algorithms are limited to detecting only the furrow depth while precluding the tridimensional reconstruction of the trench shape. In this study, a novel method was proposed for three-dimensional trench shape reconstruction and its parameter detection. Initially, a low-cost multi-source data acquisition system with the 3D data construction method of the trench was developed to address the shortcomings of single-sensor and manual measurement methods in trench reconstruction. Subsequently, the analysis of the original point cloud clarified the “coarse-fine” two-stage point cloud filtering process, and then a point cloud preprocessing method was proposed based on ROI region extraction and discrete point filtering. Furthermore, by analyzing the characteristics of the point cloud, a random point preselection condition based on the variance threshold was designed to optimize the extraction method of furrow side ground based on RANSAC. Finally, a method was established for extracting key characteristic parameters of the trench and trench reconstruction based on the fitted ground model of the trench side. Experimental results demonstrated that the point cloud pretreatment method could eliminate 83.8% of invalid point clouds and reduce the influence of noise points on the reconstruction accuracy. Compared with the adverse phenomena of fitting ground incline and height deviation of the original algorithm results, the ground height fitted by the improved ditch surface extraction algorithm was closer to the real ground, and the identification accuracy of inner points of the ground point cloud was higher than that of the former. The error range, mean value error, standard deviation error, and stability coefficient error of the calculated ditch width were 0 ~ 5.965%, 0.002 m, 0.011 m, and 0.37%, respectively. The above parameters of the calculated depth were 0 ~ 4.54%, 0.003 m, 0.017 m, and 0.47%, respectively. The results of this research can provide support for the comprehensive evaluation of the quality of the ditching operation, the optimization of the structure of the soil touching part, and the real-time control of operation parameters.
1. Introduction
Fruit cultivation and production have emerged as critical components of global agriculture and economy. According to the Food and Agriculture Organization of the United Nations (FAO), the total value of fruit production has increased steadily, as shown in Figure 1 (FAO, 2023). In the planting and management of perennial fruit trees such as grapes, pears, oranges, apples, and so on, furrow fertilization is an important link affecting fruit quality and yield. However, furrow fertilization in orchards is characterized by limited working cycles as well as being labor-intensive and time-consuming.
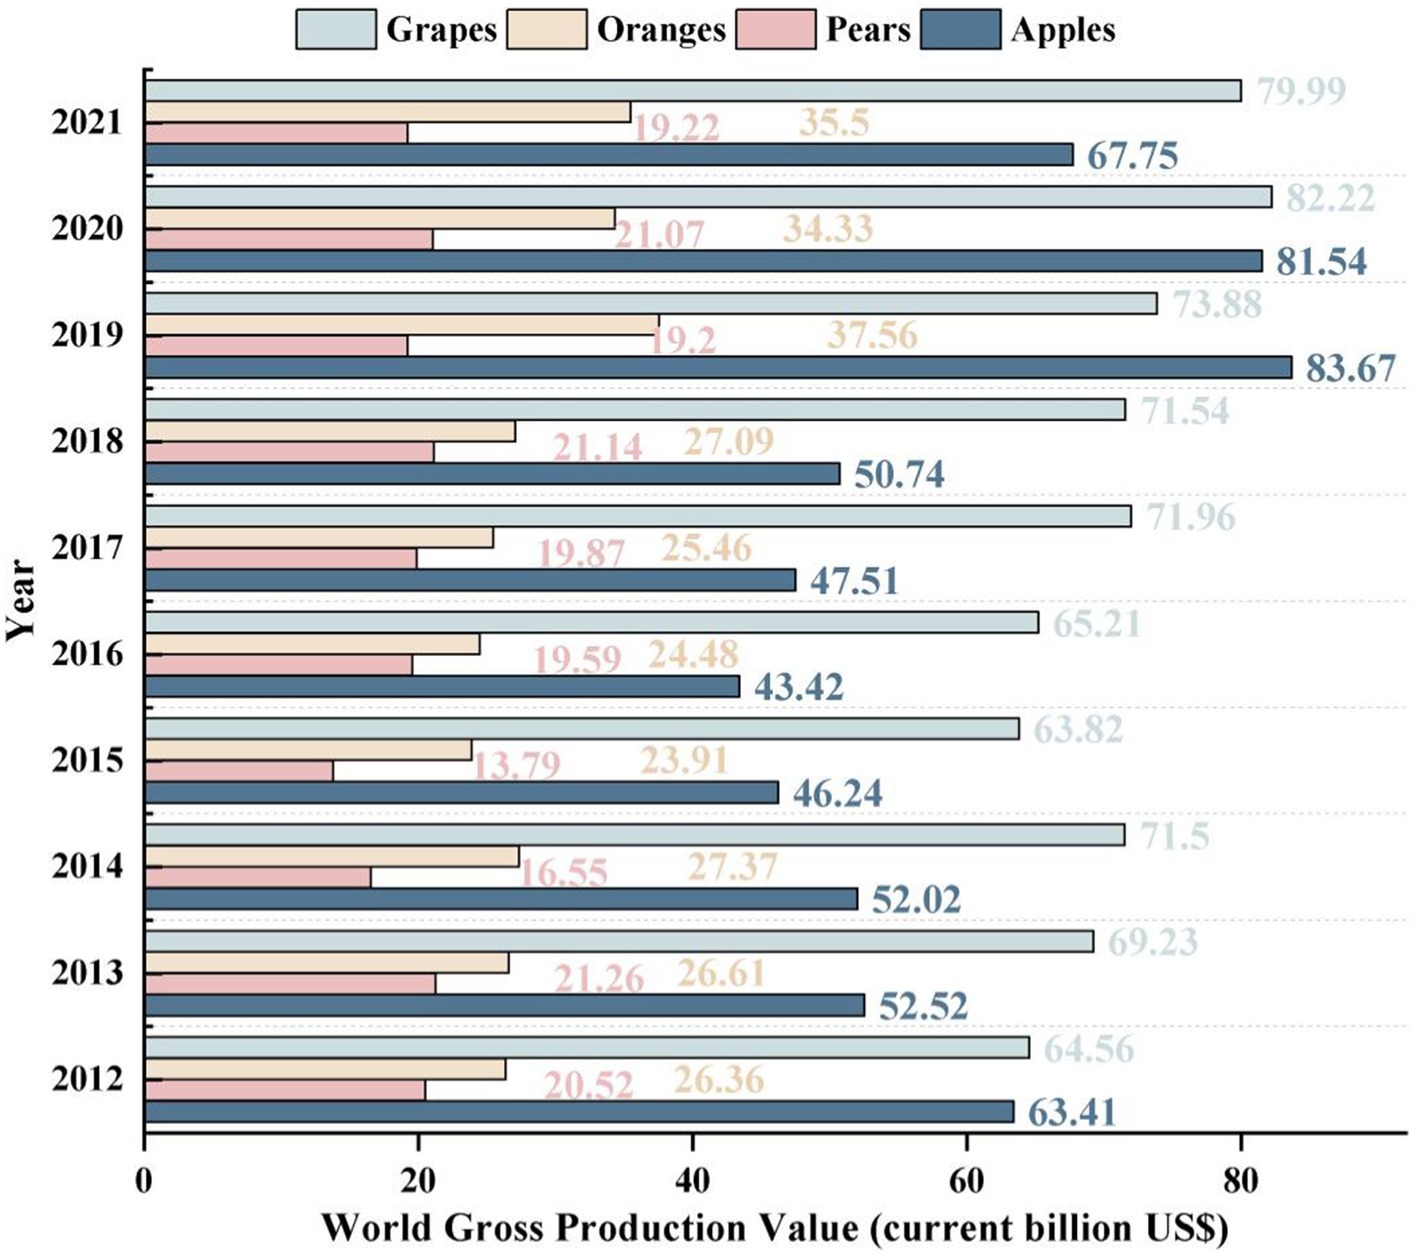
Figure 1. World gross production value of fruits.
With the rapid progress of industrialization and the aging of the population, the rural labor force is rapidly dwindling (Wu et al., 2021; Zhou et al., 2023b). This has led to an increasing conflict between labor demand and labor cost, which is having a significant adverse impact on traditional manual ditch fertilization methods (Akdemir et al., 2022). In response to these challenges, research into ditching fertilizer machines and related fields has been actively pursued (Babu et al., 2020; Zhan et al., 2022; Aikins et al., 2023; Han et al., 2023). In the process of mechanical ditching fertilization, the quality of ditching operation has a crucial impact on the depth of fertilization and the utilization rate of fertilizer, which directly affects the nutrient absorption and root growth of fruit trees and is crucial for the improvement of fruit yield and quality. Reasonable ditching depth is an important measure to ensure the root growth, yield increase, and quality of fruit trees (Zeng et al., 2008). However, achieving a high-quality trench fertilization operation at the optimum depth is a challenging task, as soil resistance changes affect the depth of the trench cutters, resulting in variations in the trench depth. Traditionally, the depth of a field trenching operation is adjusted based on the operator’s experience, and the quality of the operation is evaluated by manually sampling the trenching depth at random. This measurement method is easily affected by subjective consciousness, and it is difficult to reflect the overall furrow situation. All of the above factors present a great challenge for high-quality discarding fertilization in orchards. With the rapid development of precision agriculture and modern information technology, Smart sensors and the intelligent ditching depth monitoring system have gained widespread attention among scholars (Hassoun et al., 2022, 2023).
Lou et al. (2021a,b) proposed an independent control method for single-row tillage depth based on ultrasonic sensor detection and hydraulic adjustment, which significantly improved the stability of tillage depth between rows and within rows in deep tillage operation of subsoilers. Kirkegaard Nielsen et al. (2018) measured the current seeding depth using a plow position sensor combined with an ultrasonic soil surface sensor. Luo et al. (2022) proposed a Remote Monitoring System for Agricultural Machinery Operation in Conservation Tillage, which realized tillage depth measurement based on the dual attitude compound of a tractor body and three-point hitch mechanism with a lower pull rod. Zhao et al. (2022) established a mathematical model of rotation Angle and terrain height by using the encoder feedback of the rotation Angle of the sensing trailboard (STB) and realized the measurement of contact terrain height. Zhang et al. (2021) designed the mechanical structure of the equipment and then used the inclination sensor to build a control system to realize the automatic adjustment of the ditching depth of the double-row ditching fertilizer machine in orchards. Du et al. (2019) built a tillage depth measurement model with an error compensation coefficient based on the analysis of the influence of structural deformation and wheel sag on the measurement accuracy of the hanging rototiller set, which improved the measurement accuracy of the system. In our previous study, ultrasonic sensors were used to monitor the depth of ditching, and a wavelet denoising and Kalman filtering algorithm was proposed to reduce the noise of the ditching depth data, which improved the reliability of the data (Zhou et al., 2021, 2022, 2023a).
The research mentioned above has shown that conventional sensor measurement methods are effective in monitoring the furrow depth, which lays a solid foundation for improving the quality of mechanized ditch operations. However, to make a comprehensive judgment of the ditch operation quality, it is necessary to obtain the other parameters, such as ditch width, furrow shape, and additional indicators. The methods based on ultrasonic and tilt sensors still have some shortcomings in the acquisition of 3D data and the construction of furrow shapes.
Lidar overcomes the shortcoming of traditional sensors in obtaining spatial information and can work all day long to obtain the point cloud data of real trench spatial information. Lidar has been widely used in obstacle detection (Qin et al., 2023; Shang et al., 2023), terrain mapping (Kim and Choi, 2021; García-López et al., 2023), map construction (Su et al., 2021; Ao et al., 2022; Eisoldt et al., 2022; Rivera et al., 2023), agricultural information monitoring, and plant model reconstruction (Perez et al., 2018; Tsoulias et al., 2019; Campbell et al., 2023).
Therefore, in view of the challenges associated with measuring the feature parameters of ditches, reconstruction of ditches by conventional sensors, and comprehensive evaluation of the quality of ditches by depth data of individual ditches after field operation by ditchers, a lidar-based 3D reconstruction method for orchard ditches was proposed in this paper. The main contributions of this paper were as follows:
1. Currently, numerous studies have focused on monitoring of tillage depth without considering the reconstruction of a three-dimensional furrow shape, which is detrimental to the real-time control of the ditching operation and the overall quality evaluation of the operation. Motivated by the measurement requirements for 3D trench shape and characteristic parameters for quality evaluation of the ditching operation, this study proposed a framework for a 3D reconstruction method of orchard trenches based on low-cost lidar. This framework lays a foundation for evaluating the working quality of the ditching fertilizer machine, thereby enabling improvement and optimizing the structure and operating parameters of the soil-touching parts of the equipment.
2. A low-cost multi-source data acquisition system with a trench 3D data construction method was developed in this paper, which not only reduced the system cost but also realized real-time collection of multi-source data and the construction and storage of the 3D point cloud.
3. Due to the irrelevant objects and environmental disturbance factors in orchard, the original point cloud included a lot of noise and background points. Based on the “coarse-fine” two-stage filtering process, this paper proposed a method of ROI extraction and discrete point preprocessing for the orchard gully point cloud. The algorithm effectively reduced the influence of irrelevant background on gully reconstruction, the calculation amount of gully reconstruction. Simultaneously, this approach improved the quality of gully reconstruction, and further enhanced the adaptability of the reconstruction system to interference factors in the field complex environment.
4. A Furrow side ground surface model and feature parameter extraction algorithm were constructed. On the basis of point cloud noise reduction, the characteristics of the point cloud were analyzed, and a random point preselection condition based on variance threshold was designed. Subsequently, an improved extraction method of the ground surface model based on random sample consistency (RANSAC) was proposed to improve the extraction efficiency of the model. Finally, based on the fitted ground, a method was proposed to extract the key characteristic parameters of the trench shape and reconstruct the gully shape. The key parameters such as depth and width were extracted, and the trench shape reconstruction was realized.
This study establishes a foundation for achieving real-time control of mechanized trench fertilization. It is of great significance for the comprehensive evaluation of the quality of trench operation, the detection and monitoring of the trend of trench shape change, and the exploration of the optimal combination of mechanical structure and operation parameters.
The rest of this report is organized as follows. Section 2 introduced the methods and materials. Section 3 explained the structure of the system and algorithms. Section 4 presented the experimental results and discussion. Finally, Section 5 summarized the study and plans for future work.
2. Materials and methods
2.1. Experimental platform for orchard trench shape 3D reconstruction
The experimental platform of orchard trench shape 3D reconstruction in this research is shown in Figure 2A. The platform was mainly composed of a portable computer, lidar, bracket, encoder, elastic coupling, etc. The system power was provided by Beeste AS300 Mobile Power Supply (Shenzhen Beeste Technology Co., LTD., China). The lidar used in this study was LMS141-15100 two-dimensional lidar (SICK AG, Germany), as shown in Figure 2B. The protection class is IP67, with good dust-proof and waterproof performance. To sum up, the lidar can be adapted to a ditching operation environment.
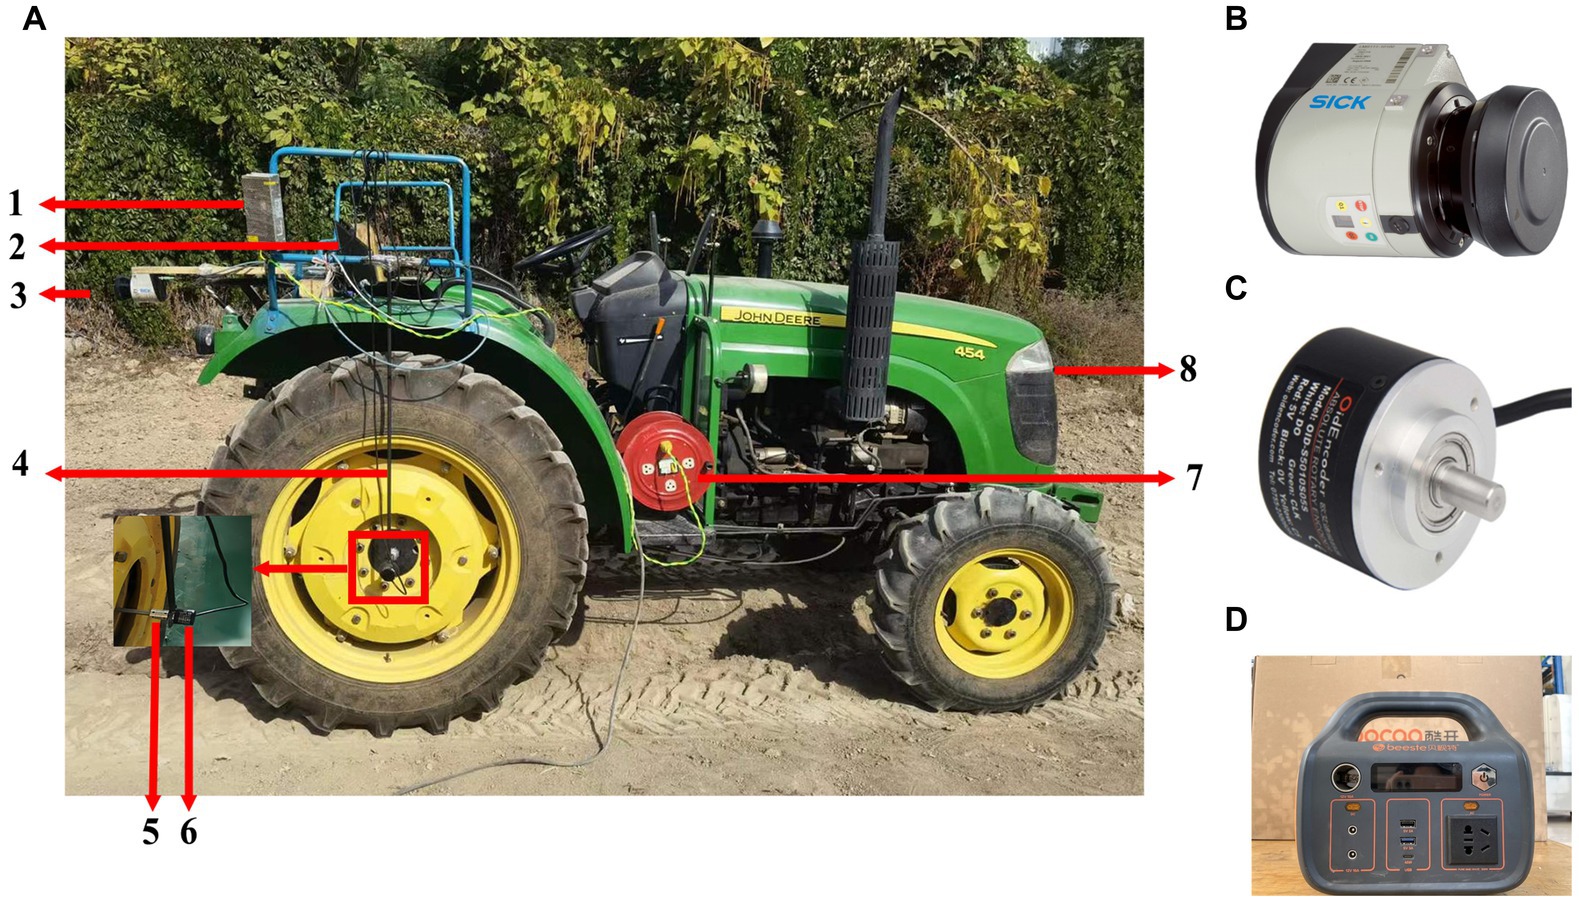
Figure 2. Overall layout of test platform and key modules. (A) Overall layout of test platform. Computer power conversion module, 1; Portable computer, 2; Lidar, 3; Encoder fixed frame, 4; Coupling, 5; Encoder, 6; Removable power socket, 7; JOHN DEERE 454 45HP Wheel Tractor, 8. (B) LMS141-15100 two-dimensional Lida. (C) OidEncoder Absolute encoder. (D) Beeste AS300 mobile power.
The OidEncoder absolute encoder (Oid Technology Co., LTD., China) was used to provide forward distance data, as shown in Figure 2C. The resolution of the encoder is 4,096 P/R, and the protection level is IP68. Compared with the photoelectric encoder, the encoder was more adaptable to vibration, shock, water, gas, oil, and other interference factors.
2.2. The overall flow of the reconstruction method
The reconstruction method content of this research was primarily divided into four parts: original point cloud acquisition, point cloud pretreatment, trench side ground model and characteristic parameter extraction, and 3D trench shape reconstruction method, as illustrated in Figure 3. The original point cloud was acquired jointly by lidar and encoder. However, due to sensor system errors, unstructured environmental interference factors, and other reasons, many discrete points and background point clouds were generated in the original point cloud. To improve the reliability and reduce the computational cost of trench reconstruction, point cloud ROI region extraction and point cloud filtering technology were utilized for point cloud pretreatment to reduce the influence of irrelevant objects and point cloud noise on the reconstruction result. Based on this, the trench ground model was fitted, and the characteristic parameters of the groove shape were calculated. Finally, the construction of the three-dimensional furrow was completed.
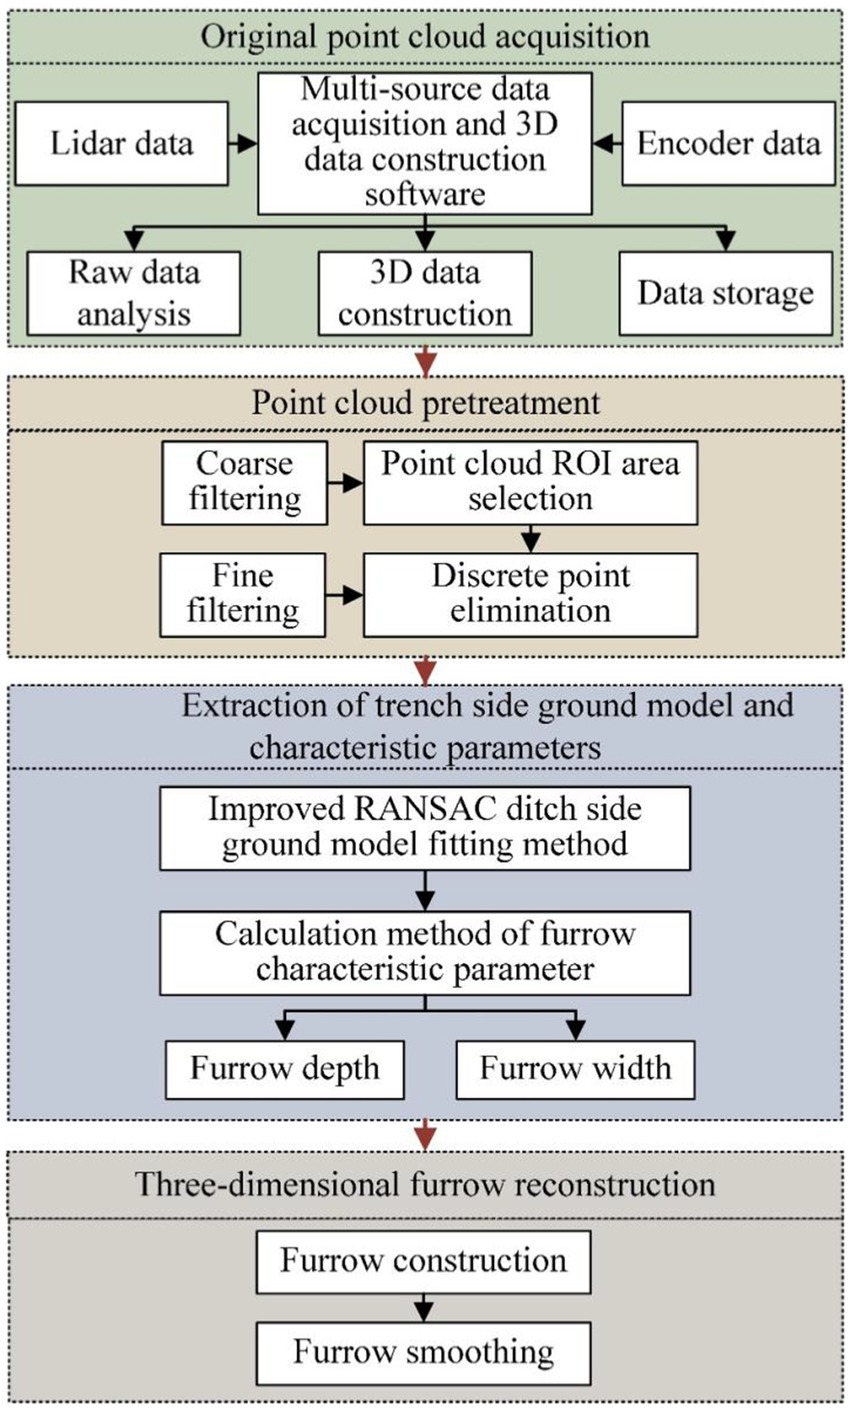
Figure 3. Schematic diagram of the data processing flow.
3. System and algorithm description
3.1. Multi-source data acquisition and three-dimensional data construction system
To obtain the point cloud information, Microsoft Visual Studio.NET 2019 was used as the development platform for building a multi-source data acquisition and 3D data construction system. This system primarily completed the collection, analysis, and conversion of lidar and encoder data and realized the construction and preservation of three-dimensional point cloud data. The system interface is shown in Figure 4A.
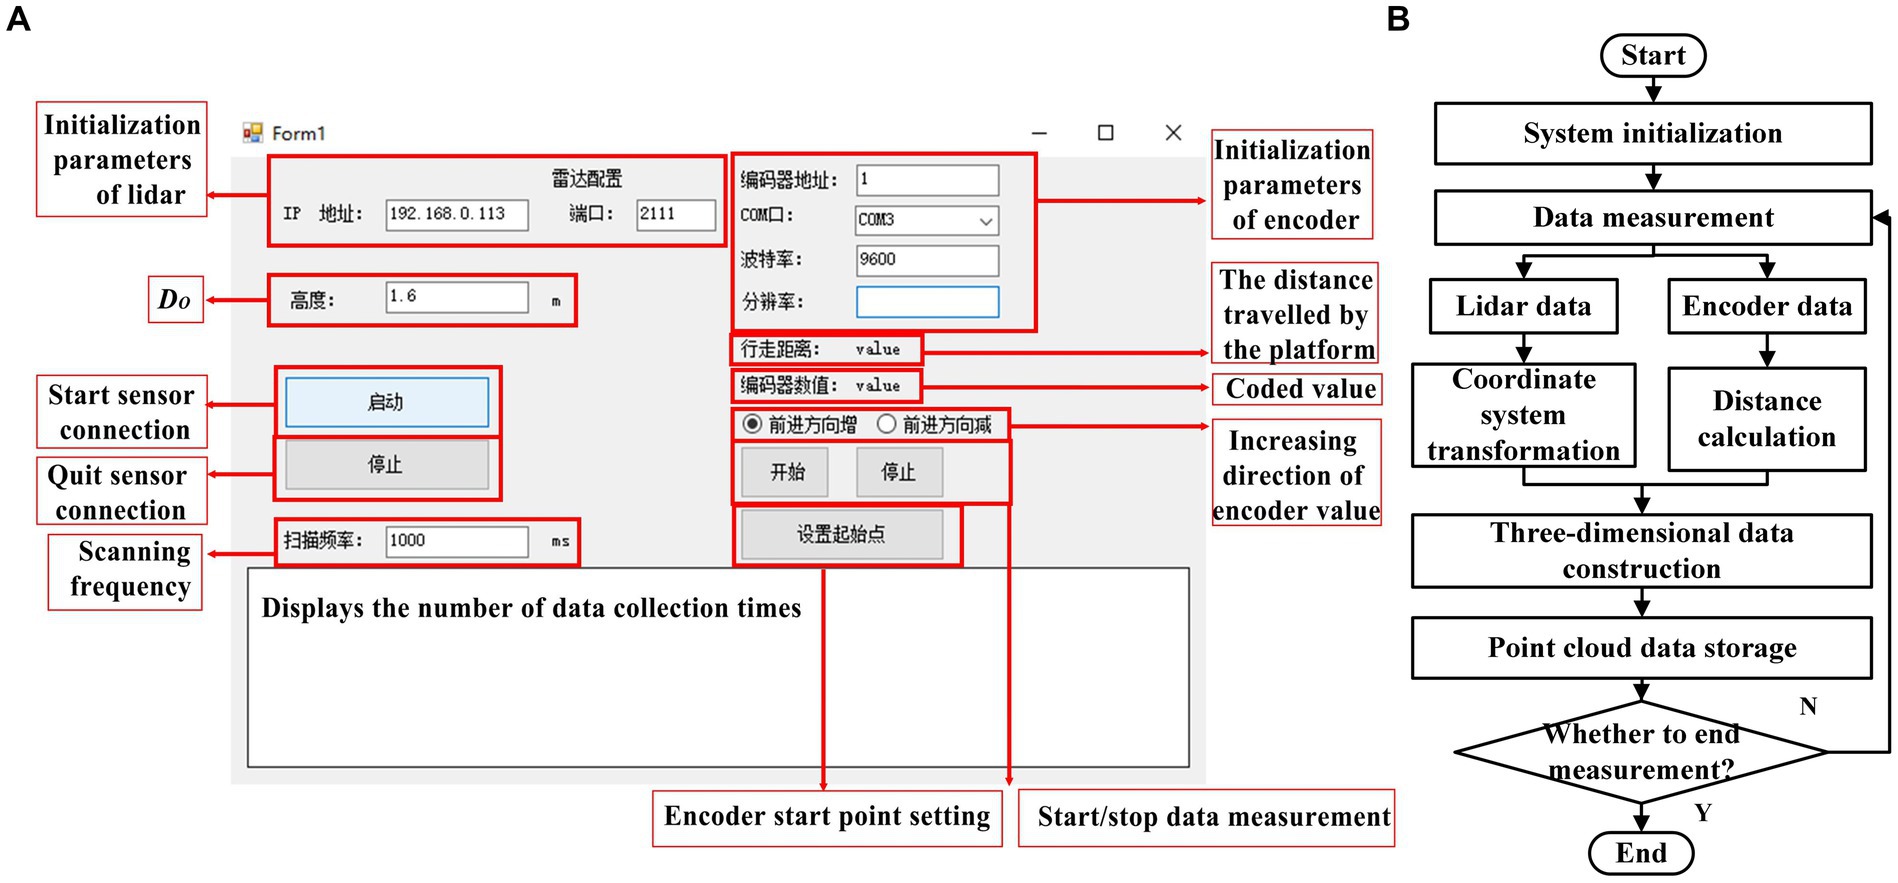
Figure 4. The system interface and operation process. (A) The system interface. (B) The operation process.
During system operation, initialization parameters were initially set followed by sending startup instructions to the lidar and encoder. The system then analyzed the received data to complete the calculation of the traveling distance and the conversion of the lidar coordinate system, which laid the foundation for the construction of 3D data. Subsequently, 2D Lidar data and encoder data were integrated to achieve the construction and preservation of 3D point cloud data, completing a single cycle of system operation. The system repeated the above operation process according to the set scanning frequency until the system stopped running. The system operation process is shown in Figure 4B.
The resolution of the angular step width of the lidar was 0.5°, the scanning field of vision was −45 ~ 225°, and the lidar was 1.3 m from the ground. The raw data output of the lidar was given in polar coordinates, with the angle denoted as and the detected distance as . To realize the calculation of 3D point cloud coordinates, polar coordinate data were converted into a rectangular coordinate system using the conversion formula shown in Eq. (1) (Li and Liu, 2013):
where is the point coordinates of the converted cartesian coordinate system, is the distance scanned by the lidar, and is the angle value corresponding to .
When calculating the trench depth data, the current trench depth data is usually calculated according to Eq. (2) based on the reference plane of the trench surface, as shown in Figure 5:
where DB is the trench depth, DM is the distance between the lidar and the trench bottom, and DS is the distance between the radar and the trench surface, DS = 1.3 m.
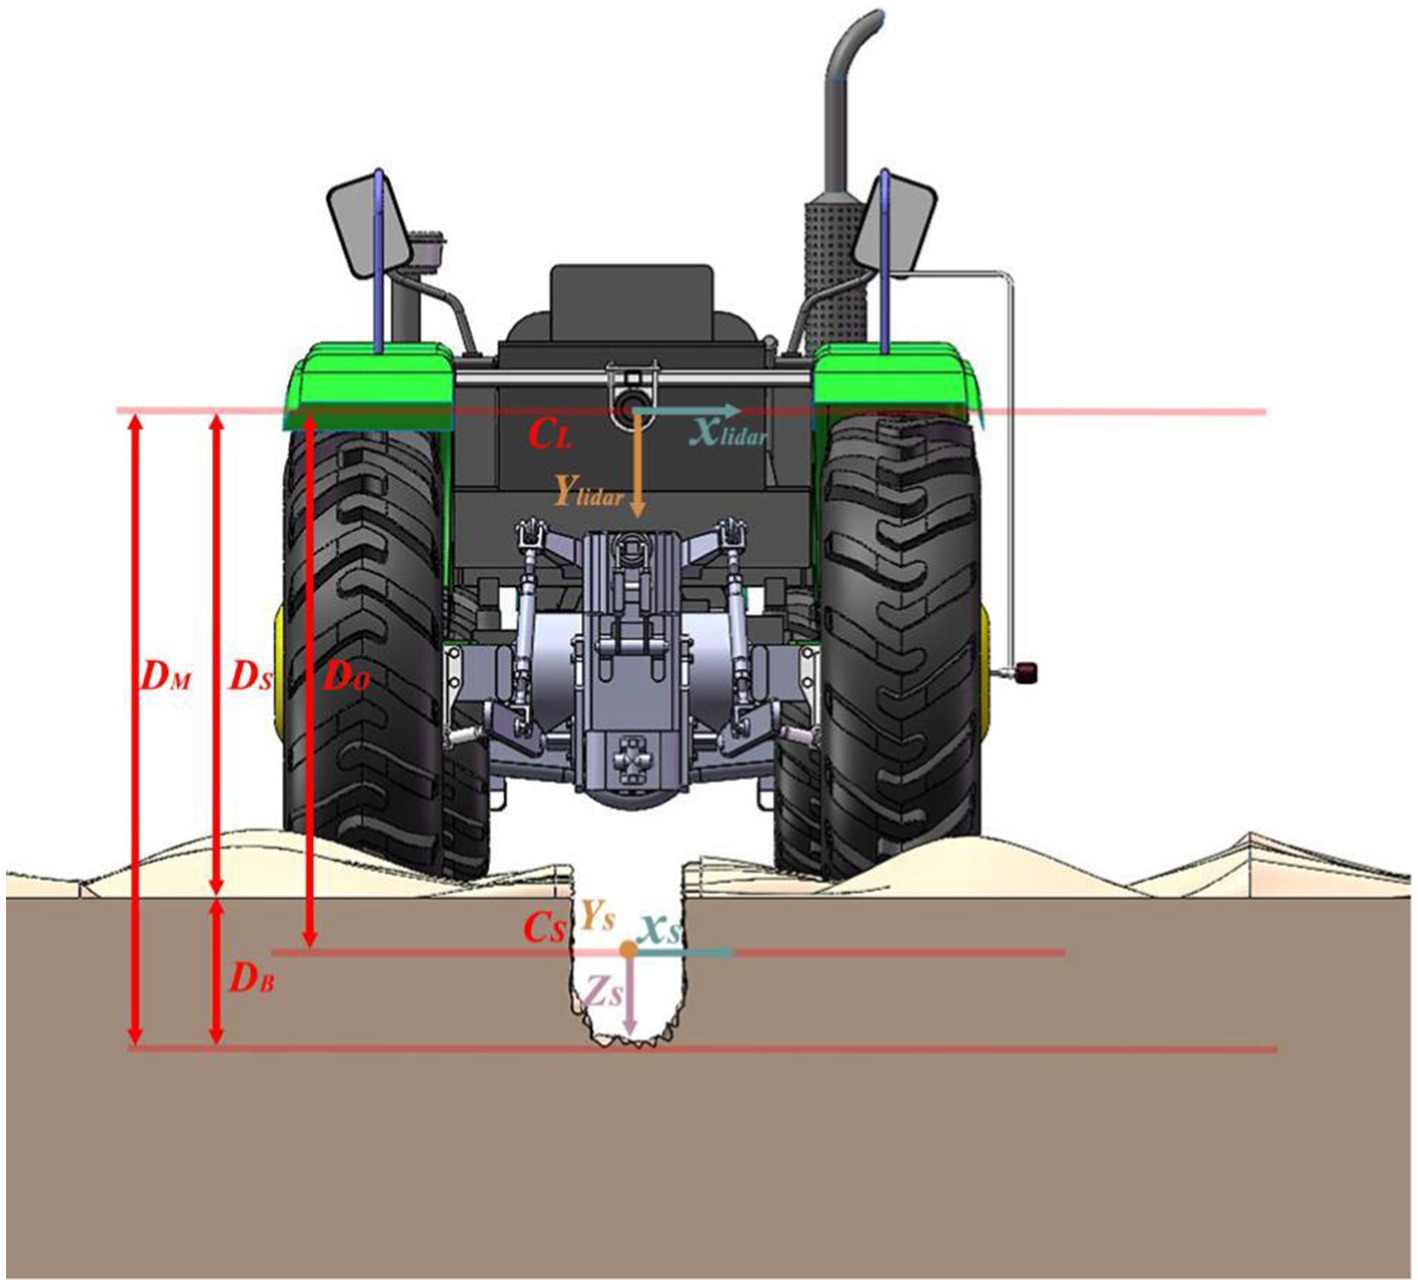
Figure 5. The platform coordinate system.
As evidenced by Eq. 2, different from the reconstructed objects above the ground such as buildings and trees, the research focus of this paper was the point clouds on both sides and below the trench ground, while most of the point clouds above the ground were considered as background noise. Therefore, when constructing point cloud data, the origin of the coordinate system reconstructed was placed below the ground to improve Eq. 1. The improved lidar data conversion method is shown in Eq. 3:
where DO is the distance between the lidar and the origin of the reconstructed coordinate system.
Typically, the depth and width of ditching fertilization in orchards range from 20 to 40 cm (Liu et al., 2020). Considering the range of trench depth and width, the distance between lidar and ground DS, DO was set as 1.60 m in this paper.
Before the operation of the 3D reconstruction platform, the current position was set as the zero point of the encoder, and the walking distance was obtained in real time during the operation of the platform. The forward distance of the platform is calculated as follows (Lee et al., 2020; Oid Technology Co., LTD., 2023a,b):
where L is the diameter of the tractor wheel, and M is the encoder value.
The winding number of the encoder is 16. When the driving distance of the platform is too long and exceeds the winding number range of the encoder, the encoder value will return to zero and recalculate the winding number. Therefore, this paper improved the calculation method of platform advance distance, as shown in Eq. 5:
where n is the number of times the coded value returns to zero.
Following data conversion, the point cloud data were assembled by utilizing the lidar data as the X and Z axes coordinates and further incorporating the encoder data as the Y axis coordinates. The platform coordinate system is shown in Figure 5. CL was the coordinate system of the lidar, and CS was the 3D coordinate system of the furrow point cloud. The X-axis of the CS was the same as the CL, the z-axis of the CS was provided by the Y-axis of the CL, and the Y-axis data of the CS was provided by the encoder.
3.2. Orchard gully point cloud ROI region extraction and discrete point pretreatment method
In this paper, the pretreatment of the point cloud in orchards was mainly divided into two steps: rough and fine treatment. Initially, the rough processing of the original point cloud was achieved by extracting the regions of interest (ROI) of the orchard point cloud and subsequently removing a significant number of irrelevant background noise points. On this basis, the influence of environmental noise and other adverse factors on the quality of the cloud was further reduced by the second removal of discrete points, thereby enhancing the overall quality of the point cloud.
3.2.1. ROI extraction of original point cloud
Due to the large field of view of lidar, many irrelevant targets, such as carports, trees and pedestrians, were present in the original point cloud data, leading to a significant increase in processing time for trench reconstruction. Furthermore, the critical region point cloud occupied a finite fraction of the original point cloud data. When reconstructing the prototype point cloud directly, a plethora of irrelevant interference details would be introduced, as depicted in Figure 6A. Therefore, a pass-through filter was used to select the ROI of the furrow to restrict the direction range of the X and Z axes of the point cloud.
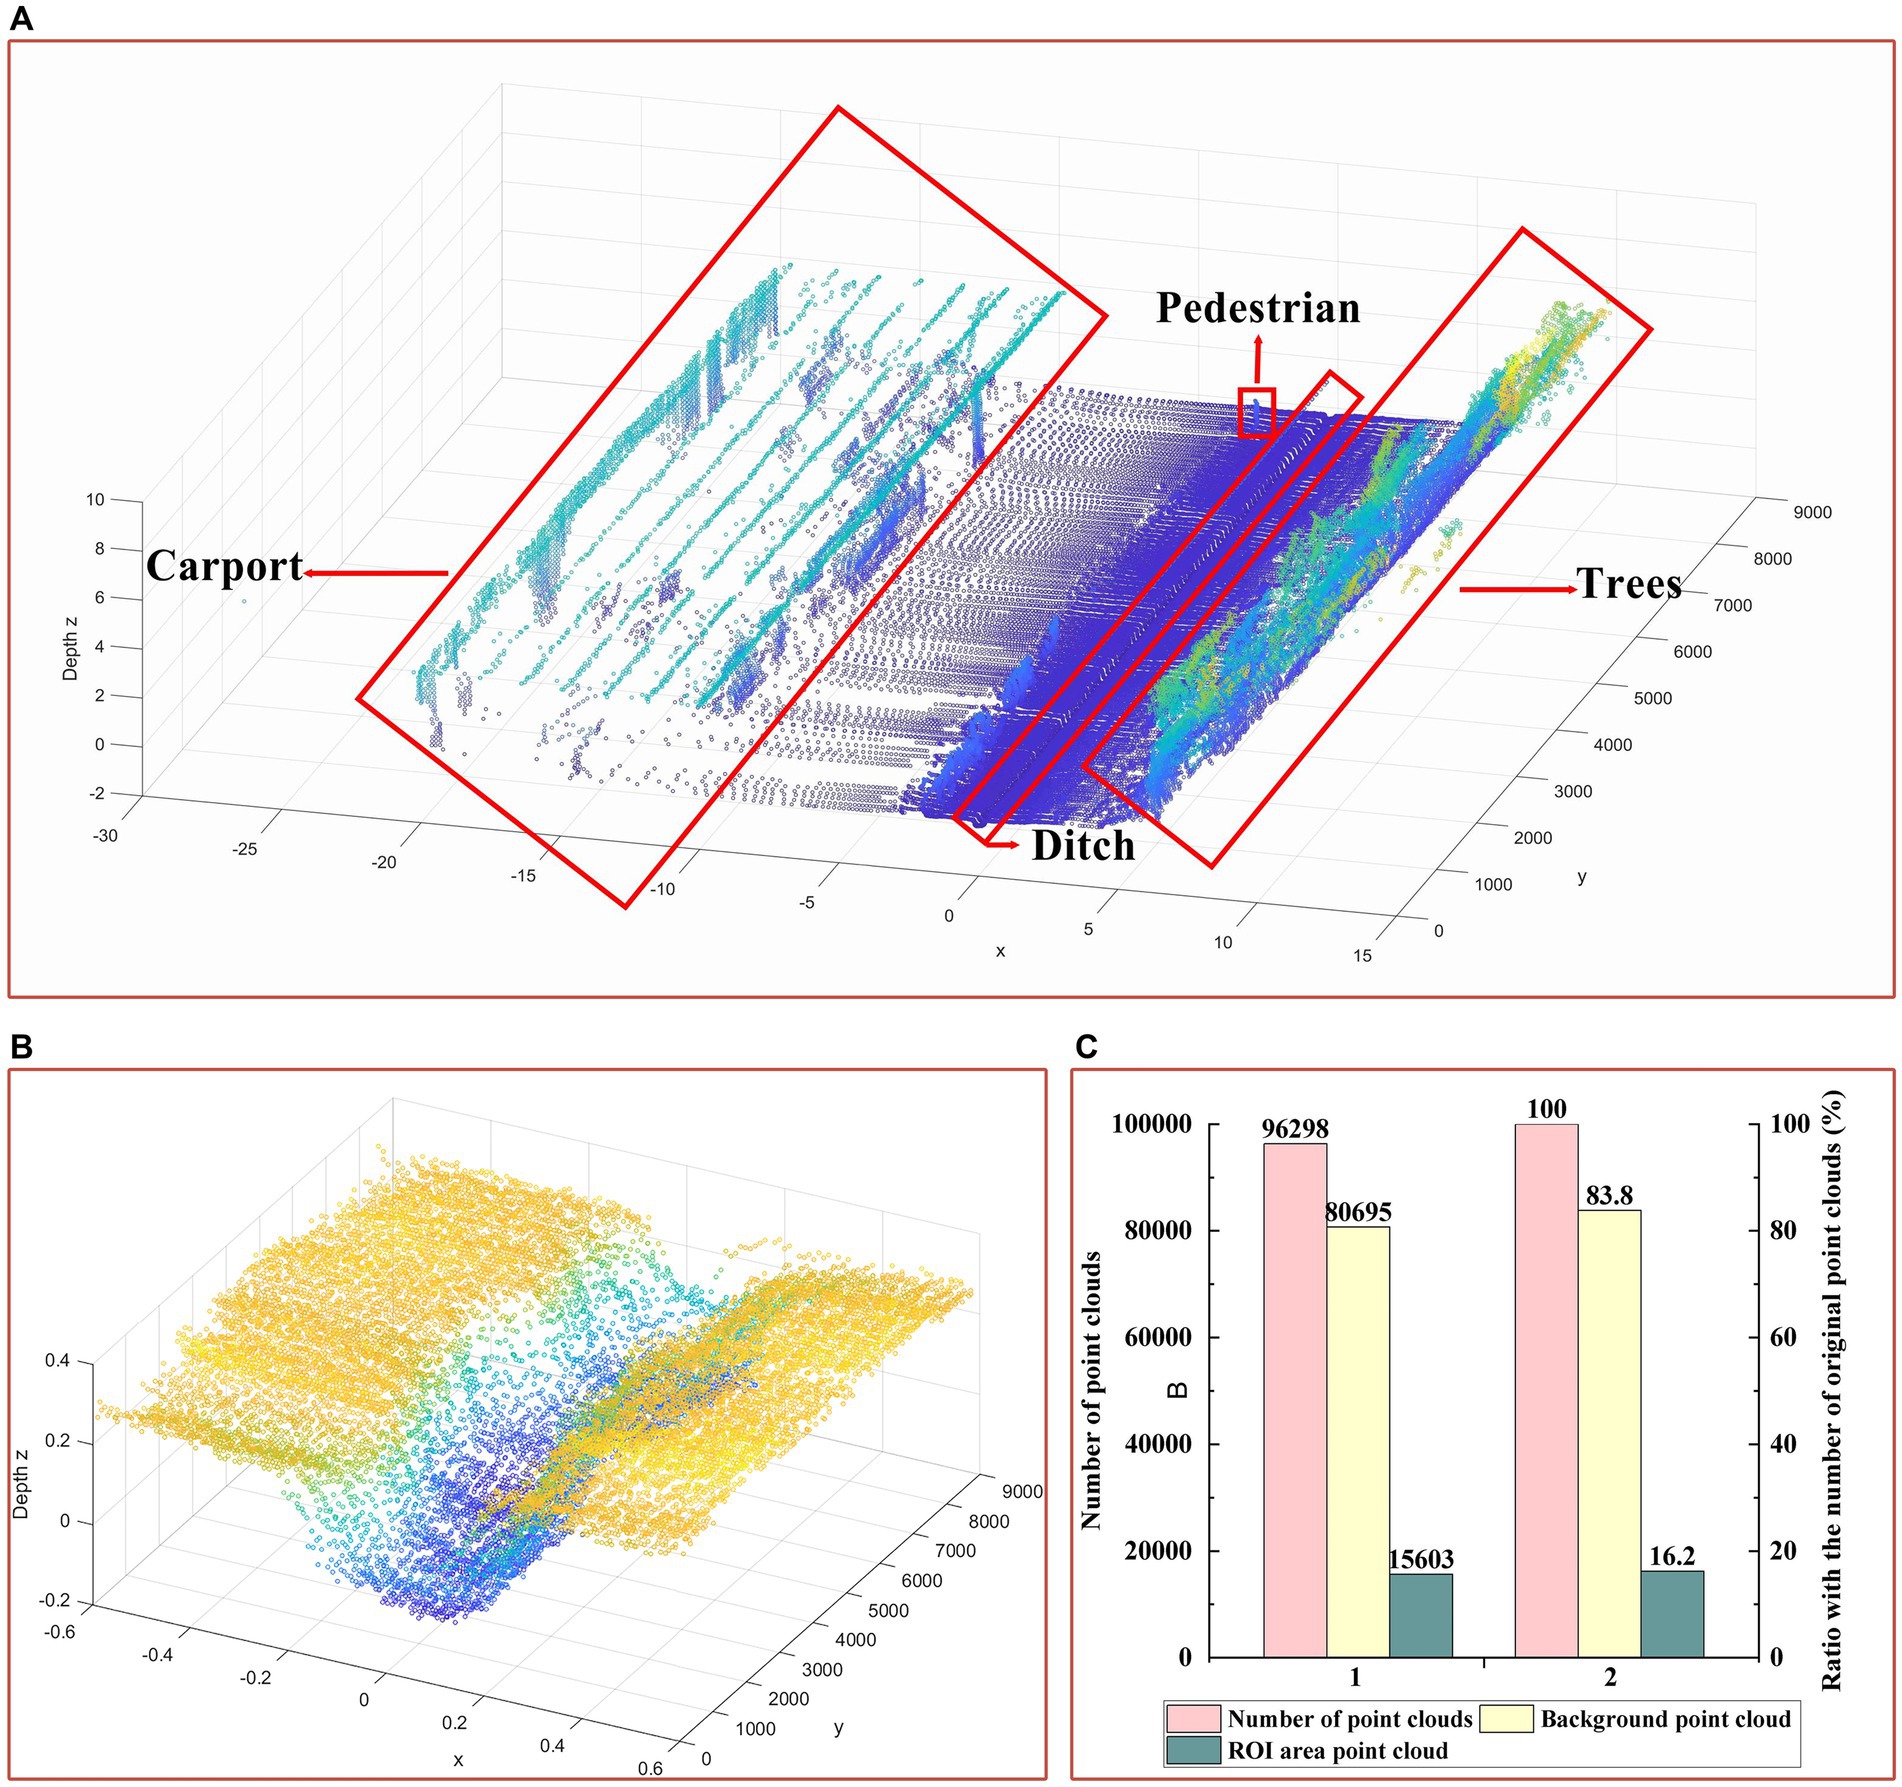
Figure 6. Comparison of original point cloud and ROI extraction results. (A) Original point cloud. (B) ROI extraction results. (C) Point cloud quantity comparison.
According to the range of the ditching depth and width as well as the value of DR, the conditional constraints for the ROI in this paper are shown in Eq. 6:
The original point cloud consisted of 96,298 data points, while the ROI only contained 15,603 point clouds. This resulted in the elimination of 83.8% of invalid data points, thereby significantly reducing the computational load for subsequent algorithms, as shown in Figure 6.
3.2.2. Discrete point pretreatment
To eliminate noise points on the ground, statistical filtering (Jin et al., 2021) was employed in this study, and the filtering range was . The principle is as follows:
1. Creating a point set of neighborhoods for each point using kd-tree
2. Traversing the point cloud to calculate the average distance between the current point and its neighboring points , where k = 5
1. Points in the point cloud whose is greater than the threshold T are defined as outlier noise points and removed from the data. The formula for calculating the threshold T is as follows:
where μ and σ are the mean and standard deviation of the mean distance in all point clouds, respectively.
When comparing the average distance of the point clouds, it was observed that statistical filtering retained the details of the furrow and effectively removed outliers, as shown in Figures 7A,B.
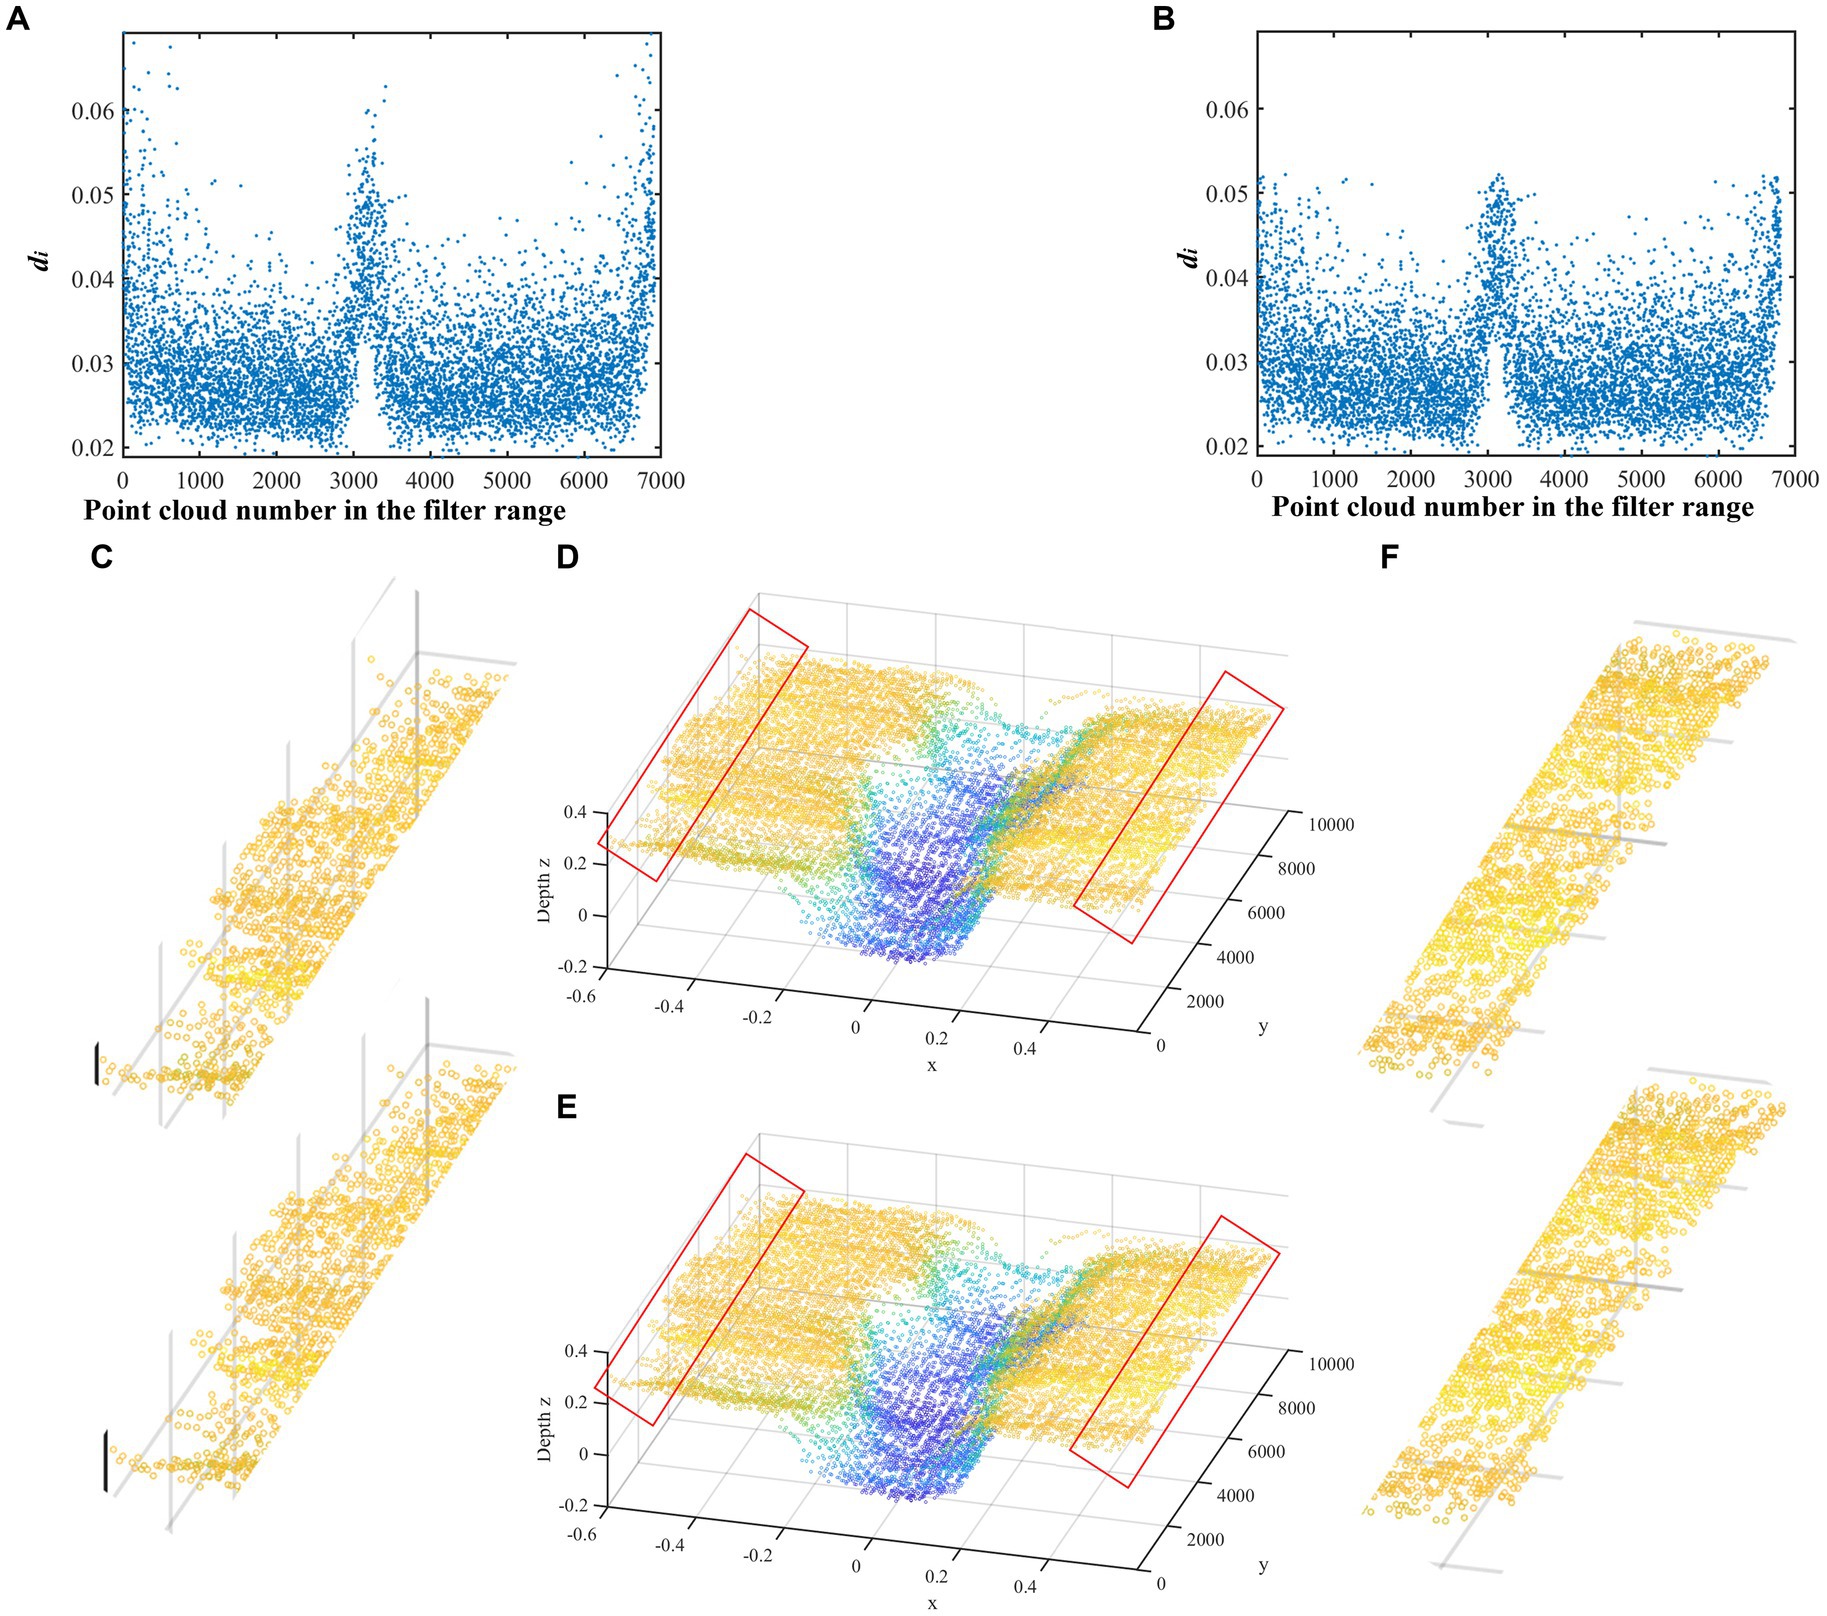
Figure 7. Effect of statistical filtering. (A) The di value before statistical filtering. (B) The di value after statistical filtering. (C) The contrast result of the red area on the left of the point cloud. (D) The trench shape before statistical filtering. (E) The trench shape after statistical filtering. (F) The contrast result of the red area on the right of the point cloud.
3.3. Extraction of trench side ground model and characteristic parameters
3.3.1. Improved furrow side ground model extraction method based on RANSAC
The ground model of the trench served as the reference surface for determining the depth and width of the trench, thereby playing a critical role in the calculation of the characteristic parameters. The quality of the trench surface model directly affected the accuracy of the calculation of the trench characteristic parameters. The mathematical equations are as follows:
where (x, y, z) are the three-dimensional space coordinates of the points on the plane and (a, b, c) are the normal vector in the plane. In addition, since the trench ground has a certain thickness, as shown in Figure 8A, the thickness of the ground at the trench side was set as 2β in this paper.
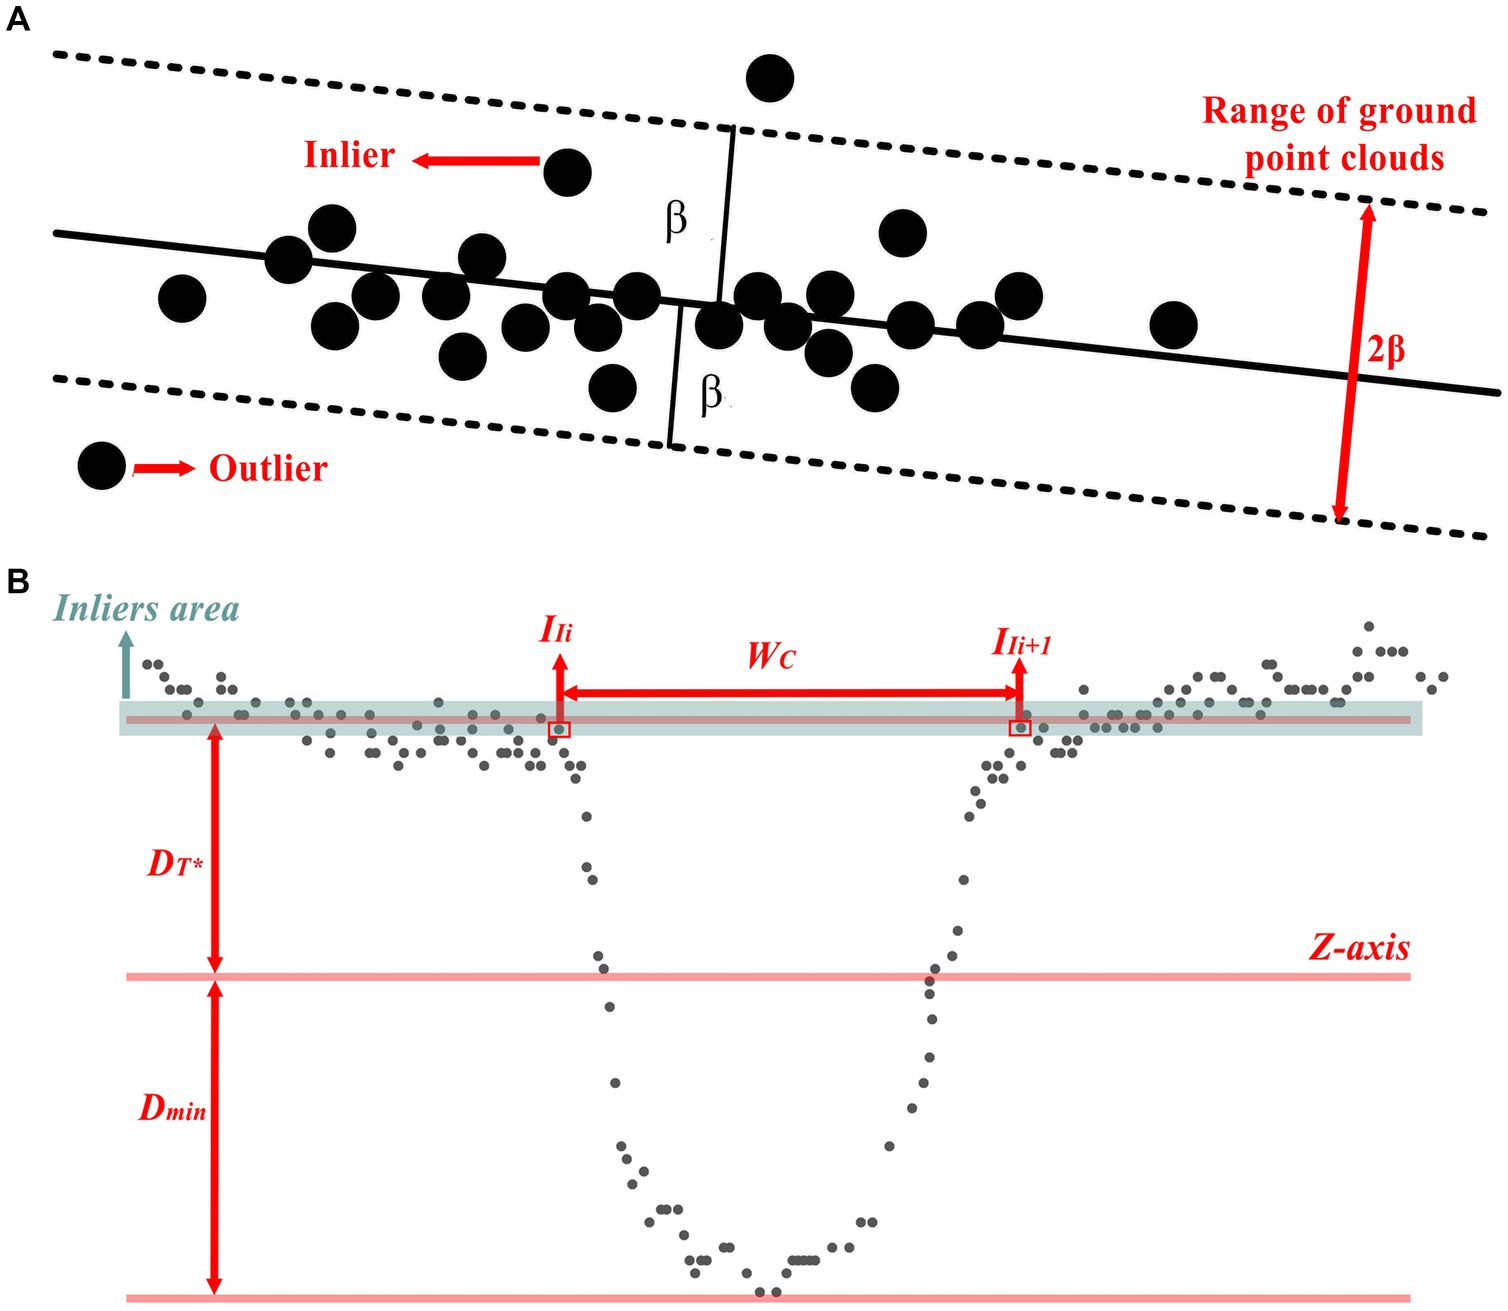
Figure 8. Schematic diagram of ground point cloud structure and characteristic parameter calculation method. (A) Schematic diagram of the selection of ground point clouds on the trench side. (B) Calculation diagram of ditch depth and width.
The steps of ground detection at the ditch side of the orchard based on the RANSAC algorithm (Fischler and Bolles, 1981) are as follows:
1. Randomly selected three points from the point cloud in the filtered ROI region to construct the initial trench surface L, and the parameter values of a, b, and c are calculated according to Eq. (9).
2. Calculate the distance dp from point pi(xi, yi, zi) to ground L according to Eq. (10), with a threshold of ground point cloud range q. When dp < β, point pi(xi, yi, zi) is labeled as an inlier and Ci the number of inliers.
1. Repeat steps 1 and 2 for M times to obtain the ground L* containing the largest inlier set Cimax as the best ditch side ground model.
However, the aforementioned method necessitates the traversal of all point cloud data at each iteration, leading to a rapid increase in computational cost with an increase in point cloud data. Moreover, the selection quality of the three random points significantly influences the efficiency of optimal model extraction. The orchard ground, unlike the cement road, is typically rough and undulating, thereby presenting a challenge for the selection of random points and reducing the speed of the best trench side ground model extraction.
To improve the computational efficiency of the optimal trench side ground model, the characteristics of point clouds were analyzed, and the RANSAC algorithm-based detection method for orchard furrow side ground was refined.
As can be seen from Figure 7E, the ground point clouds exhibited small spacing and a tightly packed distribution, whereas the non-ground point clouds were widely spaced and sparsely distributed. Leveraging these distinctive features, an enhanced RANSAC algorithm was developed, which involved the construction of a variance threshold preselection condition to evaluate the discretization level among the randomly selected points. The steps of the optimized method are as follows:
1. Randomly selected three points from the point cloud in the filtered ROI region. Calculate the variance γ of the three points on the z-axis according to Eq. (11).
where is the average value of the three points on the z-axis.
1. Set the height variance threshold γ*. When γ ≥ γ*, discard the current three points and repeat step 1, otherwise go to Step 3.
2. Construct the initial trench surface L, and calculate the parameter values of a, b, and c according to Eq. (9). Then, calculated the distance dp from point pi(xi, yi, zi) to ground L according to Eq. (10), with a threshold of ground point cloud range q. When dp < β, point pi(xi, yi, zi) is labeled as an inlier and Ciwas the number of inliers.
3. Repeat steps 3 for M times to obtain the ground L* containing the largest inlier set Cimax as the best ditch side ground model.
3.3.2. Calculation method of trench characteristic parameters
Based on the selected optimum trench side ground model and combined with the coordinate system of the trench point cloud, a calculation diagram of the trench depth and width is shown in Figure 8B.
Equation (2) was improved by taking the optimum ground model as the reference surface for the calculation of trench depth. The calculation method of trench depth is shown in Eq. (12):
where DC is the trench depth, is the value of Z-axis of the selected optimum trench side ground model in the CS, and Dmin is the minimum value of Z-axis in the CS.
The inliers region of the ground model was designated as the candidate area for computing the trench width. Subsequently, the distance between point and its adjacent point on the X-axis was iteratively traversed. The maximum distance between two adjacent point clouds was considered as the ditch width under the current scanning. The calculation method is illustrated in Eq. (13), and the definition of point cloud candidate region is shown in Eq. (14):
3.4. Trench reconstruction
The Delaunay triangulation algorithm has a sound geometrical concept and strong theoretical basis, and this makes it ubiquitously used in various fields, such as surface reconstruction, digital terrain model, finite element analysis, and so on. Therefore, in this paper, a point-by-point insertion method was used to construct a Delaunay triangulation network to reconstruct the trench surface. Furthermore, the Laplace algorithm was used to smooth the furrow and enhance the reconstruction effect to make it more accurate and closer to the actual effect.
4. Experimental results and discussion
4.1. Experiment
To assess the performance of the trench reconstruction platform and evaluate the efficacy of the system, a field performance test was conducted in the experimental field located in the North district of Shihezi University. A ditching operation was carried out in the test field, with a total length of 10 m. The ditch depth range was 30 ± 5 cm and the width range 30 ± 10 cm, as shown in Figure 9A. Due to the phenomenon of soil collapse and accumulation at the beginning and end of the trench after ditching operation, a 0.5 m-wide zone on both sides of the trench was deemed invalid, thereby resulting in an effective trench length of 9 m, as illustrated in Figure 10B.
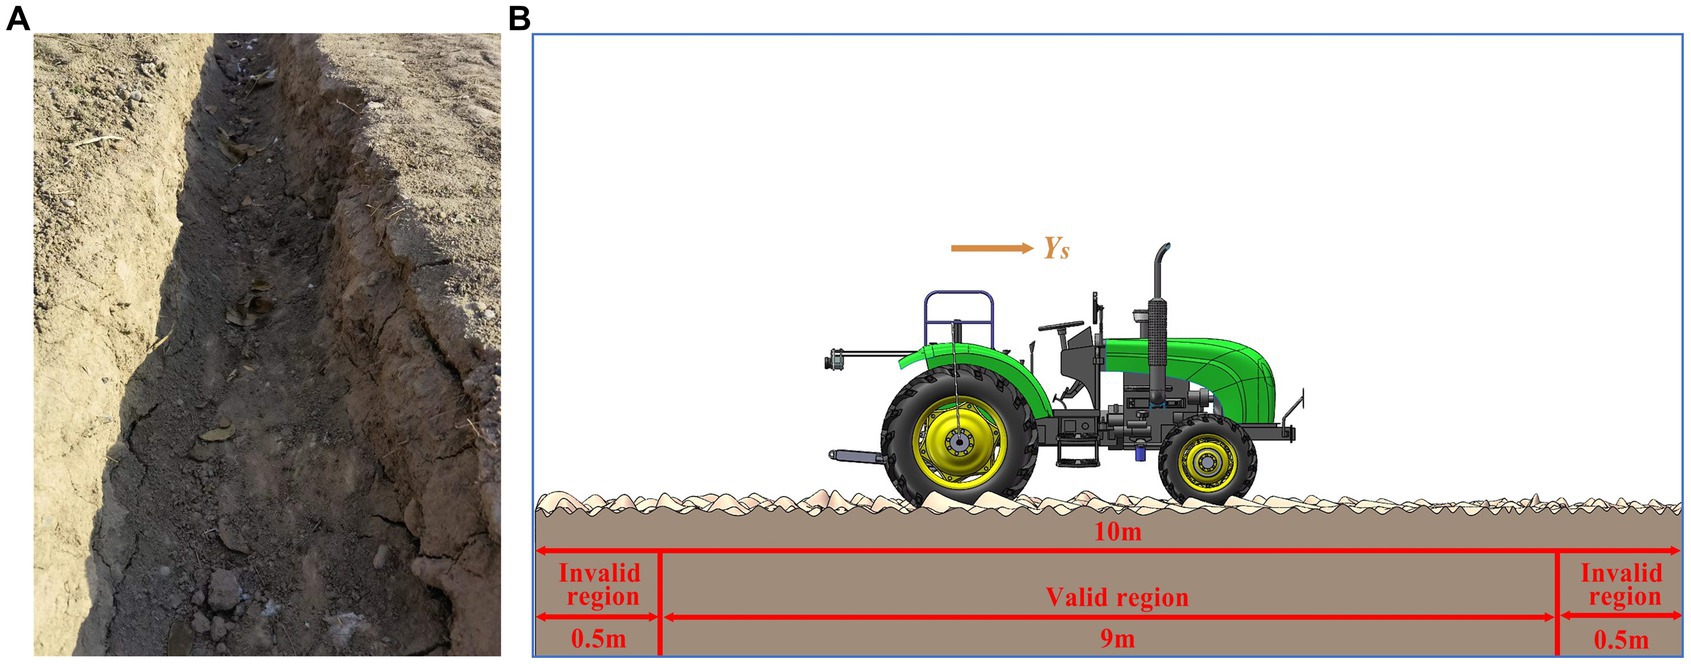
Figure 9. Schematic diagram of the performance test. (A) Image of the partial ditch. (B) Schematic diagram of test area and driving direction.
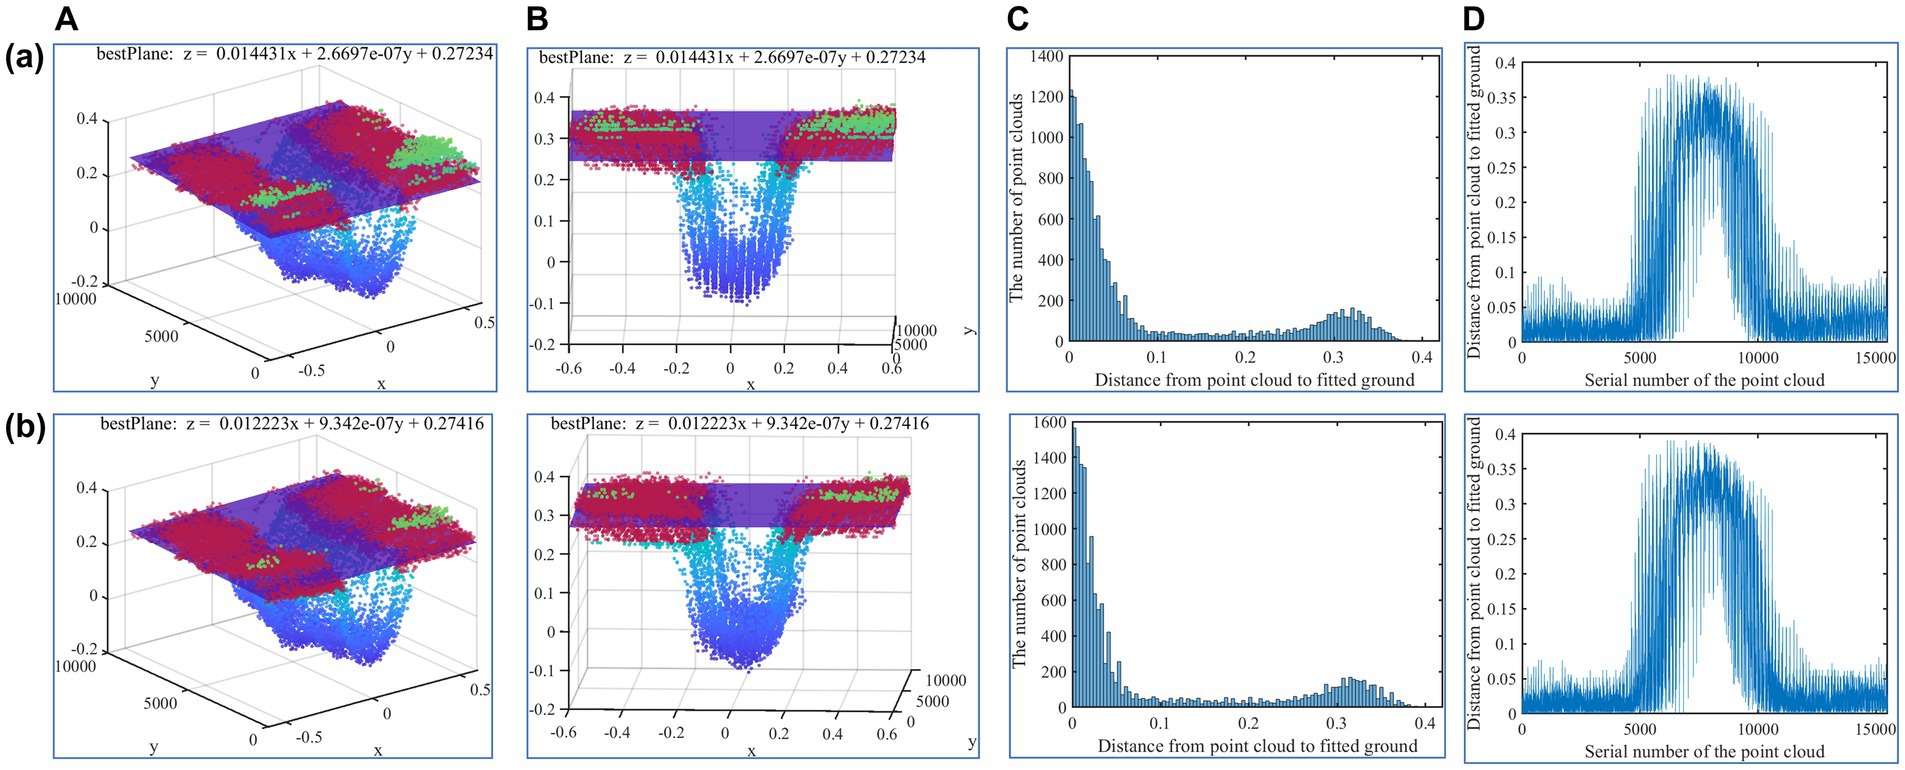
Figure 10. Comparison of ground model extraction results. (A) Extraction results of ditch side ground model. (B) Schematic diagram of the spatial relationship between the ground model and the point cloud of the ditch. (C) Histogram of distance between the ground model and point clouds in the ROI region. (D) Variation trend of distance between point cloud and ground model in ROI region.
4.2. Evaluation index
In this study, the correlation coefficient (R), root mean square error (RMSE), and coefficient of variation of stability (V) were used as the evaluation indices of extraction performance of characteristic parameters and the calculation equations of each evaluation index expressed in Eqs. 15–18 (Wang et al., 2018; Fu et al., 2020; Kim et al., 2023):
where xi is the artificially measured value, is the mean value of manual measurement, yi is the calculated value of groove characteristic parameter, is the calculated mean value of groove characteristic parameters, S is the standard deviation of the calculated value of the groove characteristic parameter, V is the variation coefficient of the stability of the calculated value of the groove characteristic parameter, and n is the number of measuring points.
4.3. Extraction results of ditch side ground model
To verify the performance of the improved trench side ground model extraction method, a comparison was conducted between the results obtained from the original algorithm and the improved algorithm. The preprocessed point cloud was taken as input, and the two algorithms were compared with the same parameter settings, including 1,000 iterations (M), the ground point cloud range threshold (β) of 0.05, and the height variance threshold (γ*) of 0.001. The comparison results of the ground model extraction are presented in Figure 10.
To evaluate the fitting performance of the ground surface model, this paper mainly evaluates based on the following two aspects:
1. Whether the model can determine the ditch side ground point cloud as the inliers
2. Whether the extracted ground model exists with a tilt phenomenon
The results in Row (a) were generated using the original orchard ditch side-ground extraction algorithm, while the images in Row (b) were obtained using the optimized orchard ditch side-ground extraction algorithm. In the first and second column images, the purple plane depicts the ground model of the extracted ditch side. The red point cloud denotes the inner point of the ditch side ground that was extracted by the algorithm, while the remaining colored points represent the outer point of the ground. Furthermore, it is worth noting that some models identify most of the ground surface clouds as internal points, which can lead to a significant impact on the accuracy and reliability of subsequent feature parameters when the model is tilted. To evaluate the tilt degree of the model, the leftmost point cloud in the ROI region was taken as the starting position, and the distance variation trend of dp was described in the order from left to right, as shown in the fourth column in Figure 10.
The optimized algorithm produced a well-fitted model for the ground point cloud, where a majority of the ground point cloud was correctly classified as internal points. In contrast, while the original algorithm demonstrated good performance, it generated more points that were identified as incorrect results (Figure 10A). The optimized algorithm produced a model that was located at the midpoint of the ground point cloud, while the model fitted by the original algorithm was located at the lower middle part of the ground point cloud. Consequently, a portion of the ground point cloud was erroneously classified as outer points, while some of the trench wall point cloud was improperly identified as an internal point, thus increasing the number of point cloud misclassifications (Figure 10B). The dp mainly fell within the range of 0–0.1 and 0.25–0.37. This portion of the point cloud was mainly distributed in the ground and trench bottom, which was consistent with the actual situation. By comparison, it was observed that within the range of 0–0.1 point clouds, the number of point clouds in the range of 0–0.05 was more in the optimized algorithm, while the distribution of point clouds in the range of 0.05–0.1 was higher in the non-optimized algorithm. This phenomenon further indicated that the plane fitted by the optimized algorithm was closer to the actual furrow (Figure 10C).
As depicted in Figure 10D, the abscissa extent of 5,000–10,000 corresponded to the part of the ditch, whereas the remaining extent correspond to the ground on both sides of the ditch. Moreover, the fluctuation of the distance variation trend of the original algorithm was more prominent and the dp of the right side of the ground was larger than that of the left side of the ground, indicating that the ground model fitted by the algorithm was skewed. Instead, the point cloud distance variation trend of the optimized algorithm was relatively smooth, and the distance distribution of the left and right ground points were relatively uniform, which can also be proved by Figure 10B.
4.4. Furrow reconstruction result
The furrow was reconstructed using the point-by-point insertion method, which effectively depicted the contour, width, and depth of the trench while retaining many features of the actual furrow shape. Nonetheless, as shown in Figures 11A,C, the reconstructed results were uneven and had many burrs compared to the real trench. Therefore, it is necessary to conduct further processing on the reconstructed results. After smoothing the reconstructed grooves with the Laplace algorithm, the results retained the main features, while the overall contours became smoother and the burrs disappeared. Additionally, the roughness of the mesh was significantly reduced, resulting in a more realistic reconstruction (Figures 11B,D).
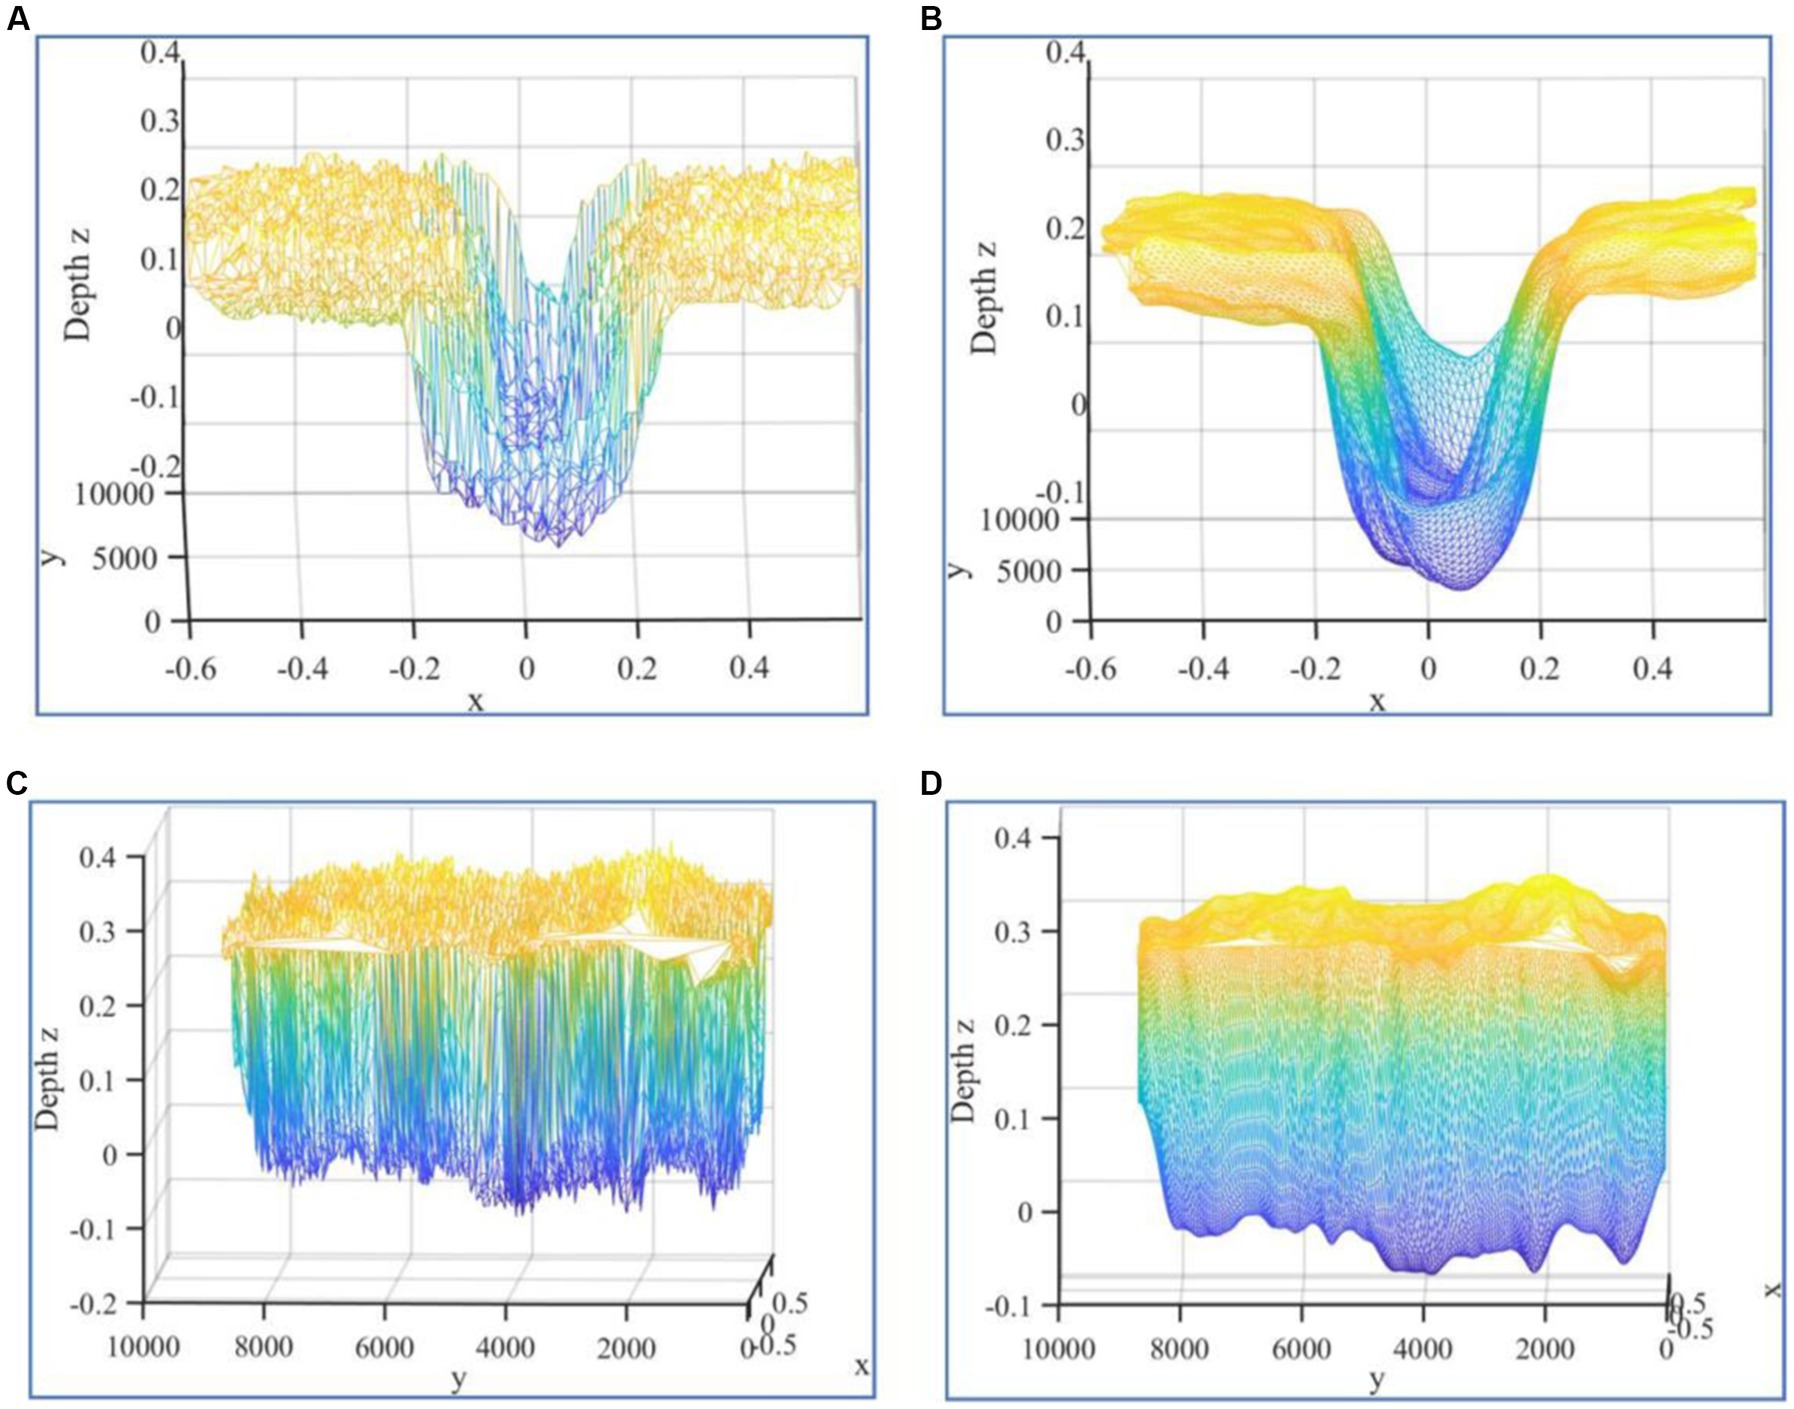
Figure 11. Furrow reconstruction results. (A) Frontal view of the result of furrow reconstruction using point-by-point insertion method. (B) Frontal view of the result of smoothing the groove using Laplace’s algorithm. (C) Side view of the result of furrow reconstruction using point-by-point insertion method. (D) Side view of the result of smoothing the groove using Laplace’s algorithm.
After real-time data acquisition using the multi-source data acquisition and three-dimensional data construction system, the single running time of all steps, including reading the original point cloud, pre-processing the point cloud, extracting the trench side ground model and characteristic parameters, and reconstructing the trench, was approximately 13.1 s. It is important to note that the duration of the program’s information processing may vary depending on the volume of data being processed. Larger datasets may require additional time for processing and analysis.
4.5. Extraction results of furrow characteristic parameters
To analyze the accuracy of the calculations, random sample points were selected, and the calculated values of the furrow characteristic parameters were compared with the measured values. The measured values were obtained using a tape measure with a measuring accuracy of 1 mm. To reduce the error in manual measurement, the depth and width of each sample point were measured three times, and the average value of the three measurements was used as the measured value for that sample point. The measured depth DT and the measured width WT were calculated by the following formula:
where DMi is the depth measurement for the ith time, and WMi is the width measurement for the ith time. The comparison results are shown in Figure 12 and Table 1.
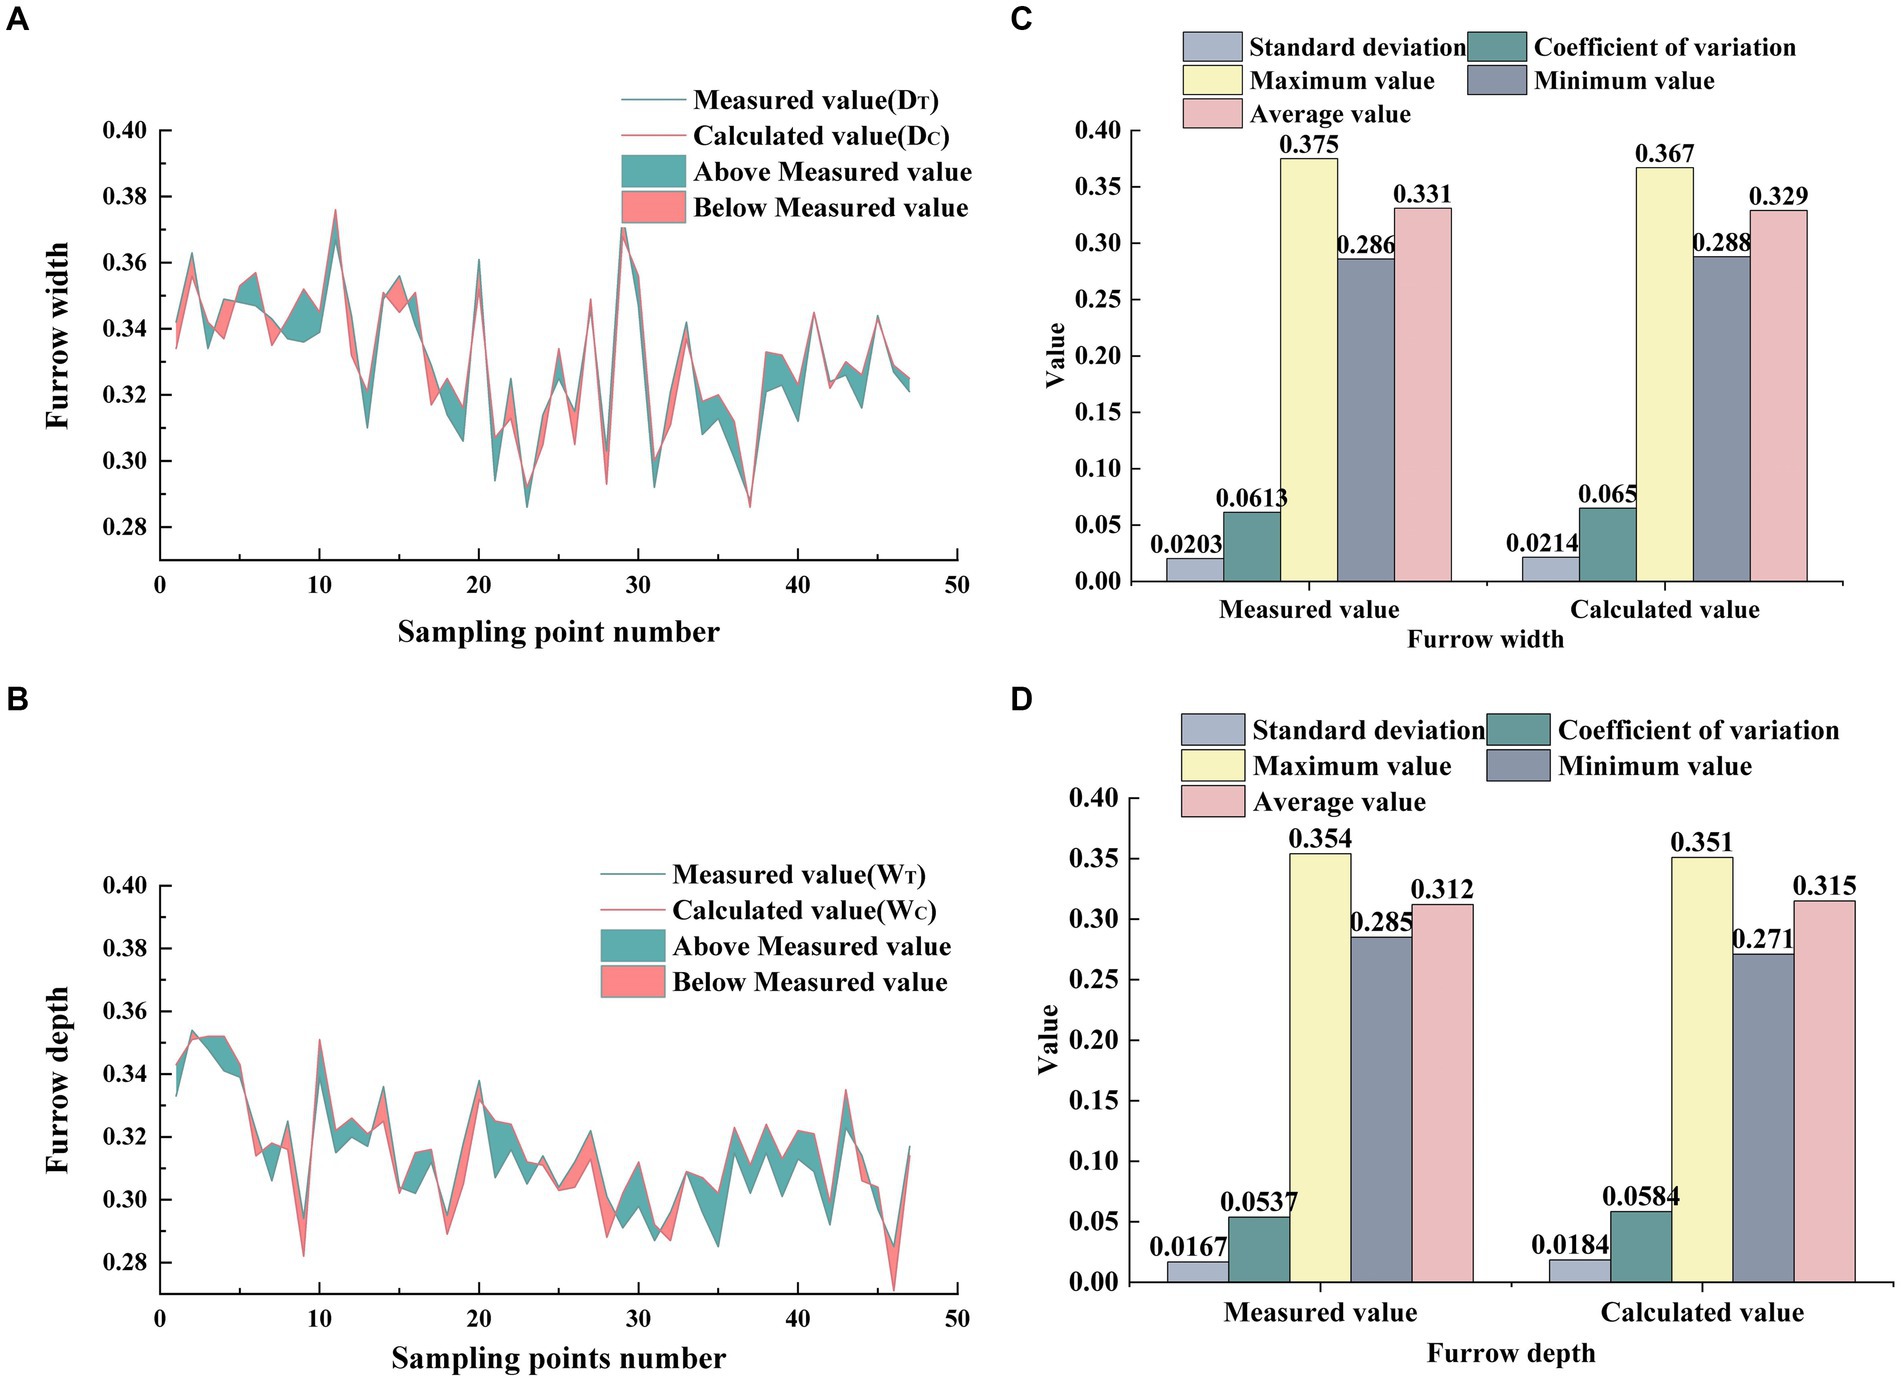
Figure 12. Comparison result between system calculated value and real value. (A) Results of comparison between measured and calculated values of furrow width. (B) Results of comparison between measured and calculated values of furrow depth. (C) Results of comparison of statistical parameters for measured and calculated values of furrow width. (D) Results of comparison of statistical parameters for measured and calculated values of furrow depth.
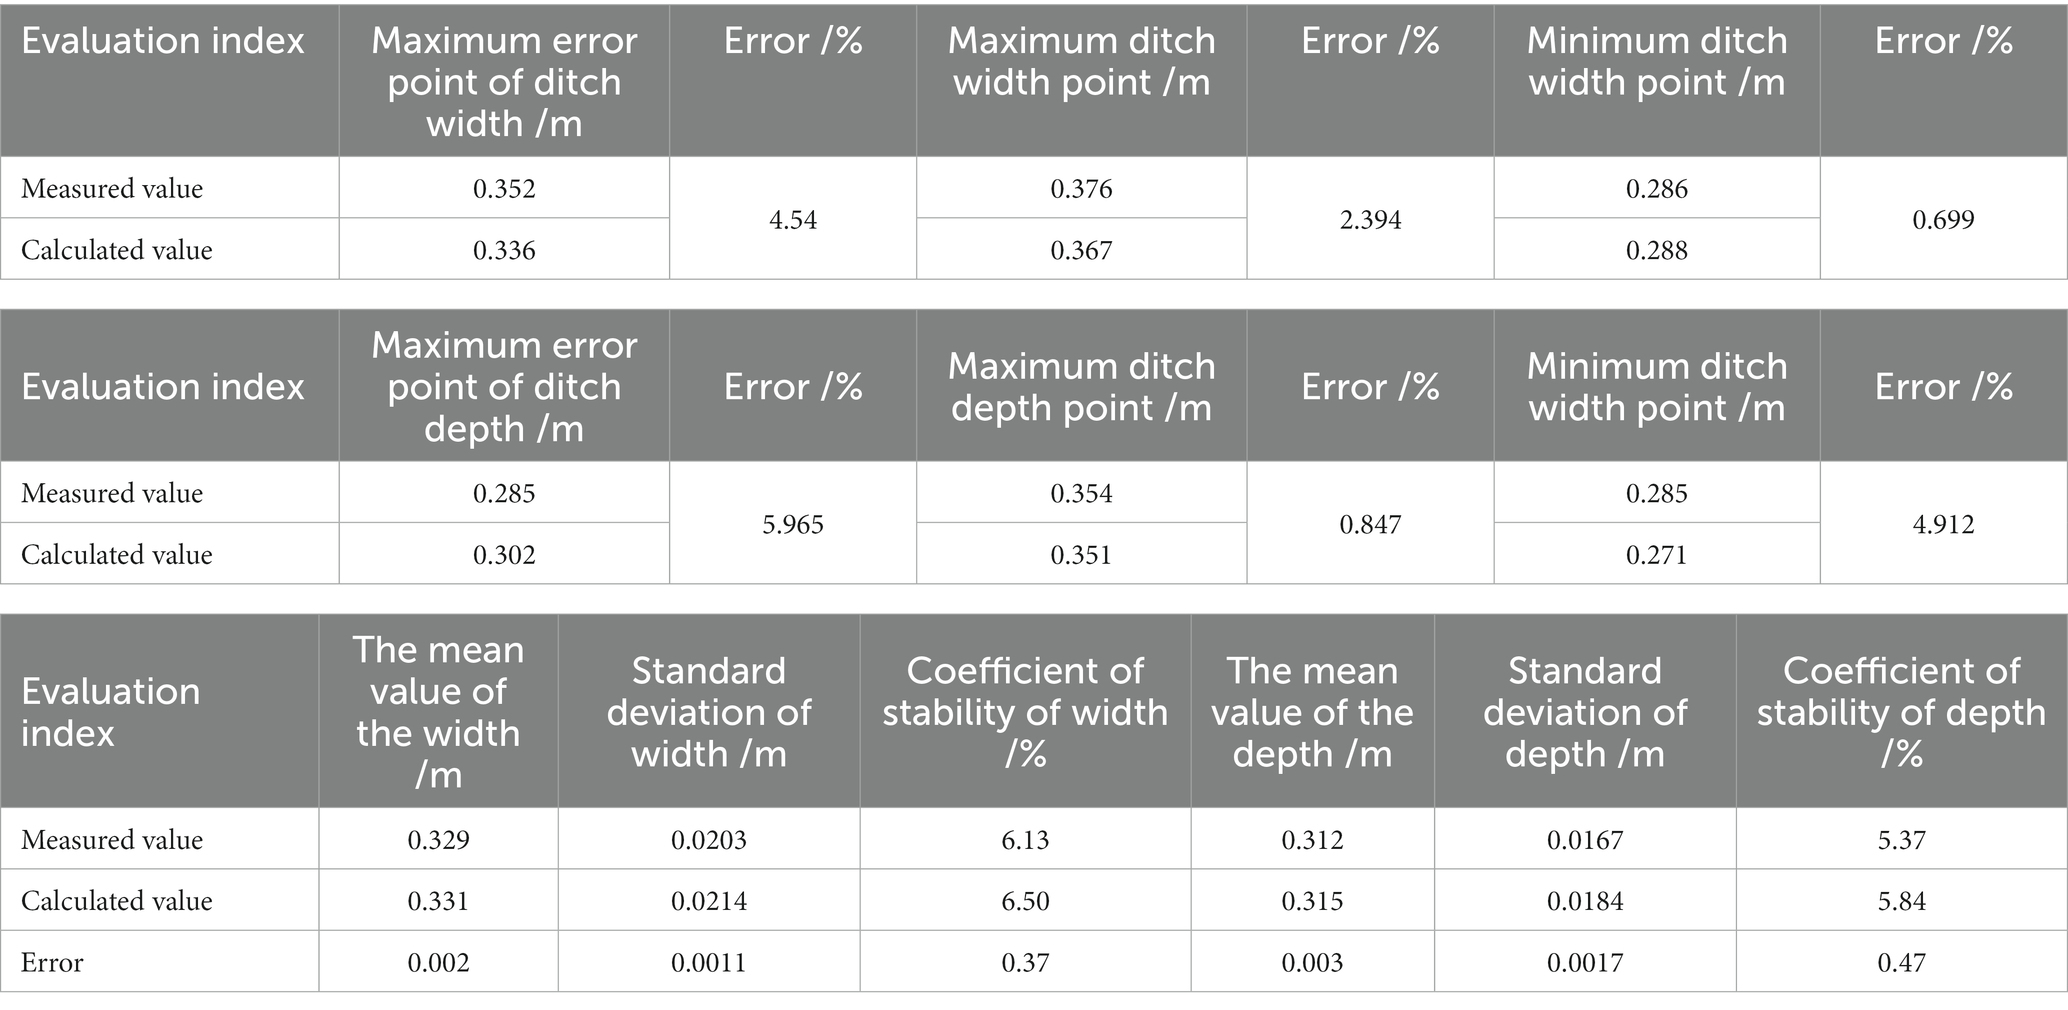
Table 1. Measurement results and evaluation parameter results of characteristic parameters.
In most cases, WC was smaller than WT. However, the difference in the mean value between them was not significant, with an error of only 2 mm. Similarly, most of DC were smaller than DT. And the average values of them were also not significantly different, with an error of 3 mm. However, the overall errors of DC were larger WC, as shown in Figure 12B.
Furthermore, the error range of WC was 0% ~ 5.965%, while the error range of DC was 0% ~ 4.54%. The error of WC at the maximum value of trench width was 2.394%, while the error of WC at the minimum value calculation of trench was 0.699%. The error of DC at the maximum value of furrow depth was 0.847%, and the error of DC at the minimum value was 4.912%.
As shown in Table 1, the mean error, standard deviation error, and stability coefficient error of WC were, respectively, 0.002 m, 0.011 m, and 0.37%, while the mean error, standard deviation error, and stability coefficient error of DC were, respectively, 0.003 m, 0.017 m, and 0.47%. In contrast, DC has a larger mean value error and more violent fluctuations, while WC has better data quality.
To further explore the correlation between measured and calculated values, WC and WT, DC and DT were fitted, respectively, (Figure 13).
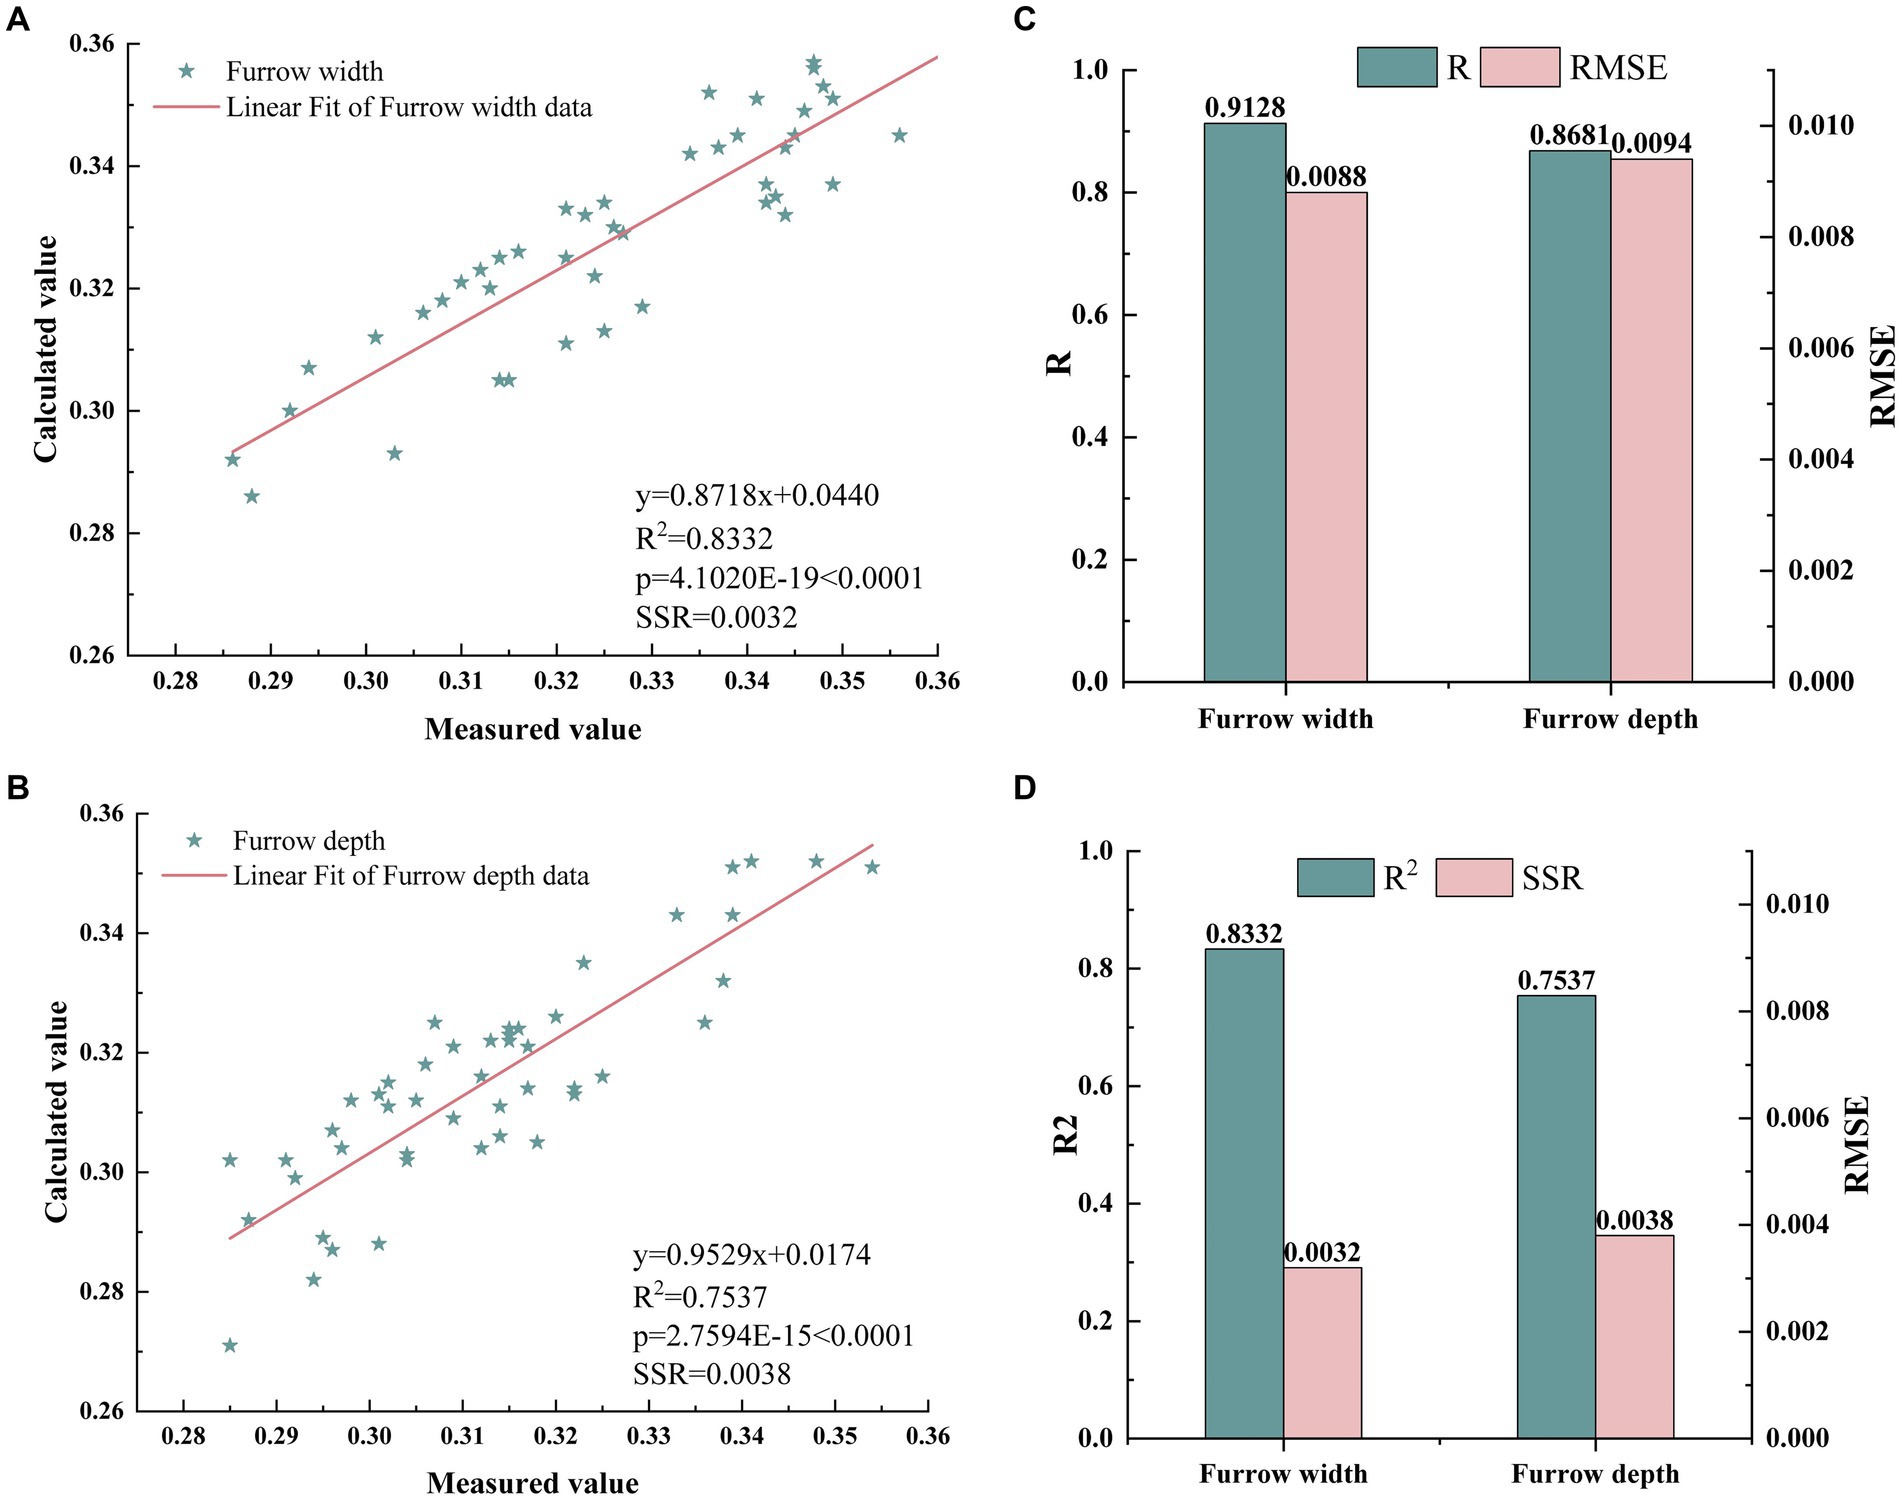
Figure 13. Fitting results of calculated values and true values. (A) The fitting model of measured and calculated values of furrow width. (B) The fitting model of measured and calculated values of furrow depth. (C) R value and RMSE value of furrow depth and furrow width. (D) R2 value and SSR value of furrow depth and furrow width.
The fitting model for WC and WT was y = 0.8718x + 0.0440, the R2 was 0.8332, the p value was significantly less than 0.0001, and the residual sum of squares (SSR) was 0.0032, all of which demonstrate a good fitting effect for the model. In addition, R was 0.9128, and RSME was 0.0088, indicating a strong positive correlation between WC and WT.
The fitting model for DC and DT was y = 0.9529x + 0.017, the R2 was 0.7537, the p value was also significantly less than 0.0001, and the SSR was 0.0038. Furthermore, R was 0.9128, and RSME was 0.0088, proving a strong correlation between DC and DT.
Although there are some errors in the calculation results, the furrow parameter extraction method proposed in this paper has a good effect.
5. Discussion
Although the low-cost three-dimensional reconstruction method of the furrow shape in orchards proposed in this study showed a good performance, it also had some limitations. First, compared with WC, DC had a larger range of data errors and the overall data quality was inferior to the former. Moreover, the correlation between DC and DT was not as strong as that between WC and WT. The reason for this phenomenon was that the soil surface roughness in furrow bottom region B was more serious than that in ground region A and region C, which reduced the quality of furrow bottom point cloud data (Huang et al., 2021), as shown in Figure 14A.
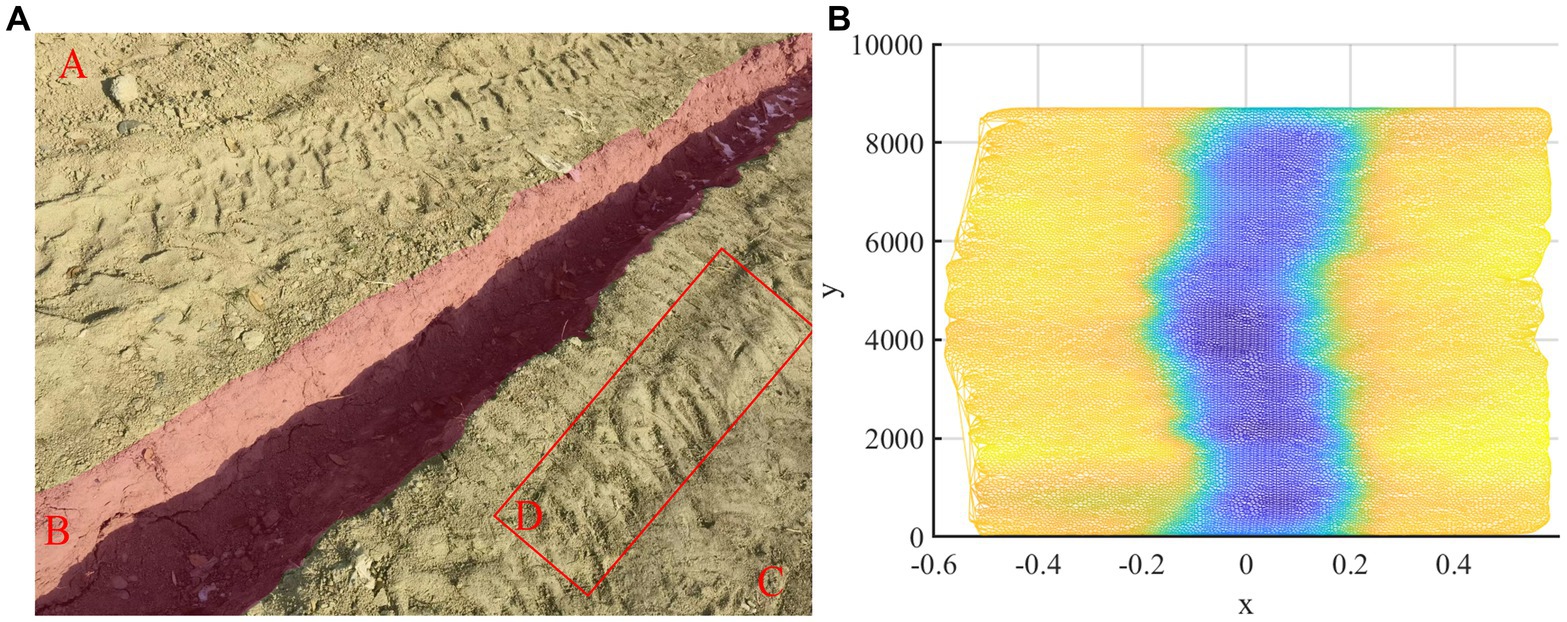
Figure 14. Adverse conditions. (A) Different regions of the ground. (B) The problem of reconstruction result.
Furthermore, the tractor was tilted due to the presence of asymmetric and irregular regions on both sides of the trench, such as region D in Figure 14A, which led to a decline in the quality of the trench reconstruction. Moreover, manual control of the direction during data acquisition failed to ensure a strictly linear progression, thus engendering Y-axis bending of the reconstructed trench, as depicted in Figure 14B.
6. Conclusion
This study developed a data acquisition system that was both multi-source and cost-effective, with the objective of collecting, constructing point clouds, and storing data related to the trench. To alleviate the computational burden of trench reconstruction, a novel methodology was developed to extract the point cloud of the orchard trench and preprocess the discrete points. This approach led to an enhancement in the quality of three-dimensional point clouds. Through a comprehensive analysis of the characteristics of the trench point cloud, a variance threshold-based random point preselection criterion was implemented. Subsequently, the trench-side ground model extraction method based on RANSAC was optimized. This optimization aimed to enhance the accuracy and reliability of the ground model extraction, leading to improved results in representing the ditch side ground. Utilizing the fitted ground model of the trench sides, a novel approach was proposed to extract key feature parameters and reconstructing the trench. Experimental results demonstrated that the calculated width exhibited an error range of 0–5.965%, a mean value error of 0.002 m, a standard deviation error of 0.011 m, and a stability coefficient error of 0.37%. Similarly, the calculated depth of the trench exhibited an error range of 0–4.54%, a mean value error of 0.003 m, a standard deviation error of 0.017 m, and a stability coefficient error of 0.47%.
Overall, this study provides a foundation for the realization of real-time control in mechanized trench fertilization and offers a basis for the optimal combination of mechanical structure and operational parameters. The findings of this study serve as a valuable reference for enhancing the efficiency and benefits of agricultural operations. In future research, there will be a specific focus on developing tilt error correction algorithms and groove alignment control algorithms. These advancements aim to further enhance the accuracy and quality of groove reconstruction.
Data availability statement
The original contributions presented in the study are included in the article/Supplementary material, further inquiries can be directed to the corresponding authors.
Author contributions
XZ: conceptualization, methodology, software, writing—original draft preparation, formal analysis, and writing—review and editing. YW: validation and investigation. HM and ZK: data curation and resources. SH: visualization. YL: project administration and funding acquisition. JZ: supervision. All authors contributed to the article and approved the submitted version.
Funding
This study was supported by the Key research and development project of Xinjiang Autonomous Region, China (Approval No. 2022B02028-2), Shihezi University high-level talents research start-up fund project, China (Approval No. RCZK2018C35), Shihezi University youth innovative talent Cultivation project, China (Approval No. CXPY202118), and Science and technology innovation talent Program, China (Approval No. 2022CB002-03).
Conflict of interest
The authors declare that the research was conducted in the absence of any commercial or financial relationships that could be construed as a potential conflict of interest.
Publisher’s note
All claims expressed in this article are solely those of the authors and do not necessarily represent those of their affiliated organizations, or those of the publisher, the editors and the reviewers. Any product that may be evaluated in this article, or claim that may be made by its manufacturer, is not guaranteed or endorsed by the publisher.
Supplementary material
The Supplementary material for this article can be found online at: https://www.frontiersin.org/articles/10.3389/fsufs.2023.1201994/full#supplementary-material
References
Aikins, K. A., Ucgul, M., Barr, J., Awuah, E., Antille, D., Jensen, T., et al. (2023). Review of discrete element method simulations of soil tillage and furrow opening. Agriculture 13:541. doi: 10.3390/agriculture13030541
Akdemir, B., Saglam, C., Atar, E. S., Türen, N., and Özyürüyen, L. C. (2022). Development of a multi-fertilizer spreader machine and variable rate controller for olive orchards. Erwerbs-Obstbau. doi: 10.1007/s10341-022-00800-9
Ao, Z., Wu, F., Hu, S., Sun, Y., Su, Y., Guo, Q., et al. (2022). Automatic segmentation of stem and leaf components and individual maize plants in field terrestrial LiDAR data using convolutional neural networks. Crop J. 10, 1239–1250. doi: 10.1016/j.cj.2021.10.010
Babu, T., Ravinthiran, A., Krishnan, S., Ananda, P., and Pavitharan, V. (2020). A modern low-cost furrow cutting machine. AIP Conf. Proc. 2283:020001. doi: 10.1063/5.0025075
Campbell, M. J., Eastburn, J. F., Mistick, K. A., Smith, A. M., and Stovall, A. E. L. (2023). Mapping individual tree and plot-level biomass using airborne and mobile lidar in piñon-juniper woodlands. Int. J. Appl. Earth Obs. Geoinf. 118:103232. doi: 10.1016/j.jag.2023.103232
Du, X., Yang, X., Pang, J., Ji, J., Tao, J., and Chen, L. (2019). Design and test of tillage depth monitoring system for suspended rotary tiller. Trans. Chinese Soc. Agric. Machin. 50, 43–51. doi: 10.6041/j.issn.1000-1298.2019.08.005
Eisoldt, M., Gaal, J., Wiemann, T., Flottmann, M., Rothmann, M., Tassemeier, M., et al. (2022). A fully integrated system for hardware-accelerated TSDF SLAM with LiDAR sensors (HATSDF SLAM). Robot. Auton. Syst. 156:104205. doi: 10.1016/j.robot.2022.104205
FAO (2023). Value of Agricultural Production. Available at: https://www.fao.org/faostat/en/#data/QV/visualize [Accessed April 7, 2023].
Fischler, M., and Bolles, R. (1981). Random sample consensus: a paradigm for model fitting with applications to image analysis and automated cartography. Commun. ACM 24, 381–395. doi: 10.1145/358669.358692
Fu, T., Tang, X., Cai, Z., Zuo, Y., Tang, Y., and Zhao, X. (2020). Correlation research of phase angle variation and coating performance by means of Pearson’s correlation coefficient. Prog. Org. Coat. 139:105459. doi: 10.1016/j.porgcoat.2019.105459
García-López, S., Vélez-Nicolás, M., Zarandona-Palacio, P., Curcio, A. C., Ruiz-Ortiz, V., and Barbero, L. (2023). UAV-borne LiDAR revolutionizing groundwater level mapping. Sci. Total Environ. 859:160272. doi: 10.1016/j.scitotenv.2022.160272
Han, S., Li, Y., Zhou, X., Kan, Z., Meng, H., and Qi, J. (2023). DEM simulation and experimental validation of the performance of an orchard deep applicator for manure. Appl. Sci. 13:3709. doi: 10.3390/app13063709
Hassoun, A., Jagtap, S., Trollman, H., Garcia-Garcia, G., Abdullah, N. A., Goksen, G., et al. (2023). Food processing 4.0: Current and future developments spurred by the fourth industrial revolution. Food Control 145:109507. doi: 10.1016/j.foodcont.2022.109507
Hassoun, A., Prieto, M. A., Carpena, M., Bouzembrak, Y., Marvin, H. J. P., Pallarés, N., et al. (2022). Exploring the role of green and Industry 4.0 technologies in achieving sustainable development goals in food sectors. Food Res. Int. 162:112068. doi: 10.1016/j.foodres.2022.112068
Huang, S., Lu, C., Li, H., He, J., Wang, Q., Yuan, P., et al. (2021). Transmission rules of ultrasonic at the contact interface between soil medium in farmland and ultrasonic excitation transducer. Comput. Electron. Agric. 190:106477. doi: 10.1016/j.compag.2021.106477
Jin, Y., Yuan, X., Wang, Z., and Zhai, B. (2021). Filtering Processing of LIDAR Point Cloud Data. IOP Conf. Series: Earth Environ. Sci. 783:012125. doi: 10.1088/1755-1315/783/1/012125
Kim, H., and Choi, Y. (2021). Location estimation of autonomous driving robot and 3D tunnel mapping in underground mines using pattern matched LiDAR sequential images. Int. J. Min. Sci. Technol. 31, 779–788. doi: 10.1016/j.ijmst.2021.07.007
Kim, S., Seo, Y., Malik, A., Kim, S., Heddam, S., Yaseen, Z. M., et al. (2023). Quantification of river total phosphorus using integrative artificial intelligence models. Ecol. Indic. 153:110437. doi: 10.1016/j.ecolind.2023.110437
Kirkegaard Nielsen, S., Munkholm, L. J., Lamandé, M., Nørremark, M., Edwards, G. T. C., and Green, O. (2018). Seed drill depth control system for precision seeding. Comput. Electron. Agric. 144, 174–180. doi: 10.1016/j.compag.2017.12.008
Lee, K., Gu, T., and Bang, Y. B. (2020). Analysis of Accuracy and Measuring Range of Dual Absolute Encoder System. IEEE Sensors J. 20, 2997–3004. doi: 10.1109/JSEN.2019.2955381
Li, B., and Liu, D. (2013). Research and realization of coordinate conversion in radar video display. Ninth Int. Conf. Comp. Intellig. Secur. 2013, 277–279. doi: 10.1109/CIS.2013.65
Liu, S., Xu, C., Zhang, H., Jiang, H., Quan, Z., and Wang, J. (2020). Research status and development analysis of base-fertilizer application equipment of orchard. Trans. Chinese Soc. Agric. Machin. 51, 99–108. doi: 10.6041/j.issn.1000-1298.2020.S2.012
Lou, S., He, J., Li, H., Wang, Q., Lu, C., Wu, Y., et al. (2021a). DESIGN and test evaluation of the subsoiler equipped with tillage depth monitoring and control subsoiling assemblies. Inmateh-Agric. Eng. 2022, 1–15. doi: 10.1155/2022/7344498
Lou, S., He, J., Lu, C., Liu, P., Li, H., and Zhang, Z. (2021b). A tillage depth monitoring and control system for the independent adjustment of each subsoiling shovel. Actuators 10:250. doi: 10.3390/act10100250
Luo, C., Chen, J., Guo, S., An, X., Yin, Y., Wen, C., et al. (2022). Development and application of a remote monitoring system for agricultural machinery operation in conservation tillage. Agriculture 12:1460. doi: 10.3390/agriculture12091460
Oid Technology Co., LTD. (2023a). Relation between encoder value and Angle. Available at: https://oidencoder.com/faq/ [Accessed April 7, 2023].
Oid Technology Co., LTD. (2023b). RS485 multi-turn absolute encoder details. Available at: https://fanyi.youdao.com/index.html#/ [Accessed April 7, 2023].
Perez, R. P. A., Costes, E., Théveny, F., Griffon, S., Caliman, J.-P., and Dauzat, J. (2018). 3D plant model assessed by terrestrial LiDAR and hemispherical photographs: A useful tool for comparing light interception among oil palm progenies. Agric. For. Meteorol. 249, 250–263. doi: 10.1016/j.agrformet.2017.11.008
Qin, J., Sun, R., Zhou, K., Xu, Y., Lin, B., Yang, L., et al. (2023). Lidar-based 3D obstacle detection using focal voxel R-CNN for farmland environment. Agronomy 13:650. doi: 10.3390/agronomy13030650
Rivera, G., Porras, R., Florencia, R., and Sánchez-Solís, J. P. (2023). LiDAR applications in precision agriculture for cultivating crops: A review of recent advances. Comput. Electron. Agric. 207:107737. doi: 10.1016/j.compag.2023.107737
Shang, Y., Wang, H., Qin, W., Wang, Q., Liu, H., Yin, Y., et al. (2023). Design and Test of Obstacle Detection and Harvester Pre-Collision System Based on 2D Lidar. Agronomy 13:388. doi: 10.3390/agronomy13020388
Su, Y., Wang, T., Shao, S., Yao, C., and Wang, Z. (2021). GR-LOAM: LiDAR-based sensor fusion SLAM for ground robots on complex terrain. Robot. Auton. Syst. 140:103759. doi: 10.1016/j.robot.2021.103759
Tsoulias, N., Paraforos, D. S., Fountas, S., and Zude-Sasse, M. (2019). Estimating Canopy Parameters Based on the Stem Position in Apple Trees Using a 2D LiDAR. Agronomy 9:740. doi: 10.3390/agronomy9110740
Wang, S., Li, S., Zhang, Y., Zhang, C., Chen, H., and Meng, L. (2018). Design and optimization of inclined helical ditching component for mountain orchard ditcher. Trans. Chin. Soc. Agric. Eng. 34, 11–22. doi: 10.11975/j.issn.1002-6819.2018.23.002
Wu, F., Duan, J., Chen, S., Ye, Y., Ai, P., and Yang, Z. (2021). Multi-target recognition of bananas and automatic positioning for the inflorescence axis cutting point. Front. Plant Sci. 12:705021. doi: 10.3389/fpls.2021.705021
Zeng, S.-C., Su, Z.-Y., Chen, B.-G., Wu, Q.-T., and Ouyang, Y. (2008). Nitrogen and phosphorus runoff losses from orchard soils in south china as affected by fertilization depths and rates. Pedosphere 18, 45–53. doi: 10.1016/S1002-0160(07)60101-5
Zhan, C., Ding, W., Han, Y., Jiang, Q., Zhao, Y., Zhao, L., et al. (2022). Design and experiments of an automatic depth-adjusting double screw trencher and fertiliserning. PLoS One 17:e0277824. doi: 10.1371/journal.pone.0277824
Zhang, H., Xu, C., Shuangxi, L., Jiang, H., Zhang, C., and Wang, J. (2021). Design and experiment of orchard double row ditching-fertilizer machine with automatic depth adjustment. Trans. Chinese Soc. Agric. Machin. 52, 62–72. doi: 10.6041/j.issn.1000-1298.2021.01.007
Zhao, L., Jiao, S., Wang, C., and Zhang, J. (2022). Research on terrain sensing method and model prediction for height adjustment of sugarcane harvester base cutter. Wirel. Commun. Mob. Comput. 2022, 1–15. doi: 10.1155/2022/7344498
Zhou, X., Kan, Z., Meng, H., and Li, Y. (2023a). Research on trenching data correction method based on wavelet denoising-kalman filtering algorithm. Arab. J. Sci. Eng. 48, 1097–1117. doi: 10.1007/s13369-022-06729-1
Zhou, X., Kan, Z., Meng, H., Qi, J., Wu, Y., Zhao, X., et al. (2022). Design and experiment of orchard ditch depth monitoring system based on lab view. J. Agric. Mechan. Res. 44, 164–170. doi: 10.13427/j.cnki.njyi.2022.04.028
Zhou, X., Kan, Z., Meng, H., Qi, J., Zhao, X., and Li, Y. (2021). Design and experiment of monitoring equipment for orchard ditching depth and width. J. Chin. Agric. Mech. 42, 37–473. doi: 10.13733/j.jcam.issn.2095-5553.2021.12.06
Keywords: furrow characteristic parameter detection, lidar, furrow reconstruction, quality of ditching operation, precision agriculture
Citation: Zhou X, Wu Y, Meng H, Han S, Kan Z, Li Y and Zhang J (2023) Three-dimensional reconstruction of the furrow shape in orchards using a low-cost lidar. Front. Sustain. Food Syst. 7:1201994. doi: 10.3389/fsufs.2023.1201994
Edited by:
Abdo Hassoun, Sustainable AgriFoodtech Innovation & Research (Safir), FranceReviewed by:
Seyed-Hassan Miraei Ashtiani, Ferdowsi University of Mashhad, IranFerdaous Boughattas, UniLaSalle, France
Copyright © 2023 Zhou, Wu, Meng, Han, Kan, Li and Zhang. This is an open-access article distributed under the terms of the Creative Commons Attribution License (CC BY). The use, distribution or reproduction in other forums is permitted, provided the original author(s) and the copyright owner(s) are credited and that the original publication in this journal is cited, in accordance with accepted academic practice. No use, distribution or reproduction is permitted which does not comply with these terms.
*Correspondence: Yaping Li, bGl5YXBpbmc0MjVAMTYzLmNvbQ==; Jie Zhang, eGp3c3pqMDIzMEBzaW5hLmNvbQ==
†These authors have contributed equally to this work