 Sung B. Im1,2
 Sonali Gupta1
 Mani Jain1
 Aroon T. Chande1,3,4
 Heather A. Carleton2
 I. King Jordan1,3,4
 Lavanya Rishishwar1,3,4*
- 1School of Biological Sciences, Georgia Institute of Technology, Atlanta, GA, United States
- 2Enteric Diseases Laboratory Branch, Centers for Disease Control and Prevention, Atlanta, GA, United States
- 3PanAmerican Bioinformatics Institute, Cali, Colombia
- 4Applied Bioinformatics Laboratory, Atlanta, GA, United States
Foodborne pathogens are a major public health burden in the United States, leading to 9.4 million illnesses annually. Since 1996, a national laboratory-based surveillance program, PulseNet, has used molecular subtyping and serotyping methods with the aim to reduce the burden of foodborne illness through early detection of emerging outbreaks. PulseNet affiliated laboratories have used pulsed-field gel electrophoresis (PFGE) and immunoassays to subtype and serotype bacterial isolates. Widespread use of serotyping and PFGE for foodborne illness surveillance over the years has resulted in the accumulation of a wealth of routine surveillance and outbreak epidemiological data. This valuable source of data has been used to understand seasonal frequency, geographic distribution, demographic information, exposure information, disease severity, and source of foodborne isolates. In 2019, PulseNet adopted whole genome sequencing (WGS) at a national scale to replace PFGE with higher-resolution methods such as the core genome multilocus sequence typing. Consequently, PulseNet's recent shift to genome-based subtyping methods has rendered the vast collection of historic surveillance data associated with serogroups and PFGE patterns potentially unusable. The goal of this study was to develop a bioinformatics method to associate the WGS data that are currently used by PulseNet for bacterial pathogen subtyping to previously characterized serogroup and PFGE patterns. Previous efforts to associate WGS to PFGE patterns relied on predicting DNA molecular weight based on restriction site analysis. However, these approaches failed owing to the non-uniform usage of genomic restriction sites by PFGE restriction enzymes. We developed a machine learning approach to classify isolates to their most probable serogroup and PFGE pattern, based on comparisons of genomic k-mer signatures. We applied our WGS classification method to 5,970 Shiga toxin-producing Escherichia coli (STEC) isolates collected as part of PulseNet's routine foodborne surveillance activities between 2003 and 2018. Our machine learning classifier is able to associate STEC WGS to higher-level serogroups with very high accuracy and lower-level PFGE patterns with somewhat lower accuracy. Taken together, these classifications support the ability of public health investigators to associate currently generated WGS data with historical epidemiological knowledge linked to serogroups and PFGE patterns in support of outbreak surveillance for food safety and public health.
Introduction
In the United States, foodborne pathogens are responsible for an estimated 9.4 million illnesses each year, leading to over 55,000 hospitalizations and ~1,300 deaths (Scallan et al., 2011). Shiga toxin-producing Escherichia coli (STEC) alone, is estimated to cause 265,000 infections per year (Scallan et al., 2011) and is known to cause a range of symptoms from mild gastroenteritis and diarrhea to severe symptoms such as bloody diarrhea and hemolytic uremic syndrome (HUS) (Mead and Griffin, 1998).
Rapid identification and characterization of the pathogens causing illness are essential for an effective epidemiological response. Molecular subtyping and serotyping methodologies have been used for this purpose since the early 1980s (Holmberg et al., 1984), aiding in epidemiological investigations of various foodborne pathogens. In 1996, PulseNet was established as the national molecular subtyping network for foodborne disease surveillance, with the aim to reduce the burden of foodborne illness through early detection of potential outbreaks (Swaminathan et al., 2001). The PulseNet network of laboratories consists of local, state and regional public health laboratories across the US that perform routine phenotypic and molecular characterization of clinical isolates. Routine laboratory testing of STEC includes culture and phenotypic analysis for genus and species confirmation (Zadik et al., 1993; Brooks et al., 2005; Church et al., 2007), serotyping to determine O-and H-antigens (Wang et al., 2003; DebRoy et al., 2011), molecular detection of virulence genes via PCR (Paton and Paton, 1998; Belanger et al., 2002; Reischl et al., 2002; Gilmour et al., 2009), and molecular subtyping by pulsed-field gel electrophoresis (PFGE) (Cooper et al., 2006; Ribot et al., 2006). Isolate information, test results, and images of PFGE banding patterns are stored within a central national repository, the PulseNet National Databases (Swaminathan et al., 2001), and are actively used for routine surveillance. Widespread use of serotyping and PFGE for foodborne illness surveillance over many years has resulted in the accumulation of data from nearly 1 million isolates from routine surveillance, associated with distinct serogroups and PFGE patterns, e.g., seasonal frequency, geographic distribution, demographic information, exposure information, disease severity, and common outbreak sources and vehicles (Tolar et al., 2019). This collection of outbreak data has provided investigators with links to more rapidly determine contamination sources of similar outbreaks (Tolar et al., 2019).
Until recently, PFGE has been the gold standard subtyping method for PulseNet and was the primary method used for tracking foodborne pathogens (Ribot et al., 2019). PFGE provides limited resolution but has several advantages such as rapid identification and comparison of isolates (Graves and Swaminathan, 2001). With the technological advances and maturations, newer sequencing-based methodologies have become more practical to implement in a large laboratory network, such as PulseNet. In 2019, the PulseNet program replaced PFGE with whole genome sequencing (WGS) based methods as the new gold standard method for molecular subtyping and routine surveillance (Ribot et al., 2019). WGS data provides a much higher-resolution alternatives to PFGE, such as single nucleotide variant-based (SNV) typing, core-genome multilocus typing (cgMLST), and whole genome multilocus typing (wgMLST) (Maiden et al., 2013). PulseNet now utilizes cgMLST based subtyping for its epidemiological investigations.
While many of the molecular methodologies results can be inferred through sequence comparisons and annotations, it has been particularly challenging to identify the PFGE banding pattern from WGS data. In silico prediction of banding patterns has been shown to be incorrect due to factors not captured within the sequence itself (e.g., DNA methylation and specific electrophoresis conditions used for generating the restriction profile). As such, the transition of PulseNet from PFGE to WGS risks losing a wealth of valuable historical epidemiological investigation data.
In this study, we describe a machine learning-based computational method that infers PFGE banding patterns and serogroup information from the WGS datasets. Being able to associate WGS data with serogroup and PFGE patterns will allow PulseNet, and other public health laboratories, to access the accumulated epidemiological knowledge linked to historical surveillance data and utilize them in future investigations.
Materials and Methods
Isolate Genome Collection
STEC isolate genome data used in this study was collected as part of routine subtyping and surveillance activities of PulseNet and PulseNet affiliated laboratories between 2005 and 2018. Isolates were selected from the PulseNet STEC National Database (Swaminathan et al., 2001) based on the availability of their complete O-antigen serogroup and pulsed-field gel electrophoresis (PFGE) test results, and whole genome sequence data submitted to NCBI's Sequence Read Archive (SRA) (Supplementary Table 1). PFGE patterns represented by <5 isolates were removed from the study. This resulted in a total of 5,970 isolates, belonging to 27 O-antigen serogroups and 377 PFGE patterns (Table 1). The distribution of isolates and PFGE patterns are shown in Figure 1 and Supplementary Figure 1.
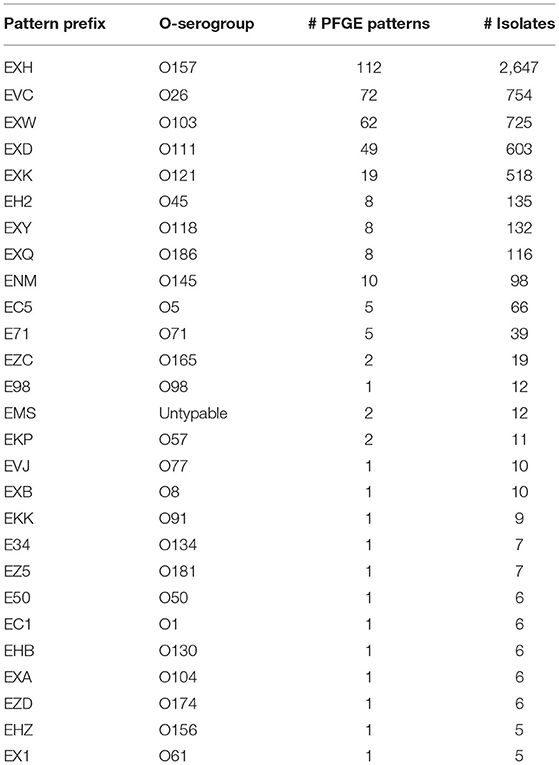
Table 1. Distribution of PFGE patterns and isolates from each O-antigen serogroup analyzed in this study.
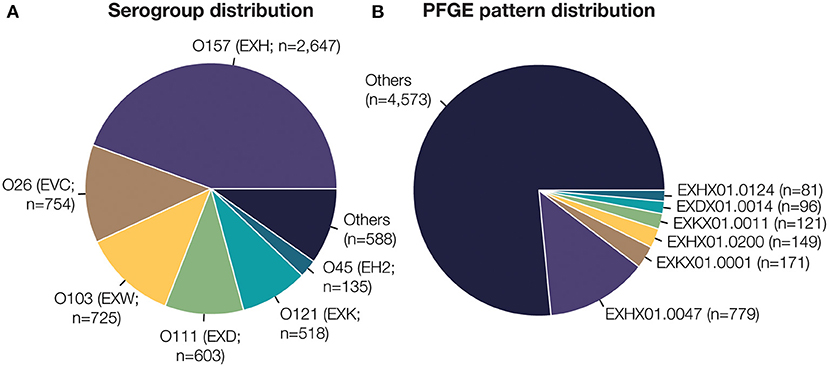
Figure 1. Dataset composition of 5,970 E. coli isolate whole genome sequences. (A) Serotype is designated by the O-antigen serogroup and 3-letter identifier assigned by PulseNet (denoted in parentheses). The six most frequent E. coli O-antigen serogroups are highlighted. (B) PFGE pattern identifiers are prefixed by the 3-letter serotype. The six most frequent unique PFGE patterns are highlighted here. In total, 27 unique E. coli O-serogroups and 377 unique PFGE patterns are present in the dataset used to train and test our classification model.
Molecular Subtyping and Whole Genome Sequencing
Isolates were previously characterized and sequenced by PulseNet and PulseNet affiliated laboratories using a standardized set of procedures (Atikson et al., 2012). Isolates collected prior to 2012 were retroactively sequenced. Serotyping for each isolate was performed by latex agglutination and/or tube/slide agglutination (Atikson et al., 2012). PFGE was performed on the isolates following PulseNet standard protocols and resulting gel images were analyzed and submitted to the PulseNet STEC National Database for foodborne disease outbreak surveillance (Ribot et al., 2006).
Whole genome sequencing was performed using the Illumina MiSeq and HiSeq 2,500 platforms. Qiagen Blood and Tissue kits were used for DNA extractions and library preparation was performed with Nextera XT (MiSeq) and NEB Next (HiSeq 2,500) using 2 x 250 bp chemistry. PulseNet's minimum quality thresholds for acceptance of raw sequence data include 40x average read coverage, Q-score > 30 in each paired read set, and an expected genome size of 5.0 Mbp. Raw sequence data quality was assessed using the LYVE-SET (Katz et al., 2017) software package. Isolates passing the quality thresholds were submitted to NCBI's SRA and were retrieved for this study using the SRA Toolkit (https://github.com/ncbi/sra-tools).
Genomic Data Representation
Each isolate's WGS data was represented as a k-mer presence/absence matrix, with rows representing the isolate (i.e., the instance) and columns representing the k-mers (i.e., the features). Raw sequence reads were k-merized and hashed using the open-source k-mer sketching library as implemented within MASH (Ondov et al., 2016). Specifically, reads were k-merized to 32 bp fragments. Any k-mer with <5 occurrences in either orientation (forward or reverse) were filtered out as noise in the data. The remaining k-mers were hashed using the hashing function as implemented within the MASH library (Ondov et al., 2016). Hashed k-mer outputs were sorted, and the smallest 10,000 hash values (k-mers) were selected for each isolate. These selected k-mers were merged across isolates to form the isolate by k-mer matrix, which was used as the input for our machine learning framework. This resulted in a 5,970 (isolates) x 254,464 (k-mers) large matrix.
Model Training Framework
We approached the PFGE pattern prediction problem as a hierarchical two-level system (Figure 2 and Supplementary Figure 2): serogroup prediction followed by PFGE pattern prediction. Consequently, a single serogroup prediction model and several serogroup-specific PFGE prediction models were created. For each model, the unimportant features were removed using feature selection to (a) reduce the time and complexity for model training, and (b) avoid overfitting of the models.
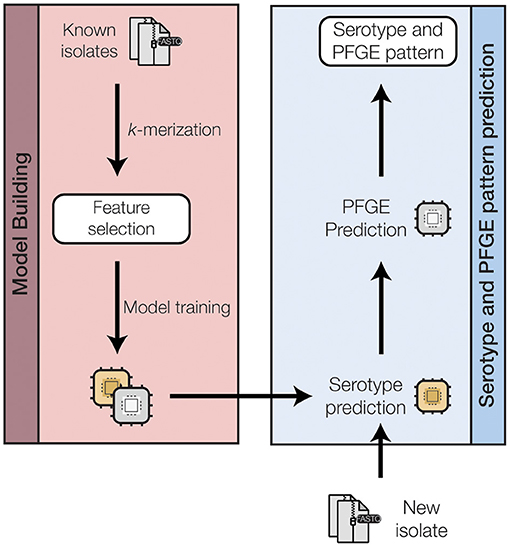
Figure 2. A schematic of the machine-learning approach used to train and test a random forest classifier to predict the O-serogroup and PFGE pattern of STEC genomes directly from raw sequence reads. A more detailed representation for each model training step is shown in Supplementary Figure 2 in the Supplementary Materials.
Feature selection procedure was applied on the isolate by k-mer matrix to identify the minimal set of maximally informative features. This procedure was applied independently for each class, serogroup or PFGE pattern, as the informative features in one class may differ from another. We adopted a stepwise process to systemically evaluate feature sets of different sizes. The procedure starts by creating an initial random forest model using all 254,464 features across all isolates belonging to the specified class (Strobl et al., 2008). Features are then ranked in descending order of their Gini importance (Breiman, 2001). Feature sets with increasing number of features are created iteratively, starting with a set size of the 10 most important features and adding the next 10 most important features in each iteration. For each feature set, 5-fold cross validation (CV) accuracy is calculated as the number of correctly predicted isolates/total number of isolates within the class. Since the input to our model is short read sequence data, it is possible that certain k-mers are not represented within an isolate due to the stochasticity in the sequencing process. We account for these stochastic factors within our machine learning model by searching for feature sets where accuracy is high and relatively stable when compared to neighboring feature sets. More specifically, for each feature set evaluated in this step, we compare the accuracy of our feature set with the neighboring ±15 feature sets (i.e., accuracy achieved by ±150 k-mers). If the accuracy for the given feature set is ranked in the top 5% of its neighbor feature sets' accuracy, the given feature is deemed optimal.
The final models for each class were created by using a random forest classifier as implemented in the scikit-learn Python package (Pedregosa et al., 2011). The random forest classifier was run with default parameters with two exceptions: the number of estimators was set to 500 and a 5-fold CV was used for evaluating the model performance.
Performance Evaluation
To evaluate the performance of our final models, we used a 5-fold CV F1 accuracy. Given the small average number of isolates per class, a CV based accuracy is a better measure of our model's robustness. F1 accuracy is calculated as below:
F1 accuracy accounts for the class imbalance and better captures the model accuracy compared to traditional accuracy measures. The 5-fold CV F1 accuracy was calculated for both serogroup and PFGE pattern models. Overall classification performance of our system was calculated as the ability of the system to correctly predict both serogroup and the PFGE pattern. Random accuracy was calculated by using a bootstrapping technique with 10-replicates. Specifically, isolates were randomly assigned to a PFGE pattern and for each replicate, the number of correct predictions (both serogroup and PFGE pattern) were calculated. The final random accuracy was calculated as the macro-average of all bootstrap results = total correct predictions/total number of isolates.
For each isolate, we also recorded the probability of the top five predictions at the serogroup and PFGE pattern levels. The function predict_proba within the scikit-learn package was used for calculating each class' prediction probability.
The diversity of PFGE patterns in our dataset was quantified using Shannon's entropy (Shannon, 1948):
where, i ranges from 1 to n PFGE patterns and pi is the frequency of the PFGE pattern within any given serogroup.
Data and Model Availability
The isolate sequence read data analyzed here is publicly accessible in NCBI's SRA (Supplementary Table 1). The final models, and the Python script for predicting the serogroup and PFGE pattern from an isolate's sequence read file (FASTQ) is available here: https://github.com/jordanlab/pfgeBLAST.
Comparison With ECTyper and SRST2
Our method's ability to perform serotyping was compared to two other popular software for E. coli serotyping: ECTyper (https://github.com/phac-nml/ecoli_serotyping; accessed on 8/30/2021) and SRST2 (Inouye et al., 2014; Ingle et al., 2016). ECTyper was run using the command: ecytper -i <read1 file>, <read2 file> -o <output>. We used the pre-built database supplied by the ECTyper package. SRST2 was run using the command: srst2 –input_pe <read1 file> <read2 file> –output <output> –gene_db <EcOH> –log. We used the EcOH database, as recommended by the authors of SRST2. Accuracy for each software was calculated as percent of predicted serotypes matching the known serotype of the isolate.
Computational Environment
The experiments described in this study were performed on a compute server provisioned with 24 processing cores, 64 GB of RAM, and running Red Hat Linux operating system.
Results
Serogroup and PFGE Pattern Distribution
We evaluated 5,970 STEC isolates collected in US as part of the routine surveillance efforts of the PulseNet network of public health laboratories since 1996. All STEC isolates were characterized by (1) confirmation of genus and species with phenotypic analysis, (2) O-antigen serotyping by agglutination and (3) subtyping by PFGE. The results from this characterization are captured in the 10-character code of each isolate, which indicates the O-antigen serogroup (first three characters), restriction enzyme (next three characters), and the unique PFGE banding pattern (last four characters). The isolates analyzed in this study are representative of the proportion of O-antigen serogroups reported in the U.S.; the top 6 most frequent O-antigen serogroups (in order) in this study are O157, O26, O103, O111, O121, O45 (Figure 1A). As expected, the top six most frequent PFGE patterns belong to serogroups O157 (EXH), O121 (EXK) and O111 (EXD). All included PFGE patterns had a minimum of five isolates (Supplementary Figure 1). Isolate selection was limited by the availability of paired sequence data and PFGE pattern information since PulseNet began using WGS on select isolates in 2013 before it transitioned to WGS for all STEC in 2019. Only a select number of historical isolates have been retroactively sequenced for study. All isolate sequence data is publicly available; however, each isolate's test results were acquired from the PulseNet STEC National Database.
Machine Learning Framework for Isolate Characterization
To model the PFGE patterns within a machine learning framework, we represented each isolate in an n-dimensional k-mer space (Figure 2). Specifically, each isolate's WGS reads were fragmented to 32 bp k-mers and the resulting k-mers were subsampled to 10,000 non-singleton k-mers per isolate. The k-mers from all the isolates were compiled into a single k-mer presence/absence matrix of size 5,970 (isolates) x 254,464 (k-mers). This large matrix was used as the input for the machine learning framework.
We approached the PFGE pattern prediction problem as a hierarchical two-level prediction system (Supplementary Figure 2): O-antigen serogroup and PFGE pattern-level predictors. A random forest classification algorithm was utilized for feature selection as well as for building the final machine learning models. Even though the large feature space for the input data (254,464 k-mers) is a reduced representation of the full k-mer space, it is still too large for the classification algorithms, leading to increased time and complexity for model building as well as the potential to over fit the data, producing less generalizable models. Hence, we employed a feature selection procedure for computing the minimal set of maximally informative features (see Materials and Methods). The feature selection procedure was independently applied for each class (i.e., serogroup and all PFGE patterns). Briefly, we iteratively calculated the accuracy of increasingly larger feature sets and identified the optimal feature set size where the accuracy was high and relatively stable when compared to the neighboring feature sets (Figure 3). We found that classification accuracy increases steeply until a feature set size of ~400 k-mers is reached, after which the accuracy starts decreasing or flattening out irrespective of how many k-mers are added to the model. Overall, this procedure resulted in a set of smaller class-specific matrices, with feature count ranging from 10 to 7,700 features (Supplementary Table 2). The top-level serogroup model had the greatest number of features (n = 7,700). The average number of features across all classes (serogroup and PFGE pattern) was 302 (0.12% of the initial data).
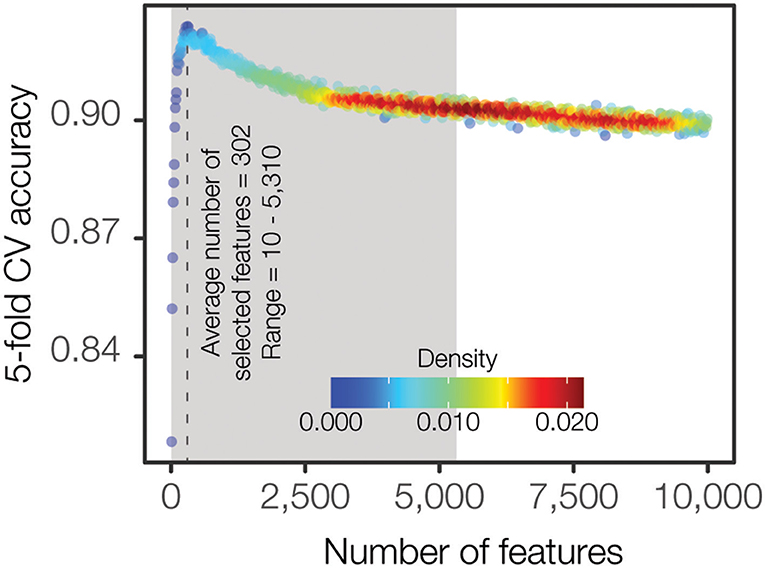
Figure 3. Density plot representing the F1 accuracy achieved by varying number of features. F1 accuracy from 5-fold cross validation is iteratively computed starting with 100 of the most important features determined by Gini importance and incremented by 10 features at each iteration. Each point represents the average F1 accuracy across each of the 27 serogroup classes. Kernel density estimation is calculated to highlight the abundance of similar, uninformative features where F1 accuracy provides diminishing returns.
The smaller class-specific matrices were used to build a total of 28 models (one serogroup-level and 27 PFGE pattern-level), using a random forest classification algorithm.
Model Performance
Our hierarchical two-level prediction system has an overall classification accuracy of 78.1% (4,663 out of 5,970). The WGS-to-serogroup classification is highly accurate; the serogroups of 98.5% of STEC genomes were accurately classified (5,881 out 5,970). WGS-to-PFGE pattern classification was less accurate; 78.9% of PFGE patterns were accurately classified (4,710 out of 5,970). The accuracy of PFGE pattern classification is highly dependent on the diversity of PFGE patterns found for any given serogroup. PFGE patterns from diverse serogroups, containing a high number of unique patterns, showed far lower classification accuracy than PFGE patterns from less diverse serogroups (Figure 4 and Supplementary Figure 3). Nevertheless, given the presence of 377 unique PFGE patterns in our dataset, and considering the number of genomes corresponding to each pattern, 78.1% accuracy is ~34-times higher than could be expected (2.3%) compared to purely random classification.
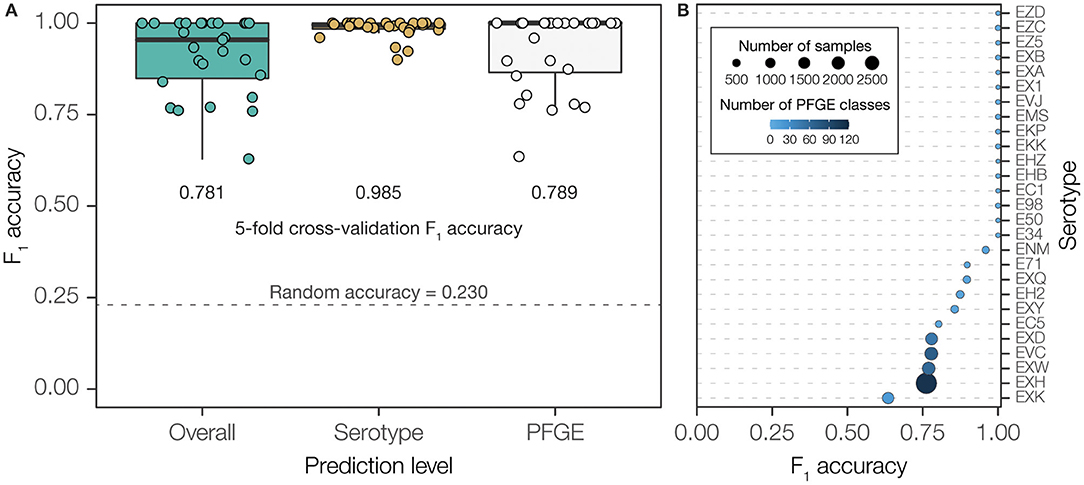
Figure 4. Overall performance of PFGE classifier using final, two-step prediction model measured by F1 accuracy. (A) PFGE pattern prediction performance measured by F1 accuracy across serotypes. Bubble size scales with number of isolates within a serotype while color shade darkens with number of unique PFGE classes within a serotype. (B) Classification performance measured in F1 accuracy when using each model independently and combined. F1 accuracy of a classifier using random guessing was calculated to demonstrate a baseline expected performance without training.
The performance of the PFGE pattern model can further be improved from 78% to 94% by reporting the five most-probable PFGE patterns predicted for any isolate (Figure 5 and Supplementary Figure 4). Since the serogroups with the relatively lower accuracy are also the most diverse (on average 63 PFGE patterns per serogroup) and abundant (~88% of total isolates in the study), being able to know the five most likely PFGE patterns is epidemiologically meaningful.
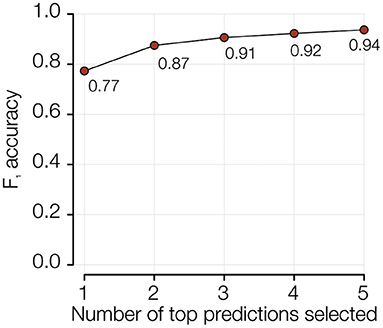
Figure 5. Probability of predicting the correct PFGE pattern within top 5 predictions.
The full prediction runs on average in ~10.27 seconds per isolate genome with the k-mer representation taking ~8.1 seconds and random forest classification taking ~2.16 seconds.
Serotyping Performance Comparison With Other Methods
We compared the performance of our method's serotyping ability with other popularly used software: ECTyper (https://github.com/phac-nml/ecoli_serotyping) and SRST2 (Inouye et al., 2014; Ingle et al., 2016). For our dataset, ECTyper had an accuracy of 72.7% and an average speed of 76.07 seconds per isolate, while SRST2 yielded a higher accuracy of 90.9% but with a slower average speed of 114.46 seconds per isolate (Supplementary Figure 5).
Discussions
Importance of and Challenges in Predicting Serogroup and PFGE Patterns From WGS
Potential foodborne STEC outbreaks are initially discovered by matching genetically related isolates collected as part of the routine surveillance activities (Hedberg and Besser, 2006). Historically, similarity between STEC isolates was determined by using serotype and PFGE banding pattern information. Serotyping entailed determination of the O-group by the O-antigen on the cell surface and, if available, the H-type from the flagellar H-antigen. PFGE yields distinct DNA restriction patterns and has the discriminatory power to differentiate highly similar isolates. Further, PulseNet's highly optimized PFGE protocols ensured maximum discriminatory power, reproducibility, and comparability between isolates processed at distinct laboratories (Ribot et al., 2006). In the PulseNet National Database, PFGE banding patterns were procedurally assigned PFGE pattern identifiers by visual comparison of PFGE images. PFGE banding patterns matching an existing pattern were assigned the same identifier, distinct PFGE banding patterns were assigned unique identifiers.
Since PulseNet's transition to WGS in 2019, PulseNet's primary subtyping method, PFGE, was succeeded by two gene-by-gene typing approaches: cgMLST and wgMLST. The cgMLST focusses on a subset of genes commonly found in >95% of the genomes; wgMLST encompasses all genes observed within the sequenced isolates (Maiden et al., 2013). cgMLST is shown to offer sufficient discriminatory resolution for identifying closely related genomes for outbreak surveillance while requiring a smaller computational footprint than wgMLST. The use of WGS-based analyses replaces several conventional laboratory tests, improves detection accuracy, and reduces resource cost by consolidating multiple conventional workflows into a single rapid assay.
Although WGS datasets have been immensely useful in advancing outbreak investigation science, being able to infer historically used PFGE banding pattern information has been immensely challenging. A wealth of isolate associated information such as previously identified sources, vehicles or seasonal trends, has been harder to utilize, risking loss of valuable collection of data. While it is theoretically possible to predict DNA fragment lengths and molecular weights from the restriction enzyme (Bikandi et al., 2004) utilized by PulseNet, it has been difficult to do so for a number of reasons: (1) limitation of PFGE in resolving DNA fragments of the same size where non-homologous DNA fragments appear as a single band (Davis et al., 2003), (2) unpredictability of DNA methylation sites where restriction is prevented (Davis et al., 2003), (3) specific run conditions established from PulseNet's PFGE protocol, and (4) subjectivity introduced by visual comparison of gel images. These limitations make simplistic approaches for in silico digestion of genomes incomparable to experimentally generated PFGE banding patterns.
Leveraging WGS for Creating High-Dimensional Models
More complex methodologies, such as machine learning algorithms, are able to capture obscure patterns from large collection of data, if such patterns exist. The availability of a large paired WGS-PFGE dataset allows us to implement such methodologies, enabling us to approach the problem in an agnostic and data-driven manner.
Gene-by-gene typing methodologies provide substantial resolution for epidemiological investigation purposes, but are poorly correlated with PFGE banding patterns (Supplementary Figure 6). This can be attributed to the reduction of the genomic problem (sequence-based information) to a genetic problem (allele numbers) within the multilocus sequence typing family of approaches. In other words, absence of sequence information in the cgMLST calls likely prohibits our machine learning approach from discovering informative patterns. On the other hand, representing the whole genome or the collection of genes within a machine learning amenable manner for thousands of isolates is computationally prohibitive and not practical. Hence, we proceeded to investigate the association of shorter sequences (k-mers) with PFGE banding patterns. k-mers have been shown to be sufficiently informative short sequences used across a number of different applications including genome assembly (Compeau et al., 2011), read-to-genome mapping (Li and Durbin, 2009), taxonomic classification (Nayfach et al., 2016; Wood et al., 2019), and multi-locus sequence typing (Gupta et al., 2017; Espitia-Navarro et al., 2020). Consequently, we represent our genomes as high-dimensional k-mer presence/absence vectors and utilize these vectors within a machine learning framework.
Despite the high-dimensional nature of our approach, it is fast, scalable, and adds minimum overhead to the existing data analysis processes at PulseNet. Further, our machine learning classifier is able to associate STEC WGS to O-antigen serogroups and PFGE patterns with high accuracy. Taken together, these classifications support the ability of public health investigators to associate currently generated WGS data with historical epidemiological knowledge linked to STEC O-antigen serogroups and PFGE patterns in support of outbreak surveillance for food safety and public health.
Generalizable Approach for Building Models for Organisms
PulseNet currently tracks seven bacterial organisms, including STEC, each with a collection of historic PFGE pattern information. Although, the results presented in this study focus on STEC, we hope it serves as a proof-of-principle that such methods can also work well for other organisms of interest. This is especially timely, considering that other genome-based methodologies, such as cgMLST, are still in early development phases.
Limitations
Our current study has some outstanding challenges and limitations. As with most database-based methodologies, the accuracy and coverage of our method is dependent on the number of genomes used to build the initial model. Infrequently observed or sequenced PFGE patterns do not have enough genome representation in our model and will be incorrectly predicted. Similarly, any new PFGE pattern will be predicted incorrectly.
The accuracy of our method is also tied to the noise in the input data. PFGE banding patterns identifiers are susceptible to a high-level of subjectivity as they were primarily assigned by visually comparing band fragments. This subjectivity introduces noise when building random forest models. We expect that by sequencing additional genomic data and some manual re-curation of the data will help us improve the current accuracy of our methodology.
Data Availability Statement
The isolate sequence read data analyzed here is publicly accessible in NCBI's SRA (Supplementary Table 1). The final models, and the Python script for predicting the serogroup and PFGE pattern from an isolate's sequence read file (FASTQ) is available at: https://github.com/jordanlab/pfgeBLAST.
Author Contributions
SI, HC, IJ, and LR defined the problem and designed the study. SBI and HAC collected the data. SI, SG, MJ, and AC performed the experimentation. SI, SG, and LR created the figures and tables. SI, HC, IJ, and LR wrote the manuscript. All authors contributed to the article and approved the submitted version.
Funding
This work was made possible through support from the Advanced Molecular Detection (AMD) initiative at the Centers for Disease Control and Prevention. SG, MJ, AC, IJ, and LR were supported by IHRC-Georgia Tech Applied Bioinformatics Laboratory.
Conflict of Interest
The authors declare that the research was conducted in the absence of any commercial or financial relationships that could be construed as a potential conflict of interest.
Publisher's Note
All claims expressed in this article are solely those of the authors and do not necessarily represent those of their affiliated organizations, or those of the publisher, the editors and the reviewers. Any product that may be evaluated in this article, or claim that may be made by its manufacturer, is not guaranteed or endorsed by the publisher.
Acknowledgments
The authors wish to thank the PulseNet program and its participating laboratories for providing the genomic and PFGE datasets.
Supplementary Material
The Supplementary Material for this article can be found online at: https://www.frontiersin.org/articles/10.3389/fsufs.2021.752873/full#supplementary-material
References
Atikson, R., Besser, J., Bopp, C., Carlson, C., Crandall, C., George, K., et al. (2012). “Guidance for public health laboratories on the isolation and characterization of Shiga toxin-producing Escherichia coli (STEC) from clinical specimens,” in Guidance for Public Health Laboratories on the Isolation and Characterization of Shigatoxin-Producing Escherichia coli (STEC) from Clinical Specimens, Silver Spring, MD: Association of Public Health Laboratories.
Belanger, S. D., Boissinot, M., Menard, C., Picard, F. J., and Bergeron, M. G. (2002). Rapid detection of Shiga toxin-producing bacteria in feces by multiplex PCR with molecular beacons on the smart cycler. J. Clin. Microbiol. 40, 1436–1440. doi: 10.1128/JCM.40.4.1436-1440.2002
Bikandi, J., San Millan, R., Rementeria, A., and Garaizar, J. (2004). In silico analysis of complete bacterial genomes: PCR, AFLP-PCR and endonuclease restriction. Bioinformatics 20, 798–799. doi: 10.1093/bioinformatics/btg491
Brooks, J. T., Sowers, E. G., Wells, J. G., Greene, K. D., Griffin, P. M., Hoekstra, R. M., et al. (2005). Non-O157 Shiga toxin-producing Escherichia coli infections in the United States, 1983-2002. J. Infect. Dis. 192, 1422–1429. doi: 10.1086/466536
Church, D. L., Emshey, D., Semeniuk, H., Lloyd, T., and Pitout, J. D. (2007). Evaluation of BBL CHROMagar O157 vs. sorbitol-MacConkey medium for routine detection of Escherichia coli O157 in a centralized regional clinical microbiology laboratory. J. Clin. Microbiol. 45, 3098–3100. doi: 10.1128/JCM.00426-07
Compeau, P. E., Pevzner, P. A., and Tesler, G. (2011). How to apply de Bruijn graphs to genome assembly. Nat. Biotechnol. 29, 987–991. doi: 10.1038/nbt.2023
Cooper, K. L., Luey, C. K., Bird, M., Terajima, J., Nair, G. B., Kam, K. M., et al. (2006). Development and validation of a PulseNet standardized pulsed-field gel electrophoresis protocol for subtyping of vibrio cholerae. Foodborne Pathog. Dis. 3, 51–58. doi: 10.1089/fpd.2006.3.51
Davis, M. A., Hancock, D. D., Besser, T. E., and Call, D. R. (2003). Evaluation of pulsed-field gel electrophoresis as a tool for determining the degree of genetic relatedness between strains of Escherichia coli O157:H7. J. Clin. Microbiol. 41, 1843–1849. doi: 10.1128/JCM.41.5.1843-1849.2003
DebRoy, C., Roberts, E., and Fratamico, P. M. (2011). Detection of O antigens in Escherichia coli. Anim. Health Res. Rev. 12, 169–185. doi: 10.1017/S1466252311000193
Espitia-Navarro, H. F., Chande, A. T., Nagar, S. D., Smith, H., Jordan, I. K., and Rishishwar, L. (2020). STing: accurate and ultrafast genomic profiling with exact sequence matches. Nucleic Acids Res. 48, 7681–7689. doi: 10.1093/nar/gkaa566
Gilmour, M. W., Chui, L., Chiu, T., Tracz, D. M., Hagedorn, K., Tschetter, L., et al. (2009). Isolation and detection of Shiga toxin-producing Escherichia coli in clinical stool samples using conventional and molecular methods. J. Med. Microbiol. 58, 905–911. doi: 10.1099/jmm.0.007732-0
Graves, L. M., and Swaminathan, B. (2001). PulseNet standardized protocol for subtyping Listeria monocytogenes by macrorestriction and pulsed-field gel electrophoresis. Int. J. Food Microbiol. 65, 55–62. doi: 10.1016/S0168-1605(00)00501-8
Gupta, A., Jordan, I. K., and Rishishwar, L. (2017). stringMLST: a fast k-mer based tool for multilocus sequence typing. Bioinformatics 33, 119–121. doi: 10.1093/bioinformatics/btw586
Hedberg, C. W., and Besser, J. M. (2006). Commentary: cluster evaluation, PulseNet, and public health practice. Foodborne Pathog. Dis. 3, 32–35. doi: 10.1089/fpd.2006.3.32
Holmberg, S. D., Wachsmuth, I. K., Hickman-Brenner, F. W., and Cohen, M. L. (1984). Comparison of plasmid profile analysis, phage typing, and antimicrobial susceptibility testing in characterizing Salmonella typhimurium isolates from outbreaks. J. Clin. Microbiol. 19, 100–104. doi: 10.1128/jcm.19.2.100-104.1984
Ingle, D. J., Valcanis, M., Kuzevski, A., Tauschek, M., Inouye, M., Stinear, T., et al. (2016). In silico serotyping of E. coli from short read data identifies limited novel O-loci but extensive diversity of O:H serotype combinations within and between pathogenic lineages. Microb. Genom. 2:e000064. doi: 10.1099/mgen.0.000064
Inouye, M., Dashnow, H., Raven, L. A., Schultz, M. B., Pope, B. J., Tomita, T., et al. (2014). SRST2: rapid genomic surveillance for public health and hospital microbiology labs. Genome Med. 6:90. doi: 10.1186/s13073-014-0090-6
Katz, L. S., Griswold, T., Williams-Newkirk, A. J., Wagner, D., Petkau, A., Sieffert, C., et al. (2017). A comparative analysis of the Lyve-SET phylogenomics pipeline for genomic epidemiology of foodborne pathogens. Front. Microbiol. 8:375. doi: 10.3389/fmicb.2017.00375
Li, H., and Durbin, R. (2009). Fast and accurate short read alignment with burrows-wheeler transform. Bioinformatics 25, 1754–1760. doi: 10.1093/bioinformatics/btp324
Maiden, M. C., Jansen Van Rensburg, M. J., Bray, J. E., Earle, S. G., Ford, S. A., Jolley, K. A., et al. (2013). MLST revisited: the gene-by-gene approach to bacterial genomics. Nat. Rev. Microbiol. 11, 728–736. doi: 10.1038/nrmicro3093
Mead, P. S., and Griffin, P. M. (1998). Escherichia coli O157:H7. Lancet 352, 1207–1212. doi: 10.1016/S0140-6736(98)01267-7
Nayfach, S., Rodriguez-Mueller, B., Garud, N., and Pollard, K. S. (2016). An integrated metagenomics pipeline for strain profiling reveals novel patterns of bacterial transmission and biogeography. Genome Res. 26, 1612–1625. doi: 10.1101/gr.201863.115
Ondov, B. D., Treangen, T. J., Melsted, P., Mallonee, A. B., Bergman, N. H., Koren, S., et al. (2016). Mash: fast genome and metagenome distance estimation using MinHash. Genome Biol. 17:132. doi: 10.1186/s13059-016-0997-x
Paton, A. W., and Paton, J. C. (1998). Detection and characterization of Shiga toxigenic Escherichia coli by using multiplex PCR assays for stx1, stx2, eaeA, enterohemorrhagic E. coli hlyA, rfbO111, and rfbO157. J. Clin. Microbiol. 36, 598–602. doi: 10.1128/JCM.36.2.598-602.1998
Pedregosa, F., Varoquaux, G., Gramfort, A., Michel, V., Thirion, B., Grisel, O., et al. (2011). Scikit-learn: machine learning in python. J. Mach. Learn. Res. 12, 2825–2830. Available online at: https://scikit-learn.org/stable/about.html#citing-scikit-learn
Reischl, U., Youssef, M. T., Kilwinski, J., Lehn, N., Zhang, W. L., Karch, H., et al. (2002). Real-time fluorescence PCR assays for detection and characterization of Shiga toxin, intimin, and enterohemolysin genes from Shiga toxin-producing Escherichia coli. J. Clin. Microbiol. 40, 2555–2565. doi: 10.1128/JCM.40.7.2555-2565.2002
Ribot, E. M., Fair, M. A., Gautom, R., Cameron, D. N., Hunter, S. B., Swaminathan, B., et al. (2006). Standardization of pulsed-field gel electrophoresis protocols for the subtyping of Escherichia coli O157:H7, Salmonella, and Shigella for PulseNet. Foodborne Pathog. Dis. 3, 59–67. doi: 10.1089/fpd.2006.3.59
Ribot, E. M., Freeman, M., Hise, K. B., and Gerner-Smidt, P. (2019). PulseNet: entering the age of next-generation sequencing. Foodborne Pathog. Dis. 16, 451–456. doi: 10.1089/fpd.2019.2634
Scallan, E., Hoekstra, R. M., Angulo, F. J., Tauxe, R. V., Widdowson, M. A., Roy, S. L., et al. (2011). Foodborne illness acquired in the United States—major pathogens. Emerg. Infect. Dis. 17, 7–15. doi: 10.3201/eid1701.P11101
Shannon, C. E. (1948). A mathematical theory of communication. Bell Syst. Tech. J. 27, 379–423. doi: 10.1002/j.1538-7305.1948.tb01338.x
Strobl, C., Boulesteix, A. L., Kneib, T., Augustin, T., and Zeileis, A. (2008). Conditional variable importance for random forests. BMC Bioinformatics 9:307. doi: 10.1186/1471-2105-9-307
Swaminathan, B., Barrett, T. J., Hunter, S. B., Tauxe, R. V., and Force, C. D. C. P.T. (2001). PulseNet: the molecular subtyping network for foodborne bacterial disease surveillance, United States. Emerg. Infect. Dis. 7, 382–389. doi: 10.3201/eid0703.017303
Tolar, B., Joseph, L. A., Schroeder, M. N., Stroika, S., Ribot, E. M., Hise, K. B., et al. (2019). An overview of PulseNet USA databases. Foodborne Pathog. Dis. 16, 457–462. doi: 10.1089/fpd.2019.2637
Wang, L., Rothemund, D., Curd, H., and Reeves, P. R. (2003). Species-wide variation in the Escherichia coli flagellin (H-antigen) gene. J. Bacteriol. 185, 2936–2943. doi: 10.1128/JB.185.9.2936-2943.2003
Wood, D. E., Lu, J., and Langmead, B. (2019). Improved metagenomic analysis with Kraken 2. Genome Biol. 20:257. doi: 10.1186/s13059-019-1891-0
Keywords: foodborne surveillance, PulseNet, machine learning, random forest, pulsed-field gel electrophoresis (PFGE)
Citation: Im SB, Gupta S, Jain M, Chande AT, Carleton HA, Jordan IK and Rishishwar L (2021) Genome-Enabled Molecular Subtyping and Serotyping for Shiga Toxin-Producing Escherichia coli. Front. Sustain. Food Syst. 5:752873. doi: 10.3389/fsufs.2021.752873
Received: 03 August 2021; Accepted: 13 September 2021;
Published: 13 October 2021.
Edited by:
Jasna Kovac, The Pennsylvania State University, United StatesReviewed by:
Erin M. Nawrocki, The Pennsylvania State University, United StatesIsha R. Patel, United States Food and Drug Administration, United States
Copyright © 2021 Im, Gupta, Jain, Chande, Carleton, Jordan and Rishishwar. This is an open-access article distributed under the terms of the Creative Commons Attribution License (CC BY). The use, distribution or reproduction in other forums is permitted, provided the original author(s) and the copyright owner(s) are credited and that the original publication in this journal is cited, in accordance with accepted academic practice. No use, distribution or reproduction is permitted which does not comply with these terms.
*Correspondence: Lavanya Rishishwar, bGF2YW55YS5yaXNoaXNod2FyQGdhdGVjaC5lZHU=