
95% of researchers rate our articles as excellent or good
Learn more about the work of our research integrity team to safeguard the quality of each article we publish.
Find out more
ORIGINAL RESEARCH article
Front. Phys. , 18 September 2023
Sec. Medical Physics and Imaging
Volume 11 - 2023 | https://doi.org/10.3389/fphy.2023.1209538
 Nkhensani Mogale1,2*†Justin D. Scott3†Daniel Schanz2Viktor Ilyasov2Tamara Reid Bush3†Albert-Neels van Schoor1†Jill M. Slade2†
Background: Pressure injuries are commonly noted in individuals who use wheelchairs for mobility and sit for prolonged periods. Understanding soft tissue composition is an essential part of treating and preventing pressure injuries. This study proposes novel approaches for imaging the soft tissue of the buttocks in unloaded and loaded conditions using ultrasound (US) and magnetic resonance imaging (MRI).
Methods: The soft tissue of the buttocks was measured in able-bodied participants (n = 26, 50% female) and one male with a spinal cord injury using an innovative chair that allowed seated US acquisition of the buttocks and a newly developed MRI compatible loader. The US test–retest reliability (reproducibility) of buttocks soft tissue was assessed, and US was validated with MRI. Soft tissue was measured between the peak of the ischial tuberosity (IT) and proximal femur and the skin. MRI was used to quantify the fat fraction of the gluteus maximus muscle, with the goal of determining the influence of intramuscular fat on loaded soft tissue responses and was used to assess tissue thickness during buttocks loading.
Results: US reproducibility was excellent, ICC = 0.934–0.981, with no statistical differences between scan days. Coefficients of variation (CVs) between visits ranged from 2.5% to 7.4% for loaded and unloaded tissue. US and MRI measures of tissue thickness were significantly correlated (r = 0.68–0.91, p ≤ 0.001). US underestimated the unloaded tissue thicknesses, with a mean bias of 0.39–0.56 cm. When the buttocks were loaded, US- and MRI-measured total tissue thickness was reduced by up to 64.2% ± 9.1% (p < 0.001). The US- and MRI-unloaded total soft tissue of the IT was correlated with loaded tissue thickness (r = 0.54–0.67, p ≤ 0.027). Intramuscular fat of the gluteus maximus was not correlated to changes in muscle thickness with loading (r = 0.05, p > 0.05).
Conclusion: We have developed and validated a novel US methodology using MRI as a comparison measure to investigate soft tissue anatomy and deformation during sitting and loading. The ability to obtain such data in the loaded condition is unique and fills an unmet need in understanding loading and pressure injury formation.
Pressure injuries occur across several populations predisposed to prolonged sitting or lying postures. The populations most at risk are those who are bedridden and those using wheelchairs for mobility, including those who have spinal cord injury (SCI), multiple sclerosis, and cerebral palsy [1]. Pressure injuries due to prolonged sitting are most commonly associated with the areas of high shear forces and pressure near bony protuberances, including the sacrum and the ischial tuberosity (IT) of the pelvis [2–4]. A common pressure injury associated with prolonged wheelchair use is a sitting-acquired deep tissue injury which mostly develops in the gluteus maximus muscle and related soft tissue located under the IT [3]. Soft tissue changes are associated with the development of pressure injuries [2,5–8]. Numerous factors are proposed as contributing factors in pressure injury development, including fluctuating weight, muscle atrophy, flattening of the IT, and increased intramuscular fat deposits within the skeletal muscles [3].
Understanding and quantifying changes to both soft tissue composition and soft tissue mechanical properties is critical for detection and ultimately prevention of pressure injuries. Approaches to study soft tissue composition have included basic anthropometric studies as well as imaging approaches using ultrasound (US) and magnetic resonance imaging (MRI) [9–15]. Studying soft tissue of the seated buttocks and thigh is challenging in several ways. First, soft tissue distribution changes with different postures, especially the soft tissue of the buttocks with the flexion of both the hips and knees, like when seated. This position change, from supine to a seated posture, results in both anatomical and mechanical changes in the soft tissue [9,16–18]. Second, evaluating unloaded soft tissue in a seated position for the buttocks and thighs is difficult, given that the body needs to be balanced and suspended with minimal pressure to image soft tissue while maintaining a neutral pelvis. Approaches have included using a toileting chair, using chairs with gaps in the seat base and sitting just on the front edge of a chair, and sitting upon the coccyx (tailbone) [11,19–21]. Third, loaded soft tissue can also be difficult for both US and MRI, given the challenges to properly provide a seated position that is safe and compatible with restricted imaging environments.
In this study, we propose novel approaches for imaging the soft tissue of the buttocks in both an unloaded and loaded seated position using US and MRI. For unloaded tissue measures, participants were tested in a sidelying position with the hip and knee joint flexion and a neutral pelvis reflecting “seated” joint position. For studying loaded tissue during sitting, we designed a US chair with an acrylic glass base fitted with a seat cushion that accommodated a gel disk. For studying loading in a “seated” position with MRI, we adopted the sidelying position and applied loads to the inferior pelvis with a custom-built loader/seat.
Using these approaches, we tested four primary outcomes. First, we evaluated the test–retest reliability (reproducibility) of US of the buttocks and thigh in a loaded and unloaded position. Second, we validated the unloaded US measures of soft tissue thicknesses with MRI. Third, we tested the validity of the MRI loader by examining the calculated soft tissue properties under load with those in the published literature on tissue mechanical properties. Last, we studied the influence of soft tissue thickness and soft tissue composition on tissue changes with loading. These studies were primarily performed in able-bodied participants with one proof-of-concept US study conducted in a male participant with SCI.
The soft tissue of the buttocks was measured primarily in male and female able-bodied participants recruited from the university campus. The inclusion criteria included body weight <136 kg due to weight limits for the MRI table and height <180 cm due to the limitation from the MRI bore size that limited hip flexion for individuals who were tall and, hence, were anticipated to have long femurs. Implanted ferrous metal or electronic devices were the exclusion criteria for the study due to the strong magnetic field associated with the MRI component. Ethical approval for conducting the study was received from the Institutional Review Board of Michigan State University (IRB 5332). Informed consent was required from the recruited participants prior to inclusion in the study. The study required two US visits and one MRI visit. The visits were completed within approximately 3 weeks of each other. Participants were instructed to avoid strenuous activities 24–48 h prior to testing. Height and weight were measured, and the participants were enquired about exercise or sport involvement. For access to the soft tissue of the buttocks, the participants were scanned wearing surgical shorts and instructed to select appropriate underwear that would not interfere with US scanning.
US scans were carried out by a single operator using a LOGIQ GE P6 US machine (GE Healthcare, Wauwatosa, WI, United States). Images and videos were collected using the brightness mode (B-mode) with a linear transducer (GE 9L, 8–10 MHz) that has a 14 mm × 53 mm footprint. Multiple focus points (3–4) were used to improve the echo quality through the entire depth of the unloaded soft tissue. US scans were performed for a minimum of three times by taking a measure, removing the transducer, and repeating measurements. Tissue thickness measurements were made between the bone (IT or femur) and the superficial skin. The US sessions began with unloaded soft tissue measures of the pelvis and thigh, which typically required ∼30 min. This was followed by loaded measures of the pelvis and proximal thigh that required up to 30 min. The loaded measure pelvis images were acquired after 10–15 min, which included the time needed to properly position the subject and time needed to find the peak of the IT.
The participants assumed the left lateral decubitus (i.e., lateral recumbent) position on a firm table. The hips were flexed to 105°–110° and the knees to ∼90° using a goniometer and standard procedures [12,22] to reflect joint angles during seating [23] (Figure 1). In brief, the goniometer was first positioned at the lateral mid-point of the pelvis, and the second arm was set in line with the femur. This included palpating and marking the greater trochanter and the lateral epicondyle to determine the position of the femur. A foam pad was placed between the knees, a pillow between the legs, and the greater trochanters were aligned with one another to assist with a neutral positioning of the pelvis. Pillows were provided for neck support. To locate the IT, moderate pressure was applied with the US probe in the gluteal region. The probe was applied perpendicular to the IT. After locating the IT, the probe was moved anteriorly and posteriorly along the ischiopubic ramus to locate the peak of the IT. To acquire images of the unloaded soft tissue, the probe pressure was gradually reduced until it was just contacting the skin, with the IT still visible on the screen (Supplementary Video S1). The unloaded tissue thickness was measured when the soft tissue appeared to be fully uncompressed with the bone cortex visible. This process of unloading the soft tissue was carried out for a minimum of three times. The video clips provided a helpful guide in identifying bony landmarks and distinguishing the borders between tissue types.
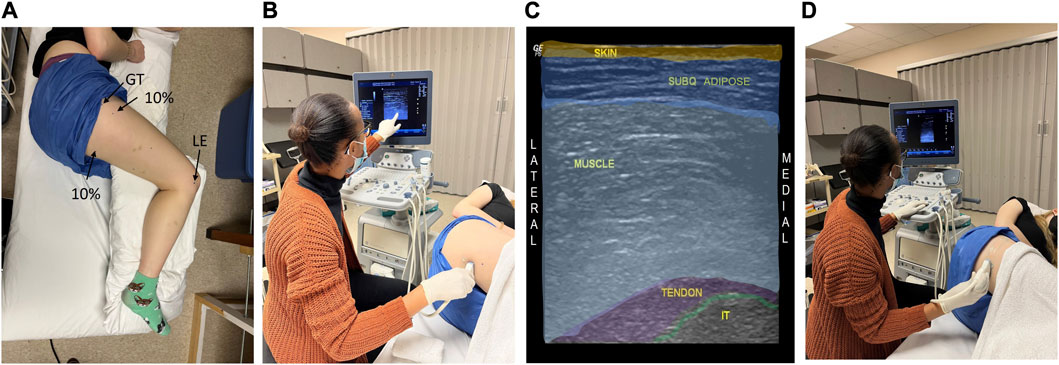
FIGURE 1. Ultrasound (US) imaging methods are shown for the unloaded soft tissue of the buttocks and thigh. The participant is in the left lateral decubitus position with the hips flexed to 110° and the knees to 90° to attain “seated” joint positions (A). US is used to locate the target anatomical sites and associated soft tissue of the ischial tuberosity (IT, (B, C), and the proximal femur (at 10% of the femur length, (D)). A color-coded US image is shown (C), indicating the unloaded “seated” buttocks tissue and underlying IT. Lateral epicondyle (LE) and greater trochanter (GT) were landmarks used to determine the location for the proximal thigh measures.
In addition to the IT soft tissue measurements, the unloaded soft tissue thickness of the posterior femur was measured at 10% of femur length (proximal thigh). This region was previously shown to have altered tissue properties in participants with prolonged wheelchair use [24–26]. The femur length was determined by measuring the distance between the greater trochanter and the lateral epicondyle. The bony regions were identified by palpation, with the peak of the greater trochanter (lateral edge) confirmed using US. The 10% thigh length between these landmarks was marked with a sharpie and recorded. For the thigh, the US scanning began at the lateral thigh with the transducer held perpendicular to the long axis of the femur. The transducer was slowly moved to the posterior thigh to the most posterior position that included the femur. The distance that captured the soft tissue at the most posterior point of the thigh, in which the femur was visible, was marked and recorded, and images were collected at these sites. This approach was necessary as the position of the femur within the thigh varies both along the length of the thigh and varies between subjects depending on sex and body size. A minimum of three videos of the proximal femur were recorded.
Participants were seated on a custom chair that included a wooden seat base (64 cm × 45 cm × 2 cm) with a rectangular slot (7 cm × 2.5 cm) to accommodate the US transducer (Figure 2). The chair height was reduced to accommodate the participant with SCI. Acrylic glass (61 cm × 46 cm × 0.7 cm) was placed on the top of the seat base with a custom cushion (61 cm × 46 cm × 2.5 cm) placed on the top of the acrylic glass. The cushion was covered with vinyl enclosing 5-cm-thick high-density foam and included a 10-cm circular opening made to accommodate an Aquaflex US gel pad (2 cm × 9 cm). The center of the circular opening was ∼11 cm from the back of the cushion and ∼13 cm from the right side of the cushion. The gel pad permitted US scanning of the soft tissue below the IT in the seated loaded position. The acoustic transmission of the pad has been previously reported [27]. The US gel was applied above and below the gel pad. The US scanning was carried out by placing the probe under the seat and using copious amounts of gel. To position the participant so that the IT was positioned over the gel pad and acrylic glass window, the posterior superior iliac spines (PSISs) were palpated from the back of the chair. The IT was located ∼2–5 cm lateral to the PSIS depending on the sex and body size of the participant. Proper positioning of the subject included using an adjustable footrest that was positioned to support the forefoot, with the subjects asked to sit erect with their shoulders and shoulder blades in contact with the seat back using supportive pillows if needed for erect posture (Figure 2). After visualization of the IT, the thigh was lifted to reset the soft tissue to correct for any unintended stretching or pulling of the skin and soft tissue of the buttocks and thigh. As was carried out with the unloaded US of the pelvis, the transducer was moved anteriorly and posteriorly along the ischiopubic ramus to locate the peak of the IT. A minimum of three videos at the peak of the IT were recorded. The participant then moved back on the seat, and the femur was aligned over the gel pad. A minimum of three videos were captured at the proximal thigh. All equipment were sanitized between testing of each subject, and a new gel pad was used for each test/subject.
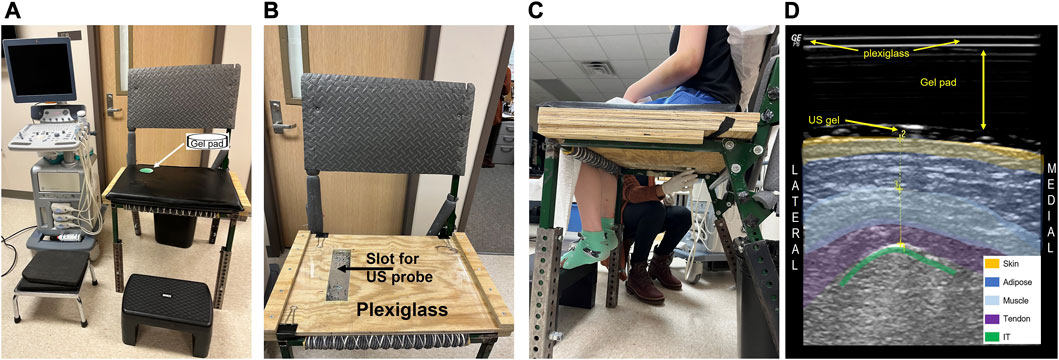
FIGURE 2. The ultrasound (US) setup is shown for imaging soft tissue of the buttocks in the upright loaded seated position. The wooden chair base contains a slot for the ultrasound linear probe to be placed and has acrylic glass on top (A). A vinyl covered foam cushion with a clear gel pad (9 cm × 2 cm) insert was placed on the top of the acrylic glass prior to imaging (B). The seated US imaging was carried out by holding the probe under the chair and measuring through the clear gel pad (C)). The participant sat erect with shoulder blades in contact with the chair back (and firm pillow if needed) with the hip angle at 100° of flexion. A color-coded US image is shown (D), indicating the buttocks tissue and the appearance of the acrylic glass and gel pad.
All images were acquired at 3T (GE Excite) using the body coil. Iterative Decomposition of water and fat with Echo Asymmetry and Least-squares estimation (IDEAL) and T1-weighted coronal images were acquired. For IDEAL MRI fast 3D gradient echo (GRE), 512 × 224 matrix, 40 cm field-of-view (FOV), 4 mm slice thickness, flip angle (FA) = 5°, and 62.5 kHz bandwidth, 40-slice slab were used to evaluate the thickness of the unloaded tissue and the apparent fat fraction of the gluteus maximus muscle in the unloaded tissue. T1 weighted images (Fast spin echo, 4 mm slice thickness, repetition time (TR) = 1,216 m s, echo time (TE) = 7.9 m s, 320 × 224 matrix, 40 cm FOV, and 20–24 slices) were used to measure tissue thickness during loading as this fast sequence only required ∼1.5 min compared to the IDEAL sequence that required 5 min. Unloaded images were acquired prior to loading. Care was taken to ensure that the seat of the loader did not contact the buttocks for the unloaded position, and this was confirmed with the MRI images inspecting the images for deformed tissue. The table was kept fixed for all the scans during loading. This was carried out to minimize scanning and loading time and allowed observations of how far the body was moved during loading.
The participants were fitted with a 30-cm-wide neoprene binder to protect the top of the pelvis, and a nylon waist belt was placed on the top of the binder. This served as a harness to loop additional nylon straps through to stabilize the participant when load was applied to the inferior pelvis. The subjects were positioned in a left lateral decubitus position with hip flexion at 100°–120° and knee flexion at 90°. The subjects were positioned to be lying on the left hip, with the right hip fully unloaded with the buttocks positioned in-line with the loader (Figure 3). The greater trochanter and the right and left hip bones were aligned vertically to attain a neutral pelvis position. Padding was placed between the knees and ankles to assist in proper pelvis and thigh position during simulated sitting. The nylon straps were placed under the left hip and over the right hip and secured to the MRI table base. A vial of water was taped to the marked skin to indicate the location of the US scanning of the proximal thigh. Padding was also used behind the back to reduce direct contact with the MRI bore.
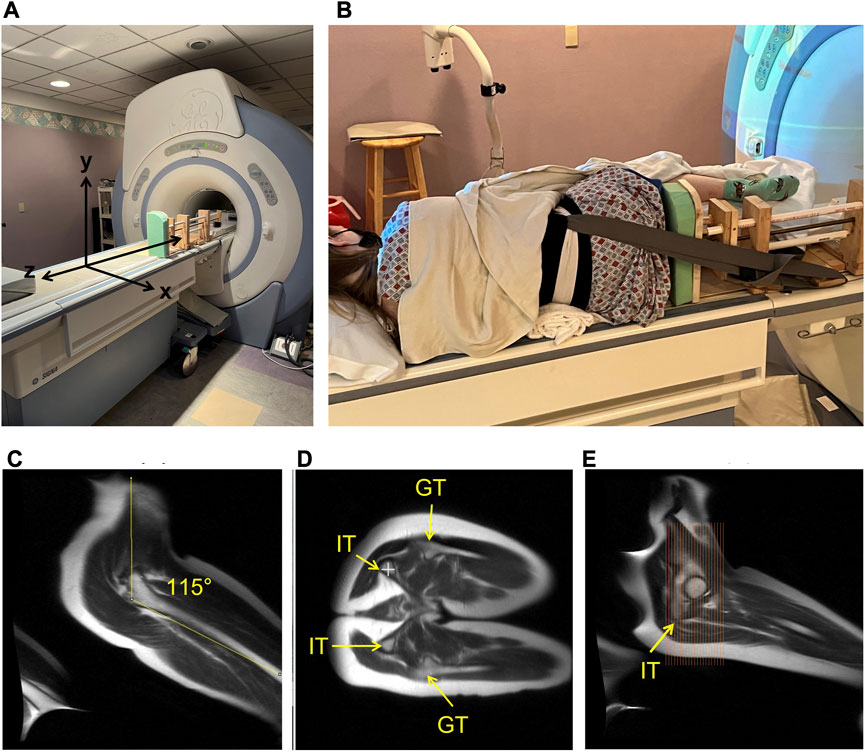
FIGURE 3. The MRI set-up and slice prescription are shown in the figure. The custom MRI compatible loader is fixed on the right side of the table to provide loading in the z-axis to the soft tissue of the buttocks (A). The participants were positioned in the left lateral decubitus position with nylon straps secured to a waist harness to keep position during loading with a target hip angle of 105°–115° and knee angle of 90° to reflect “seated” joint positions (B). MRI localizer images of the hip angle achieved in the MRI (C). The alignment of the ischial tuberosity (IT) of the pelvis and greater trochanter (GT) of the femur, highlighting the target position of a neutral seated pelvis is shown (D). The right—top IT is indicated with a white plus sign. The slice prescription is shown covering the ischial region to the pubis region of the pelvis (E).
A custom-designed loader (Figure 4) was used to apply load to the buttocks. The loader consisted of a 30 × 12.5 × 2 cm seat with 5-cm-thick high-density foam on the seat base. The loader was fixed to a custom insert/base designed to fit in the contoured MRI table cradle. The loader consisted of a 77-cm-long threaded brass rod [1/2–13 unified national course (UNC)] and a driving board to apply loads. The rod length allowed the seat/load to be applied by turning the crank from behind the MRI bore. The threaded rod worked through a threaded brass guide block ending with pairs of lock nuts and a large nylon washer contained within the driving board. Petroleum jelly was used as lubricant. The washer acted as a thrust bearer. The rod was passed through two wood blocks for stability to support the loader. The blocks also housed polyvinyl chloride (PVC) piping, running through the length of the loader to reduce bending of the brass rod and support the loader. A load cell was mounted next in the series, between the driving board and the seat, directly adjacent to the rod. The loader ended with the seat that was applied to the buttocks. The load cell (model SSM-EV-250; Interface, Scottsdale, AZ) was mounted between the driving board and the seat to quantify the load. To stabilize the load cell and assure consistent movement of the loading board and seat, four guideposts were utilized to support the travel of the load cell as loading on it occurred. Four PVC pipes were configured around the load cell that fit around the guideposts on the backside of the seat to allow the seat to maintain alignment, but the posts did not contact the driving board itself, ensuring the axial load was borne by the load cell. A separate board was mounted to the mounting base near the feet to provide anchor points for nylon straps that were attached to a waist belt/harness. The straps stabilized the body and prevented the seat from pushing the participant’s body away from the seat. The seat was designed to slide along the base with negligible friction or resistance and did not contact the MRI bore. This equipment consisted of all non-ferrous materials. The force cable for the load cell was connected to a pin panel in the wall and thereafter connected by a cable to an AD converter and PC located outside the scanning room. All equipment were first tested for safety outside the MRI scanner, followed by testing inside the scanner with phantoms during pilot testing.
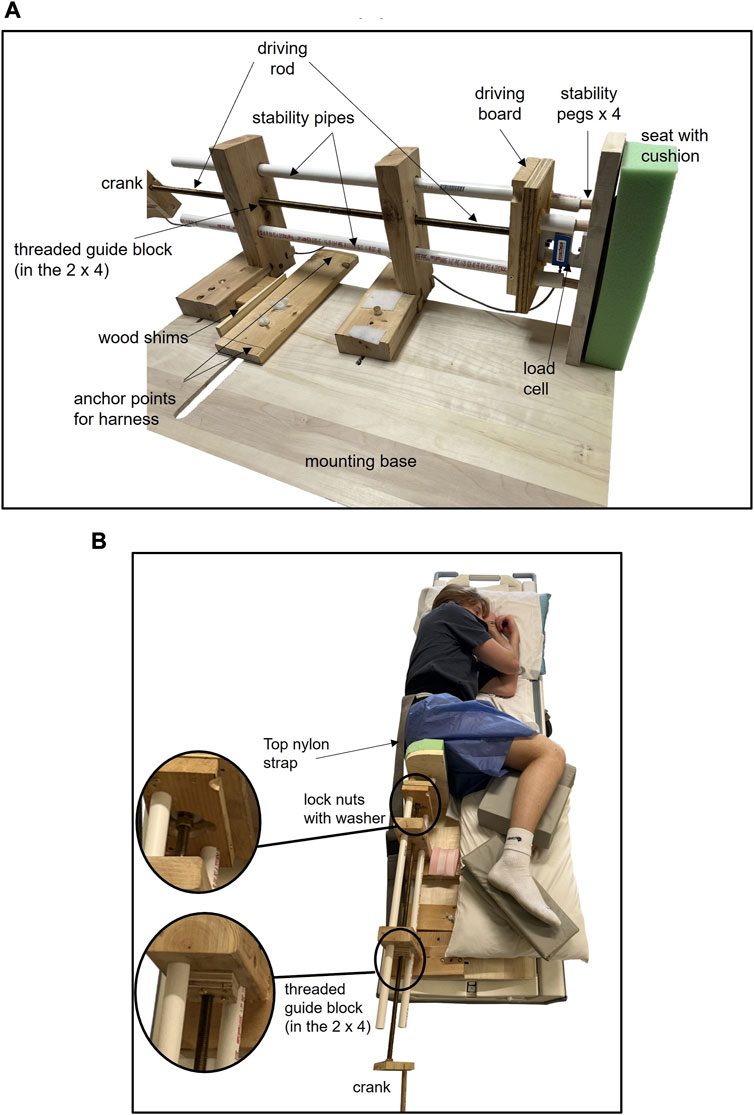
FIGURE 4. Custom MRI loader consisting of a threaded brass rod attached to a driving board and configured with a load cell that interfaces with a seat. The rod/driving board is used to move the seat and apply load in the z-axis (Figure 3). The rod is turned with a crank that can be accessed from the back of the MRI machine. The threaded rod works through a threaded brass guide block ending with pairs of lock nuts and a large nylon washer contained within the driving board. The washer is acting as a thrust bearing ((B) inserts). PVC “stability pipes” are used to stabilize the loader and reduce bending of the brass rod. A load cell is mounted next in the series, between the driving board and the seat, approximately in line with the rod (A). Between the driving board and the seat, there are four short PVC pipes on the driving board that are aligned with four smaller stability pegs on the seat (A). These are mounted around the load cell to minimize rotation of the seat in the y-axis and ensure the load applied in the z-axis is borne by the load cell. A separate board is mounted to the base of the loader to provide anchor points for nylon straps that attach to a waist belt/harness. The straps stabilize the body and prevent the seat from pushing the participant’s body away from the seat, and the top nylon strap is visible (B). The seat hovers just above the base, with minimal contact or friction with the mounting base. Cushions are placed between the knees and ankles to assist with a neutral pelvis position.
The applied load was sampled at 60 Hz, digitized, and recorded (model DI-195B; DATAQ Instruments, Akron OH). Multiple loads [recorded in volts (v)] ranging from 0.15 to 1.80 v (equivalent to 3–40 kg) were applied to the participants, and the minimum increment was 0.15 v. The applied loads included a load equivalent to 30% of the body weight to evaluate the change in soft tissue thickness with an equivalent relative load across all participants. The loads were carried out progressively, starting with the lowest load and increasing to higher loads. On average, it took approximately 1–2 min to set the load and allow for the soft tissue to relax and the applied force to stabilize. The top load achieved in participants approached 50% of body weight. During loading, real-time feedback of the load was used to determine the extent to which the crank should be turned for each target load. The load was displayed in the scan room with a projector to guide the loading. Although the load was applied, participants were asked to fully relax and not tighten the buttocks or resist the seat. The participants were asked to report any discomfort or pinching.
Soft tissue thickness measures included total, skin + subcutaneous adipose tissue (SA), and muscle + tendon (MT). For the IT, the gluteus maximus muscle and hamstring tendons (long head of biceps femoris, semitendinosus, and semitendinosus muscles) contributed to MT. For the thigh, the gluteus maximus muscle was the primary component of the MT tissue with a small amount of the adductor magnus muscle for the proximal thigh. The peak of the bone (IT for the pelvis and femur for thigh) was the starting point for measurement, while the muscle fascia indicated the boundary between the MT and SA, and the superficial skin was the final boundary for SA and total measures. The US images were analyzed on the US machine using the measure tool and averaging three measures for each location and condition. The MRI tissue thickness was measured using Fiji/ImageJ [28]. The MRI tissue thicknesses were measured in three consecutive slices at the peak of the IT and femur and averaged as an equivalent comparison to the US images.
The apparent fat fraction of the gluteus maximus muscle was quantified from the unloaded IDEAL MRI images as an index of intramuscular fat infiltration [29]. A region of interest was drawn around the gluteus maximus muscle located below the IT on the water image and superimposed onto the fat image after correcting for chemical shift (2.2-pixel shift). The fat fraction was quantified as follows: [SI fat/(SI fat + SI water)] × 100, where SI is the signal intensity, yielding a pixel-by-pixel fat fraction averaged across the muscle. A total of seven slices were analyzed and averaged.
The change in soft tissue thickness at the IT with loading was calculated as the percentage reduction (unloaded tissue–loaded tissue)/unloaded tissue × 100) for the loaded seated US and for the 30% body weight loading MRI trial and the 50% body weight trial.
In addition, the following approach was taken to use tissue mechanical properties to characterize tissue deformation as a result of the applied load in the MRI system. The loads and tissue thickness were converted into stress and stretch data, respectively. Stress was calculated as the load divided by the area of the contact plate used to represent the seat. Stretch was calculated as (loaded tissue thickness)/(unloaded tissue thickness) from the MRI data. The stress and stretch data were modeled using an incompressible first-order Ogden material and compared to previously published data measured in the proximal femur soft tissue during progressive loading [21]. The relationship between the stress and stretch in the first-order Ogden model is described in Eq. 1.
In Eq. 1, σ is the stress applied, λ was the stretch in parallel to the direction of the applied stress, µ was the first-order Ogden parameter with units of kPa, and α was the unitless second-order Ogden parameter. In Eq. 1, any stretch in the directions perpendicular to the applied stress was equal. In particular, the shape of the stress response was used as an indicator of tissue mechanical behavior with an expected exponential shape, indicating an increase in tissue stiffness with greater deformation.
Data are reported as the mean ± SD. Intraclass correlations (ICCs) were used to measure the test–retest reproducibility of US tissue thicknesses between US testing visits using two-way mixed effects with absolute agreement. ICC values were classified as excellent: >0.75, good: 0.74–0.60, fair: 0.59–0.40, and poor: <0.40 [30]. Paired t-tests were used to determine statistical differences between days, and the coefficient of variation (CV) was calculated. Pearson’s correlation was calculated to examine the relationship between the two modalities for measuring the unloaded tissue thickness using Bland–Altman plots to estimate the limits of agreement and bias [31] between MRI tissue thickness measures and the US measures. Normality of the differences between measures was confirmed with the Shapiro–Wilk test. CVs between the modalities were also calculated. Pearson’s correlation was used to explore the relationships between unloaded tissue thickness and the fat fraction and loaded tissue thickness (MRI images) of the gluteus maximus muscle. Paired t-tests were used to compare the change in soft tissue with sitting and loading comparing MT to SA, with the significance at p < 0.05. Data normality was assessed with Shapiro–Wilk tests. Non-parametric Wilcoxon signed rank test and Spearman’s correlation were used when normality was violated. IBM SPSS v.28 was used for statistical testing.
The study included able-bodied male (n = 13, 25 ± 5 yrs, and BMI = 25 ± 4 kg/m2) and female participants (n = 13, 20 ± 2 yrs, and BMI = 24 ± 4 kg/m2) and one male participant with chronic complete SCI at level C5/6 (60 years and BMI = 29 kg/m2). Most of the female participants were undergraduate students, and the male participants who volunteered were graduate students and therefore were older. Two participants reported a fair amount of exercise training (one male rugby player and one female weightlifter), and several engaged in regular exercise. Therefore, the sample had a mix of exercise training, albeit physical activity was not formally assessed.
US images of the IT showing soft tissue thicknesses of three able-bodied participants (one female) and the male participant with SCI are shown in Figure 5. The US resolution varied across participants as observed in the images. However, the borders between tissue categories required to define and measure tissue thicknesses were visible. The seated position US images were hyperechoic as expected from the use of the imaging gel pad. All seated position US data were not normally distributed. The tissue thicknesses of the IT are shown in Figure 6. The reproducibility of tissue thicknesses was excellent between days for unloaded and loaded seated IT (ICC = 0.934–0.981) and proximal thigh (ICC = 0.960–0.956). There were no statistical differences in soft tissue measures between days (p ≥ 0.258). For soft tissue below the IT, CVs were 2.5% and 2.8% for total unloaded and loaded, 3.4% and 6.6% for MT unloaded and loaded, and 6.3% and 4.8% for SA unloaded and loaded, respectively. For the thigh soft tissue, CVs were ≤4.8% for total and MT with SA CVs ≤7.41%. Proximal femur tissue thicknesses can be found in the Supplementary Material.
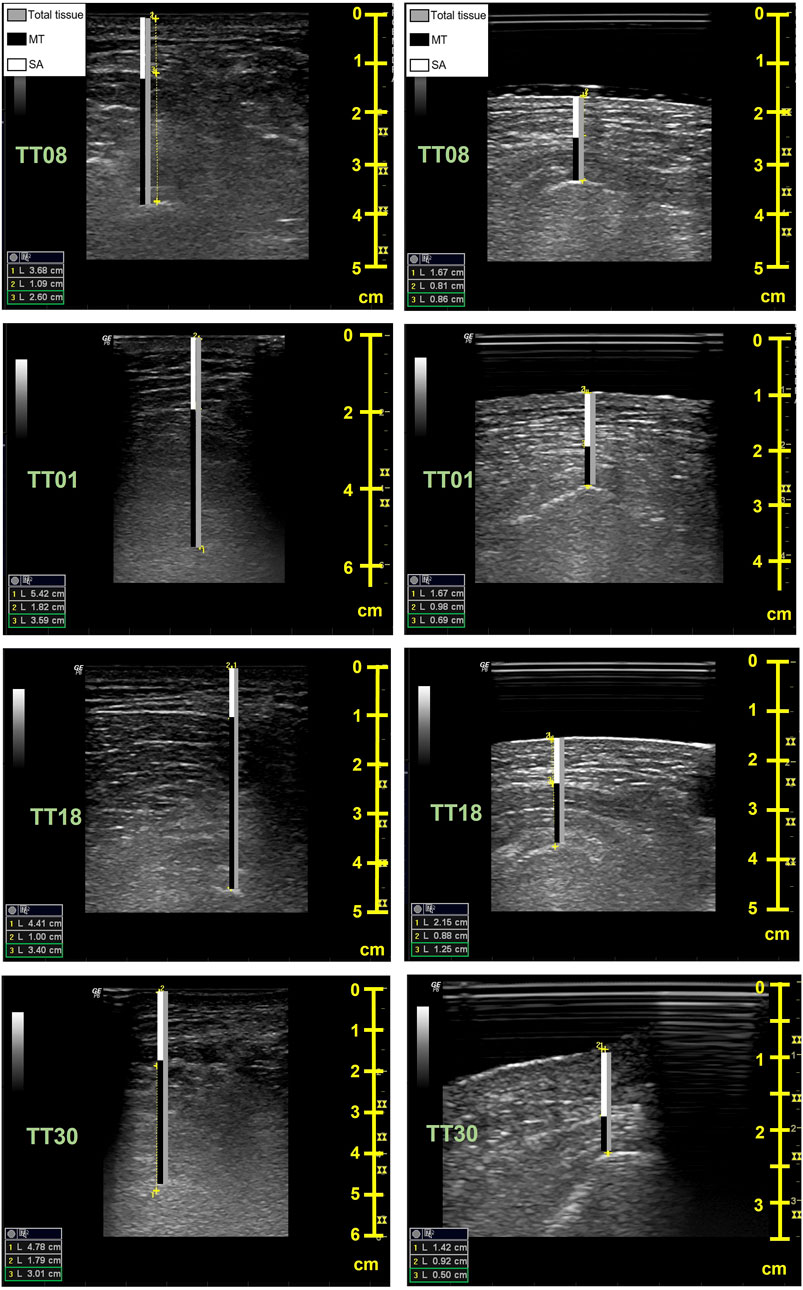
FIGURE 5. Sample ultrasound images for the unloaded (left) and seated (right) conditions. Images are from a female (TT08, top row), two able-bodied males (TT01, age = 35 and TT18, age = 20, middle rows), and a male with spinal cord injury (TT30, age = 60, bottom row). The bars on the images indicate the soft tissue thickness measures for the muscle + tendon (MT, black), the skin + subcutaneous adipose tissue (SA, white), and the total soft tissue thickness (gray). The peaks of the ischial tuberosity (IT) and superficial layer of the skin were used for inner and outer measurement points, respectively, with the muscle fascia used to separate the MT from SA. The seated condition includes successful imaging of the buttocks through the acrylic glass and gel pad. The depth (cm) of imaging is reflected in the scale on the right in each image, with the unloaded condition typically requiring greater depths. Soft tissue measures are shown in the left corner of each image; 1 = total tissue, 2 = SA, and 3 = MT.
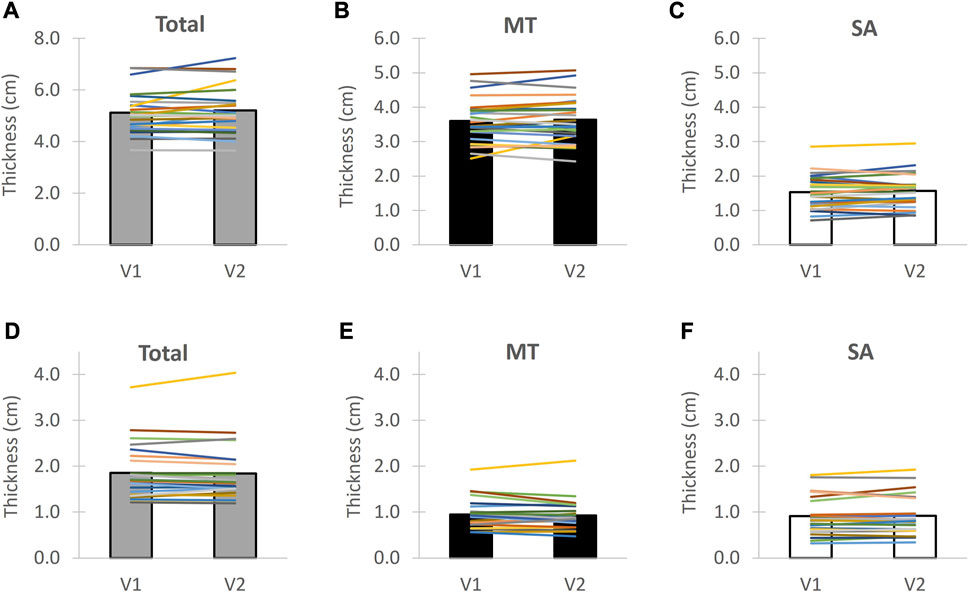
FIGURE 6. Ultrasound test-retest reproducibility for the soft tissue of the buttocks below the ischial tuberosity for unloaded tissue (top) and seated tissue (bottom). Individuals are shown with lines and group average with bars. MT = muscle + tendon and SA = skin + subcutaneous adipose tissue. V1 = Visit 1 and V2 = Visit 2. The unloaded tissue measures are indicated in (A–C) with (D–F) indicating the loaded tissue measures between Visit 1 and Visit 2 for total tissue tissue thickness, muscle + tendon thickness and skin + subcutaneous adipose tissue, respectively.
In the US unloaded condition, the MT was 70.2% ± 7.4% of the total tissue and SA was 29.7% ± 7.0% for IT (able-bodied participants). Similar distribution of soft tissue was observed for the proximal thigh. Total soft tissue of the IT was reduced by 64.2% ± 9.1% with the loaded seated US posture compared to the unloaded tissue. MT deformed more (73.1% ± 13.2%) compared to SA for IT (40.6% ± 18.3%, p < 0.001), as shown in Figure 7. The seated MT average of the IT was 0.94 ± 0.31 cm for able-bodied participants and 0.50 cm for the male participant with SCI. The change in tissue thickness at the proximal thigh with seating was ∼22% across all tissue categories. The CVs for percentage change of the IT soft tissue thickness between visits were 2.4% (Total), 3.1% (MT), and 17.6% (SA).
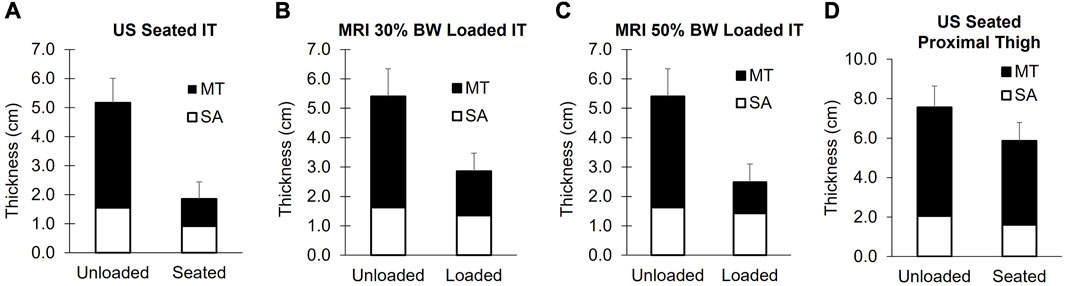
FIGURE 7. Soft tissue thicknesses of the buttocks below the ischial tuberosity measured with ultrasound (A) and MRI (B, C). Proximal thigh measures are shown in (D). The unloaded tissue for both modalities was assessed in the left lateral decubitus position with the hips and knees flexed to achieve “seated” joint positions. The US seated measures were carried out with participants sitting upright on a US-compatible chair (n = 26). The MRI loaded conditions were achieved by applying loads of 30% body weight (B, n = 22) and 50% of body weight (C, n = 18) with an MRI compatible loader. Group mean values of the soft tissue are displayed for MT (black bars) and SA (white bars), with the error bars reflecting the standard deviation of the total soft tissue changes. The MT soft tissue was reduced to a greater extent, relative to SA for the IT during seating and loading (p < 0.001). MT = muscle + tendon and SA = skin + adipose.
Twenty-two able-bodied participants had MRI data for the validation of the unloaded US measures. Sample MRI images are shown in Figure 8. Unloaded MT and SA thickness were not normally distributed. MRI and US tissue thickness correlations along with Bland–Altman plots are shown in Figure 9 for the soft tissue of the IT. The mean differences were normally distributed. Similar plots are shown for the proximal thigh (located in the Supplementary Material). Overall, the US and MRI measures were significantly correlated. Spearman’s rho was 0.73, 0.82, and 0.68 for total, MT, and SA tissue thicknesses, respectively, at the IT (p ≤ 0.001), with significant correlations also observed for the proximal thigh (r ≥ 0.89, p ≤ 0.001, Supplementary Material). The CVs between MRI and US were 7.7% (Total), 7.8% (MT), and 11.8% (SA) for the IT and 6.6% (Total), 7.5% (MT), and 12.9% (SA) for the proximal thigh. The US underestimated tissue thicknesses compared to the MRI. Unloaded tissue thickness ascertained with US had a mean bias of −0.56 cm (Total), −0.39 cm (MT), and −0.17 cm (SA) for the IT and −0.70 cm (Total), −0.36 (MT), and −0.35 cm (SA) for the proximal thigh. The hips were less flexed during the MRI compared to the US (112° ± 7° vs. 107° ± 3°, respectively, and p = 0.02).
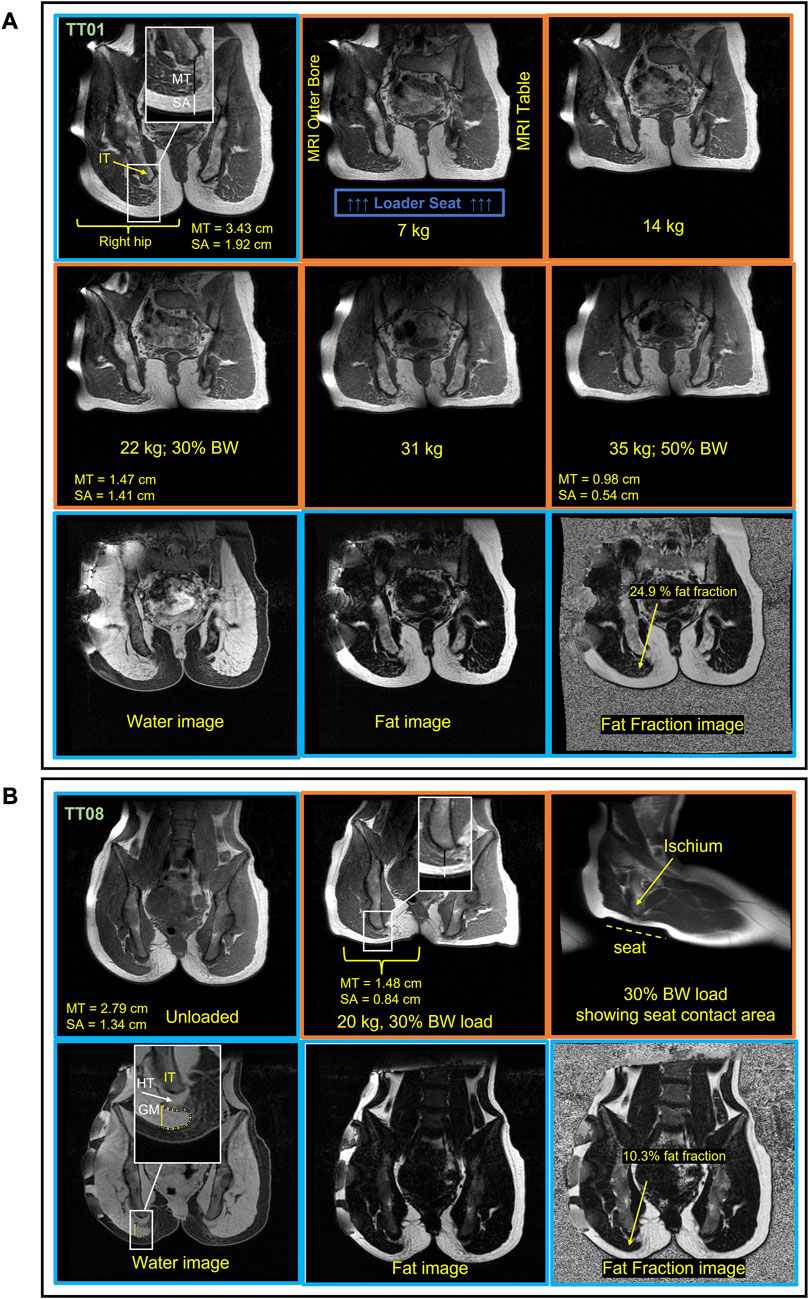
FIGURE 8. Sample MRI images from a male (A, TT01) and female (B, TT08) participant in the unloaded and loaded “seated position.” Hip and knee flexion were used to achieve “seated” joint angles. The unloaded images have a blue border, and the loaded images have an orange border. Soft tissue thickness measurement lines for the tissue below the IT (ischial tuberosity) are shown in the top left image on the image inset, with a black bar for MT (muscle + tendon) and a white bar for SA (skin + adipose) (A). The top two rows are T1 weighted images of the pelvis across loads showing that soft tissue below the IT is reduced with increasing loads. The top row for the female participant (B) shows an unloaded and 30% body weight (BW) loaded image. The bottom row for each subject shows the Iterative Decomposition of water and fat with Echo Asymmetry and Least-squares estimation (IDEAL) images. The fat and water IDEAL images were used to quantify the intramuscular fat content of the gluteus maximus (GM). The GM fat fraction was measured from the muscle located below the IT (ischial tuberosity) as indicated by the yellow ROI in the top left image for the female participants (B). The water image is weighted by water with higher pixel signal intensity (brightness), indicating high water content present in the muscle and tendon, whereas the fat image signal intensity reflects the fat content. The apparent fat fraction image is a combination of the water and fat image showing the fat fraction throughout the anatomy. HT = hamstring tendon.
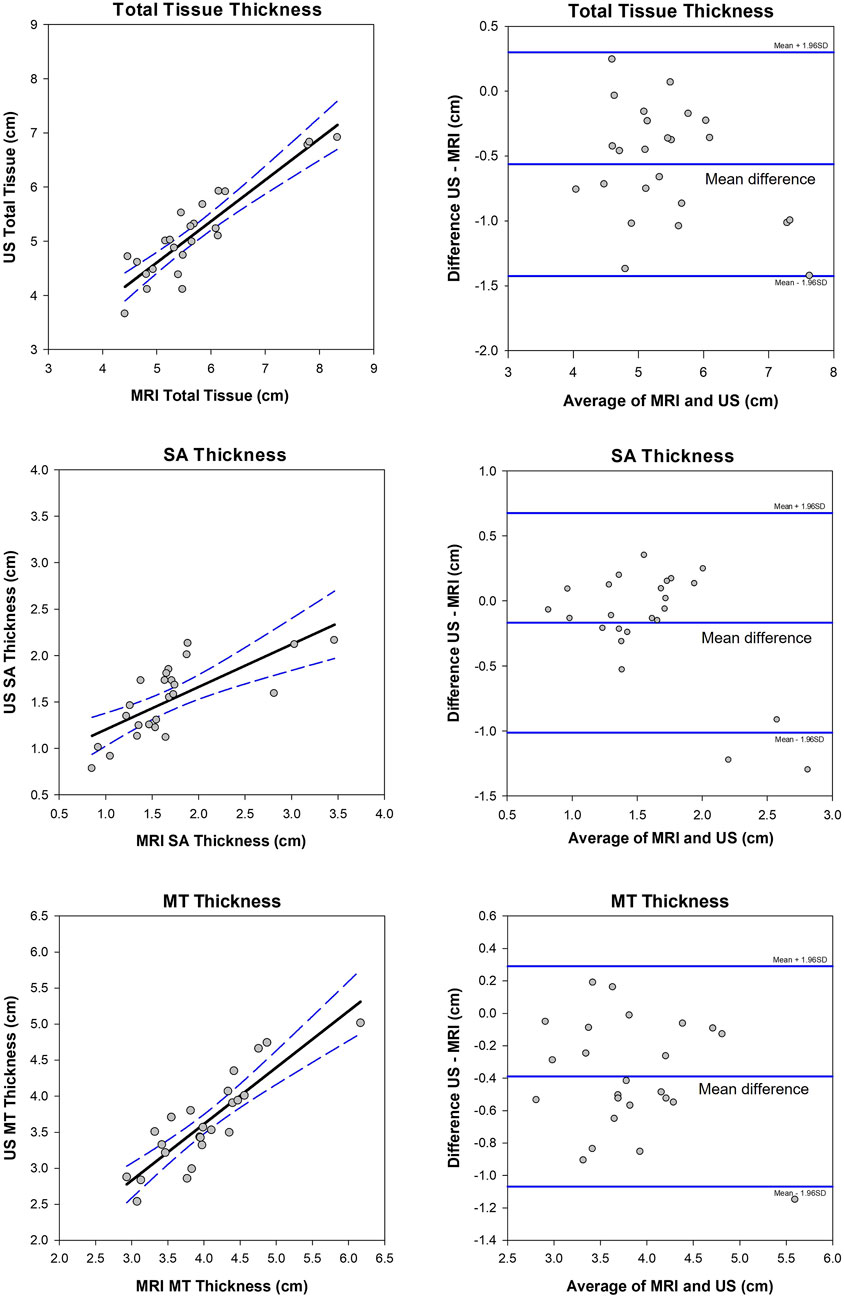
FIGURE 9. Correlation (left plots) and Bland–Altman plots (right) between MRI unloaded soft tissue and ultrasound (US) unloaded soft tissue of the buttocks. The 95% confidence intervals are shown in blue dashed lines for the correlations (rho = 0.73 (Total), 0.82 (MT), 0.68 (SA), and p ≤ 0.001). The limits of agreement and mean differences (middle line) are shown in solid blue lines on the Bland–Altman plots. MT = muscle and tendon and SA = skin and subcutaneous adipose tissue.
Soft tissue thicknesses are shown in Figure 7. The SA and total tissue thickness at 30% body weight and SA at 50% body weight loads were not normally distributed. The total soft tissue thickness at the IT was reduced by 47.0% ± 7%, with the application of 30% body weight load including a reduction in MT of 61.5% ± 16% and a reduction in SA of 16% ± 23% (n = 22). Further MT reductions were observed at 50% body weight load, and a 72% ± 4% reduction occurred with the 50% load (n = 15). No further reductions were observed with SA. The fat fraction of the unloaded gluteus maximus muscle ranged from 9%–25% (mean = 16.7 ± 4.8%). Sample images of a male and female participant are shown in Figure 8. Similar to US, the MT reduction with the load was greater than the SA reduction (p < 0.001). The estimated mechanical tissue properties derived from multiple loads (n = 18) are shown in Figure 10. The shape of the response is consistent with prior results showing an exponential increase of stress with increasing deformation (lower stretch values), indicating increased tissue stiffness at higher loads. The average µ and α values were 1,066 ± 332 Pa and 6.39 ± 0.61 Pa, respectively. The number of scans and loads applied was variable across participants’ 3–8 load range, with an average of five loads. This was primarily due to time constraints. The maximal total time under load collectively for all loads was 15–20 min. For the target loads of 30% and 50% body weight, the average applied load was 31% of body weight (21 kg) and 46% of body weight (31 kg), respectively. Four of the male participants had a body weight >87 kg and 50% body weight load could not be achieved. There were no reports of buttocks discomfort during the loading, including no soft tissue pinching. A couple of participants reported that the waist harness felt tight at higher loads. Most participants reported that they felt as if they were sitting on a soft cushion during the loading. The loader resulted in some movement of the body toward the head of the MRI table (Figure 8), but the target loads were generally achieved. Costs associated with MRI limited the number of scans. One male participant was determined to be claustrophobic and could not tolerate scanning, and technical issues prevented scanning of an additional male participant (could not align the pelvis and load was not applied to the entire IT). Therefore, a subsample (n = 22) of participants had MRI results. In addition, the loader design did not allow loads above 40 kg and, therefore, we were unable to achieve the 50% load for all the participants: n = 15 MRI scans at the 50% body weight load. We did not perform MRI scanning on the participants with SCI as they were at the upper limit of the allowable height and were concerned that the 50-cm MRI bore size would present challenges that would be difficult to navigate. The loader was used on the participant outside of the MRI to successfully apply a 30% body weight load. Further loading was not possible with the current loader design, given the subject’s body weight of 93 kg.
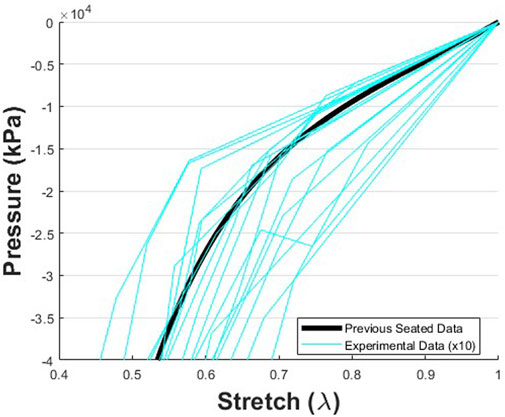
FIGURE 10. Pressure vs. stretch data representing the mechanical response data derived from the change in soft tissue thickness during loading from the unloaded baseline condition to loads up to 50% body weight The data were collected during the MRI protocol, and mechanical data were calculated from the total soft tissue thickness and applied loads (n = 18). The trends found here match the trends found with a similar approach previously reported [21]. However, in this current study, foam was attached to the indenter/seat. Therefore, additional deflection occurred as the foam was depressed, which was not observed in the prior study. This resulted in smaller pressures for a given stretch in the current study. Thus, for visual comparison, the magnitudes of the pressure data collected in this study were multiplied by 10.
Correlations between unloaded soft tissue and loaded soft tissue are shown in Figure 11 for upright sitting (US, n = 26), 30% body weight load (MRI, n = 22), and 50% body weight load (MRI, n = 15) conditions. Total soft tissue thickness and SA thickness show moderate-to-strong correlations between loaded and unloaded conditions (rho = 0.534–0.829 and p ≤ 0.005). There was also a significant correlation between unloaded MT and loaded MT at 30% body weight (r = 0.542, p = 0.009). However, for 50% body weight loads and upright sitting, there was no MT correlation. There was no significant correlation between the fat fraction of the gluteus maximus muscle and loaded MT tissue thickness (r = 0.05, p > 0.05); this is plotted for the 30% body weight load, Figure 11D. This was the outcome regardless of how the muscle was assessed (relative change with or without the tendon included (data not shown)).
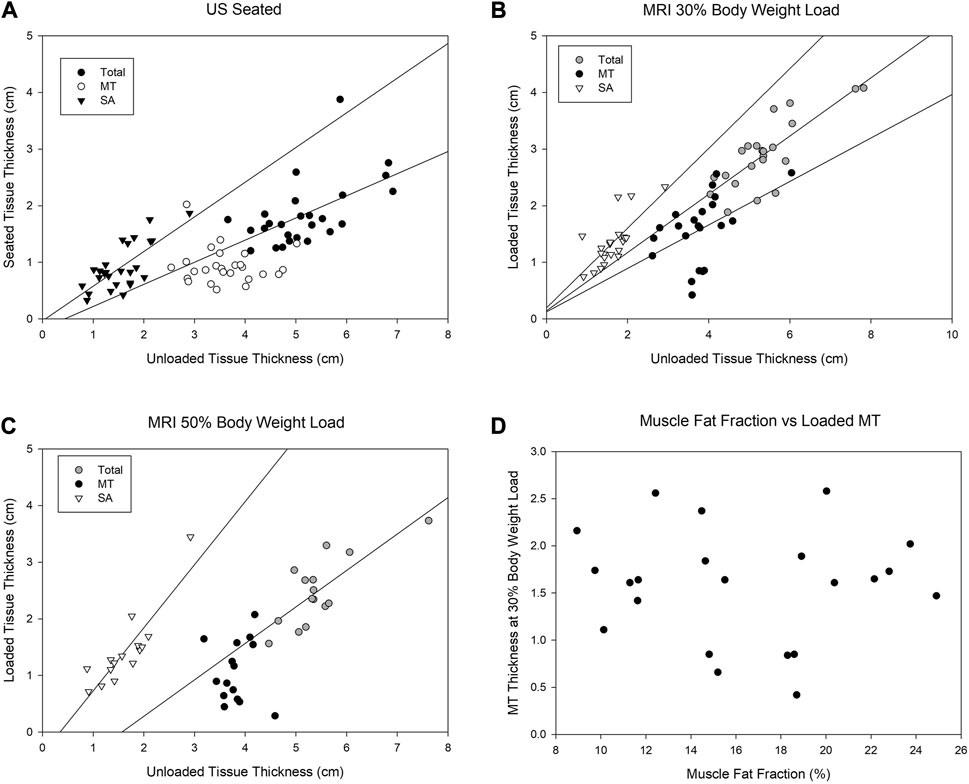
FIGURE 11. Correlations between soft tissue measures of the buttocks comparing the unloaded condition to a loaded seated condition (A, US), to a loaded seated condition of 30% of body weight (B, MRI), and to a loaded seated condition of 50% body weight (C, MRI). The findings are similar between the seated and 50% body weight load condition (A–C) with SA and total unloaded soft tissue correlating to seated condition and 30% body weight loading. There was no correlation observed between the muscle fat fraction of the gluteus maximus and the loaded thickness of MT (D). MT = muscle + tendon and SA = skin + adipose tissue.
Our study introduces new approaches to study the seated soft tissue of the buttocks and thigh. The US assessment of soft tissue thickness was reproducible in both an unloaded and loaded seated position. The unloaded soft tissue thicknesses measured by US were validated with those of MRI, albeit somewhat underestimated with US. The CVs for total tissue and MTs were 6.6–7.5%, with higher CVs for the SA (∼12 .5%). Loading reduced soft tissue thicknesses of the buttocks, particularly MT thickness. The MRI loader showed the same trends in force deflection responses as reported in prior work by the authors [21]. Lastly, the reduction in tissue thickness with loading was influenced by the total unloaded tissue thickness, but not influenced by fatty infiltration of the gluteus maximus muscle.
The US measures of tissue thickness in the unloaded condition were consistent with the MRI measures for total tissue and MT, although less so for the SA. The US validation with MRI revealed an underestimation of the total tissue thickness measures with US. The bias may be explained by the challenge and inability to completely unload the soft tissue during US assessments while fully capturing the underlying anatomy. The difference in the hip angle was likely a contributing factor as the hips were slightly more flexed during the US, despite efforts to match the angle between modalities. It is also possible the imaging locations were slightly different, despite efforts to match the imaging modalities. The MRI machine had a bore width of just under 50 cm, presenting challenges in positioning for taller subjects with long femurs, thus limiting hip flexion. Overall, US was shown as a valid alternative modality to measure soft tissue thickness, with the advantages of being significantly lower in cost and more accessible for patients. The approach was also successful for the unloaded and loaded seated soft tissue measurements in a male participant with a cervical spinal cord injury. Although this was only one participant, we were able to test the feasibility of the imaging buttocks anatomy in the unloaded and loaded seated position including the use of an innovative chair.
Soft tissue thicknesses were generally comparable to those of prior studies. [32] reported unloaded “seated” total soft tissue thickness up to 5.5 cm, with ∼60–80% reflecting MT. [12] documented a lower total unloaded soft tissue thickness at 3.1 cm. However, it was likely that the tissue was not fully unloaded and the hip angle was at 90°, which is a smaller angle than that in the present study and would be predicted to result in lower tissue thickness. [13] documented up to 4 cm unloaded bulk tissue thickness averaged over 5 cm of the IT for individuals with SCI in an unloaded seated position, with the hip angle roughly at 90°. In their case, the measurements were carried out over a larger portion of the ischiopubic ramus including regions that were more anterior than those in the current study and was carried out in participants with SCI, a population known for muscle atrophy [33], both of which could contribute to overall lower total tissue thickness. The current study showed a total reduction in soft tissue of ∼64% including a 73% MT reduction with upright sitting (US) and 72% MT reduction with 50% body weight load (MRI). Similarly, [34] documented tissue deformation of 74.4% for MT in their control group of able-bodied participants with seated MRI. [20] reported the total tissue was reduced by 56% with MT reduced by 45.5% when comparing loaded vs. unloaded tissue. However, it is worth noting that [20] collected loaded data through a water-filled cushion, which may account for the lower tissue deformation percentages compared to the current study. Sonenblum et al. (2018) also reports tissue reduction of up to 60% in participants with SCI, which is similar to our total tissue changes which ranged from 50% to 64% across the MRI and US loading conditions. In cases where there are differences between this study and previous studies, the differences in the methodologies or participants between the studies have been noted.
Our findings suggest that greater soft tissue thicknesses can be protective by providing more cushion to the pelvis during loading. We expected that greater muscle mass would be protective, in that it would provide support below the IT. Our findings show that MT unloaded tissue was related to how the MT responded to 30% body weight load (MRI data). However, the unloaded MT thickness did not persist in showing correlations with higher loads [50% body weight–MRI data and the seated US data–60–90% of body weight load [35]]. We were also particularly interested in the role of intramuscular fat in soft tissue changes with loading, as prior research shows that individuals with SCI and a history of pressure injuries have six times higher intramuscular fat than those with no history of pressure injury [36]. In the populations that develop pressure injuries, muscle mass can be greatly reduced [37]. Lower limb muscle mass is reduced with age by 25–30% [38,39], in SCI by up to 50% ([33]; Wu and Bogie., 2013 [40]), and is accelerated for older adults with as little as 5 days of bed rest [41]. Aging and SCI are associated with increases in intramuscular fat, altering the muscle composition and thereby reducing muscle quality [36,38,42] and potentially loading responses. In this study, we did not find any relationship between intramuscular fat of the gluteus maximus muscle and the response of the muscle to loading in able-bodied participants. Although we observed a range of muscle fat fractions (10%–25%), it may be that the extent of fat infiltration was not large enough to impact soft tissue loading responses or the range was too small. Further study in populations prone to pressure injury, like those with SCI, may show different outcomes and need to be further investigated. Alternatively, intramuscular fat may not play a major role in soft tissue changes with loading. This may be at least partially explained by the anatomy and attachment points of the gluteus maximus muscle. The gluteus maximus muscle originates from the sacrum and iliac crest superiorly and posteriorly and attaches inferiorly, most prominently, on the lateral thigh iliotibial band with a small attachment point on the gluteal tuberosity of the posterior femur with fibers that are highly oblique. During sitting or loading of the buttocks, the muscle is shifted laterally and posteriorly and is better described as displacing, rather than merely compressing [13]. In fact, some studies have shown very limited muscle coverage during sitting, in particular when sitting on hard surfaces [10]. This may also explain the lack of correlation between MT unloaded and loaded conditions during US seated loading and MRI 50% seated loading. Thus, the contribution of the muscle during seating and loading at the IT is indeed multifaceted.
The MRI loader was successful in achieving loads equivalent to 30% body weight across all subjects and up to 50% of body weight in about half the participants. The 50% load is the approaching loads during a typical sitting posture that have been reported to range from 60–90% of body weight [35]. While we did not achieve 60%–90% body weight load with the MRI loader, the input load was also not applied to the entire seated load-bearing region, which includes the entire buttocks and thighs. Therefore, the 50% load applied to a smaller area used in this study can be compared to typical seating loads. The incremental loading allowed us to evaluate tissue behavior over multiple loads and compare the estimates with prior published data. This occurred by characterizing the tissue response curve using the Ogden material model. Since the Ogden model was a non-linear hyper-elastic model, more than two load response data points were needed to fully characterize the tissues. The tissue stresses are generally aligned with prior data on continuous loading (prior data, μ = 5,095 ± 607 Pa, α = 6.58 ± 0.73) [26]. The stress values were smaller in the current manuscript, which may be partially explained by the differences in the loading surface. The current loading setup included a foam cushion, so both the cushion and tissues are compressed in this study. In previous studies, the loading mechanism had rigid contact surfaces, so there was very little deformation at the indenter surface. This affected the magnitudes of the forces measured by the load cell at a given measure of deflection with the loading apparatus. However, the shape of the stress–stretch response was used as an indicator that the tissue mechanical behavior followed the same trend as previously shown [21]. The tissue response showed an exponential growth, with asymptotic behavior at stretch values, similar to previous studies [21].
The MRI of the seated position has been previously explored with supine and partially flexed knees in standard horizontal bore MRI [37]. Our approach extends this “seated” MRI approach to a position that can accommodate greater flexion at both the hips and knees and allows for loading soft tissue and assessing changes in tissue deformation and displacement. Furthermore, scanner size for clinical MRI has increased to 60 cm bore width for 3T, which allows for easier equipment set-up as well as accommodating larger patients and greater hip flexion across patients. Access to MRI machines with a vertical bore that would allow upright sitting is extremely limited, with nearly all MRI carried out using a horizontal bore. We successfully developed and implemented an MRI approach for seated anatomy, which was compatible with typical MRI equipment.
Although others have used various approaches to image the buttocks with US, our approach is novel in the following ways. First, the unique testing chair allows the individual to sit upright directly on a cushioned seat that has a firm base, allowing the evaluation of the sitting posture with minimal compromise or distortion of the soft tissue. The basic chair design and approach of imaging through a gel disk can be further modified to accommodate various cushion types and different chair pan and back tilts. An important consideration when measuring soft tissue of the pelvis is the posture and foot support as they both influence tissue position and reductions. The chair options included removable arm rests for support (used only for the participant with SCI) and an adjustable footrest and chair height (lowered for the participant with SCI). Additional options for future studies in populations with limited mobility and strength include chest straps and leg straps, particularly for individuals with spasticity as well as an adjustable back support.
The US approach is very comparable to that of MRI for assessing soft tissue thickness and therefore has great potential in quickly and easily obtaining tissue measures that are less costly and easier for patients. Furthermore, US is important in the clinical environment from a cost and accessibility standpoint, making this tool extremely relevant. In addition, US has the advantage of the upright seated imaging being a reasonable option that can be implemented across research laboratories and seating clinics. For both approaches, it is noted that there are inter-subject differences in the pelvis position that are difficult to fully address.
This study had limitations that are addressed here. First, the positioning of subjects in the MRI and the small bore size resulted in scanning distortions of the sacrum and posterior buttocks which can be observed in the MRI images. This is likely the result of gradient non-linearity at the edge of the field of view. Although this portion of the images was distorted, this did not impact the relevant measures of soft tissue inferior to the IT. This was a necessary compromise to attain “seated” hip flexion angles during MRI. We were also unable to study participants with height >178 cm, due to the MRI physical width. These limitations are expected to be less problematic with newer equipment, which also permits increased scanning fields (with increased FOV from 40 cm up to 50 cm and standard bore widths of 60 cm). The loader design also did not allow loads above 40 kg and, therefore, we were unable to achieve higher loads in some heavier participants during MRI scanning. The added value of using MRI is the ability to clearly differentiate soft tissue types including tendon, muscle, and adipose tissue. For US, the limitations include the diminished echo quality at large depths. This lower quality did not preclude distinguishing the muscle fascia to discriminate MT from SA. The limitations also include the low limits of agreement and high CVs observed in US-measured SA thickness compared to MRI. Finally, the loading mechanism in this study had a deformable contact surface that affected the forces measured and stresses used to calculate the mechanical properties of the soft tissue. A study of how using foam affects force measurements would allow for an accurate estimate of how much the foam decreased force measurements in this study. Future studies can also include inter-rater reliability assessments. In addition, future studies could include MRI measured tissue mechanical properties by means of magnetic resonance elastography as recently carried out [43] using “seated” joint angles to properly evaluate in vivo properties of the buttock soft tissues.
In conclusion, we have developed and validated a novel US methodology using MRI as a comparison measure to investigate soft tissue anatomy and deformation during sitting and loading. The ability to obtain such data in the loaded condition is unique and fills an unmet need in understanding loading and pressure injury formation. Our findings show that the unloaded tissue thickness is positively correlated to seated and loaded tissue thickness, suggesting that greater tissue thicknesses provide more soft tissue support during seating and loading. Intramuscular fat did not influence the response of the muscle to loading in able-bodied participants, suggesting that fatty infiltration did not play a role in altering soft tissue support with sitting in this population.
The original contributions presented in the study are included in the article/Supplementary Material. Further inquiries can be directed to the corresponding author.
The studies involving humans were approved by the Institutional Review Board of Michigan State University (IRB 5332). The studies were conducted in accordance with the local legislation and institutional requirements. The participants provided their written informed consent to participate in this study. Written informed consent was obtained from the individual(s) for the publication of any potentially identifiable images or data included in this article.
NM and JMS: designed the study, collected the data, performed the analysis and interpretation of the data, and drafted the manuscript. DS and VI: participated in data collection, analysis, and interpretation. JDS, TB, AS, and JMS: critically revised the manuscript. JDS, JMS, and TB: designed and constructed the MRI loader. All authors contributed to the article and approved the submitted version.
This study was supported by the Michigan State University Alliance for African Partnership, the Michigan State University Department of Radiology and NSF—grant # 2044254 (TB) and University of Pretoria UCDP Teaching Replacement Grant.
The authors thank Andrew Vaniddekinge and Allie Harkenrider, the research assistants in the study, and John Irwin, the MRI technologist. The authors also acknowledge the significant contributions made by the study participants.
The authors declare that the research was conducted in the absence of any commercial or financial relationships that could be construed as a potential conflict of interest.
All claims expressed in this article are solely those of the authors and do not necessarily represent those of their affiliated organizations, or those of the publisher, the editors, and the reviewers. Any product that may be evaluated in this article, or claim that may be made by its manufacturer, is not guaranteed or endorsed by the publisher.
The Supplementary Material for this article can be found online at: https://www.frontiersin.org/articles/10.3389/fphy.2023.1209538/full#supplementary-material
1. Local Coverage Determination (LCD). Wheelchair seating (L15887). United States: Centers for Medicare & Medicaid Services (2013).
2. Stekelenburg A, Oomens CW, Strijkers GJ, Nicolay K, Bader DL. Compression-induced deep tissue injury examined with magnetic resonance imaging and histology. J Appl Physiol (2006) 100:1946–54. doi:10.1152/japplphysiol.00889.2005
3. Gefen A. Tissue changes in patients following spinal cord injury and implications for wheelchair cushions and tissue loading: a literature review. Ostomy Wound Manag (2014) 60:34–45.
4. National Pressure Ulcer Advisory Panel. NPUAP pressure injury stages (2018). Available at: http://www.npuap.org/resources/(Accessed April 14, 2023).
5. Oomens CW, Bressers OF, Bosboom EM, Bouten CV, Blader DL. Can loaded interface characteristics influence strain distributions in muscle adjacent to bony prominences? Comput Methods Biomech Biomed Eng (2003) 6:171–80. doi:10.1080/1025584031000121034
6. Loerakker S, Manders E, Strijkers GJ, Nicolay K, Baaijens FP, Bader DL, et al. The effects of deformation, ischemia, and reperfusion on the development of muscle damage during prolonged loading. J Appl Physiol (2011) 111:1168–77. doi:10.1152/japplphysiol.00389.2011
7. Sprigle S, Sonenblum S. Assessing evidence supporting redistribution of pressure for pressure ulcer prevention: a review. J Rehabil Res Dev (2011) 48:203–13. doi:10.1682/jrrd.2010.05.0102
8. Oomens CW, Bader DL, Loerakker S, Baaijens F. Pressure induced deep tissue injury explained. Ann Biomed Eng (2015) 43:297–305. doi:10.1007/s10439-014-1202-6
9. Makhsous M, Lin F, Cichowski A, Cheng I, Fasanati C, Grant T, et al. Use of MRI images to measure tissue thickness over the ischial tuberosity at different hip flexion. Clin Anat (2011) 24:638–45. doi:10.1002/ca.21119
10. Sonenblum SE, Sprigle SH, McKay Cathcart J, Winder RJ. 3D anatomy and deformation of the seated buttocks. J Tissue Viability (2015) 24:51–61. doi:10.1016/j.jtv.2015.03.003
11. Call E, Hetzel T, McLean C, Burton JN, Oberg C. Off loading wheelchair cushion provides best case reduction in tissue deformation as indicated by MRI. J Tissue Viability (2017) 26:172–9. doi:10.1016/j.jtv.2017.05.002
12. Gabison S, Mathur S, Verrier MC, Nussbaum E, Popovic MR, Gagnon DH. Quantitative ultrasound imaging over the ischial tuberosity: An exploratory study to inform tissue health. J Tissue Viability (2018) 27(3):173–80. doi:10.1016/j.jtv.2018.04.002
13. Sonenblum SE, Ma J, Sprigle SH, Hetzel TR, McKay Cathcart J. Measuring the impact of cushion design on buttocks tissue deformation: An MRI approach. J Tissue Viability (2018) 27:162–72. doi:10.1016/j.jtv.2018.04.001
14. Gabison S, Hayes K, Campbell KE, Swaine JM, Craven BC. Ultrasound imaging of tissue overlying the ischial tuberosity: does patient position matter? J Tissue Viability (2019) 28(4):179–85. doi:10.1016/j.jtv.2019.07.001
15. Sonenblum SE, Seol D, Sprigle SH, McKay Cathcart J. Seated buttocks anatomy and its impact on biomechanical risk. J Tissue Viability (2020) 29:69–75. doi:10.1016/j.jtv.2020.01.004
16. Deng B. Measuring and modeling force-deflection responses of human thighs in seated postures. [Michigan (MI)]: Michigan State University (1994). [dissertation/master’s thesis].
17. Sadler Z, Scott J, Drost J, Chen S, Roccabianca S, Bush TR. Initial estimation of the in vivo material properties of the seated human buttocks and thighs. Int J Non Linear Mech (2018) 107:77–85. doi:10.1016/j.ijnonlinmec.2018.09.007
18. Scott J, Bush TR. Bulk thigh properties in multiple postures. In: 8th World Congress of Biomechanics; July 8-12, 2018; Dublin (2018).
19. Sonenblum S, Sprigle S. Buttock tissue response to loading in men with spinal cord injury. Plos ONE (2018) 13:e0191868. doi:10.1371/journal.pone.0191868
20. Swaine JM, Moe A, Breidahl W, Bader DL, Oomens CWJ, Lester L, et al. Adaptation of a mr imaging protocol into a real-time clinical biometric ultrasound protocol for persons with spinal cord injury at risk for deep tissue injury: A reliability study. J Tissue Viability (2018) 27:32–41. doi:10.1016/j.jtv.2017.07.004
21. Scott J, Chen S, Roccabianca S, Bush TR. The effects of body position on the material properties of soft tissue in the human thigh. J Mech Behav Biomed Mater (2020) 110:103964. doi:10.1016/j.jmbbm.2020.103964
22. Norkin CC, White DJ. Measurement of joint motion: A guide to goniometry 5th ed. Philadelphia, PA: FA, Davis Company (2016).
23. Ding D, Leister E, Cooper RA, Cooper R, Kelleher A, Fitzgerald SG, et al. Usage of tilt-in-space, recline, and elevation seating functions in natural environment of wheelchair users. J Rehabil Res Dev (2008) 45:973–84. doi:10.1682/jrrd.2007.11.0178
24. Goossens RH, Snijders CJ, Holscher TG, Heerens WC, Holman AE. Shear stress measured on beds and wheelchairs. Scand J Rehabil Med (1997) 29:131–6.
25. Bhattacharya S, Mishra RK. Pressure ulcers: Current understanding and newer modalities of treatment. Indian J Plast Surg (2015) 48:004–16. doi:10.4103/0970-0358.155260
26. Scott J, Sheridan B, Andrus R, Monday N, Selby A, Bush TR. Tissue matters: In-vivo tissue properties of persons with spinal cord injuries to inform clinical models for pressure ulcer prevention. J Biomech (2021) 120:110389. doi:10.1016/j.jbiomech.2021.110389
27. Klucinec B. The effectiveness of the aquaflex gel pad in the transmission of acoustic energy. J Athl Train (1996) 31:313–7.
28. Schindelin J, Arganda-Carreras I, Frise E, Kaynig V, Longair M, Pietzsch T, et al. Fiji: an open-source platform for biological-image analysis. Nat Methods (2012) 9:676–82. doi:10.1038/nmeth.2019
29. Reeder SB, McKenzie CA, Pineda AR, Yu H, Shimakawa A, Brau AC, et al. Water-fat separation with IDEAL gradient-echo imaging. J Magn Reason Imaging (2007) 25:644–52. doi:10.1002/jmri.20831
30. Portney LG, Watkins MP. Foundation of clinical research: Applications to practice 3rd ed. Philadelphia, PA: FA, Davis Company (2015).
31. Bland JM, Altman DG. Measuring agreement in method comparison studies. Stat Methods Med Res (1999) 8:135–60. doi:10.1177/096228029900800204
32. Akins JS, Vallely JJ, Karg PE, Kopplin K, Gefen A, Poojary-Mazzotta P, et al. Feasibility of freehand ultrasound to measure anatomical features associated with deep tissue injury risk. Med Eng Phys (2016) 38:839–44. doi:10.1016/j.medengphy.2016.04.026
33. Modlesky CM, Bickel CS, Slade JM, Meyer RA, Cureton KJ, Dudley GA. Assessment of skeletal muscle mass in men with spinal cord injury using dual-energy X-ray absorptiometry and magnetic resonance imaging. J Appl Physiol (2004) 96:561–5. doi:10.1152/japplphysiol.00207.2003
34. Brienza D, Vallely J, Karg P, Atkins J, Gefen A. An MRI investigation of the effects of user anatomy and wheelchair cushion type on tissue deformation. J Tissue Viability (2018) 27:42–53. doi:10.1016/j.jtv.2017.04.001
35. Shen W, Parenteau C, Roychoudhury R, Robbins J. Seated weight distribution of adults and children in normal and non-normal positions. Annu Proc Assoc Adv Automot Med (1999) 43:383–97.
36. Lemmer DP, Alvarado N, Henzel K, Richmond MA, McDaniel J, Graebert J, et al. What lies beneath: why some pressure injuries may be unpreventable for individuals with spinal cord injury. Arch Phys Med Rehabil (2019) 100:1042–9. doi:10.1016/j.apmr.2018.11.006
37. Wu GA, Bogie KM. Not just quantity: gluteus maximus muscle characteristics in able-bodied and SCI individuals–implications for tissue viability. J Tissue Viability (2013) 22:74–82. doi:10.1016/j.jtv.2013.03.003
38. Csapo R, Malis V, Sinha U, Du J, Sinha S. Age-associated differences in triceps surae muscle composition and strength - an MRI-based cross-sectional comparison of contractile, adipose and connective tissue. BMC Musculoskelet Disord (2014) 15:209. doi:10.1186/1471-2474-15-209
39. Hogrel JY, Barnouin Y, Azzabou N, Butler-Browne G, Voit T, Moraux A, et al. NMR imaging estimates of muscle volume and intramuscular fat infiltration in the thigh: variations with muscle, gender, and age. Age (2015) 37:60. doi:10.1007/s11357-015-9798-5
40. Slade JM, Bickel CS, Modlesky CM, Majumdar S, Dudley GA. Trabecular bone is more deteriorated in spinal cord injured versus estrogen-free postmenopausal women. Osteoporos Int (2005) 16:263–72. doi:10.1007/s00198-004-1665-7
41. Tanner RE, Brunker LB, Agergaard J, Barrows KM, Briggs RA, Kwon OS, et al. Age-related differences in lean mass, protein synthesis and skeletal muscle markers of proteolysis after bed rest and exercise rehabilitation. J Physiol (2015) 593:4259–73. doi:10.1113/JP270699
42. Gorgey AS, Dudley GA. Skeletal muscle atrophy and increased intramuscular fat after incomplete spinal cord injury. Spinal Cord (2007) 45:304–9. doi:10.1038/sj.sc.3101968
Keywords: pressure injuries, seated anatomy, spinal cord injury, ischial tuberosity, loaded IT, unloaded IT, ultrasound imaging
Citation: Mogale N, Scott JD, Schanz D, Ilyasov V, Bush TR, van Schoor A-N and Slade JM (2023) A novel approach for quantitative imaging of the seated anatomy of the buttocks using ultrasound and MRI. Front. Phys. 11:1209538. doi: 10.3389/fphy.2023.1209538
Received: 31 May 2023; Accepted: 04 September 2023;
Published: 18 September 2023.
Edited by:
Martin Krššák, Medical University of Vienna, AustriaReviewed by:
Roberta Frass-Kriegl, Medical University of Vienna, AustriaCopyright © 2023 Mogale, Scott, Schanz, Ilyasov, Bush, van Schoor and Slade. This is an open-access article distributed under the terms of the Creative Commons Attribution License (CC BY). The use, distribution or reproduction in other forums is permitted, provided the original author(s) and the copyright owner(s) are credited and that the original publication in this journal is cited, in accordance with accepted academic practice. No use, distribution or reproduction is permitted which does not comply with these terms.
*Correspondence: Nkhensani Mogale, Nkhensani.mogale@up.ac.za, nkhensani1909@gmail.com
†ORCID: Nkhensani Mogale, orcid.org/0000-0002-4499-6626; Jill M. Slade, orcid.org/0000-0003-3762-5795; Albert van Schoor, orcid.org/0000-0001-9813-0441; Tamara R. Bush, orcid.org/0000-0002-2757-0463; Justin D. Scott, orcid.org/0000-0001-6525-6283
Disclaimer: All claims expressed in this article are solely those of the authors and do not necessarily represent those of their affiliated organizations, or those of the publisher, the editors and the reviewers. Any product that may be evaluated in this article or claim that may be made by its manufacturer is not guaranteed or endorsed by the publisher.
Research integrity at Frontiers
Learn more about the work of our research integrity team to safeguard the quality of each article we publish.