
95% of researchers rate our articles as excellent or good
Learn more about the work of our research integrity team to safeguard the quality of each article we publish.
Find out more
ORIGINAL RESEARCH article
Front. Phys. , 12 April 2023
Sec. Optics and Photonics
Volume 11 - 2023 | https://doi.org/10.3389/fphy.2023.1177371
This article is part of the Research Topic Advanced High Power Solid-State Laser Technology View all 9 articles
 Yi An1,2,3Xiao Chen1,2,3Yankun Ren1,2,3Hanshuo Wu1,2,3Liangjin Huang1,2,3*Zhiyong Pan1,2,3*Zongfu Jiang1,2,3Pu Zhou1
Central refractive index dip is a common phenomenon in the fibers fabricated by the modified chemical vapor deposition (MCVD) technology, which is the main fabrication technique for high-power laser fibers. In this paper, we present a numerical analysis of the dip effect on high-power-related parameters for the first time, to the best of our knowledge. Three aspects including mode field parameter, beam quality, and bending performance are studied under different dip parameters and bending radii. It is found that the dip is possible to increase the effective mode area and the bending loss, which offers a flexible way to suppress the non-linear effects and filter the higher-order modes by optimizing the dip parameters. Besides, different from the mode area and bending loss, beam quality exhibits an interesting trend when the dip radius increases. The results could facilitate a comprehensive understanding of the dip fiber properties, which also offer guidance to evaluate and design the fiber with central refractive index dip for high-power applications.
Light can be guided in optical fibers through the total reflection principle, which is related to the refractive index (RI) difference between the core and cladding of the fiber [1]. Since the profile of RI directly determines how the fiber guides light, it plays a major role in fiber design and fabrication. The simplest RI profile can be found in the common Step-index fiber (SIF), whose core and cladding have constant RI respectively [2]. This kind of fiber has been widely used in optical communication [3], sensing [4], as well as high-power lasers [5–15]. On the other hand, more complex RI profiles such as parabolic [16], pedestal [17], W-type [18], M-type [19, 20], single trench [21], modified single trench [22], multi trench [23], Bragg [24], chirally-coupled core [25], and photonic crystal fibers [26] have also been developed for different applications.
To fabricate fibers with different RI profiles, the MCVD technique [27] is adopted in most cases. One potential problem usually during the fabrication process is the volatilization of the dopant (e.g., Ge or P) from the innermost layers during the collapsing stage, which will result in the RI dip at the center of the fiber cores. This dip has been observed not only in the passive fibers for low-power applications [28–31] but also in the active fibers for high-power applications [32–35]. To mitigate this phenomenon, some approaches such as etching the innermost layers [36], modifying the doping concentration [37], and controlling the temperature [38] have been proposed and verified in recent years. Although the phenomenon can be alleviated, it can hardly be eliminated, which makes a detailed analysis of how the dip affects the fiber performances extremely necessary.
Actually, the effect of the central RI dip on fiber properties has been studied since the late 1970s [39, 40]. We call the fiber with central RI dip “central dip fiber (CDF)” to distinguish it from the standard SIF. In the past few decades, various analytical and numerical methods have been proposed to investigate CDFs, such as series expansion analysis [39], perturbation approximation theory [40], WKB simulation technique [41], hypergeometric function transformation [42], power-law profiles model [43], and multiple-beam Fizeau fringe approach [44]. Correspondingly, the mode cut-off frequencies, group velocities, and chromatic dispersion of CDFs are studied detailedly through these methods [39–44]. The results of these studies can guide fiber applications such as flat-top beam generation and Raman gain modulation. Recently, Qiang Qiu et al. [45] carried out a numerical analysis and found that CDFs with confine-doped structure have better noise performance than common SIFs in erbium-doped fiber amplifiers [45].
Although the above reports have investigated CDFs from various aspects, a systematic analysis of the behavior of CDFs aiming at high-power fiber applications has been lacking to date. It is known that one of the main factors limiting the power-scaling of high-power fiber lasers is the non-linear effects, which will transfer laser energy to unwanted wavelength. To avoid the detrimental non-linear effects, a straightforward choice is to increase the core diameter of fiber to enlarge the mode area of fundamental mode (FM). However, the increased core diameter leads to multimode operation [6]. The emerging higher-order mode (HOM) may result in the decrease of the transverse mode instability (TMI) threshold [46–54]. TMI is a phenomenon that the quality and stability of the beam emitted by the fiber laser system are suddenly reduced once that a certain power (i.e., threshold) has been reached. Therefore, TMI is another dominant factor limiting the power scaling of high-power fiber lasers. Therefore, the detailed analysis on the mode area of FM and the suppression of HOM in CDFs is important for high-power applications, which is absent in the previous work. Besides, the relationship between the dip parameter and the beam quality also remains unanswered at present.
In this paper, the influence of the dip parameters on the high-power-related properties of CDF is comprehensively studied for the first time. The mode field parameter, beam quality factor, and bending loss are evaluated under different dip radii and depths. The calculated results will help reveal the relationships between the dip parameter and mode area of FM, beam quality, or the suppression of HOM, respectively, thus providing guidance for high-power applications. Furthermore, the fiber with a central raised RI profile is also briefly discussed in the final part of this paper.
The RI profile of SIF and CDF is illustrated in Figures 1A, B, respectively. The core of these two kinds of fibers is supposed to be doped with rare-earth ions. Gambling et al. have proposed a general RI distribution model for CDFs with different RI expression formulas in the dip regions [38]. In this work, we suppose the RI of CDF varies linearly in the central dip region. To fit this variation, two dip parameters including the dip radius denoted by rd and dip depth denoted by Dn are defined respectively, as shown in Figure 1B.
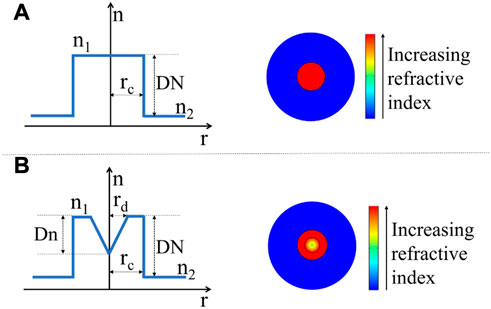
FIGURE 1. Illustration of RI profile of (A) SIF and (B) CDF. The radius of the core and dip region is rc and rd respectively. DN is the RI difference between the core (n1) and the cladding (n2) while Dn is the maximum RI difference in the dip region.
Then the RI profile of CDF can be mathematically expressed as
where DN is the maximum RI difference between cladding and core, n2 is the RI of cladding, and rc is the radius of core. The RI profile displayed in Eq. 1 is consistent with the linear-variation case of Gambling’s general dip model [39]. This simple model can simulate the different dip profiles by only changing the dip radius and dip depth, so it is effective to explore the relationship between the fiber properties and dip distributions.
As introduced, for high-power fiber applications, three concerning aspects including mode field parameter, beam quality, and bending-induced effects are of great importance.
When evaluating the mode field distribution of CDFs, two parameters of mode field are often considered. The first one is the mode field area (MFA), which is related to the overall distribution of the field and it can be expressed as
where rclad is the radius of fiber cladding, while E is the field of the FM or the HOM calculated by the full-vector finite element method (FEM) [21–23]. The HOM investigated in this paper refers to the LP11 mode since it normally has the lowest bending loss among all HOMs [55] and it is the main filtering target to get single-mode output while the FM refers to the LP01 mode. Generally, a larger MFA can provide better suppression of some non-linearities such as stimulated Raman scattering (SRS) and stimulated Brillouin scattering (SBS), which is beneficial to enhancing the threshold of these non-linearities in high-power fiber lasers and amplifiers [6]. Another parameter is the power filling factor (PFF) which can be calculated as
where rdoped denotes the radius of the doped area. The PFF indicates whether the mode can extract enough gain or not in the small-signal regime. That is, a larger value of PFF corresponds to a stronger gain of the target mode when the modes do not experience saturation. Therefore, a small PFF of HOM might be helpful to suppress the gain of HOM in fibers. It should be noted that besides the PFF, the gain of the mode is also related to the doping profiles. For example, the doping level is relatively small in the dip region of CDF, which might influence the gain of the FM.
In addition to the above two mode field parameters, the beam quality factor M2 [56–61] is also important for CDF since it indicates the beam propagation property. Generally, the value of M2 factor is 1 for ideal fundamental Gaussian beams while more than 1 for any other practical beams. In high-power fiber lasers and amplifiers, the output M2 of the fundamental beam profile is expected to be as small as possible. In this paper, for the first time, the M2 factor of CDF is calculated under different dip parameters.
Bending-induced effect of CDF was also ignored in the previous works [39–45]. However, it is essential for high-power applications since the fibers are usually coiled on the water-cooling plate to ensure compact size and suppress HOM in the experiments. Due to the curvature of CDF, both the mode field distortion and the mode loss should be considered. To analyze the bent fiber, the RI profile can be described by the conformal mapping technique [21].
where n(r) is the RI profile of the straight fiber, R is the bending radius and ρ is the correction factor of the elastic-optic effect. Here ρ is fixed to 1.25, as suggested by previous reports [21, 22]. The bending loss of the modes can be calculated based on the propagation constant ß provided by FEM modeling [22].
In the following parts, the numerical results of the above-mentioned three aspects will be displayed and discussed concretely. Noticed that the Yb-doped fibers [33–36, 62, 63] with core diameter of 20 μm or 30 μm have been widely adopted in high power applications, so the CDF is supposed to work at 1,064 nm wavelength and rc is set as 10 μm or 15 μm in this work. Besides, Yb-doped fibers [33–36, 62, 63] usually adopt pure silica as the cladding and the typical numerical aperture (NA) of core is 0.06, so n2 and DN are set to 1.45 and 0.0012 respectively. The discussion will concentrate on the high-power-related properties of the fiber itself, rather than the fiber laser system. That is, the concrete value of the TMI threshold and SRS threshold of the CDF-based laser system will not be calculated, but the related fiber properties will be detailly analyzed and the results can indicate the impact of the dip parameters on high-power applications.
Two mode field parameters, i.e., the MFA and PFF, are calculated based on Eqs 2, 3 in the dip-radius-fixed or the dip-depth-fixed case respectively. For the first case, rd is set to 5 μm, which occupies 50% of rc. As illustrated in Figure 2A, the MFA of both FM and HOM tend to increase gradually when Dn increases. Concretely, when Dn increases from 0.0001 to 0.0011, the MFA of FM increases by 23% while the MFA of HOM increases by 3%. Different from the MFA, PFF of FM and HOM depicted in Figure 2B decreases by 4% and 2% respectively when Dn is raised.
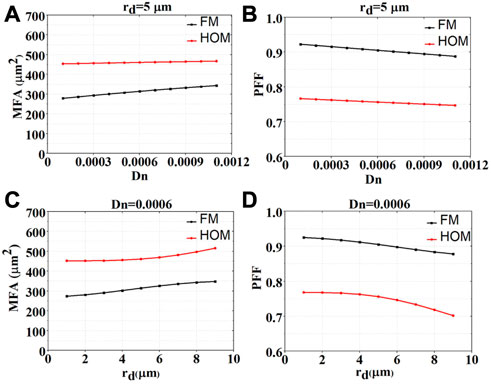
FIGURE 2. The relation between the mode field parameter and the dip parameter. (A) MFA as a function of dip depth; (B) PFF as a function of dip depth; (C) MFA as a function of dip radius; (D) PFF as a function of dip radius.
Then Dn is set as 0.0006, which is also 50% of DN. When rd increases, as shown in Figures 2C, D, the MFA exhibits an upward tendency while the PFF shows a downward tendency, which is similar to the dip-radius-fixed case. In this case, when rd increases from 1 μm to 9 μm, the MFA of FM and HOM increases by 27% and 14% while the PFF of FM and HOM decreases by 5% and 9%, respectively.
Further investigations of MFA and PFF are carried out for simultaneous varieties of Dn and rd, and the results are illustrated in Figures 3A–D. It can be seen that the general trend is that as the dip parameter increases, the MFA of both the FM and the HOM increases, while the corresponding PFF decreases. As shown in Figure 3A, the MFA of FM is below 280 μm2 without RI dip (Dn = 0). However, it can exceed 420 μm2 by expanding the dip, which is beneficial for suppressing non-linear effects. On the other hand, as shown in Figure 3D, the PFF of HOM can be reduced from near 0.78 to near 0.64, which might help reduce the gain of the HOM in small signal regime.
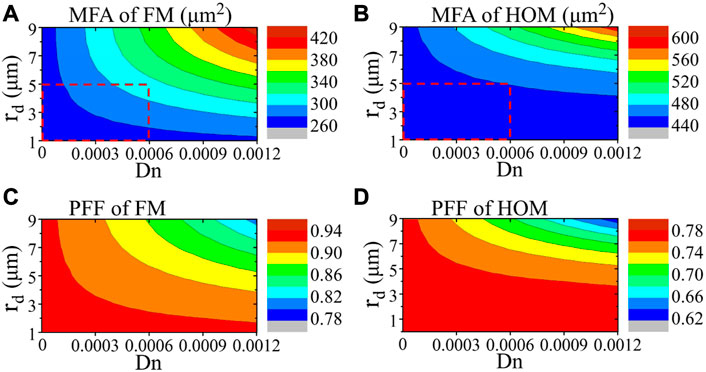
FIGURE 3. The MFA of (A) FM and (B) HOM under different dip depths and radii; and the PFF of (C) FM and (D) HOM under different dip depths and radii.
Another phenomenon that can be found in Figure 3 is that the small dip has a relatively slighter effect on HOM when compared to FM. Taking the MFA in the dashed rectangle region shown in Figure 3A and Figure 3B as an example, it can be noticed that the MFA of FM varies from 260 μm2 to 320 μm2 while the MFA of HOM varies from 440 μm2 to 460 μm2. The little effect of the small-dip on the mode field parameter of HOM might be attributed to the field distribution of HOM, which is relatively far away from the center of fiber when compared to FM.
When we increase rc to 15 μm, the MFA of FM and the PFF of HOM under different dip depths and radii exhibits a similar variation trend to Figure 3. In this case, when the dip is expanded, the MFA of FM will increase from 490 μm2 to 820 μm2 while the PFF of HOM will decrease from 0.93 to 0.84. Therefore, dip can also help suppress the non-linear effects and reduce the gain of the HOM for the fiber with a core diameter of 30 μm.
Above results show that a dip will increase the MFA of FM, which will be helpful to suppress the non-linear effects. Besides, small dip has little effect on HOM, and it will mainly influence the properties of FM.
To evaluate the influence of central dip on the output beam quality, we further calculate the M2 factor of FM based on the second moment of the simulated beam intensity profile at different locations using the free-space transfer function [59, 64]. The theoretical M2 as a function of Dn is shown in Figure 4A, where rd is set as 5 μm. It is clear that M2 increases gradually from 1.04 to 1.11 with the increase of Dn, which is probably determined by the mode field distribution variation. As shown in the insets of Figure 4A, the two-dimensional (2D) field distribution transforms from Gaussian to annular shape for larger Dn. To see the evolution tendency clearly, one-dimensional (1D) field profiles and their magnified details for different Dn are depicted in Figures 4B, C respectively. It is evident that the field distribution spreads outward from the Gaussian shape, and the center intensity becomes weaker. During the transition from the Gaussian to Annular distribution, an interesting flat-field intensity profile can be observed in Figure 4C when Dn equals to 0.0005. This indicates that CDF can be probably utilized to generate flat-top beams.
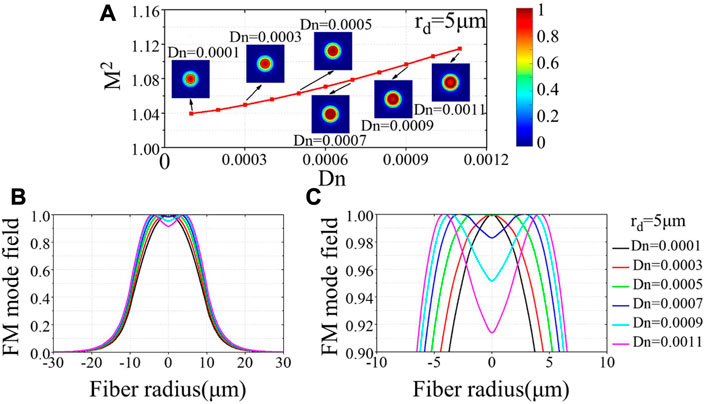
FIGURE 4. (A) Theoretical calculated beam quality M2 under different dip depths. Insets show the 2D field intensity distribution. (B) Evolution of field distribution under different dip depths. (C) Magnified field distribution in fiber core under different dip depths.
Figure 5 shows M2 of the CDF when rd varies from 1 μm to 9 μm. In this case, Dn is fixed as 0.0006, which occupies 50% of DN, and M2 exhibits a different variation compared to the former results. From Figure 5A, we can find that M2 increases when rd increases from 1 to 7 μm and then decreases with the further growth of rd. This interesting phenomenon might also be related to the mode field distribution evolution. As can be seen in Figures 5B, C, when rd increases from 1 μm to 5 μm, the mode field distribution gradually spreads outward from the Gaussian. However, when rd further increases, no obvious field expansion is observed, and the field tends to shrink, which can be seen from the 1D distribution of the blue and cyan lines in Figure 5C. The possible reason for this phenomenon is that as rd increases, the slope of the dip calculated by Dn/rd gradually becomes smaller. Imagine that when rd is infinite, the dip slope tends to be close to 0, and then the CDF will become a SIF with lower NA, whose mode field will be close to the Gaussian distribution again. Therefore, in the process of increasing rd, it is reasonable for the mode field to first deviate from the Gaussian distribution and then approach the Gaussian distribution. As a result, M2 will first rise and then drop when rd increases.
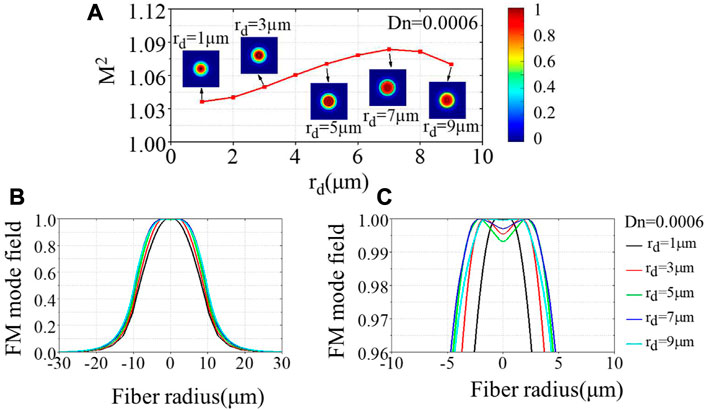
FIGURE 5. (A) Theoretical calculated beam quality M2 under different dip radii. Insets show the 2D field intensity distribution. (B) Evolution of field distribution under different dip radii. (C) Magnified field distribution in fiber core under different dip radii.
To further examine the evolution of M2 with different dip radii and depths, we calculated M2 when Dn varies from 0 to 0.0012 while rd varies from 1 μm to 9 μm, and the result is shown in Figure 6A. The trends are consistent with the previous analysis, and it can be seen that as the dip depth increases, M2 shows an increasing trend, while with the increase of the dip radius, M2 shows a trend of increasing first and then decreasing. This phenomenon is not restricted to the case where rc equals to 10 μm. When we increase rc to 15 μm, a similar variation of M2 can be seen, as illustrated in Figure 6B.
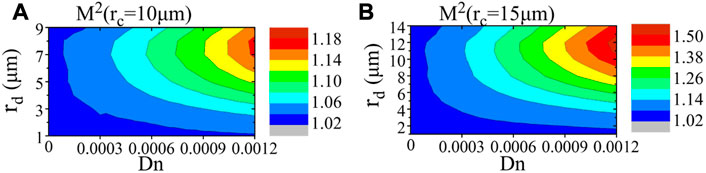
FIGURE 6. Theoretical calculated beam quality M2 under different dip radii and depths for fibers with a core radius of (A) 10 μm; (B) 15 μm.
Besides the variation trend, the absolute value of M2 is also an important factor that needs to be considered. As shown in Figure 6A, the largest M2 reaches about 1.18 when the fiber has a core diameter of 20 μm. However, when the fiber has a core diameter of 30 μm, the largest M2 exceeds 1.5, as shown in Figure 6B. Of course, the worst beam quality only appears in extremely large dip, which is hardly seen in practical case.
It should also be pointed out that the M2 obtained in this section is the optimal value of the theoretical results for the investigated dip parameters since only the FM is considered. In practical experiments, the content of HOM and the relative phase between HOM and FM will lead to M2 deterioration. To suppress the HOM, bending is usually adopted, the next part will investigate how bending influence the performance of CDFs.
Active fibers are often coiled in a water-cooling plate for compact configuration and HOM suppression in high-power fiber lasers and amplifiers. This behavior will result in two kinds of impact including bending-induced distortion and bending loss.
When fiber is coiled to suppress HOMs, the mode profile of FM will also be distorted. Figure 7 shows the 2D mode profile of FM in a CDF with Dn = 0.0006 and rd = 5 μm at different bending radii. Besides, the corresponding value of MFA and PFF are also illustrated by the red line and blue line respectively. It can be seen that the MFA will decrease from 310 μm2 to 289 μm2 while the PFF will decrease from 0.903 to 0.882 when R is reduced from 15 cm to 5 cm, indicating that bending distortion is more severe for small bending radii.
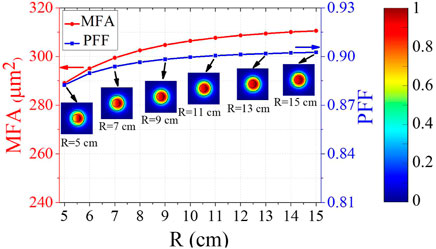
FIGURE 7. MFA (red line) and PFF (blue line) as a function of bending radius. Insets show mode field distribution under different bending radii.
To statistically analyze the bending-induced distortion, both the standard deviation and the average of the mode field parameter at bending radius ranging from 5 cm to 15 cm are calculated. We divide the standard deviation by the average and define the corresponding quotient as the distortion factor (DF), as expressed in Eq. 6
where xi is the MFA or the PFF at different bending radii and‾x is the averaged value for these two mode field parameters.
When the dip radius is fixed as 5 μm, the DF of the MFA and the PFF in different Dn cases are shown in Table 1. It can be noted that the DF has the smallest value when Dn = 0, which is also the calculated result of common SIF. As Dn increases, the DF of the MFA increases from 0.85% to 3.6% while the PFF increases from 0.45% to 0.95%, showing larger bending-induced distortion.
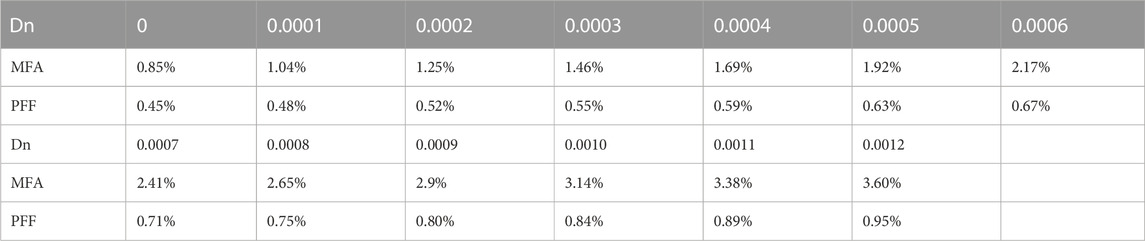
TABLE 1. DF under different dip depths.
Table 2 shows the calculated DF as a function of rd when Dn = 0.0006. Similarly, the DF of the PFF increases from 0.46% to 1.49% when rd increases from 1 μm to 9 μm. However, the DF of the MFA increases first from 0.93% to 2.61% and then decreases to 2.08% with the increase of rd. The corresponding DF is the largest at rd = 7 μm, showing a similar trend to M2. The possible reason might be consistent with that for the variation of M2. That is, the mode field has undergone a process of deviating firstly from the Gaussian distribution and then varying towards the Gaussian distribution.
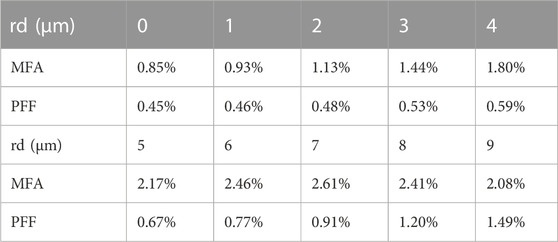
TABLE 2. DF under different dip depths.
When we increase rc to 15 μm, the DF under different dip depths and radii exhibits a similar variation trend to Tables 1, 2. However, in this case, fiber will show heavier bending-induced distortion due to a larger core size. Taking the DF of MFA as an example, it will increase from 7.01% to 13.6% with the increase of Dn when rd is set to 50% of rc. Moreover, when Dn is set to 50% of DN, the DF of MFA rises first from 5.97% to 13.2% and then drops to 12.9% with the increase of rd. The value of dip radius corresponding to the largest DF of MFA is 12 μm. Therefore, CDF with a core diameter of 30 μm will suffer more severe bending distortions.
In general, the bending loss of HOM in high-power fiber lasers is expected to be large enough to achieve effective single-mode (ESM) output. A criterion of loss that the FM lower than 0.1 dB/m and HOM larger than 10 dB/m is generally considered as an ESM condition as proposed in [65]; Figure 8 shows the bending loss of FM and HOM as a function of Dn and rd when the bending radius R is fixed as 5 cm, 7.5 cm, and 10 cm, respectively. Here the HOM refers to the least lossy HOM [21], which has the smallest bending loss among all HOMs. A general trend can be found that the loss of both the FM and HOM will increase by increasing the dip parameters and decrease by increasing the bending radius. As a result, small dip parameters can meet the ESM condition at a small bending radius while large dip parameters satisfy the ESM condition at a large bending radius. When R equals to 5 cm, as shown in Figure 8A, the bending loss of FM is smaller than 0.1 dB/m for relatively small dip parameters (e.g., Dn < 0.0005 and rd<4 μm) and will increase to as large as over 5 dB/m for greater dip parameters (e.g., Dn > 0.0008 and rd>7 μm). Meanwhile, the bending loss of HOM shown in Figure 8B is larger than 100 dB/m for all dip parameters. In this case, both the common SIF and the CDF with relatively small dip parameters can satisfy the ESM condition but their MFA and PFF of FM are the smallest due to the relatively severe bending distortion at a small bending radius. To balance the ESM condition and the mode field distortion, R can be enlarged to 7.5 cm. Although common SIF cannot provide an ESM condition at this bending radius, CDF can adjust the loss of FM and HOM by changing the depth and radius of the dip, which brings more flexibility to control the modal content. As shown in Figures 8C, D, the bending loss of FM is smaller than 0.1 dB/m for most of the dip parameters and the bending loss of HOM is larger than 10 dB/m in relatively larger dip parameters. Concretely, CDF with some special dip parameters such as Dn = 0.0006–0.0007 and rd = 7–8 μm can satisfy the ESM condition. When R further increases to 10 cm, as shown in Figures 8E, F, FM loss is smaller than 0.1 dB/m in all dip parameters while the HOM loss is larger than 10 dB/m only for extremely large dip parameters (e.g., Dn > 0.0010 and rd>9 μm). Although these extremely large dip parameters can also satisfy the ESM condition, the corresponding M2 and the DF are larger than that of the smaller dip parameters. Therefore, a CDF with Dn = 0.0006–0.0007 and rd = 7–8 μm that coiled at 7.5 cm might be proper for balancing the mode field distortion, ESM condition, and beam quality.
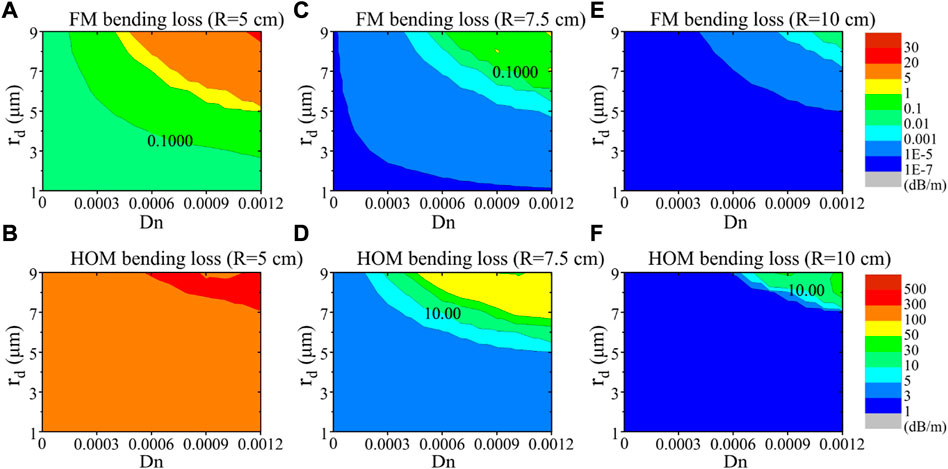
FIGURE 8. Bending loss under different bending radii. (A) FM loss and (B) HOM loss when R = 5 cm; (C) FM loss and (D) HOM loss when R = 7.5 cm; (E) FM loss and (F) HOM loss when R = 10 cm.
It should be pointed out that the CDF cannot satisfy the ESM condition when rc is enhanced to 15 μm, which is attributed to the relatively small HOM loss. Taking the case when R equals to 5 cm as an example, HOM loss is larger than 10 dB/m only for those extremely large dip parameters (e.g., Dn > 0.0010 and rd>13 μm), but the corresponding FM loss is larger than 2 dB/m.
Above results show that CDF with a core diameter of 20 μm can achieve strong HOM suppression by optimizing the dip parameters. However, CDF with a core diameter of 30 μm seems hard to effectively suppress HOM through dip optimization.
Besides the common RI dip phenomenon, a raised RI profile in the center of fiber cores sometimes will also be observed in experiment [35]. We call this kind of fiber as central raised fiber (CRF). Due to the opposite RI profile, the CRF might have the contrary performance compared to the CDF. The typical RI profiles of the CDF and CRF are depicted in Figures 9A, B respectively.
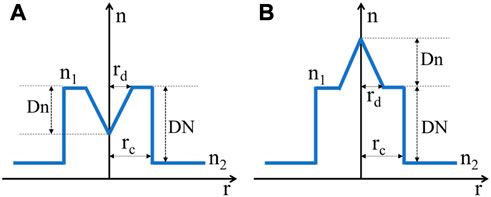
FIGURE 9. Schematics of the RI profile of (A) CDF and (B) CRF.
Here we consider a typical case that rd occupies 50% of rc while Dn equals to 50% of DN for both fibers. We set rc as 10 μm and 15 μm respectively, then the mode field parameter, beam quality factor, and bending-induced performance for CDF, SIF, and CRF are evaluated respectively and compared in Table 3. To evaluate the bend performance, DF is calculated with R ranging from 5 cm to 15 cm while bending loss is calculated with R of 5 cm. We can find from Table 3 that the raised RI profile can reduce the MFA of the FM obviously and enhance the PFF of HOM slightly. Furthermore, the bending loss of HOM will decrease in CRFs. As a result, it is more difficult for CRFs to suppress non-linearities and filter HOMs when compared to CDFs or even common SIFs. However, on the other hand, CRFs can achieve better beam quality with smaller M2 factor, and exhibit stronger bending-resistant ability with smaller DF for both MFA and PFF.
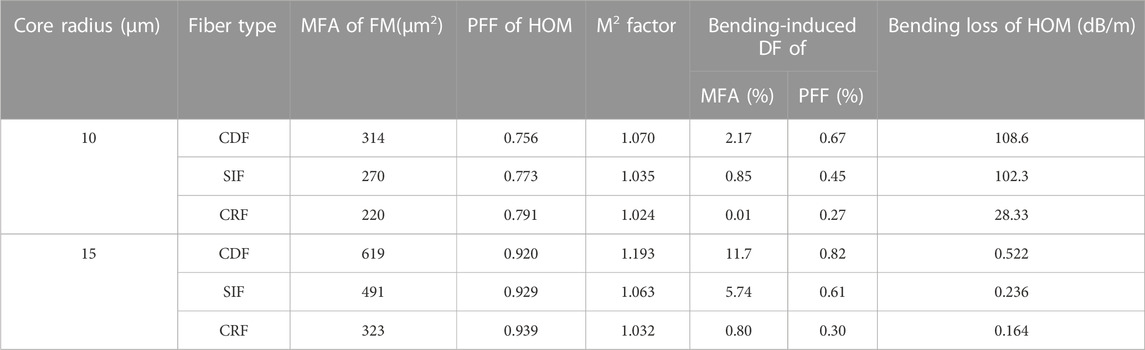
TABLE 3. Calculated results for three kinds of fibers.
Three aspects, i.e., mode field parameters, beam quality, and bending performances, which are concerned in high-power applications are investigated in CDFs. Numerical simulations demonstrate that the effective mode area of FM and bending loss of HOM in CDFs are larger than those in common SIFs, which is beneficial to suppressing the non-linearities and filtering the HOM simultaneously. The results show that the dip of the fiber is not always destructive for power scaling, and might even help high-power application, which depends on the parameters of the dip. If the dip parameter is kept in a certain range, the complex approaches to eliminate the dip can be skipped, which will simplify the laser fiber fabrication. Besides, proper dip parameters and bending radius can balance the mode field parameter, beam quality, bend distortion and ESM condition, which brings more flexibility to designing CDFs for high-power applications.
The original contributions presented in the study are included in the article/supplementary material, further inquiries can be directed to the corresponding authors.
Original draft preparation, YA; Review and editing, XC, YR, HW, LH, ZP, ZJ, and PZ. All authors read and approved the final manuscript.
National Key R&D Program of China (2022YFB3606000).
The authors declare that the research was conducted in the absence of any commercial or financial relationships that could be construed as a potential conflict of interest.
All claims expressed in this article are solely those of the authors and do not necessarily represent those of their affiliated organizations, or those of the publisher, the editors and the reviewers. Any product that may be evaluated in this article, or claim that may be made by its manufacturer, is not guaranteed or endorsed by the publisher.
1. Van Heel ACS. A new method of transporting optical images without aberrations. Nature (1954) 173(4392):39. doi:10.1038/173039a0
2. Kao KC, Hockham GA. Dielectric fiber surface waveguides for optical frequencies [J]. Proc Inst Electr Eng (1966) 113(7):1151–8.
3. Atef M, Swoboda R, Zimmermann H. 1.25 Gbit/s over 50 m step-index plastic optical fiber using a fully integrated optical receiver with an integrated equalizer. J Lightwave Tech (2012) 30(1):118–22. doi:10.1109/jlt.2011.2179520
4. Lu P, Lalam N, Badar M, Liu B, Chorpening BT, Buric MP, et al. Distributed optical fiber sensing: Review and perspective. Appl Phys Rev (2019) 6(4):041302. doi:10.1063/1.5113955
5. Nilsson J, Payne DN. High-power fiber lasers. Science (2011) 332(6032):921–2. doi:10.1126/science.1194863
6. Zervas MN, Codemard CA. High power fiber lasers: A review. IEEE J Selected Top Quan Elect (2014) 20(5):219–41. doi:10.1109/jstqe.2014.2321279
7. Jeong Y, Sahu JK, Payne DN, Nilsson J. Ytterbium-doped large-core fiber laser with 1.36 kW continuous-wave output power. Opt Express (2004) 12(25):6088–92. doi:10.1364/opex.12.006088
8. Beier F, Hupel C, Kuhn S, Hein S, Nold J, Proske F, et al. Single mode 43 kW output power from a diode-pumped Yb-doped fiber amplifier. Opt Express (2017) 25(13):14892–9. doi:10.1364/oe.25.014892
9. Fang Q, Li J, Shi W, Qin Y, Xu Y, Meng X, et al. 5 kW near-diffraction-limited and 8 kW high-brightness monolithic continuous wave fiber lasers directly pumped by laser diodes. IEEE Photon J (2017) 9(5):1–7. doi:10.1109/jphot.2017.2744803
10. Wu H, Li R, Xiao H, Huang L, Yang H, Leng J, et al. First demonstration of a bidirectional tandem-pumped high-brightness 8 kW level confined-doped fiber amplifier. J Lightwave Tech (2022) 40(16):5673–81. doi:10.1109/jlt.2022.3183381
11. Zhang L, Cui S, Liu C, Zhou J, Feng Y. 170 W, single-frequency, single-mode, linearly-polarized, Yb-doped all-fiber amplifier. Opt Express (2013) 21(5):5456–62. doi:10.1364/oe.21.005456
12. Flores A, Robin C, Lanari A, Dajani I. Pseudo-random binary sequence phase modulation for narrow linewidth, kilowatt, monolithic fiber amplifiers. OPTICS EXPRESS (2014) 22(15):17735–44. doi:10.1364/oe.22.017735
13. Yu CX, Shatrovoy O, Fan TY, Taunay TF. Diode-pumped narrow linewidth multi-kilowatt metalized Yb fiber amplifier. Opt Lett (2016) 41(22):5202–5. doi:10.1364/ol.41.005202
14. You Y, Bai G, Zou X, Li X, Su M, Wang H, et al. A 1.4-kW mode-controllable fiber laser system. J Lightwave Tech (2021) 39(8):2536–41. doi:10.1109/jlt.2021.3049603
15. Lim K-J, Kai-Wen Seah S, Yong’En Ye J, Lim WW, Seah CP, Tan YB, et al. High absorption large-mode area step-index fiber for tandem-pumped high-brightness high-power lasers. Photon Res (2020) 8(10):1599–604. doi:10.1364/prj.400755
16. Feit MD, Fleck JA. Light propagation in graded-index optical fibers. Appl Opt (1978) 17(24):3990–8. doi:10.1364/ao.17.003990
17. Yoo S, Webb AS, Boyland AJ, Standish R, Dhar A, Sahu J. Linearly polarized ytterbium-doped fiber laser in a pedestal design with aluminosilicate inner cladding. Laser Phys Lett (2011) 8(6):453–7. doi:10.1002/lapl.201110018
18. Kawakami S, Nishida S. Perturbation theory of a doubly clad optical fiber with a low-index inner cladding. IEEE J Quan Elect (1975) 11(4):130–8. doi:10.1109/jqe.1975.1068578
19. Hautakorpi M, Kaivola M. Modal analysis of M-type-dielectric-profile optical fibers in the weakly guiding approximation. J Opt Soc America A (2005) 22(6):1163–9. doi:10.1364/josaa.22.001163
20. Jain D, George MA, Harris B, Fleming S. Approximate modal cut-off wavelengths and the V-parameter for M-type optical fibers and its novel applications. J Lightwave Tech (2021) 39(13):4478–88. doi:10.1109/jlt.2021.3072504
21. Jain D, Jung Y, Nunez-Velazquez M, Sahu JK. Extending single mode performance of all-solid large-mode-area single trench fiber. Opt Express (2014) 22(25):31078–91. doi:10.1364/oe.22.031078
22. Huang L, Yao T, Yang B. Modified single trench fiber with effective single-mode operation for high-power application [J]. IEEE J Selected Top Quan Elect (2018) 24(3):0901409.
23. Jain D, Baskiotis C, Sahu JK. Mode area scaling with multi-trench rod-type fibers. Opt Express (2013) 21(2):1448–55. doi:10.1364/oe.21.001448
24. Yeh P, Yariv A, Marom E. Theory of Bragg fiber*. J Opt Soc America (1978) 68(9):1196–201. doi:10.1364/josa.68.001196
25. Yuan M, Sui Y, Bai Z, Fan Z. Recent advances in chirally-coupled core fibers [J]. Front Phys (2022) 10:950492. doi:10.3389/fphy.2022.950492
26. Birks TA, Knight JC, Russell PSJ. Endlessly single-mode photonic crystal fiber. Opt Lett (1997) 22(13):961–3. doi:10.1364/ol.22.000961
27. Nagel S, MacChesney J, Walker K. An overview of the modified chemical vapor deposition (MCVD) process and performance. IEEE J Quan Elect (1982) 18(4):459–76. doi:10.1109/jqe.1982.1071596
28. Bubnov MM, Semjonov SL, Likhachev ME, Dianov E, Khopin V, Salganskii M, et al. On the origin of excess loss in highly GeO2-doped single-mode MCVD fibers [J]. IEEE Photon Tech Lett (2004) 16(8):1870–2. doi:10.1109/lpt.2004.829756
29. Krupa K, Couderc V, Tonello A, Modotto D, Barthelemy A, Millot G, et al. Refractive index profile tailoring of multimode optical fibers for the spatial and spectral shaping of parametric sidebands. J Opt Soc America B (2019) 36(4):1117–26. doi:10.1364/josab.36.001117
30. Drouin A, Lorre P, Boisvert J-S, Loranger S, Iezzi VL, Kashyap R. Spatially resolved cross-sectional refractive index profile of fs laser-written waveguides using a genetic algorithm. J Opt Express (2019) 27(3):2488–98. doi:10.1364/oe.27.002488
31. Yang G, Wu H, Liang Z, Wang L, Ke C, Lian Z, et al. Enhanced Raman distributed temperature sensor using a high Raman gain fiber. IEEE Sensors J (2021) 21(24):27518–25. doi:10.1109/jsen.2021.3124906
32. Khudyakov MM, Levchenko AE, Velmiskin VV, Bobkov KK, Aleshkina SS, Bubnov MM, et al. Er-doped tapered fiber amplifier for high peak power sub-ns pulse amplification. J Photon (2021) 8(12):523. doi:10.3390/photonics8120523
33. Wang Y, Gao C, Tang X, Zhan H, Peng K, Ni L, et al. 30/900 Yb-doped aluminophosphosilicate fiber presenting 6.85-kW laser output pumped with commercial 976-nm laser diodes. J Lightwave Tech (2018) 36(16):3396–402. doi:10.1109/jlt.2018.2823504
34. Gao C, Huang Z, Wang Y, Zhan H, Ni L, Peng K, et al. Yb-doped aluminophosphosilicate laser fiber. J Lightwave Tech (2016) 34(22):5170–4. doi:10.1109/jlt.2016.2602372
35. Liao L, Wang Y, Xing Y, Li H, Peng J, Dai N, et al. Fabrication, measurement, and application of 20/400 Yb-doped fiber. Appl Opt (2015) 54(21):6516–20. doi:10.1364/ao.54.006516
36. Lipatov D, Guryanov AN, Yashkov MV, Bubnov MM, Likhachev ME. Fabrication of Yb2O3–Al2O3–P2O5–SiO2 optical fibers with a perfect step-index profile by the MCVD process [J]. Inorg Mater (2018) 54(3):276–82. doi:10.1134/s002016851803007x
37. Liu S, Zhan H, Peng K, Li Y, Sun S, Jiang J, et al. Multi-kW Yb-doped aluminophosphosilicate fiber. Opt Mater Express (2018) 8(8):2114–24. doi:10.1364/ome.8.002114
38. She S, Liu B, Chang C, Xu Y, Xiao X, Cui X, et al. Yb/Ce codoped aluminosilicate fiber with high laser stability for multi-kW level laser. J Lightwave Tech (2020) 38(24):6924–31. doi:10.1109/jlt.2020.3019740
39. Gambling WA, Matsumura H, Ragdale CM. Wave propagation in a single-mode fibre with dip in the refractive index. Opt Quan Elect (1978) 10(4):301–9. doi:10.1007/bf00620118
40. Khular E, Kumar A, Ghatak AK, Pal B. Effect of the refractive index dip on the propagation characteristics of step index and graded index fibers. Opt Commun (1977) 23(2):263–7. doi:10.1016/0030-4018(77)90322-4
41. Ghatak AK, Srivastava R. WKB analysis of graded-index multimode fibers with a central-index dip. Appl Opt (1983) 22(11):1763–4. doi:10.1364/ao.22.001763
42. Lachance RL, Bélanger P-A. Modes in divergent parabolic graded-index optical fibers. J Lightwave Tech (1991) 9(11):1425–30. doi:10.1109/50.97628
43. Renner H. Cutoff frequencies in optical fibres with central refractive-index depression [J]. Opt Quan Elect (1997) 29(5):591–604. doi:10.1023/a:1018528222149
44. Diasty FE, El-Hennawi HA, El-Ghandoor H, Soliman FA. Modal dispersion, pulse broadening and maximum transmission rate in GRIN optical fibers encompass a central dip in the core index profile [J]. Opt Laser Tech (2013) 53:51–7. doi:10.1016/j.optlastec.2013.04.014
45. Qiu Q, Gu Z, He L, Chen Y, Lou Y, Peng J, et al. Ultra-low noise figure in optical fiber amplifier by tailoring the mode field profile of erbium-doped fiber. IEEE Photon J (2022) 14(1):1–6. doi:10.1109/jphot.2021.3121728
46. Smith AV, Smith JJ. Mode instability in high power fiber amplifiers. Opt Express (2011) 19(11):10180–92. doi:10.1364/oe.19.010180
47. Jauregui C, Limpert J, Tünnermann A. High-power fibre lasers. Nat Photon (2013) 7(11):861–7. doi:10.1038/nphoton.2013.273
48. Naderi S, Dajani I, Madden T, Robin C. Investigations of modal instabilities in fiber amplifiers through detailed numerical simulations. Opt Express (2013) 21(13):16111–29. doi:10.1364/oe.21.016111
49. Hansen KR, Alkeskjold TT, Broeng J, Lægsgaard J. Theoretical analysis of mode instability in high-power fiber amplifiers. Opt Express (2013) 21(2):1944–71. doi:10.1364/oe.21.001944
50. Tao R, Ma P, Wang X, Zhou P, Liu Z. 13 kW monolithic linearly polarized single-mode master oscillator power amplifier and strategies for mitigating mode instabilities. Photon Res (2015) 3(3):86–93. doi:10.1364/prj.3.000086
51. Li ZB, Huang ZH, Xiang XY, Liang X, Lin H, Xu S, et al. Experimental demonstration of transverse mode instability enhancement by a counter-pumped scheme in a 2 kW all-fiberized laser. Photon Res (2017) 5(2):77–81. doi:10.1364/prj.5.000077
52. Ren S, Lai W, Wang G, Li W, Song J, Chen Y, et al. Experimental study on the impact of signal bandwidth on the transverse mode instability threshold of fiber amplifiers. Opt Express (2022) 30(5):7845–53. doi:10.1364/oe.454189
53. Dong L. Accurate modeling of transverse mode instability in fiber amplifiers. J Lightwave Tech (2022) 40(14):4795–803. doi:10.1109/jlt.2022.3165394
54. Zhang Z, Luo Y, Xing Y, Li H, Peng J, Li J, et al. Experimental comparison of Yb/Al/Ce and Yb/Al/P co-doped fibers on the suppression of transverse mode instability [J]. Front Phys (2023) 11:1124491. doi:10.3389/fphy.2023.1124491
55. An Y, Huang LJ, Li J, Leng J, Yang L, Zhou P. Learning to decompose the modes in few-mode fibers with deep convolutional neural network. J OPTICS EXPRESS (2019) 27(7):10127–37. doi:10.1364/oe.27.010127
56. Siegman AE. How to (maybe) measure laser beam quality [C]∥ DPSS (diode pumped solid state) lasers: Applications and issues. Washington, D.C.: Optica Publishing Group (1998). p. MQ1.
57. Belanger P-A. Beam quality factor of the LP01 mode of the step-index fiber. Opt Eng (1993) 32(9):2107–9. doi:10.1117/12.143935
58. Yoda H, Polynkin P, Mansuripur M. Beam quality factor of higher order modes in a step-index fiber. J Lightwave Tech (2006) 24(3):1350–5. doi:10.1109/jlt.2005.863337
59. Flamm D, Schulze C, Bruning R, Schmidt OA, Kaiser T, Schroter S, et al. Fast M2 measurement for fiber beams based on modal analysis [J]. Appl Opt (2012) 51(7):987–93. doi:10.1364/ao.51.000987
60. An Y, Li J, Huang L, Leng J, Yang L, Zhou P. Deep learning enabled superfast and accurate M2 evaluation for fiber beams. Opt Express (2019) 27(13):18683–94. doi:10.1364/oe.27.018683
61. Tao R, Huang L, Li M, Shen B, Feng X, Xie L, et al. M2 factor for evaluating fiber lasers from large mode area few-mode fibers [J]. Front Phys (2023) 11:1082086. doi:10.3389/fphy.2023.1082086
62. Shi C, Deng X, Fu S, Sheng Q, Jiang P, Shi Z, et al. 700 W single-frequency all-fiber amplifier at 1064 nm with kHz-level spectral linewidth [J]. Front Phys (2022) 10:982900. doi:10.3389/fphy.2022.982900
63. Liao S, Luo T, Xiao R, Cheng J, Shu C, Zhang Z, et al. 3.2 kW, 0.22 nm narrow-linewidth MOPA configuration fiber laser with a homemade polarization-maintaining Yb-doped fiber [J]. Front Phys (2023) 11:1134745. doi:10.3389/fphy.2023.1134745
64. Tao R, Huang L, Zhou P, Si L, Liu Z. Propagation of high-power fiber laser with high-order-mode content. Photon Res (2015) 3(4):192–9. doi:10.1364/prj.3.000192
Keywords: fiber evaluation, central refractive index dip, mode field parameters, beam quality, bending loss
Citation: An Y, Chen X, Ren Y, Wu H, Huang L, Pan Z, Jiang Z and Zhou P (2023) Impact of the central refractive index dip of fibers on high-power applications. Front. Phys. 11:1177371. doi: 10.3389/fphy.2023.1177371
Received: 01 March 2023; Accepted: 31 March 2023;
Published: 12 April 2023.
Edited by:
Rumao Tao, China Academy of Engineering Physics, ChinaReviewed by:
Yingbin Xing, Huazhong University of Science and Technology, ChinaCopyright © 2023 An, Chen, Ren, Wu, Huang, Pan, Jiang and Zhou. This is an open-access article distributed under the terms of the Creative Commons Attribution License (CC BY). The use, distribution or reproduction in other forums is permitted, provided the original author(s) and the copyright owner(s) are credited and that the original publication in this journal is cited, in accordance with accepted academic practice. No use, distribution or reproduction is permitted which does not comply with these terms.
*Correspondence: Liangjin Huang, hlj203@nudt.edu.cn; Zhiyong Pan, panzy168@163.com
Disclaimer: All claims expressed in this article are solely those of the authors and do not necessarily represent those of their affiliated organizations, or those of the publisher, the editors and the reviewers. Any product that may be evaluated in this article or claim that may be made by its manufacturer is not guaranteed or endorsed by the publisher.
Research integrity at Frontiers
Learn more about the work of our research integrity team to safeguard the quality of each article we publish.