- 1Department of Physics, Xinzhou Normal University, Xinzhou, Shanxi, China
- 2Institute for Interdisciplinary Quantum Information Technology, Jilin Engineering Normal University, Changchun, China
- 3Department of Electronics, Xinzhou Normal University, Xinzhou, Shanxi, China
In order to improve the degree of assembly automation, an online assembly calibration system is designed based on laser scanning and optical fiber sensors. The optical fiber sensing module is used to obtain the stress field information, and the laser scanning module is used to obtain the point cloud information of the assembly structure. The position offset caused by the stress field can be compensated to the 3D point cloud for improving the target reconstruction accuracy. It consists of laser scanning module, optical fiber sensor module, demodulator, data analysis module, etc. Analyzing the structural characteristics of the module, the stress field distribution of the module structure is obtained through simulation analysis, and an appropriate optical fiber sensor network layout is constructed. When the force is applied in different directions, the stress field distribution of the assembly structure is simulated and analyzed. The results show that the magnitude and direction of the residual stress have an impact on the distribution of the stress field. At the same time, the stress field diffusion degree had been also analyzed in different strength conditions. In the calibration test of FBG sensor, the functional relationship between wavelength variation and stress is about 0.0011 nm/N. In the assembly test, the stress test trends of different FBGs were obtained, and the relative error was concentrated between 4.0% and 9.0%, which had good stability. After correcting the position of the point cloud for optical fiber sensing data, the position deviation between the test point and the digital analog has been significantly reduced, with the average value decreasing from 2.953. to 0.095 mm. It has good applicability in factories with large interference of working environment, and can improve the application field of intelligent assembly.
1 Introductions
Intelligent assembly technology is the development direction of the future manufacturing industry, and it is the closed-loop control of online real-time monitoring and feedback as demonstrated [1]. The existing online adjustment methods of intelligent assembly mainly include laser scanning method and image matching method [2]. The image matching method mostly uses a trinocular measuring instrument. Boeing adopts intelligent assembly technology, and large parts were realized by iGPS and AGV. It greatly reduces time for assembly time [3–5]. A high-precision online correction module was provided by the modular positioning technology, which can use laser positioning to obtain real-time assembly information Arnaldo G [6]. Had a very high level of intelligence as demonstrated.
Lidar technology [7–11] has the advantages of high precision and good repeatability in intelligent assembly, and the image matching method has the advantages of strong applicability and good stability. Both of them use the method of collecting light waves at the target position to obtain the assembly state. In the existing intelligent assembly system, it can often only be applied to large components with a simple structure or an assembly process with a single process, and at the same time, it is necessary to ensure the low noise of the assembly environment. It also limits the application of the two technologies in the more general assembly process, so these two technologies are currently mainly used in the aviation field. Multi-sensor measurement methods have low dependence on working conditions, good real-time performance and strong adaptability. Mulle et al. [12] completed the measurement of mechanical structures under moving conditions through FBG strain measurement and vibration demodulation. Stress fluctuation range test; Anany [13] used multi-core fiber to achieve the acquisition of three-dimensional strain field distribution, so as to invert the structural shape change; Arnaldo [14] detected the bending shape and solved the problem of the installation process of the aircraft boom. The force condition assists the assembly. Qu Daoming et al. [6] used optical fiber sensing technology to complete the flexible skin detection, and provided experimental reference data for the automatic adjustment of variable wings. Jiang Xintong et al. [15] obtained the pre-assembled stress model through the optical fiber network to improve the assembly accuracy. In order to directly obtain the assembly state information during the assembly process for realizing online correction, it can achieve the purpose of being suitable for various assembly fields.
An intelligent assembly trajectory correction system was designed by optical fiber sensing. The tool distributed sensor network was used to solve the problem of visual blind spots, and the differential correction was used to solve the problem of environmental interference.
2 Principle of the system
During the assembly process, the assembly tool needs to move the workpiece to a suitable position. During the process, it is often affected by the error between the preset trajectory and the actual assembly trajectory. Translation error, pose error, etc., will cause improper assembly, interference assembly or assembly interference, etc. In order to realize the self-adaptive correction in the assembly process of large-scale structural workpieces, it is necessary to obtain the real-time assembly status information. Obtaining the stress field distribution through optical fiber sensing technology can complete the real-time correction of assembly trajectory, the echo offset of any FBG can be expressed as.
Among them, λB is the initial value of the center wavelength of the FBG, α is the thermal expansion coefficient, ξ is the thermo-optic coefficient, ΔT is the temperature change, ε is the strain, and Pε is the elastic-optic coefficient. Since the influence of temperature on FBG can be realized by performing temperature compensation in the same working environment, the temperature term in the above formula can be replaced by a constant coefficient.
Let the feature point set on the tape-mounted product be A (x, y, z), and the actual point set be A’ (x, y, z). The reason for the deviation is the deformation caused by stress, then the point set change ΔA (x, y, z) can be expressed as
The strain position function f (ε) can be expressed as
The test group data can be obtained through the experiment to complete the fitting of the f (ε) function, and then use this function to compensate for the unknown position offset.
A sufficient number of FBG sensors are pasted on the entire tool according to the sensitive locations that may change significantly. The stress field distribution of the entire tool can be obtained at one time. Then, through the difference of stress field distribution, the analysis of the assembly deviation was completed, and the assembly trajectory was corrected according to the difference. According to Hooke’s law, the stress value at any position on the workpiece has
Among them, x is the corresponding position, l is the size of the building element, I is the moment of inertia, E is the elastic modulus, ε is the strain value, and λC is the wavelength offset compensation coefficient obtained by temperature calibration. Since l、E and I are all constants, and x is the position corresponding to the test, it can be used as an input. The wavelength change of all FBGs corresponding to the x position becomes the only variable for the calculation of the stress value, that is, the stress field distribution matrix can be obtained through the wavelength matrix. Since the theoretical trajectory position can be obtained by multiplying the matrix of the test position P by the trajectory compensation matrix, the trajectory compensation matrix Cxy affected by the stress field can be expressed as the test position matrix P and the wavelength offset is all the test values and the wavelength offset ΔλB, there is
Among them, z is a constant; x and y respectively represent the two-dimensional coordinates of the workpiece marking point. By calculating the parameters of the trajectory compensation matrix corresponding to the two-dimensional coordinates at any time, it can complete the real-time correction of the assembly.
3 Assembling the calibration system
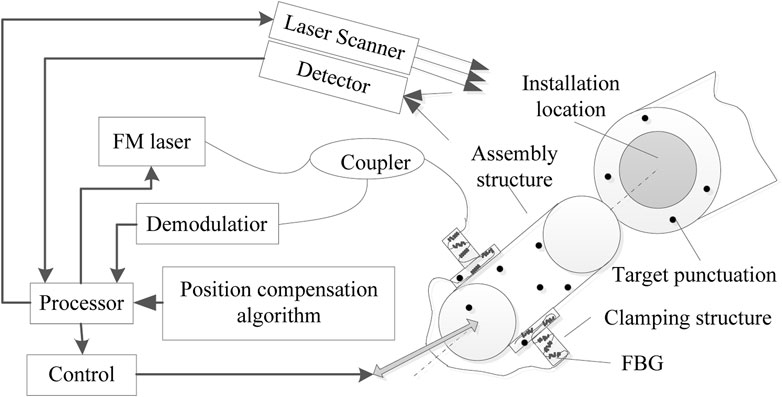
The traditional multi-sensor measurement method requires multiple types of sensors to monitor the stress of the product installation location, vibration parameter measurement, temperature compensation test and so on. There are many factors that need to be considered to complete the layout of various sensors and the placement of processing circuits on the entire robotic arm. Otherwise, interference problems, electronic interference problems, and signal crosstalk problems during the movement process may be affected. Test results and lead to feedback errors affecting the installation effect. The system consists of a frequency-modulated laser, a coupler, a demodulation module, a fiber grating (FBG, Fiber Bragg Grating) and a laser scanning module. The overall structure is shown in Figure 1. The optical fiber sensor network itself is a passive sensor and is not affected by electromagnetic radiation; the front section has only optical fiber, the processing module can be completely separated from the sensing part, and the optical fiber sensing part is small in size, and can simultaneously obtain the stress through combined measurement. The laser scanning module can obtain three-dimensional point cloud data of the assembly structure. After converting the geometric deformation relationships sensed by optical fibers into offset parameters, the 3D point cloud of the assembly structure is imported to achieve correction of the assembly trajectory.
4 Simulation analysis
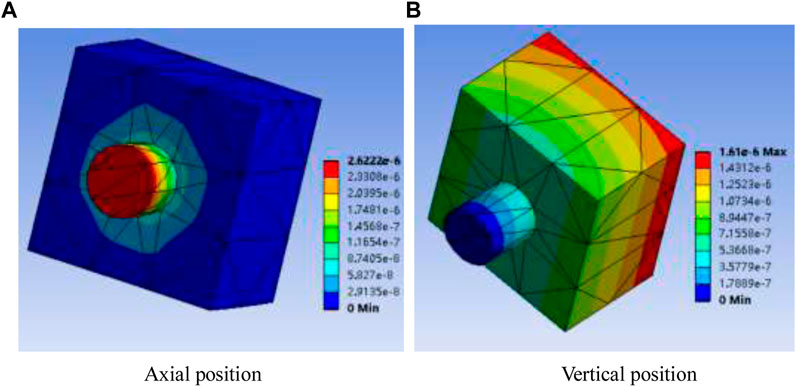
In the intelligent detection and correction system, the transmission of the test physical quantity is from stress to wavelength change value, wavelength change value to position offset, and position offset to detection correction value. Among them, the wavelength change value to the position offset is realized by fitting the experimental data. The position offset to the detection correction value is realized by the control structure, and the stress to the wavelength change is obtained through the test data. It can affect the original data directly and the calibration accuracy, so the simulation analysis of its parameters is very necessary. The FBG distribution position and FBG axial direction are guided by the simulation results, which provide theoretical support for accurately obtaining stress distribution data. Taking the common jack-type installation structure in Figure 1 as an example, the simulation analysis is carried out for the two main error forms of position deviation and angle deviation, and the results are shown in Figure 2.
Two different abnormal position states common in the product installation process are simulated and analyzed. It shows the stress distribution caused by the deviation of the installation position in Figure 2A. The assembly depth is too large, so that there is a stress effect of extrusion between the insertion end and the installation hole, the stress field distribution is shown in Figure 2A, and its stress is mainly concentrated on the insertion end. When the residual stress is 10N, the maximum position offset is about 2.6 μm. It shows the stress distribution caused by the deviation of the installation angle in Figure 2B. There is an angular deviation between the axis of the insert and the axis of the installation hole during assembly. The stress field distribution is shown in Figure 2B, and the stress is mainly concentrated at the end of the installation hole. When the residual stress is 30N, the maximum position offset is about 1.82 μm. The size of the components and the force applied by the assembly robot are corresponding to the weight of the workpiece and the clamping requirements, so the stress range changes greatly.
5 Experiments
5.1 Calibration test
The stress test of the FBG array was calibrated before completing the stress acquisition at the assembly location. The test mainly completes the test of the temperature compensation data and the test of the variation law of stress and wavelength. The stress test adopts the classic cantilever beam structure. The effective distance is 5.0 cm. The FBG length is 2.5 mm. The material is steel. The elastic modulus is 6.54 × 10¹⁰ Pa, and the expansion coefficient is 21.6 μm/mk. The external force value was increased from 0 to 400 N, and the test data was recorded every 100 N. The functions of wavelength with respect to stress are
The target location uses a stress sensitive FBG, and the stress test results are shown in Figure 3. At the same time, temperature FBG is used to compensate for the temperature drift of the stress FBG. The relationship between stress and wavelength shift is linear. The average slope is 0.43 p.m./N. In order to improve the test range of the system application, the strain value of the test point can be calibrated by calibrating the database, so that it is suitable for a larger stress response range that conforms to elastic deformation.
5.2 Assembly structure test experiment
The stress distribution position has the regularity of gradient diffusion. The structure distribution design of the FBG in the insert and the mounting hole is completed, and the FBG is numbered.
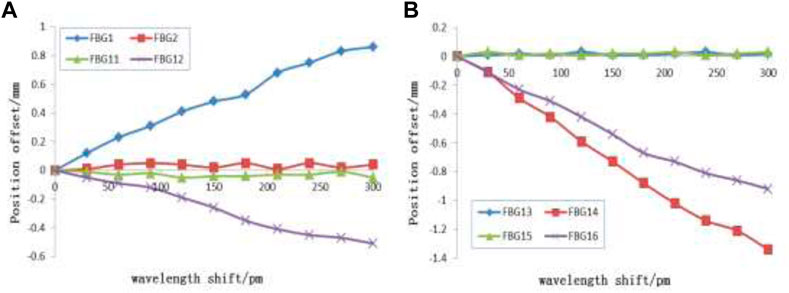
In the insert clamping structure, comparing the test results of No. 1 to 12 FBGs, it can be seen that the relationship between the axial position and the direction of stress is very important. The effect of FBG’s response effect is very obvious. According to the positive and negative values of the test, it can also be concluded that when the stress distribution position is in the compression transition state, its value is negative, and when it is in the tensile state, its value is positive. By comparing No. 1, 5, 9 and No. 4, 8, and 12 FBGs, it can be seen that the stress distribution of the insert is affected by the depth of the insertion position. The more inward the stress value is, the greater the position deviation is. It can be seen from FBG No. 14, 16, 18, and 20 that there is an obvious stress gradient in the area of the mounting hole, which is basically consistent with the simulation results. It can be seen from the test results that the system has an obvious response law to the position deviation caused by the stress change, and the inversion accuracy is also compared with the visual inspection system. The relative error is concentrated between 4.0% and 9.0%, which has good stability. The experiment is expressed by the comparison relationship between stress and wavelength offset value and position offset value in the range of 0–400 N. Four groups of FBGs were selected for the comparison detection position, and there were No. 1 and No. 2, No. 11 and No. 12, No. 13 and No. 15, No. 14 and No. 16. The test changes are shown in Figure 3.
The corresponding relationship between the wavelength offset and the position offset is shown in Figure 3A. The two groups of orthogonally distributed FBGs are No. 1 and No. 2, No. 11 and No. 12, respectively. The distribution of stress on the insert had obvious directionality, and the sensitive direction of FBG No. 1 and No. 12 is consistent with the axial direction of FBG, so they had a good response. No. 2 and No. 11 were basically unchanged. It can be seen that when the force is applied perpendicular to the current force direction, the test result is just the opposite. For the mounting holes, the corresponding relationship between the wavelength offset and the position offset is shown in Figure 3B. The two groups of orthogonally distributed FBGs were No. 13 and No. 15, No. 14, and No. 16 respectively, the distribution of stress on the mounting hole also had obvious directionality, FBGs No. 14 and No. 16 are sensitive test points, and FBG No. 13 and No. 15 were insensitive points. For FBGs No. 1, No. 12, No. 14, No. 16, the fitting curve was basically close to linear, so the wavelength offset and position offset of the system in this stress test interval are linear functions. The center wavelength of the wave can effectively compensate the deviation of the assembly position, which verifies the feasibility of the system.
5.3 Comparative experiment analysis
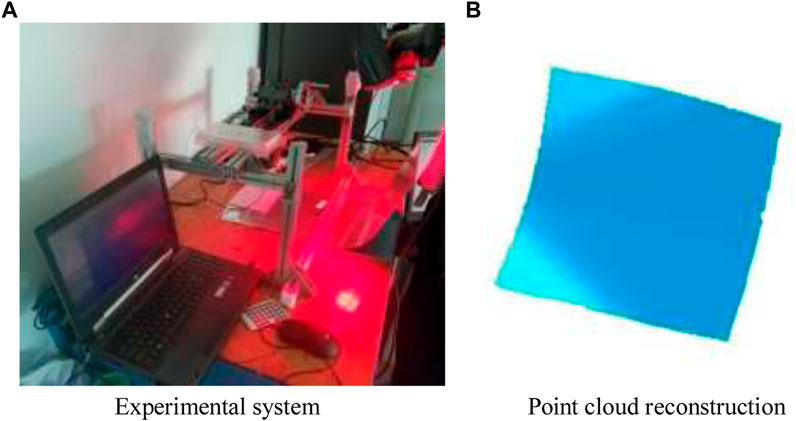
In order to verify that the optical fiber sensing system can provide trajectory correction data for the assembly control module, the test data of R1X 3D laser scanner is used as the standard test data, with a sight distance of 50.0 cm and an accuracy of 120 μm, which can accurately reflect the assembly the position trajectory of the structure. The comparison experiment is shown in Figure 4.
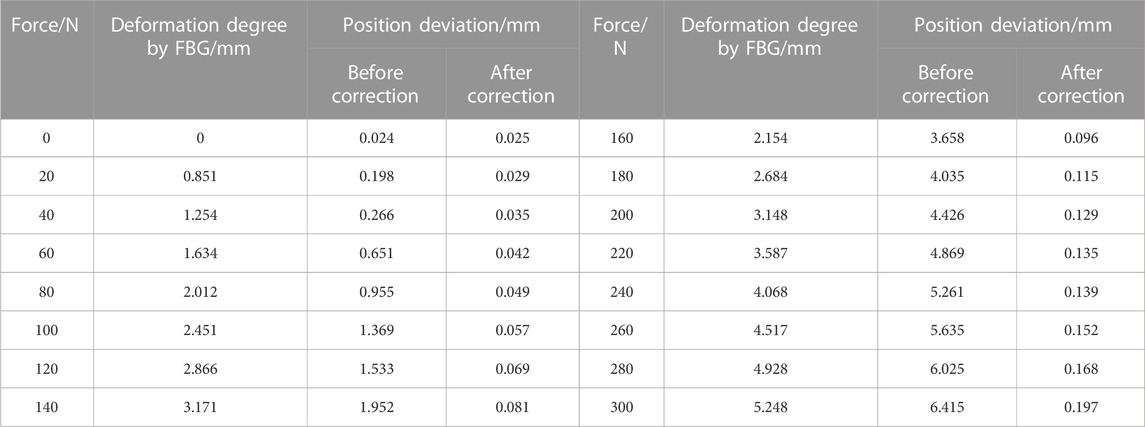
A three-dimensional strain field monitoring system based on FBG sensors is established, and the physical diagram of the experimental device is shown in Figure 4. The type of FBG strain sensor used in the experiment; the bandwidth of the six sensors is 0.213 nm; the edge-to-mode rejection ratio is 16.21 dB; the length of the grid region is 20mm; , 1,536.124, 1,540.347, 1,542.428, 1,546.758, and 1,549.224 nm. The target points for comparing the position information are pasted on the assembly structure, so as to analyze the position trajectory test accuracy of the method. The thickness of the structural parts used in the test is 20.0 mm, and the diameter of the axle is 40.0 mm, which is smaller than the simulation body. Therefore, considering its structural bearing capacity and avoiding plastic deformation, the force strength used in the test is from 10 to 200 N, and the test results are deviated. The degree is shown in Table 1.
In Table 1, when the external force gradually increases, the maximum position offset of the test position also increases, which can be known by linear fitting. It can be seen that in the range of 0–300.0 N, the relationship between the deformation offset and the applied force satisfies the change relationship of 0.0214 mm/N. The mean absolute value of the test error using this system is 0.124 mm, the maximum relative error is 1.92%, and the mean value is −0.96%. And from the distribution of test data, it can be seen that with the increase of the force, the test error decreases significantly. The analysis believes that this is because the increase of the test stress increases the signal energy. Compared with the basic white noise, the overall signal-to-noise ratio is improved. The average relative error is about −0.96%, and it meets the design requirements. Before and after correction, the distance deviation between the assembly position and the digital analog position has been significantly improved. With the increase of external stress, the effect of correction becomes more and more obvious. When the stress is 300 N, the average position deviation before correction is 6.415 mm, while after correction, it is only 0.197. The position deviation between the test point and the digital analog has been reduced from 2.953 to 0.095 mm. Correction can significantly suppress positional deviation over the entire stress application range.
5 Conclusion
The optical fiber sensor network is applied in the field of trajectory correction of assembly by taking advantage of the characteristics of small size, high sensitivity and anti-electromagnetic interference. The sensor array corresponding to the assembly structure is designed, and the stress distribution under different assembly abnormal conditions is simulated and analyzed. The experiment applies optical fiber sensing data to three-dimensional point cloud reconstruction from laser scanning, and obtains a target surface reconstruction model with higher positional accuracy. The experimental results show that the position deviation accuracy of the system is close to the average relative error of standard test data, which meets the design requirements. The system has certain application prospects in the trajectory correction of assembly.
Data availability statement
The original contributions presented in the study are included in the article/Supplementary Material, further inquiries can be directed to the corresponding author.
Author contributions
WD proposes the idea of combining optical fiber and laser scanning; ML deduced and calculated the mathematical models of two kinds of data fusion, and FL simulated and analyzed the design; YG and WQ completed the test of optical fiber sensing; HZ completed the laser scanning test. All authors contributed to the article and approved the submitted version.
Funding
This work was supported in part by Teacher Education Fund of Xinzhou Teachers University (JZ201701).
Conflict of interest
The authors declare that the research was conducted in the absence of any commercial or financial relationships that could be construed as a potential conflict of interest.
Publisher’s note
All claims expressed in this article are solely those of the authors and do not necessarily represent those of their affiliated organizations, or those of the publisher, the editors and the reviewers. Any product that may be evaluated in this article, or claim that may be made by its manufacturer, is not guaranteed or endorsed by the publisher.
References
1. Mesquita E, Pereira L-I, Theodosiou A, Alberto N, Melo J, Marques C, et al. Optical sensors for bond-slip characterization and monitoring of RC structures. Sensors Actuators A: Phys (2018) 280(1):332–9. doi:10.1016/j.sna.2018.07.042
2. Zhi-chao L, Jin-hua Y, Zhang L, et al. Granary temperature measurement network based on chirped FBG. Spectrosc Spectral Anal (2016) 36(10):3377–80.
3. Sun B, Li J, Zhang W. Fiber Bragg grating sensor. Opt Fiber Sensing Struct Health Monit Technol (2019) 26(4):77–148.
4. Sun L, Hao H, Zhang BB, Ren B, Li J. Strain transfer analysis of embedded fiber Bragg grating strain sensor. J Test Eval (2016) 44(6):20140388–2320. doi:10.1520/jte20140388
5. Wang J, Liu Z, Lin X, et al. Fiber Bragg grating strain detection system for digital calibration. Laser Technol (2020) 44(5):570–4.
6. Qu D, Sun G, Hong L, et al. Optical fiber sensing and reconstruction method for deformable wing flexible skin shape. J Instrument Instrument (2018) 39(2):460–40.
7. Zhi-chao L, Zhang L-J, Jin-hua Y, et al. Research on Bragg spectral distribution based on refractive index modulation matrix. Spectrosc Spectral Anal (2018) 32(12):3718–23.
8. Zhao Z, Bai Z, Jin D, Qi Y, Ding J, Yan B, et al. Narrow laser-linewidth measurement using short delay self-heterodyne interferometry. Opt Express (2022) 30(17):30600–10. doi:10.1364/OE.455028
9. Zhao Z, Bai Z, Jin D, Chen X, Qi Y, Ding J, et al. The influence of noise floor on the measurement of laser linewidth using short-delay-length self-heterodyne/homodyne techniques, Micromachines (2022) 13(8): 1311. doi:10.3390/mi13081311
10. Chen H, Bai Z, Cai Y, Yang X, Ding J, Qi Y, et al. Order controllable enhanced stimulated Brillouin scattering utilizing cascaded diamond Raman conversion. Appl Phys Lett (2023) 122(9):092202. doi:10.1063/5.0137542
11. Jin D, Bai Z, Li M, Yang X, Wang Y, Mildren RP, et al. Modeling and characterization of high-power single frequency free-space Brillouin lasers. Opt Express (2023) 31(2):2942–55. doi:10.1364/oe.476759
12. Mulle M, Yudhanto A, Lubineau G, Yaldiz R, Schijve W, Verghese N. Internal strain assessment using FBGs in a thermoplastic composite subjected to quasi-static indentation and low-velocity impact. Compos Structures (2019) 215(32):305–16. doi:10.1016/j.compstruct.2019.02.085
13. Al A, Yasser M, Tait MJ. Fiber-reinforced elastomeric isolators for the seismic isolation of bridges. Compos Structures (2016) 160(7):300–11.
14. Leal-Junior AG, Díaz CAR, Anselmo F, Marques C, Ribeiro MR, Pontes MJ. Simultaneous measurement of pressure and temperature with a single FBG embedded in a polymer diaphragm. Opt Laser Technol (2019) 112(93):77–84. doi:10.1016/j.optlastec.2018.11.013
Keywords: optical fiber network, laser scanning, assembly calibration, automation, stress field analysis
Citation: Ding W, Li M, Liang F, Gao Y, Qin W and Zhang H (2023) Research on on-line assembly and calibration system based on laser scanning and optical fiber sensor. Front. Phys. 11:1185068. doi: 10.3389/fphy.2023.1185068
Received: 13 March 2023; Accepted: 03 April 2023;
Published: 12 April 2023.
Edited by:
Shuo Liu, Hebei University of Technology, ChinaReviewed by:
Zhichao Liu, Changchun University of Science and Technology, ChinaWang Gao, North University of China, China
Copyright © 2023 Ding, Li, Liang, Gao, Qin and Zhang. This is an open-access article distributed under the terms of the Creative Commons Attribution License (CC BY). The use, distribution or reproduction in other forums is permitted, provided the original author(s) and the copyright owner(s) are credited and that the original publication in this journal is cited, in accordance with accepted academic practice. No use, distribution or reproduction is permitted which does not comply with these terms.
*Correspondence: Meixuan Li, bGlteEBqbGVudS5lZHUuY24=
 Weijie Ding
 Meixuan Li
 Fang Liang3