 Xuefeng Quan
- 1Lanzhou Documentation and Information Center, Northwest Institute of Eco-Environment and Resources, Chinese Academy of Sciences, Lanzhou, China
- 2School of Economics, Lanzhou University, Lanzhou, China
- 3Gansu Provincial Key Laboratory of Remote Sensing, Northwest Institute of Eco-Environment and Re-sources, Chinese Academy of Sciences, Lanzhou, China
- 4Bussiness School, Northwest Normal University, Lanzhou, China
- 5School of Mathematical Sciences, University of Electronic Science and Technology of China, Chengdu, China
Introdution: One crucial method to attain Sustainable Development Goals (SDGs) involves timely adjustment of development policies, promoting the realization of SDGs through a time-series assessment of the degree of accomplishment. In practical applications, data acquisition is a significant constraint in evaluating the SDGs, not only in China but across the globe. Hence, expanding data channels and exploring the feasibility of various data sources for sustainable development assessment are effective strategies to tackle the challenge of data acquisition.
Methods: In light of this issue, this study selected Nighttime Light Data, a remote sensing data source closely linked to human social activities, as an alternative data source. Using Yunnan Province as an example, 16 localized indicators of social, economic, and environmental types were chosen. These indicators were then subjected to a correlation analysis with the Total Nighttime Light Index (TNLI). The relationships between different types of indicators and TNLI were analyzed at both temporal and spatial scales, thus identifying the indicators for which TNLI could serve as a suitable substitute measure.
Results: The study indicates that when the SDG indicators are classified into economic, social and environmental categories, the total value of nighttime light presents a significant correlation and substitutability with economic indicators; significantly correlated with some social indicators, it can reveal the weak links in the development of underdeveloped areas; it is not significantly correlated with environmental indicators, while a trend correlation exists, which can provide some reference values.
Discussion: This study has demonstrated the feasibility of using Nighttime Light Data for sustainable development assessment. It provides a novel evaluation method for countries that, despite a lack of resources for conducting sustainable development assessments, have a greater need for such assessments due to their lower economic development. Furthermore, a multitude of assessment methods can be developed based on Nighttime Light Data.
1 Introduction
At the 70th Session of the United Nations General Assembly held in September 2015, 193 member countries jointly approved the “Transforming Our World: The 2030 Agenda for Sustainable Development”, which put forward the sustainable development goals (SDGs), hoping to solve the development problems of human society at social, economic and environmental dimensions with the most comprehensive and integrated approach, and to realize sustainable development by formulating 17 sustainable development goals and 169 specific goals (Ministry of Foreign Affairs of the People’s Republic of China, 2021; Guo et al., 2021a; Guo et al., 2021b). In September 2016, China formulated and issued China’s National Plan on Implementation of the 2030 Agenda for Sustainable Development, and suggested that the 169 specific goals of SDGs should be evaluated in various respects (The State Council of the People’s Republic of China, 2016). Data acquisition is the most fundamental and important part in the evaluation process. China is characterized by vast territory, unbalanced economic and social development and polarized population distribution, so it is relatively difficult to monitor and acquire indicators of some areas in the practical evaluation process. For example, in sparsely populated regions like Tibet and Xinjiang, we do not have enough corresponding workers to gain meticulous statistical results in the data monitoring process. Second, a high cost is required to collect the evaluation data, and most evaluation data are statistical data gained through field research or published by the state, while most prefecture-level statistical data are not published on the internet. Therefore, such data should be collected on site, which requires a high travel cost. Third, the acquisition cycle is long. Sustainable development is a development pattern requiring dynamic evaluation and adjustment, and dynamic regulation should be conducted according to the present international and domestic situations. Timely evaluation is the foundation of dynamic regulation, and the requirement for time attributes is high. However, the current evaluation mode involves a long data acquisition cycle. Fourth, it is inconvenient to make an international comparison. The statistical data of developed countries are relatively complete and published timely, so we can master their sustainable development progress. However, some developing countries cannot publish related statistical data timely or lack statistical items owing to the influence of economic and cultural factors. As a result, data sources are insufficient in horizontal comparison. Therefore, data acquisition is the main bottleneck of SDG evaluation (Song et al., 2018).
In recent years, as global satellite development enters an active phase, satellite-based sensors have realized more and more comprehensive functions, creating increasingly diversified remote sensing products. Characterized by high openness, short acquisition cycle and low cost, remote sensing data are extensively applied in various studies. Thereinto, nighttime light images (NTL) are extensively applied to study human social activities (Li and Li, 2015; Li et al., 2019), such as spatial analysis of population (Lo, 2001; Zhou et al., 2005), urban area analysis (Shu et al., 2011; Yu et al., 2018; Zhao et al., 2020; Yu et al., 2021; Jiang et al., 2022), land use management (Rahman et al., 2021), energy consumption and carbon emissions (Su et al., 2013; Ma and Xiao, 2017; Du et al., 2021; Niu et al., 2021), social and economic development analysis (Li et al., 2016; Yang et al., 2019; Li et al., 2019; Li et al., 2021; Peng et al., 2022; Jiang et al., 2021), air quality analysis (Cao, 2016; Wu et al., 2021), physical fitness analysis (Deng et al., 2022; Liao et al., 2022), and disaster monitoring (Du et al., 2020). These studies are closely associated with the sustainable development and sustainable development goals of the human society. For the specific SDG assessment, Wang et al. integrated NTL, China’s Land-Use/Cover Datasets (CLUDs) and statistical data to monitor the Sustainable Development Goals (SDGs).) 11.3.1: “The ratio of land consumption rate to the population growth rate (LCRPGR)" (Wang et al., 2020). Wang et al. used NTL, CLUDs, and digital elevation model data, analyze and verify the spatiotemporal distribution characteristics of China’s poverty areas and counties and their SDG 1 evaluation values (Wang et al., 2022). Falchetta et al. used high-resolution population distribution maps (including demographic and migration trends), satellite-measured nighttime light, and settlement information for sub-Saharan Africa. Derive multi-dimensional estimates of electricity access over space and time. Their research show that reveal wide inequalities in the pace and quality of electrification, which cannot be observed in existing statistics. The pace of electrification must more than triple to fulfill SDG 7.1.1 (Falchetta et al., 2020). Therefore, it is highly feasible to choose nighttime light data as the substitutive indicator of sustainable development goals. Remote sensing data will help to increase the SDG evaluation frequency, enhance the timeliness, reduce the data cost, and provide timely and effective supports for the formulation of regional sustainable development strategies. Based on the above, this paper aims to analyze the inner link between nighttime light data and sustainable development indicators by a case study of Yunnan Province, to explore the application range of nighttime light data in SDG evaluation, to provide expansive data for the newly launched SDGSAT-1 (Guo et al., 2023), and to realize multi-evaluation on specific SDGs.
2 Data sources and research methods
2.1 Overview of research area
Yunnan Province is located in the mountainous plateau of southwest China, and the mountainous area occupies 88.64% of the total area of the whole province (Figure 1). Its west and south parts border on countries like Myanmar, Laos and Vietnam, creating a “borderland, multi-ethnic and underdeveloped” area in such a unique geographical location. To evaluate the sustainable development situation of this area has practical significance for helping Yunnan realize sustainable development. Most existing studies on sustainable development of Yunnan mainly analyze the development advantages and disadvantages of single goals like tourism, mineral products and energy, and provide suggestions on the optimization of sustainable development paths. Few studies are conducted to evaluate the overall sustainable development indicators. Meanwhile, to realize the construction goals of making Yunnan Province the demonstration area for national unity and progress, the vanguard of ecological civilization construction, and the radiation center of South Asia and Southeast Asia, Yunan has positively created an innovation demonstration zone for national sustainable development agenda in Lincang City, Yunnan Province (Shen, 2021). However, it is located in the Yunnan-Guizhou Plateau, which is densely covered with mountains, rivers and lakes. As a result, travel inconvenience and external exchange difficulty exist. Besides, its development speed is lower than that of eastern regions. Owing to its complex topography, SDG evaluation has problems like data collection difficulty, basic data missing, field research difficulty, and high cost. By studying the substitutability of nighttime light data for SDG evaluation indicators, we can apply substitutive indicators in complex regions, to expand the SDG evaluation methods, and to make up data deficiencies in the evaluation of some indicators.
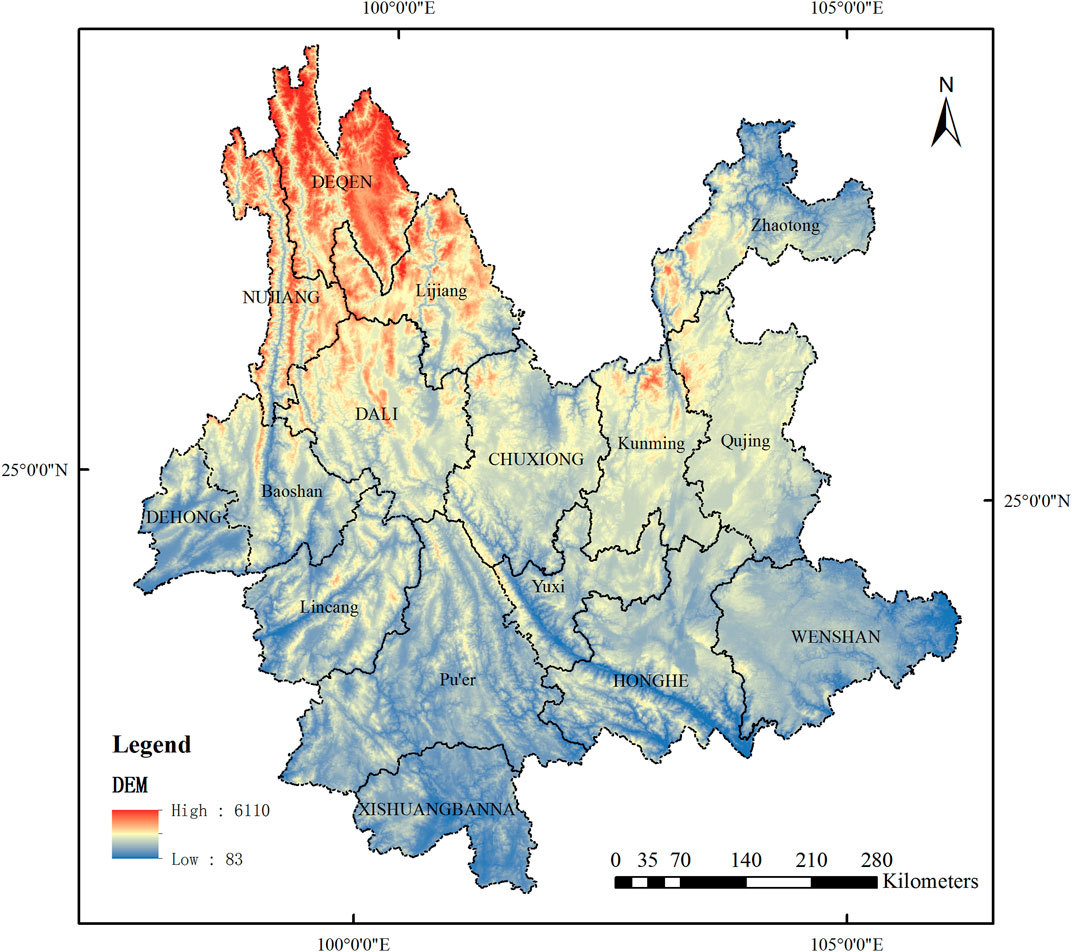
FIGURE 1. Overview of Yunnan Province.
2.2 Data sources
2.2.1 Remote sensing data
The Visible Infrared Imaging Radiometer Suite (VIIRS) is the latest generation of earth observation satellite sensors by following the Operational Linescan System (OLS) of the United States Defense Meteorological Satellite Program (DMSP), and it is carried by Suomi National Polar-orbiting Partnership (NPP). Compared with DMSP-OLS, it is greatly improved in the aspect of low-light level imaging, so it can generate nighttime light products of higher quality. NPP-VIIRS nighttime light data were downloaded from the National Center for Environmental Information subordinate to the National Geophysical Data Center (NGDC) of Nation Oceanic Atmospheric Administration (NOAA). Only monthly data of NPP-VIIRS and a small number of annual data were issued, so the previous annual data of NPP-VIIRS were spliced with the monthly data. From 15 October 2019, the nighttime light data of NPP-VIIRS have been migrated from NOAA to the website of Colorado School of Mines/Earth Observation Group (CSM/EOG) (Elvidge et al., 2021), as shown in Table 1.
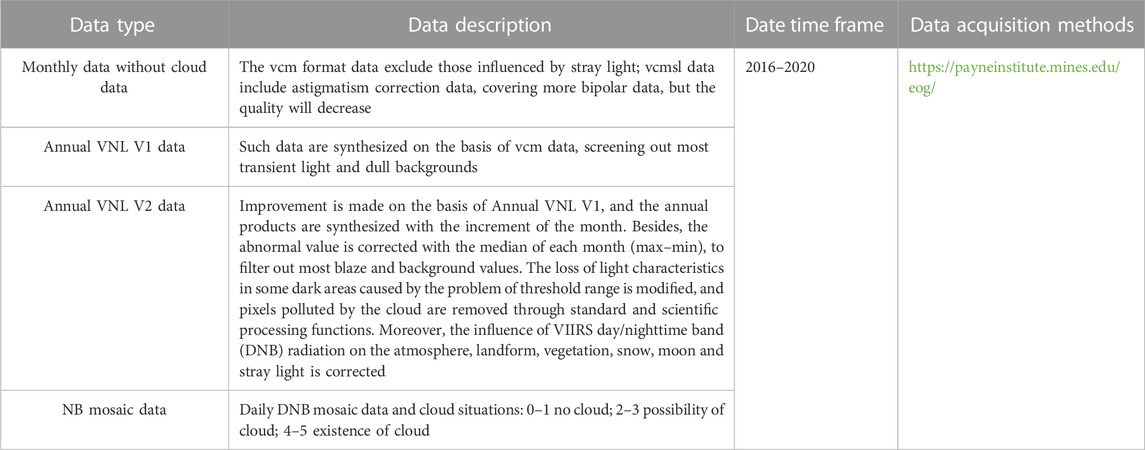
TABLE 1. NPP-VIIRS data description.
2.2.2 Statistical/monitoring data
The global indicator framework of various sustainable development goals and specific goals in the 2030 Agenda for Sustainable Development requires that the sustainable development goals should be assigned according to income, gender, age, race, nation, migration situation, disability situation, geographical location or other characteristics by following the Basic Principles of Official Statistics. Moreover, the descriptive information of indicators is given at the indicator level, but no definition is provided for the specific item in specific statistical data. Therefore, some data are detailed according to the descriptive information and Big Earth Data in Support of the Sustainable Development Goals in this study, and the specific data sources are clarified.
The statistical data originate from the Statistical Yearbook of Yunnan Province, Fiscal Revenue and Expenditure of Yunnan Province, China Health Statistical Yearbook, Grain and Oil Price Monitoring Bulletin of Yunnan Province, and Statistical Yearbook of Chinese Urban Construction.
The monitoring data come from China National Environmental Monitoring Centre and China Online Monitoring and Analysis Platform for Air Quality, as shown in Table 2.
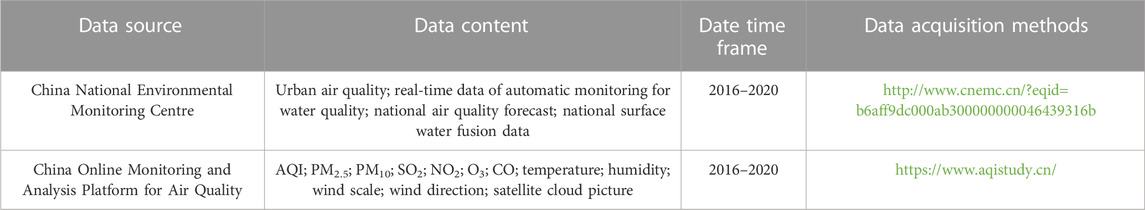
TABLE 2. Monitoring data description.
2.3 Research method
2.3.1 General thought
First, the nighttime light indexes were extracted after the nighttime light data were processed, and the statistical data and monitoring data were summarized to acquire related data for SDG indicator evaluation. Secondly, the summarized data were divided into social, economic and environmental types according to the classification standards, and their correlation was calculated. Then the correlation and substitutability between different indicators and nighttime light indexes were discussed according to the calculation results. Finally, analysis was made for the influence of the COVID-19 pandemic on sustainable development and the application prospect of nighttime light data in SDG evaluation in the future (Figure 2).
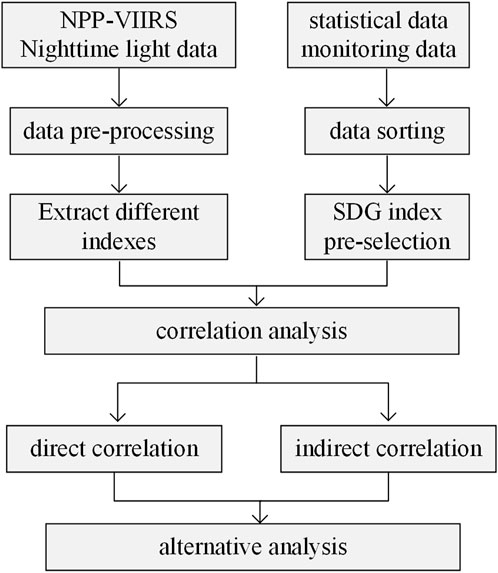
FIGURE 2. Research process.
2.3.2 Nighttime light data processing
2.3.2.1 Data preprocessing
The remote sensing data of nighttime light are denoted with the gray scale of digital numbers (DN). Preprocessing is required before analysis is made with nighttime light data. To avoid the impact of projection deformation on image area calculation, area projection (including Albers) was conducted, and later resampling and clipping were carried out (Shi et al., 2014). A large number of service facilities were discovered in large water areas such as the Dian Lake, Fuxian Lake and Erhai when the nighttime light data of Yunnan Province were processed. Owing to the high light intensity and large area, the lake surface might produce light reflection easily, and the satellite can receive the light reflected from the lake surface. Hence, the lake surface also has a DN value. The maximum light intensity is 2.6. After the expressway or mountainous road is identified, the intensity value reaches about 1. If a uniform threshold is adopted, the lights of most roads will be eliminated, so the changes of passenger and freight development cannot be reflected. Therefore, the DN value should be assigned as 0 after the water area is extracted. In this study, denoising was conducted with noise threshold method according to the comparison results gained via Zheng Tan’s denoising methods. Negative values were obtained during denoising in other areas, but this situation was not explained in CSM/EOG data description, so the negative values were assigned as 0. According to related studies, the threshold value of other areas was assigned as 0.41 (Zheng, 2020), and the processing results are shown in Figure 3.
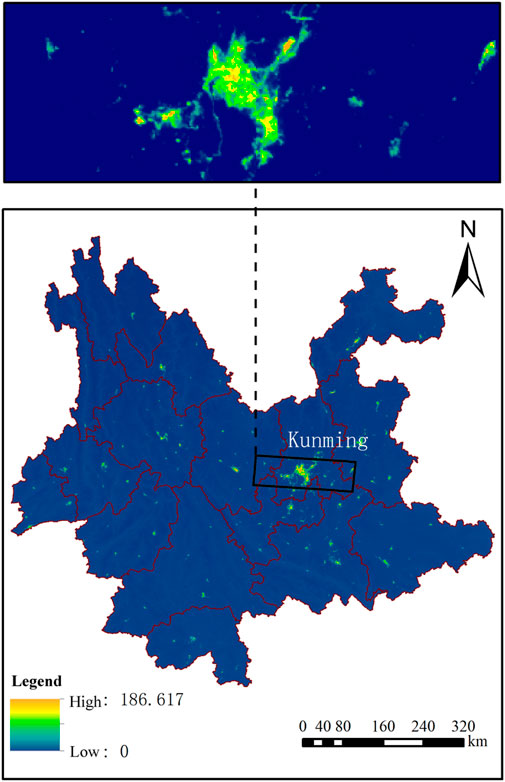
FIGURE 3. Nighttime light in Yunnan Province in 2020.
2.3.2.2 Nighttime light indexes
The existing studies have many methods to express the nighttime light indexes, but previous studies indicate that the total nighttime light index (TNLI) is highly correlated to indicators like social economy, population increase and climate changes. Therefore, this indicator was adopted for research and evaluation (Li et al., 2016; Zhu et al., 2017; Andreano et al., 2020; Wang et al., 2021).
Where TNLI is the total of DN values of lights in the administrative unit; DNi and ni are the pixel value and number of pixels at the ith gray scale in the administrative unit.
2.3.3 Indicator selection
The nighttime light is one of the effective modes to reflect human social activities at night, and the nighttime light intensity and cover area will effectively display the social activities and movement areas. Social activities depend on the local economic, cultural and urban development degree, and the urban development requires government investment in basic services. In this study, the influence degree of the indicator on the region and the substitutability for the light data were considered according to 248 indicators of 17 goals in the Framework for United Nations Sustainable Development Goals, to obtain 16 localization indicators (LIs) for correlation degree analysis. The 16 localization indicators were further grouped into 34 analyzable variables. For example, GDP was divided into GDP gross and GDP of the primary, secondary and tertiary industries. For the convenience of indicator characteristic analysis, the author discussed the validity of light data in SDG indicator evaluation after referring to the studies of scholars like Zheng Xinzhu and Wu Xutong (Zheng et al., 2021; Wu et al., 2022). In this study, the indicators were divided into economic indicators (basic service expenditures, medical workers, number of beds, crop cultivation area, passenger and freight volume, construction land and public space) and environmental indicators (water consumption, PM2.5 and PM10). The specific division is shown in Table 3.
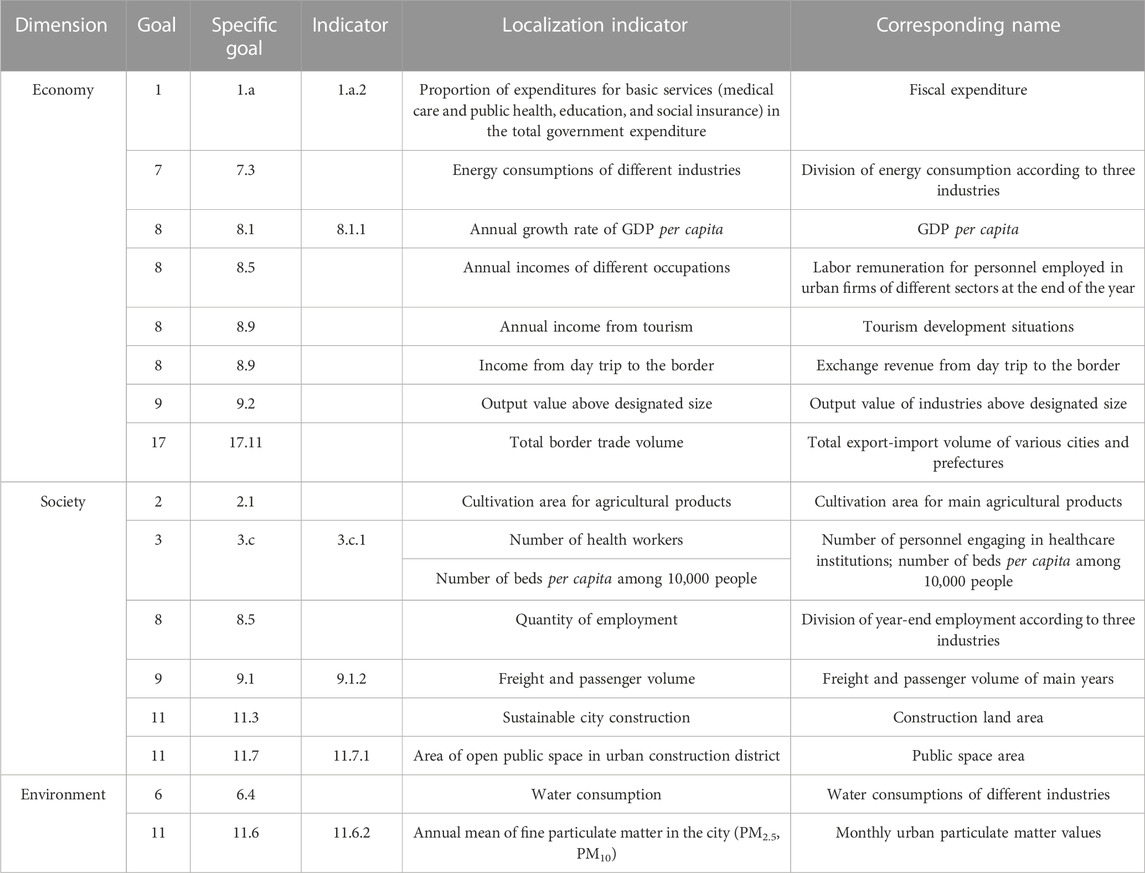
TABLE 3. Localization indicators after screening.
2.3.4 Correlation analysis
Wang, Chen, and Zhen et al. employed linear regression analysis to examine the relationship between NTL and various socio-economic factors, including the economy, population, transportation, energy consumption, environment, and other relevant indicators (Wang et al., 2020; Zheng et al., 2020; Chen et al., 2022). Linear regression offers robust modeling and interpretability, making it the preferred choice for exploring the connection between nighttime lighting and diverse sustainable development metrics. This study investigates the correlation between TNLI and LI from 2016 to 2020.
where
3 Results and analysis
3.1 Correlation between TNLI and various indicators of the whole province
In this study, correlation analysis was made with provincial TNLI and localization indicators, and the results are shown in the 34 specific indicators (Table 4). Four indicators including education expenditure, quantity of employment in the primary industry, quantity of employment in the tertiary industry and urban development land have a significant correlation with TNLI at the level of 0.01, indicating that the 4 indicators are highly related to TNLI; 13 indicators including expenditures for medical care and public health, total energy consumption, energy consumption of the tertiary industry, and total output value have a significant correlation with TNLI at the level of 0.05, indicating that the 13 indicators are highly related to TNLI; 17 indicators including energy consumption of the primary industry, energy consumption of the secondary industry and total tourism income do not have a significant correlation with TNLI, so the correlation between the 17 indicators and TNLI is relatively low, and TNLI cannot be used to substitute these indicators.
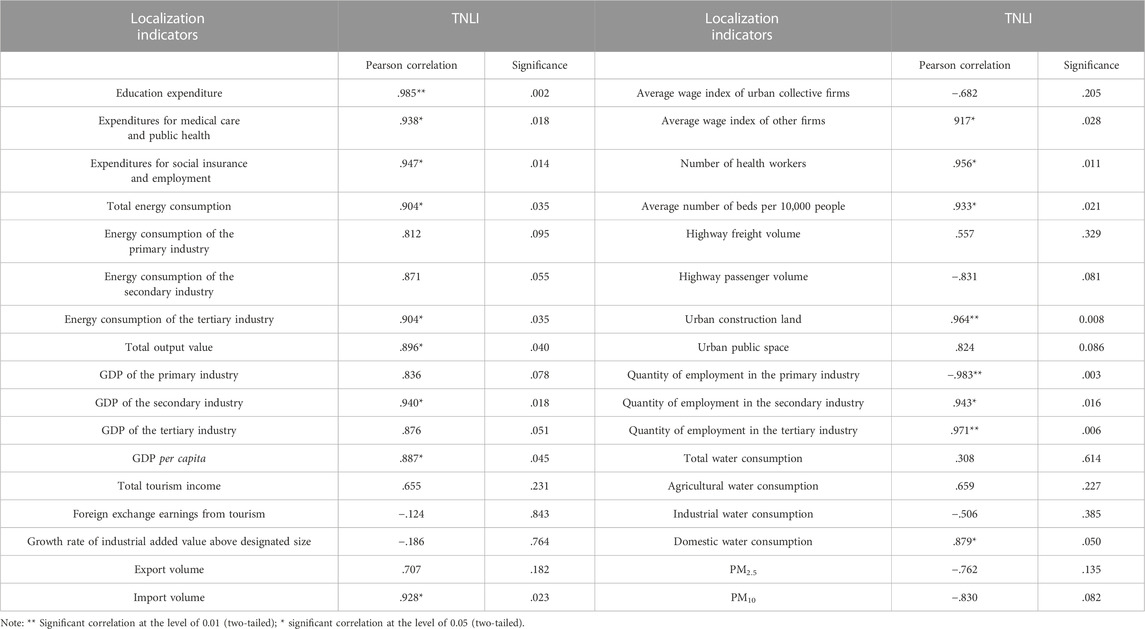
TABLE 4. Correlation between TNLI and provincial indicators.
A contrastive analysis was made after the 34 indicators were classified according to economy, society and environment, and the following results were gained. TNLI showed a high correlation with 10 indicators in 19 subdivided indicators of economic class; TNLI presented a high correlation with 6 indicators in 9 subdivided indicators of social class; TNLI had a high correlation with 1 indicator in 6 subdivided indicators of environmental class. Therefore, TNLI can be used to substitute some related indicators in evaluation, while TNLI has a low correlation with environmental indicators, so the evaluation precision is relatively low.
The total nighttime light index and economic indicators have a significant correlation mainly because the nighttime light can reflect the expansion and activities of a city, and regional economy is the main framework to support urban expansion and nighttime activities. Meanwhile, with the urban expansion and increase of nighttime activities, economic growth can be promoted, and a virtuous circle will be formed. Thereinto, basic service expenditures (education, medical care and public health, social insurance, and employment expenditure) and nighttime light indexes show an obvious correlation, and the basic service expenditures can reflect the developmental level of a city. When the government funds increase obviously in medical care and public health, social insurance, and employment expenditures, it means that the population of the city rises, the economy grows, and the city develops rapidly. As for the nighttime light, the city changes are reflected in the brightness degree and brightness scope. The increase of basic service expenditures indicates urban development, which is reflected as the increase of TNLI. But it is worth thinking about that TNLI has a significant positive correlation with the average wage indexes of state-owned firms and other firms, while it has a negative correlation with the average wage indexes of urban collective firms. Though the significance is low, the trend is obvious. Hence, the social and economic development has produced a certain influence on the development of urban collective firms in Yunnan Province.
The total nighttime light index presents a significant correlation with some social indicators. Thereinto, TNLI has a significant correlation with the quantity of employment; it presents a positive correlation with the population of the secondary industry and tertiary industry, but shows a negative correlation with the population of the primary industry. With the development of the secondary industry, more and more factories are established, the employment demand increases, and the quantity of employment rises. Many large factories have obvious nighttime light brightness, so the quantity of employment in the secondary industry has a significant correlation with the value of TNLI. Yunnan Province is a large tourism province, and its service industry develops rapidly. TNLI and the quantity of employment in the tertiary industry increased year by year from 2016 to 2019, showing a high growth rate. Though the total quantity of employment increased during the COVID-19 pandemic in 2020 when compared with that in the previous year, the growth rate was low. TNLI has a significant correlation with urban construction land, but has no significant correlation with the cultivation area. However, the negative correlation trend is consistent with the urban expansion trend. With the urban expansion, the nighttime light area increases, the total brightness rises, and the agricultural cultivation area decreases. The possible reason of not presenting a significant correlation is as follows. Some plowlands are ecological projects transformed in the activities of returning farmland to forests and returning farmland to grassland, rather than building land. Therefore, the amplitude of light growth is inconsistent with the reduction of agricultural land, which results in a low correlation.
The total nighttime light index has a relatively low correlation with environmental indicators, but the trend is obvious. As for different indicators, the correlation between TNLI and water consumption of the primary and secondary industries is insignificant and no such trend exists. However, it is highly correlated with domestic water consumption. As for the reason, the statistics of domestic water consumption covers service water consumption and common domestic water consumption of the tertiary industry. Besides, the activity degree of service industry is closely associated with the water consumption, so TNLI presents a significant correlation with the domestic water consumption. The value of PM2.5 or PM10 has a negative correlation with TNLI (Chen et al., 2022). This is consistent with Zhang’s results of predicting PM2.5 via VIIRS nighttime light data in Beijing-Tianjin-Hebei region (Zhang et al., 2020). Meanwhile, Xu et al. also constructed a correlation model with PM2.5 by utilizing the DN value of DMSP/OLS nighttime light data in Shanghai, and the results show that the nighttime light index has a significant correlation with PM2.5 (Xu et al., 2015). Zhang and Zhao conducted verification through establishing a model of nighttime light index and PM2.5 in time series, while they selected different areas. However, the overall results are consistent with our research results in Yunnan. Therefore, it is considered that the spaces are connected, so PM2.5 has a correlation with nighttime light index in spatial scale, which can be verified by the fact that the correlation is high in different cities in this study. At the same time, the correlation analysis and prediction model of nighttime light index and PM2.5 is established in time series, so they are correlated in time series.
3.2 Correlation between TNLI and SDG indicators of different cities
Cities at different development levels have significant differences in light intensity and scope. To further analyze the applicability of lights in cities at different development stages, and further measure the correlation between TNLI and various indicators, correlation analysis was made for the localization indicators and TNLI of various cities and prefectures in this study. Besides, the former five indicators having a significant correlation were screened and sorted (Table 5).
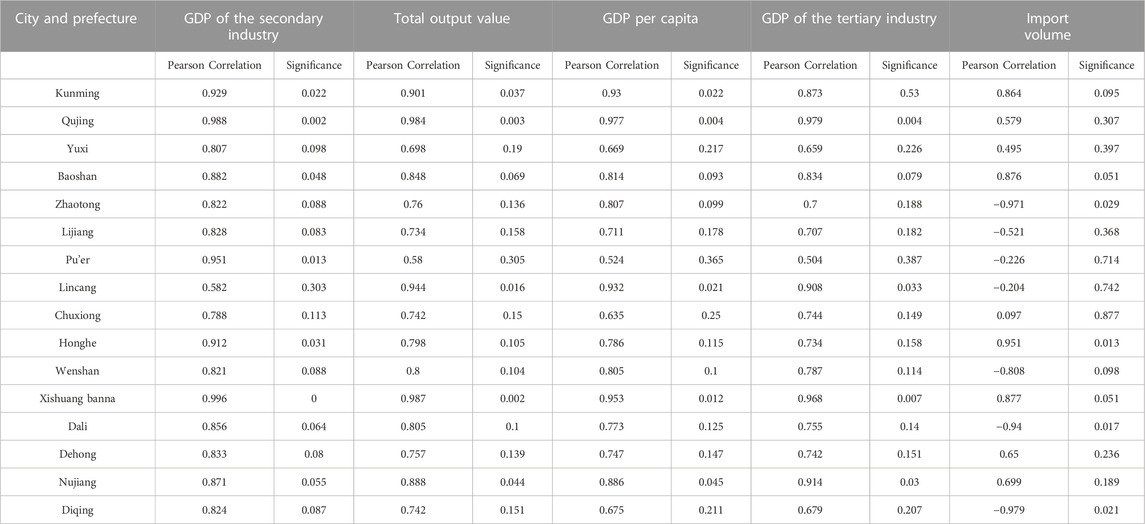
TABLE 5. The former five indicators of each city and prefecture and their correlation degree.
As shown in Table 5, when correlation analysis is made for TNLI and indicators of various cities and prefectures, it is discovered that the most correlated 5 indicators among the 20 segmentation variables are associated with economy. Besides, GDP and TNLI of the tertiary industry present a high significant correlation. In 16 cities and prefectures, 6 ones present a significant correlation between TNLI and GDP of the secondary industry; 5 ones present a significant correlation between TNLI and total output value; 5 ones show a significant correlation between TNLI and GDP per capita; 4 ones display a significant correlation between TNLI and GDP of the tertiary industry; 4 ones present a significant correlation between TNLI and import volume. The results of the 5 indicators are almost consistent with the correlation analysis results of provincial indicators.
Table 5 and Table 6 indicate that the applicable indicators have both similarities and obvious differences. As for the similarities, GDP and TNLI have a significant correlation in various cities and prefectures, but different cities show different types of significantly correlated GDP industries. Thereinto, in Kunming, Qujing, Xishuangbanna, Baoshan, Pu’er and Honghe, TNLI has a significant correlation with GDP of the secondary industry. Kunming, Baoshan, Honghe and Qujing are major industrial cities of Yunnan Province where industrial GDP occupies a high proportion. The growth rate can match the variation trend of the total nighttime light index. Therefore, TNLI can demonstrate the city development structure to some extent. Meanwhile, among the 12 cities and prefectures, the TNLI value of 6 ones is significantly correlated with the import-export volume; the export volume presents a positive correlation with TNLI of nighttime light, and the import volume presents a negative correlation with nighttime light indexes. This clearly shows the variation trend of the social development of Yunnan Province and even China in international trade. With the progress of the urban economy, society, science and technology, China begins to focus on export from import gradually.
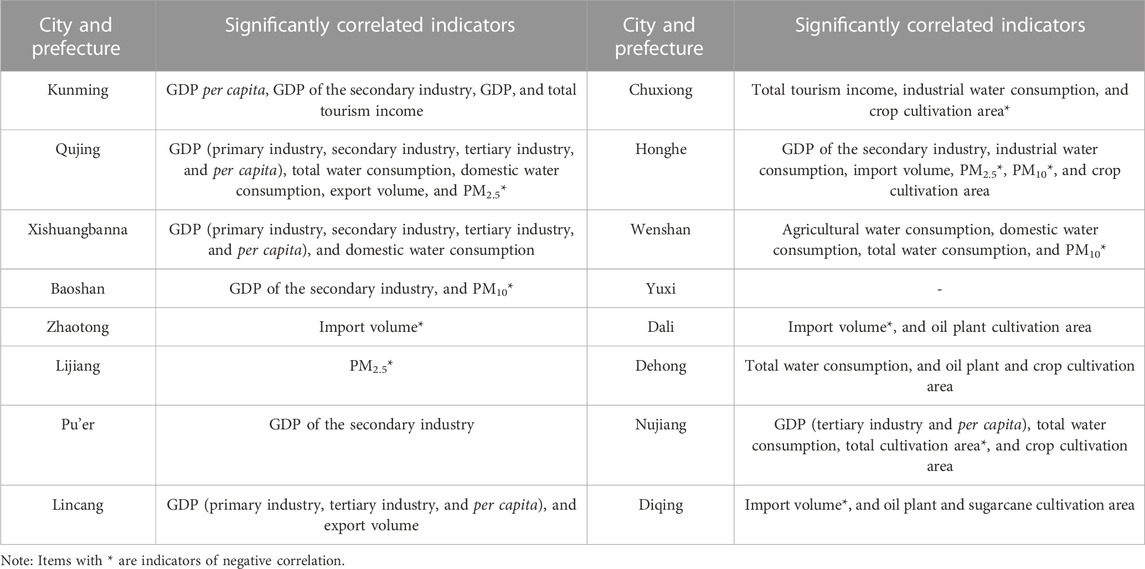
TABLE 6. Indicators related to the visibility of cities and prefectures.
3.3 Changing situations of TNLI and indicators during the COVID-19 pandemic
The COVID-19 pandemic greatly affected human social activities in 2020, and even changed people’s production mode and lifestyle. Therefore, an impact was also produced on the correlation between nighttime light and SDG indicators. The applicability of light remote sensing data can be verified through analysis on the relation between remote sensing data of lights and SDG indicators during the pandemic period. The annual TNLI values from 2016 to 2020 were obtained after the nighttime light images were processed. Results show that the annual total nighttime light index grew from 2016 to 2020, and the nighttime light intensity increased obviously from 2016 to 2019, with the average annual growth above 5.8%. From 2019 to 2020, the growth rate of TNLI obviously dropped to only 2.79%. As for the reason, COVID-19 broke out around the world in the end of 2019, and mass infection appeared. Most of Chinese areas were locked down, to stop the pandemic transmission. Yunnan Province has a long boundary line and complex landform, and many people illegally cross the national border, making pandemic prevention and control the most complicated and difficult here. A large number of border cities closed their borders due to the impact of the pandemic, and suspended the import and export trades. In the first half year of 2020, Yunnan Province took lockdown measures due to the pandemic influence, resulting in the decrease of brightness. In the second half year, the pandemic was controlled, and the economic society began to move orderly, so the economic growth rebounded. Therefore, TNLI started to rise, but the growth rate was low. This situation was consistent with the indicators like GDP of Yunnan Province, and a small growth rate was presented.
According to the analysis on the light weakening areas (Figure 4) in 2020 and 2019, Kunming City is the mega-city of Yunnan Province, central city of Yunnan City Cluster, and important central city of Western China. After the pandemic broke out, the light intensity in densely populated areas weakened obviously, and aggregated weakening was presented in a large area. Moreover, the road lights linked to surrounding cities also showed a trend of extensive weakening. In tourism cities with famous sceneries including Lijiang, Xishuangbanna and Yuxi, the nighttime light weakening areas mainly gathered in hotel clusters of scenic spots, such as regions around Fuxian Lake of Yuxi City, Jinghong of Xishuangbanna, and regions around the seabeach scenic spot of Dali. However, in underdeveloped and sparsely populated cities of border regions including Pu’er, Lincang, Baoshan and Dehong, light weakening mainly happened to road lights, borders and villages. Owing to the impact of the pandemic, the import and export business was strictly controlled in these areas, resulting in poor logistics. However, in Table 4, the highway passenger volume and freight volume show a low correlation coefficient with TNLI. To deeply analyze the relation between passenger and freight volume and TNLI, the road total nighttime light index (RTNLI) was extracted, and the correlation with passenger and freight volume was calculated. After road network extraction, correlation analysis was made for RTNLI and various indicators like passenger volume and freight volume, and the results are shown in Table 7. The passenger volume has a negative correlation with RTNLI, and the freight volume shows a positive correlation with RTNLI. Besides, RTNLI has a low correlation with the freight volume, as many urban road networks overlap building lights in the process of road network extraction. The urban road network brightness is influenced by building lights and roads, so unusually high values of nighttime light intensity appear. As a result, RTNLI has a low correlation with indicators like passenger volume and freight volume, and the road network should be further extracted and analyzed.
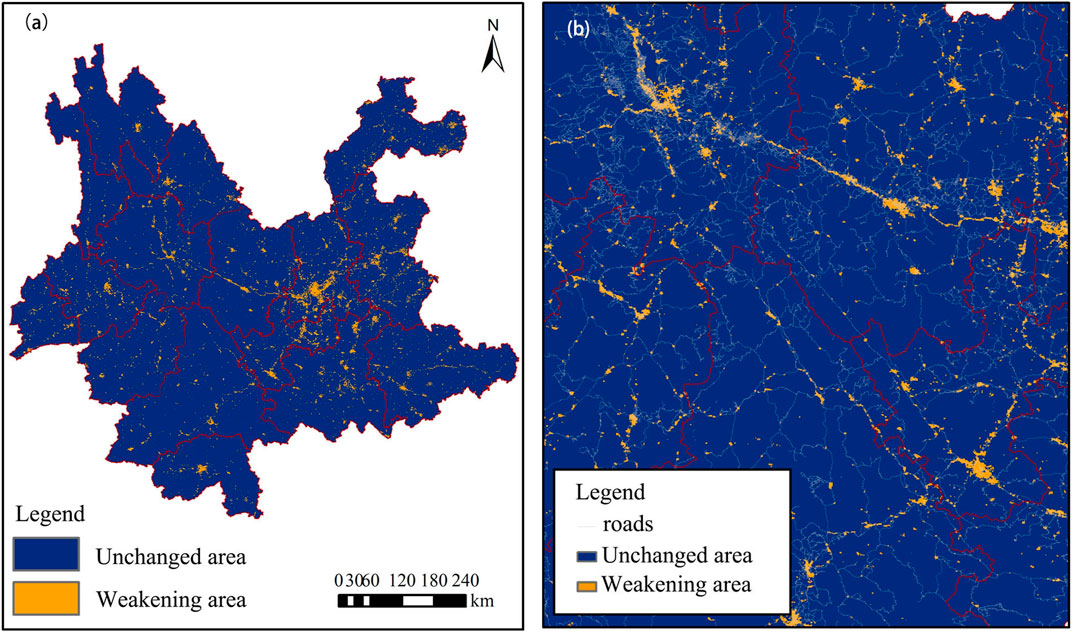
FIGURE 4. Nighttime light weakening area in Yunnan Province from 2019 to 2020 (A) and nighttime light weakening area overlaps with road network (B).
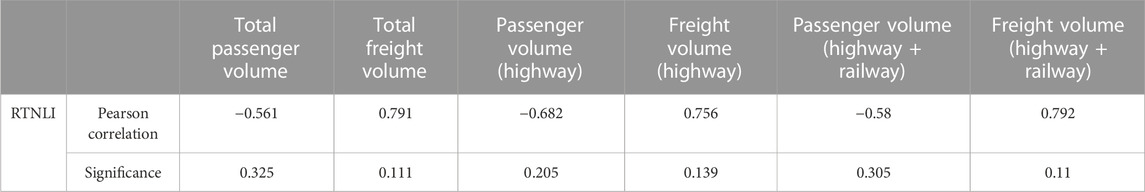
TABLE 7. Correlation between RTNLI and road indicators.
As early as 2020, some researchers had used NTL data to analyze the regional and global and human reactions to COVID-19. Elvidge et al. the degree of change in NTL light and darkness in residential administrative units of the Chinese population before and after the epidemic, demonstrating the feasibility of using nighttime lighting as a proxy to monitor the fluctuations in economic activity levels (Elvidge et al., 2020). Wang et al. examined the impact of the COVID-19 pandemic in Toronto, Canada, on residential areas, public facilities, and commercial areas to gain an initial understanding of how the pandemic affected human (Wang et al., 2022). Beyer et al. analyzed economic changes in India during the pandemic using nighttime light data and daily electricity consumption data (Beyer et al., 2020). The combination of our research in Yunnan Province with other regions and reveals profound connections between nighttime lighting data and disease outbreaks. While these connections may not be directly caused by an outbreak, they provide crucial information changes in socio-economic and human activities, aiding our understanding and response to such outbreaks. Economic Activity: Nighttime lighting data can effectively reflect the level of activity. During an outbreak, governments may impose lockdowns or restrictions, leading to business closures, labor shortages, and supply chain disruptions. These changes manifest in nighttime lighting data as businesses close or reduce their operating hours, leading to diminished lighting. Human Behavior: Nighttime lighting data can also capture changes in human behavior. During an outbreak, individuals may self-isolation, stay at home, reduce social interactions, and limit nighttime outings, in a decrease in nighttime lighting. Moreover, curfews and indoor occupancy restrictions can further influence nighttime lighting Consequently, nighttime lighting data can serve as a valuable monitoring tool in large-scale health emergencies, aiding decision-making and resource allocation.
4 Discussion
4.1 Nature of correlations and substitutability degree between nighttime light index and SDG indicators
Nighttime light imagery captures the temporal patterns, spatial extent, and intensity of human activities by utilizing visible and near-infrared wavelengths. Sustainable development entails the harmonious progression of human economy, society, terrestrial resources, and environment. Sustainable development indicators can measure the progress of human advancement towards sustainability and the potential of future sustainable development. Therefore, the inherent correlation between nighttime light indexes and SDG indicators lies in the interconnection between human economic and social activities and the global resources and environment (Henderson et al., 2018). By establishing links between nighttime light indexes and indicators of human social activities as well as the interrelations between human activities and resource-environment indicators, a certain scope of the relationship between nighttime light and the three dimensions of SDG indicators—economic, social, and environmental—can be delineated. Simultaneously, synergies and trade-offs exist among SDG indicators, which are intricate (Miao et al., 2022). Through these relationships, seemingly unrelated indicators can be further associated with nighttime light indexes.
4.2 Result differences caused by nighttime light sensors of different types
With the development of human society, the progress of remote sensing technology and the increase of human demand for development region, situation and development density, the Nightsat satellite system has become increasingly mature (Elvidge et al., 2007). Nighttime light data widely used at present also include Defense Meteorological Satellite Program/Operational Linescan System (DMSP/OLS) data from the United States Department of Defense in 1992, photographs from the International Space Station (ISS-P) NTL data jointly issued by countries like the US and Russia in 2000, luojia1-01 (LJ1-01) NTL data operated by Wuhan University, China in 2018, and SDGSAT-1 NTL data newly released in 2021. The different technological levels of these sensors have led to performance differences (Jiang et al., 2018), as shown in Table 8.
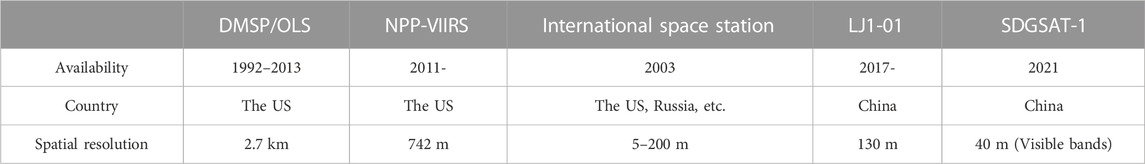
TABLE 8. Nighttime light sensors of different types.
This study did not consider the influence degree of different nighttime light sensors on the correlation between substitutive indicators. However, scholars have proven that the model accuracy can be increased with a higher resolution ratio and long observation time series. Guo meticulously compared and analyzed the abilities of many different sensors to investigate the spatial variability. Results indicate that SDGsat-1 NTL images are superior to VIIRS-DNB and LJ1-01 images in spectrum and spatial resolution, and better than ISS-P, LJ1-01 and VIIRS-DNB images in the ability of differentiating various land-use types with RGB wave band and gray intensity (Guo et al., 2023). Zhang also made a correlation analysis on LJ1-01 and NPP-VIIRS NTL data and PM2.5, and the results show that LJ-1 data have revealed extra details and increased the precision of predicting PM2.5 (Zhang et al., 2020).
4.3 Global applicability of substitutive indicators
Through analyzing the correlation between nighttime light index and SDG indicators, this study tries to make up the defect of traditional survey data in update frequency, which is a common problem all over the world. Moreover, it expects to strengthen dynamic monitoring and regulation on the sustainable development level of cities. The feasibility of this idea in Yunnan Province has been verified in this study, but no study is conducted in a global scale. However, scholars of other countries made a correlation analysis on the single indicator. Corona evaluated the political and economic activity indicators of Mexico (IAEM) with nighttime light data, and realized improvement (Corona et al., 2023). Galimberti assessed the usefulness of satellite-based nighttime light data for predicting the annual GDP growth of 167 countries around the world from 1993 to 2014, and the results indicate that nighttime light data and GDP have a significant correlation (Galimberti, 2020). Hasi Bagan made a correlation analysis on the construction areas and nighttime light data of 50 cities around the world, and the results show that the nighttime light data are corresponding to the building zone density (Bagan et al., 2019). Meanwhile, many scholars have verified the relation between nighttime light data and PM2.5 and PM10 (Ji et al., 2018). The above studies can support the substitutability analysis of nighttime light data for some missing SDG indicators around the world, while the results in different countries vary greatly.
5 Limits
In this study, some indicators have a low correlation with TNLI, which is inconsistent with the expected results. Factors causing such results might include the following. First, various indicators are not uniformly distributed: economic indicators occupy nearly 56% of the 34 indicators, social indicators take up 26%, and environmental indicators account for 18%. Therefore, owing to the lack of subdivided indicators, the correlation between nighttime light data and various types cannot be completely reflected. Second, different types of indicators vary in the intrinsic correlation: economic indicators present the highest intrinsic correlation, while environmental indicators show the lowest intrinsic correlation. Third, only the total nighttime light index was used to represent the nighttime light index in this study. The studies of some scholars show that the total nighttime light index is the most sensitive to human social activities, but different types of indicators might have different correlations with different nighttime light indexes. Fourth, the time series was short in this study, and an analysis was made for the correlation between nighttime light intensity and SDG indicators from 2015 to 2020 only, while some indicators require a long time series to observe their correlation with nighttime light intensity. Finally, COVID-19 has produced a long and persistent impact on social development. However, only the first year of COVID-19 was analyzed in this study, and no continuous study or analysis was carried out. Therefore, it cannot fully reflect the advantage of using nighttime light data to analyze social changes after COVID-19. Meanwhile, it is also the most regrettable that only nighttime light data were adopted to study the substitutability for SDG indicators in this paper, while other data sources were not excavated. Hence, severe deficiency still exists in substitutability, and few assistances can be provided for dynamic contrast on sustainable development between countries.
Based on the above factors which cannot be considered or realized temporarily, the author of this paper will try to focus on the following points, and make in-depth analysis. In research data, a longer time series will be chosen with the development of COVID-19, to obtain uniformly distributed classification indicators. In the aspect of research methods, a correlation analysis will be made with different indicators like average light intensity, composite light index and light-area ratio, to find out the most appropriate indicators. Moreover, different correlation equations will be applied in the future, and multiple correlations will be added when the relation between data is considered, to discover more complicated relations between nighttime light indexes and SDG indicators. Moreover, other multi-source data will be integrated, to explore faster evaluation methods with strong applicability in the future.
6 Conclusion
Through considering the influence of SDG evaluation indicators on the region and the substitutability for light data, 16 localization indicators were obtained and further divided into 34 subdivided indicators. After an analysis was made for the correlation between total nighttime light index and these subdivided indicators of Yunnan Province from 2016 to 2020, the following results have been gained. 1. Among the 34 subdivided indicators, TNLI has a significant correlation with 20 indicators, so it is highly feasible to evaluate the substitutability of nighttime light data for SDG indicators. Thereinto, 1. a.2 (proportion of the basic service expenditure in the total government expenditure), 8.1.1 (annual growth rate of GDP per capita) and 3. c.1 (number of health workers and number of beds per capita among 10,000 people) have a relatively high correlation with the total nighttime light index, so the total nighttime light index can be applied for substitution evaluation. 2. The 34 indicators were divided into economic, social and environmental classes, and the following conclusions have been obtained: TNLI has a significant correlation with 10 economic indicators among the 19 ones, a significant correlation with 6 social indicators among the 9 ones, and a significant correlation with 1 environmental indicator among the 6 ones. Therefore, substitution evaluation of nighttime light is more applicable to economic and social indicators, while the performance in environmental indicators is not good. 3. The nighttime light data have different correlations with various industries. Generally speaking, the total nighttime light index shows a relatively high correlation with the secondary and tertiary industries. In addition, the leading industries of different cities can be judged according to the correlation between nighttime light data and GDP and total energy consumption of different industries. 4. During the COVID-19 pandemic, the total nighttime light index and GDP of Yunnan Province in the year presented a decreasing growth rate but a slight increase in the total quantity. TNLI has a relatively high correlation with indicators affected by the pandemic, such as quantity of employment and wage index. These indexes can reflect the influence degree of the pandemic on the local society to some extent and the bad consequences caused to sustainable development by such influence. Therefore, the total nighttime light index can be choosen to analyze the influence of the pandemic on sustainable development.
Data availability statement
The original contributions presented in the study are included in the article/supplementary material, further inquiries can be directed to the corresponding author.
Author contributions
XQ: Conceptualization, Methodology, Resources, Software, Writing–original draft. XS: Formal Analysis, Writing–review and editing. JM: Data curation, Investigation, Visualization, Writing–review and editing. CH: Funding acquisition, Project administration, Validation, Writing–review and editing. FG: Supervision, Validation, Writing–review and editing. JL: Validation, Writing–review and editing. LY: Writing–review and editing.
Funding
The author(s) declare financial support was received for the research, authorship, and/or publication of this article. This work is supported by the Open Research Program of the International Research Center of Big Data for Sustainable Development Goals, Grant No. CBAS2023ORP04.
Acknowledgments
The authors would like to thank the editor and reviewers for their valuable comments.
Conflict of interest
The authors declare that the research was conducted in the absence of any commercial or financial relationships that could be construed as a potential conflict of interest.
Publisher’s note
All claims expressed in this article are solely those of the authors and do not necessarily represent those of their affiliated organizations, or those of the publisher, the editors and the reviewers. Any product that may be evaluated in this article, or claim that may be made by its manufacturer, is not guaranteed or endorsed by the publisher.
References
Andreano, M. S., Benedetti, R., Piersimoni, F., and Savio, G. (2020). Mapping poverty of Latin American and caribbean countries from heaven through night-light satellite images. Soc. Indic. Res. 156, 533–562. doi:10.1007/s11205-020-02267-1
Bagan, H., Borjigin, H., and Yamagata, Y. (2019). Assessing nighttime lights for mapping the urban areas of 50 cities across the globe. Environ. Plan. B Urban Anal. City Sci. 46 (6), 1097–1114. doi:10.1177/2399808317752926
Beyer, R. C. M., Franco-Bedoya, S., and Galdo, V. (2020). Examining the economic impact of COVID-19 in India through daily electricity consumption and nighttime light intensity. World Dev. 140, 105287. doi:10.1016/j.worlddev.2020.105287
Cao, Z. Y. (2016). Estimating the spatial distribution of GDP based on nighttime light image and analysis of correlation between it and PM(2.5) concentration. dissertation/doctor’s thesis. Guangzhou: Guangzhou Institute of Geochemistry, CAS.
Chen, H. J., Xu, Y. M., Mo, Y. P., Zhang, Y., and Zhang, Z. Y. (2022). Estimating nighttime PM2.5 concentrations in Huai’an based on NPP/VIIRS nighttime light data. Acta Sci. Circumstantiae 42 (3), 342–351. doi:10.13671/j.hjkxxb.2021.0242
Corona, F., Villaseñor, E. A., López-Pérez, J., and Suárez, R. R. (2023). Estimating Mexican municipal-level economic activity indicators using nighttime lights. Empir. Econ. 65, 1197–1214. doi:10.1007/s00181-023-02376-z
Deng, X. Q., Zhang, X., Hu, C. H., Song, Z. W., Jia, P., and Wang, L. M. (2022). Current status of research on the relationship between nighttime lighting and obesity. Chin. J. Prev. Contr Chron. Dis. 30 (1), 58–61. doi:10.16386/j.cjpccd.issn.1004-6194.2022.01.014
Du, H. B., Wei, W., Zhang, X. Y., and Ji, X. P. (2021). Spatio-temporal evolution and influencing factors of energy-related carbon emissions in the Yellow River Basin: based on the DMSP/OLS and NPP/VIIRS nighttime light data. Geogr. Res. 40 (07), 2051–2065. doi:10.11821/dlyj020200646
Du, R. H., Liu, L. Z., Shen, Q., Tian, F., Chen, M., and Wu, J. J. (2020). Dynamic monitoring for post-disaster recovery and reconstruction based on night light data--A case study on Ludian earthquake. J. Nat. Disasters 29 (6), 59–69. doi:10.13577/j.jnd.2020.0607
Elvidge, C. D., Cinzano, P., Pettit, D. R., Arvesen, J., Sutton, P., Small, C., et al. (2007). The Nightsat mission concept. Int. J. Remote Sens. 28 (12), 2645–2670. doi:10.1080/01431160600981525
Elvidge, C. D., Ghosh, T., Hsu, F. C., Zhizhin, M., and Bazilian, M. (2020). The dimming of lights in China during the COVID-19 pandemic. Remote Sens. 12, 2851. doi:10.3390/rs12172851
Elvidge, C. D., Zhizhin, M., Ghosh, T., Hsu, F. C., and Taneja, J. (2021). Annual time series of global VIIRS nighttime lights derived from monthly averages: 2012 to 2019. Remote Sens. 13 (5), 922. doi:10.3390/rs13050922
Falchetta, G., Pachauri, S., Byers, E., Danylo, O., and Parkinson, S. C. (2020). Satellite observations reveal inequalities in the progress and effectiveness of recent electrification in sub-saharan Africa. One Earth 2 (4), 364–379. doi:10.1016/j.oneear.2020.03.007
Galimberti, J. K. (2020). Forecasting GDP growth from outer space. Oxf. Bull. Econ. Stat. 82 (4), 697–722. doi:10.1111/obes.12361
Guo, B. Y., Hu, D. Y., and Zheng, Q. M. (2023a). Potentiality of SDGSAT-1 glimmer imagery to investigate the spatial variability in nighttime lights. Int. J. Appl. Earth Observation Geoinformation 119, 103313. doi:10.1016/j.jag.2023.103313
Guo, H. D., Chen, F., Sun, Z. C., Liu, J., and Liang, D. (2021a). Big earth data: a practice of sustainability science to achieve the sustainable development goals. Sci. Bull. 66, 1050–1053. doi:10.1016/J.SCIB.2021.01.012
Guo, H. D., Dou, C. Y., Chen, H. Y., Liu, J. B., Fu, B. H., Li, X. M., et al. (2023b). SDGSAT-1: the world’s first scientific satellite for sustainable development goals. Sci. Bull. 68 (01), 34–38. doi:10.1016/j.scib.2022.12.014
Guo, H. D., Liang, D., Chen, F., Sun, Z. C., and Liu, J. (2021b). Big earth data facilitates sustainable development goals. Bull. Chin. Acad. Sci. 36 (08), 874–884. doi:10.16418/j.issn.1000-3045.20210707006
Henderson, J. V., Squires, T., Storeygard, A., and Weil, D. (2018). The global distribution of economic activity: nature, history, and the role of trade. Q. J. Econ. 133 (1), 357–406. doi:10.1093/qje/qjx030
Ji, G. X., Zhao, J. C., Yang, X., Yue, Y. L., and Wang, Z. (2018). Exploring China’s 21-year PM10 emissions spatiotemporal variations by DMSP-OLS nighttime stable light data. Atmos. Environ. 191, 132–141. doi:10.1016/j.atmosenv.2018.07.045
Jiang, L. G., Yang, C., and Liu, Y. (2021). Spatiotemporal changes of economic and social development in Laos based on nighttime light data, 1992-2020. Resour. Sci. 43 (12), 2381–2392. doi:10.18402/resci.2021.12.02
Jiang, W., He, G., Long, T., Guo, H., Yin, R., Leng, W., et al. (2018). Potentiality of using luojia 1-01 nighttime light imagery to investigate artificial light pollution. Sensors (Basel) 18 (9), 2900. doi:10.3390/s18092900
Jiang, Y., Hao, Y. Y., and Huang, Y. C. (2022). Characteristics of urban expansion and vegetation change in built-up areas of Gan-Qing-Ning based on nighttime light data. Acta Ecol. Sin. 42 (10), 3974–3988. doi:10.5846/stxb202005141227
Li, D., and Li, X. (2015). An overview on data mining of nighttime light remote sensing. Acta Geod. Cartogr. Sinica 44 (6), 591–601. doi:10.11947/j.AGCS.2015.20150149
Li, D. R., Zhang, G., Shen, X., Zhong, X., Jiang, Y. H., Wang, T. Y., et al. (2019a). Design and processing nightlight remote sensing of LJ-1 01 satellite. J. Remote Sens. 23 (6), 1011–1022. doi:10.11834/jrs.20199327
Li, F., Mi, X. N., Liu, J., and Liu, X. Y. (2016). Spatialization of GDP in Beijing using NPP – VIIRS data. Remote Sens. Land Resour. 28 (3), 19–24. doi:10.6046/gtzyyg.2016.03.04
Li, G. E., Chang, L. Y., Liu, X. J., Su, S. L., Cai, Z. L., Huang, X. R., et al. (2019b). Monitoring the spatiotemporal dynamics of poor counties in China: implications for global sustainable development goals. J. Clean. Prod. 227, 392–404. doi:10.1016/j.jclepro.2019.04.135
Li, X., Zhu, J., Yin, X. D., and Yao, J. C. (2021). Spatializing GDP of Guangdong province based on luojia No.1 night light data. Remote Sens. Inf. 36 (2), 40–45. doi:10.3969/J.ISSN.1000-3177.2021.02.006
Liao, S. B., Cai, H., Yuan, Y. Q., Zhang, B. B., and Li, Y. P. (2022). Impact of regional economic development represented by nighttime light on the prevalence rate of elderly hypertension and type 2 diabetes. J. Geo- Inf. Sci. 22 (11), 2177–2187. doi:10.12082/dqxxkx.2020.190743
Lo, C. P. (2001). Modeling the population of China using DMSP operational linescan system nighttime data. Photogrammetric Eng. Remote Sens. 67 (9), 1037–1047.
Ma, Z. Y., and Xiao, H. W. (2017). Spatiotemporal simulation study of China's provincial carbon emissions based on satellite night lighting data. China Popul. Resour. Environ. 27 (9), 143. doi:10.12062/cpre.20170502
Miao, J. X., Song, X. Y., Feng, R. H., Quan, X. F., and Gao, F. (2022). Study on the interaction between sustainable development goals in underdeveloped mountainous areas:a case study of Lincang, Yunnan Province. Adv. Earth Sci. 37 (9), 949–962. doi:10.11867/j.issn.1001-8166.2022.062
Ministry of Foreign Affairs of the People’s Republic of China (2021). Big earth data in support of the sustainable development goals. Avaliable at: https://www.mfa.gov.cn/irs-c-web/search2.shtml?code=17e50b79272&searchWord=sustainable%2520development%2520goals&dataTypeId=25&searchBy=title (Accessed September 5, 2022).
Niu, Y. W., Zhao, X. C., and Hu, Y. J. (2021). Spatial variation of carbon emission from county land use in Chang-Zhu-Tan area based on NPP-VIIRS night light. Acta Sci. Circumstantiae 41 (9), 3847–3856. doi:10.13671/j.hjkxxb.2021.0281
Peng, B., Zhang, Q., Liu, L. C., and Sun, W. J. (2022). Estimating dynamics of development balance in Xinjiang autonomous region: evidence from the nighttime lighting dataset. Sci. Surv. Mapp. 47 (01), 133–141. doi:10.16251/j.cnki.1009-2307.2022.01.016
Rahman, M. M., Avter, R., Ahmad, S., Inostroza, L., Misra, P., Kumar, P., et al. (2021). Does building development in Dhaka comply with land use zoning? An analysis using nighttime light and digital building heights. Sustain. Sci. 16, 1323–1340. doi:10.1007/s11625-021-00923-0
Shen, X. (2021). Lincang: building a national sustainable development demonstration area. China Sustain. Trib. Z2, 83–85.
Shi, K. F., Yu, B. L., Huang, Y. X., Hu, Y. J., Yin, B., Chen, Z. Q., et al. (2014). Evaluating the ability of NPP-VIIRS nighttime light data to estimate the gross domestic product and the electric power consumption of China at multiple scales: a comparison with DMSP-OLS data. Remote Sens. 6, 1705–1724. doi:10.3390/rs6021705
Shu, S., Yu, B. L., Wu, J., and Liu, H. X. (2011). Methods for deriving urban built-up area using night-light data: assessment and application. Remote Sens. Technol. Appl. 26 (2), 169–176. doi:10.11873/j.issn.1004-0323.2011.2.169
Song, X. Y., Gao, J., Li, X., Li, W. Y., Zhang, Z. H., Wang, L. C., et al. (2018). Urban sustainability evaluation based on remote sensing and network data support: progress and prospect. Adv. Earth Sci. 33 (10), 1075–1083. doi:10.11867/j.issn.1001-8166.2018.10.1075
Su, Y. X., Chen, X. Z., Ye, Y. Y., Wu, Q. T., Zhang, H. O., Huang, N. S., et al. (2013). The characteristics and mechanisms of carbon emissions from energy consumption in China using DMSP/OLS night light imageries. Acta Geogr. Sin. 68 (11), 1513–1526. doi:10.11821/dlxb201311007
The State Council of the People’s Republic of China (2016). China’s national plan on implementation of the 2030 agenda for sustainable development. Avaliable at: https://www.gov.cn/xinwen/2016-10/13/5118514/files/44cb945589874551a85d49841b568f18.pdf (Accessed September 5, 2022).
Wang, L., Wang, J., Fatholahi, S. N., Chapman, M. A., Chen, Y., and Li, J. (2022a). “Assessing the impact of covid-19 on human activities in the greater Toronto area by nighttime light images and active covid-19 cases,” in IGARSS 2022 - 2022 IEEE International Geoscience and Remote Sensing Symposium, Kuala Lumpur, Malaysia, 17-22 July 2022 (IEEE), 7847–7850. doi:10.1109/IGARSS46834.2022.9884325
Wang, M. J., Wang, Y. J., Teng, F., Li, S. C., Lin, Y. H., and Cai, H. F. (2022b). China’s poverty assessment and analysis under the framework of the UN SDGs based on multisource remote sensing data. Geo-spatial Inf. Sci. 2022, 1–21. doi:10.1080/10095020.2022.2108346
Wang, Y., Huang, C., Feng, Y., Zhao, M., and Gu, J. (2020). Using earth observation for monitoring SDG 11.3.1-ratio of land consumption rate to population growth rate in mainland China. Remote Sens. 12, 357. doi:10.3390/rs12030357
Wang, Z., Jia, G. X., Zhang, Q. L., and Huang, Y. (2021). Impacts of COVID-19 epidemic on the spatial distribution of GDP contributed by secondary and tertiary industries in Guangdong Province in the first quarter of 2020. Remote Sens. Nat. Resour. 33 (3), 184–193. doi:10.6046/zrzyyg.2020340
Wu, X. T., Fu, B. J., Wang, S., Song, S., Li, Y. J., Xu, Z. C., et al. (2022). Decoupling of SDGs followed by re-coupling as sustainable development progresses. Nat. Sustain 5, 452–459. doi:10.1038/s41893-022-00868-x
Wu, Y. Z., Shi, K. F., Yu, B. L., and Li, C. L. (2021). Analysis of the impact of urban sprawl on haze pollution based on the NPP-VIIRS nighttime light remote sensing data. Geomatics Inf. Sci. Wuhan Univ. 46 (5), 777–789. doi:10.13203/j.whugis20200455
Xu, Z., Xia, X., Liu, X., and Qian, Z. (2015). Combining DMSP/OLS nighttime light with echo state network for prediction of daily PM2.5 average concentrations in Shanghai, China. Atmosphere 6, 1507–1520. doi:10.3390/atmos6101507
Yang, C. S., Yu, B. L., Chen, Z. Q., Song, W., Zhou, Y. Y., Li, X., et al. (2019). A spatial-socioeconomic urban development status curve from NPP-VIIRS nighttime light data. Remote Sens. 11 (20), 2398. doi:10.3390/rs11202398
Yu, B., Tang, M., Wu, Q. S., Yang, C. S., Deng, S. Q., Shi, K. F., et al. (2018). Urban built-up area extraction from log-transformed NPP-VIIRS nighttime light composite data. IEEE Geoscience Remote Sens. Lett. 15 (8), 1279–1283. doi:10.1109/LGRS.2018.2830797
Yu, B. L., Wang, C. X., Gong, W. K., Chen, Z. Q., Shi, K. F., Wu, B., et al. (2021). Nighttime light remote sensing and urban studies: data, methods, applications, and prospects. Natl. Remote Sens. Bull. 25 (1), 342–364. doi:10.11834/jrs.20211018
Zhang, G., Shi, Y., and Xu, M. (2020). Evaluation of LJ1-01 nighttime light imagery for estimating monthly PM2.5 concentration: a comparison with NPP-VIIRS nighttime light data. IEEE J. Sel. Top. Appl. Earth Observations Remote Sens. 13, 3618–3632. doi:10.1109/JSTARS.2020.3002671
Zhao, X., Li, X., Zhou, Y. Y., and Li, D. R. (2020). Analyzing urban spatial connectivity using night light observations: a case study of three representative urban agglomerations in China. IEEE J. Sel. Top. Appl. Earth Observations Remote Sens. 13, 1097–1108. doi:10.1109/JSTARS.2020.2980514
Zheng, Q. (2020). Simulation of China's socioeconomic indicator based on long-time series nighttime light remote sensing. dissertation/Master’s thesis. Jilin: Jilin university.
Zheng, X. Z., Wang, R. R., Hoekstra, A. Y., Krol, M. S., Zhang, Y. X., Guo, K. D., et al. (2021). Consideration of culture is vital if we are to achieve the Sustainable Development Goals. One Earth 4 (2), 307–319. doi:10.1016/j.oneear.2021.01.012
Zhou, L., Chen, J., Shi, P. J., Gu, Z. H., Fan, Y. D., and Ichinose, T. (2005). Modeling population density of China in 1998 based on DMSP/OLS nighttime light image. Acta Geogr. Sin. 60 (02), 266–176. doi:10.3321/j.issn:0375-5444.2005.02.010
Keywords: sustainable development, nighttime light, SDG indicator, correlation, COVID-19 pandemic
Citation: Quan X, Song X, Miao J, Huang C, Gao F, Li J and Ying L (2023) Study on the substitutability of nighttime light data for SDG indicators: a case study of Yunnan Province. Front. Environ. Sci. 11:1309547. doi: 10.3389/fenvs.2023.1309547
Received: 08 October 2023; Accepted: 30 October 2023;
Published: 10 November 2023.
Edited by:
Fan Mo, Ministry of Natural Resources of the People’s Republic of China, ChinaReviewed by:
Fanglei Zhong, Minzu University of China, ChinaHong Zhu, Institute of Disaster Prevention, China
Copyright © 2023 Quan, Song, Miao, Huang, Gao, Li and Ying. This is an open-access article distributed under the terms of the Creative Commons Attribution License (CC BY). The use, distribution or reproduction in other forums is permitted, provided the original author(s) and the copyright owner(s) are credited and that the original publication in this journal is cited, in accordance with accepted academic practice. No use, distribution or reproduction is permitted which does not comply with these terms.
*Correspondence: Xiaoyu Song, songxiaoyu@nieer.ac.cn