
94% of researchers rate our articles as excellent or good
Learn more about the work of our research integrity team to safeguard the quality of each article we publish.
Find out more
ORIGINAL RESEARCH article
Front. Environ. Sci., 31 August 2023
Sec. Environmental Informatics and Remote Sensing
Volume 11 - 2023 | https://doi.org/10.3389/fenvs.2023.1261339
This article is part of the Research TopicSatellite Remote Sensing Data Processing and its Environmental ApplicationView all 7 articles
 Yongqiang Cao1
 Jing Li1*
 Linfu Xie2*
 Jiaqi Yao1Kexin Li3Ningyue Zhang1Xinhui Ji1Mengran Wang1Fan Mo4Haoran Zhai4
Water resource consumption, energy consumption, and carbon emissions are key factors that restrict the level of regional development and affect the quality of the regional ecological environment. This study investigates three provinces in Northeastern China, using remote sensing and historical data from the period 2001–2019 to analyze the spatiotemporal trends of water and energy consumption, and carbon emissions. Using the AHP-entropy weight method, comprehensive analysis method, and system dynamics research method, the coupling relationships of the three subsystems (water‒energy‒carbon, WEC) were determined, and the development and changes over the next 20 years were simulated. The results show that: 1) Over the period 2001–2019, the comprehensive index of the WEC system in the three Northeastern provinces ranged from 0.0994 to 0.2314. 2) Over the period 2001–2019, the coupling degree of the WEC system in the three Northeastern provinces ranged from 0.9457 to 0.9985, equating to a high coupling stage level. However, the level of coupling coordination was low, with values ranging from 0.3151 to 0.4780, equating to a state of mild disorder or near disorder. 3) During the study period, water resource consumption, energy consumption, and carbon emissions all showed an increasing trend, with the former having the fastest growth rate. This study is of great significance for promoting the sustainable utilization of resources and green and low-carbon development in the three studied Northeastern provinces of China.
Analyze the trends of water resources, energy and carbon emissions.
The dynamic model of “water-energy-carbon” system is constructed.
The coupling relationship of “water-energy-carbon” system is clarified.
Predict the changing trend of water-energy-carbon under different scenarios.
Energy and water are the basic resources for economic development. Excessive utilization of these resources will aggravate the contradiction between supply and demand, and cause environmental pollution. With the rapid development of human society, increasing amounts of fossil fuels are being used, especially in the era of industrial revolution, and large-scale carbon dioxide emissions into the atmosphere are exacerbating global warming (Zhang, 2022). According to the IPCC Sixth Climate Change Assessment Report, the global surface temperature during the period 2011–2020 will have risen by 1.09°C compared with that recorded over the period 1850–1900. The impact of carbon emissions on global warming is irreversible on a time scale of hundreds to thousands of years in the future (Zhou, 2021), which brings new challenges to the international community, and various countries have responded to this. In 2020, General Secretary Xi Jinping pointed out that China is expected to reach its carbon peak before 2030 and will strive to achieve carbon neutrality before 2060. China is both a major energy producer and major energy consumer (Li, 2022). With the increase of the greenhouse effect, carbon emissions from energy production have decreased, but China’s carbon emissions will still be as high as 29% in 2020 (Yang et al., 2022). Water resources are characterized by a pattern of “more in the south and less in the north”; the regional distribution is uneven, and there is more cultivated land in the north (Zheng, 2021), where the proportion of water resources is only 16%, which seriously affects the carbon sink function of plants and crops. Growth and development are also restricted by the exploitation and utilization of energy, and water‒energy‒carbon (WEC) jointly affect the sustainable development of many regions of China. Therefore, from a national perspective, China, as the world’s second largest economy with a population of 1.4 billion, contains a bottleneck that restricts high-quality development of the country owing to an uncoordinated WEC system (Gao, 2022). Northeast China is an important heavy chemical industry base and faces problems of water shortage and energy depletion (Chen, 2021; Tian, 2021). At the same time, these Northeastern provinces face carbon emission pressure. Hence, the low-carbon sustainable development of China’s industrial base is of great significance.
The recently proposed “dual carbon” goal of China means that research on WEC correlation has become a current hot topic. Previous studies have preliminarily proven the close connection between water, energy, and carbon. Water is needed for energy generation, and energy is needed for various processes related to water extraction, treatment, and distribution (Zhao, 2016; Yang, 2018; Hiloidhari, 2021; Liang, 2022; Yoon, 2022). Meanwhile, energy use and wastewater treatment release greenhouse gases (Briones-Hidrovo, 2022; Li, 2022), while climate change leads to changes in the availability of water resources (Zhang, 2022). To achieve sustainability and reduce environmental impacts, including carbon emissions, a comprehensive understanding of the WEC relationship is vital (Nikolov and Fox, 1994; Li, 2019). Venkatesh and Brattebo (Venkatesh and Brattebo, 2011) compared the four cities of Nantes, Oslo, Turin, and Toronto Metabolism of water supply systems, and found that geographic, climatic, technological, and social factors had a significant impact on urban WEC development. Elkhafif (Elkhafif, 1996) calculated the water and carbon footprints of Ontario’s energy supply mix, and found that Ontario needs to coordinate water and carbon emissions to ensure sustainable development between energy and water. In China, the coupling relationship between water, energy, and carbon has mainly been discussed from the perspective of economic and social sustainable development, and at the same time, research on climate change, water resources, and green and low carbon has been taken into consideration. Li et al. (Li, 2019) explored the prediction of carbon emissions and water consumption trends under the influence of energy consumption and ways in which to achieve low-carbon and water-saving development in Tangshan City. Han et al. (Han et al., 2015) studied the WEC relationship and its environmental effects in Beijing and Shanghai. Meng et al. (Meng et al., 2019) pointed out that owing to the unclear boundary of urban junctions or system boundary of cities and the imprecise internal structure of cities, there are relatively few correlation analyses of urban WEC as a whole for synergy and trade-offs. Chen et al. (Chen et al., 2019) proposed an interactive framework to assess the inter-regional WEC relationship and established an inter-regional input‒output model to consider energy-related water footprints, water-related energy footprints, and water-related carbon footprints. Duan and Chen (Duan and Chen, 2016) analyzed the WEC relationship under the Beijing energy and water systems, and established a city-scale WEC relationship model framework.
There are three main research methods in this field: the first is the top-down input‒output model (MRIO model), where there remains room for innovation in the compilation process (Wang, 2021). Tian et al. (Tian, 2021) used a multi-regional input‒output model to analyze the changing trends of China’s water consumption footprint, energy footprint, and carbon footprint in different periods, providing a basis for reducing China’s WEC environmental footprint and achieving sustainable development. The second method is the bottom-up life cycle method (LEA model), which emphasizes the integrity of the system, but has a high dependence on data, and faces difficulties in unifying the division of system boundaries (Cui, 2020). Valek et al. (Valek et al., 2017) used the life cycle method to compare the greenhouse gas emissions and energy consumption of buildings and rainwater harvesting systems provided by the urban water network to improve water resource management in Mexico City. The third method is the system dynamics (SD model), which is a mature method for quantifying complex feedback in system interaction. It has unique advantages in the study of correlation quantification and system structure in complex systems. It can handle high-order items, non-linear and multiple feedback system problems, and reveal internal causal relationships, but requires high precision in the abstract quantification of the interrelationships between various factors (Kotagodahetti, 2022). Chhipi-Shrestha et al. (Chhipi-Shrestha et al., 2017) established a system dynamics model of the urban drinking-water system and studied the relationships and Spearman correlations between water, energy, and carbon, finding significant correlations. In addition, there are various other methods, such as the remote energy alternative planning system model and supply chain network (Hong et al., 2021).
With global water and energy resource crises and climate warming challenges, resource conflicts have become increasingly prominent (Yang et al., 2019), and a coordination and service function degradation of the WEC system has emerged; research at home and abroad has gradually shifted from focusing on the relationship between water and energy, energy and carbon, and water and carbon, to the WEC relationship. Synergistic WEC research should strive to maximize synergistic benefits to achieve the goal of saving resources. At present, most research perspectives on the WEC relationship tend to be macroscopic, ignoring the quantitative relationship and resource flow analysis of the WEC relationship during the processes of production, transfer, and consumption (Zhao, 2018). Therefore, it is now necessary to collaboratively study the WEC coupling relationship to achieve sustainable development. The three northeastern provinces studied herein still have the energy and heavy chemical industries as their core industries; the energy and water resource consumption of traditional industries creates a relatively high pressure on carbon emissions, resulting in complex intertwined relationships.
The three Northeastern provinces studied herein are important interactive areas of water and energy resources and carbon emissions, and provide a type area for carrying out WEC research. In this context, clarifying the WEC coupling relationship in these three provinces of northeast China, and exploring the direction and management mode of water resources, energy, and carbon emission structure adjustment are of great importance to alleviate the pressure on the coupled WEC system in this region.
On the basis of the availability of carbon emission data, 2001–2019 was selected as the research period. We first ascertained the status quo of water resources, energy, and carbon emissions in the three Northeastern provinces, and determined the coupling relationships between the three parameters. We then used system dynamics to explore the WEC relationship model from the three dimensions of nature, society, and economy. Finally, we simulated the situations of water, energy, and carbon emissions in northeast China from 2020 to 2040, and forecast the resource demand under different development scenarios, to provide reference for the formulation of comprehensive WEC management policies in northeast China.
The northeast region of China includes three provinces: Liaoning, Jilin, and Heilongjiang (Figure 1), covering a total area of 787,300 km2. As the industrial cradle of China, these three northeastern provinces have made great contributions to the Chinese economy; they are an important energy industrial base and produce the largest proportion of China’s oil.
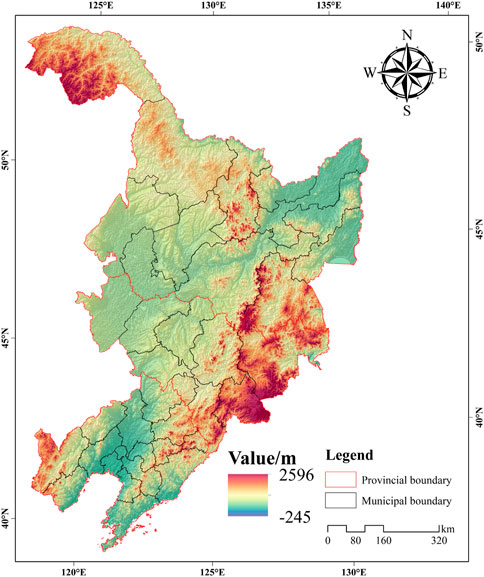
FIGURE 1. Three provinces of Northeastern China.
In the WEC system, water and energy are two interconnected and interacting subsystems (Figure 2). They are interconnected in different ways; energy is consumed in the process of water use and treatment, and the energy consumption process also consumes water resources. Carbon emissions, as an output system, mainly depend on the type of mutual demand between elements such as water and energy, and the energy structure. Under the goal of “dual carbon”, it is important to explore the impact of WEC three-dimensional spatiotemporal matching degree on the sustainable development and utilization of resources in these three northeastern provinces.
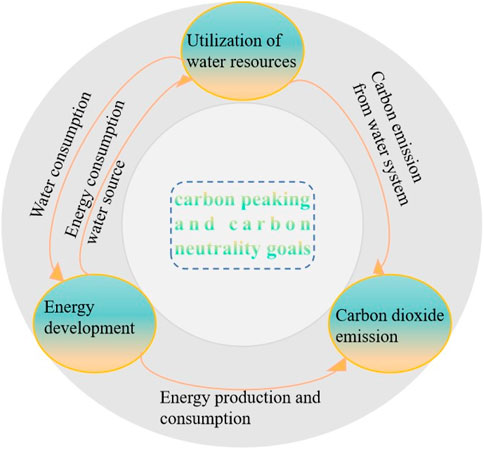
FIGURE 2. Water‒energy‒carbon coupling system.
The basic data and sources required for this paper are shown in Table 1.
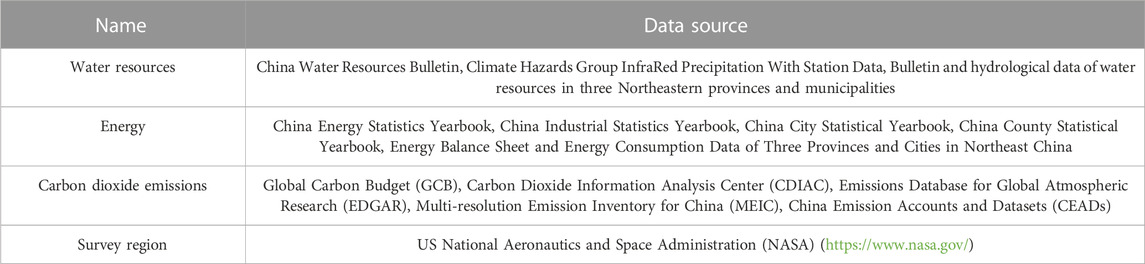
TABLE 1. Required data types and sources.
On the basis of the establishment of the WEC database of the three provinces of Northeast China, we established evaluation indicators of the water resources, energy, and carbon emission subsystems, analyzed the coupling coordination of the WEC system, and used system dynamics to analyze its simulation. The research pathway is shown in Figure 3.
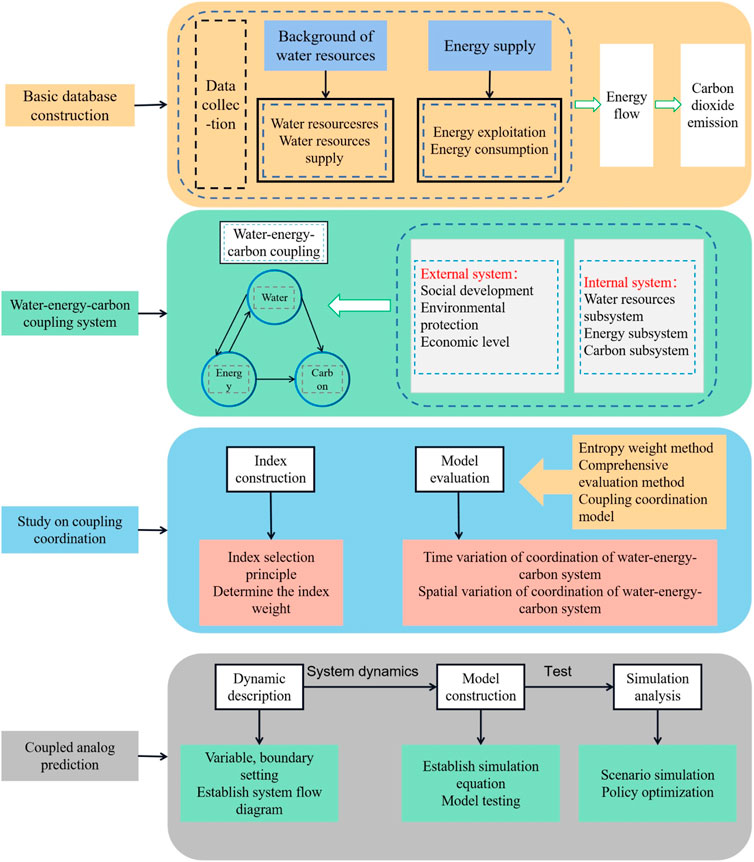
FIGURE 3. Technology roadmap.
Water resources, energy, and carbon emissions comprise a complex system, and the selection of indicators directly affects the evaluation results. Therefore, this study drew on existing research results (Zhao, 2016; Wu, 2019; Dang, 2021; Wang, 2022) and selected 32 evaluation indicators, as shown in Table 2; for each of the water resources, energy, and carbon emissions subsystems, indicators were selected from the three perspectives of total quantity, structure, and sustainability. The impact classification of each indicator on the system is represented by attributes, where + represents a positive correlation and − represents a negative correlation.
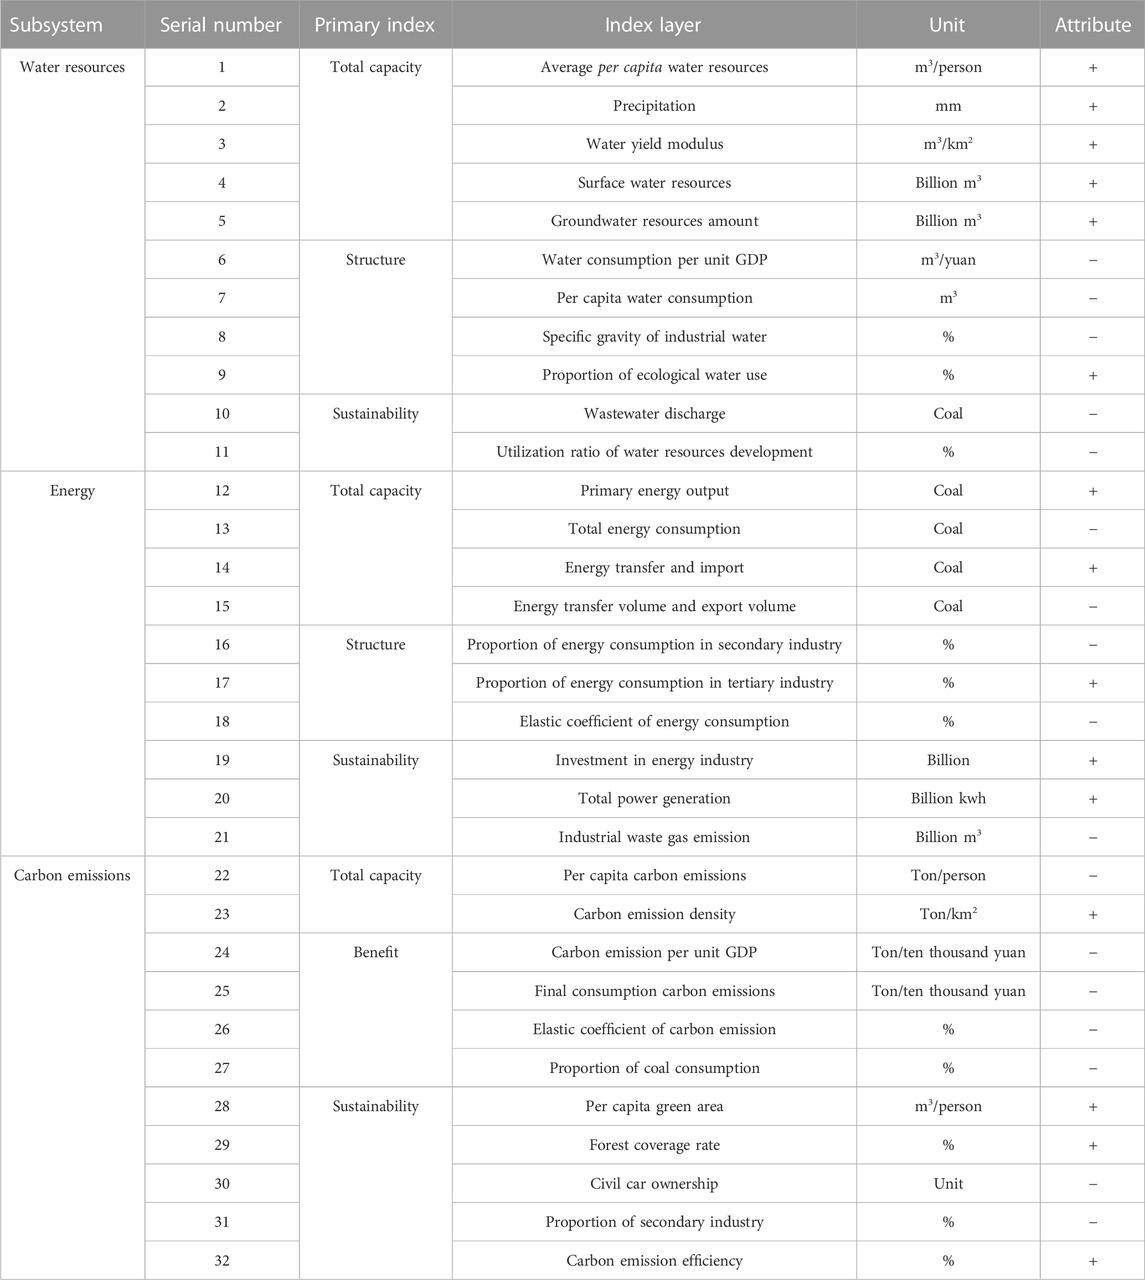
TABLE 2. Evaluation indicators.
Combined weighting method (Qu, 2022; Zhou, 2023): Assuming that the number of WEC system evaluation indicators is n, and the samples to be evaluated are m, we first eliminated the dimensional differences of different indicators, thereby establishing a standard matrix Y. The normalized calculation formula of the positive correlation index is:
The normalized calculation formula of the negative correlation index is:
where
According to the specific characteristics of entropy, the entropy value of each parameter in the evaluation system was calculated as follows:
where k is the standardized coefficient, namely, k = −Inn.
To determine the weight of the indicator, the calculation formula is:
where
In this paper, we combined the analytic hierarchy process (AHP) and entropy weight method to determine the index weight, which can effectively reduce the impact on the evaluation caused by the subjective level or over-reliance on data, thereby improving the authenticity of the evaluation results. The weight calculation method is as follows:
where w′I and w″i are the main and objective weights, respectively, and their combined weights are shown in Table 3.
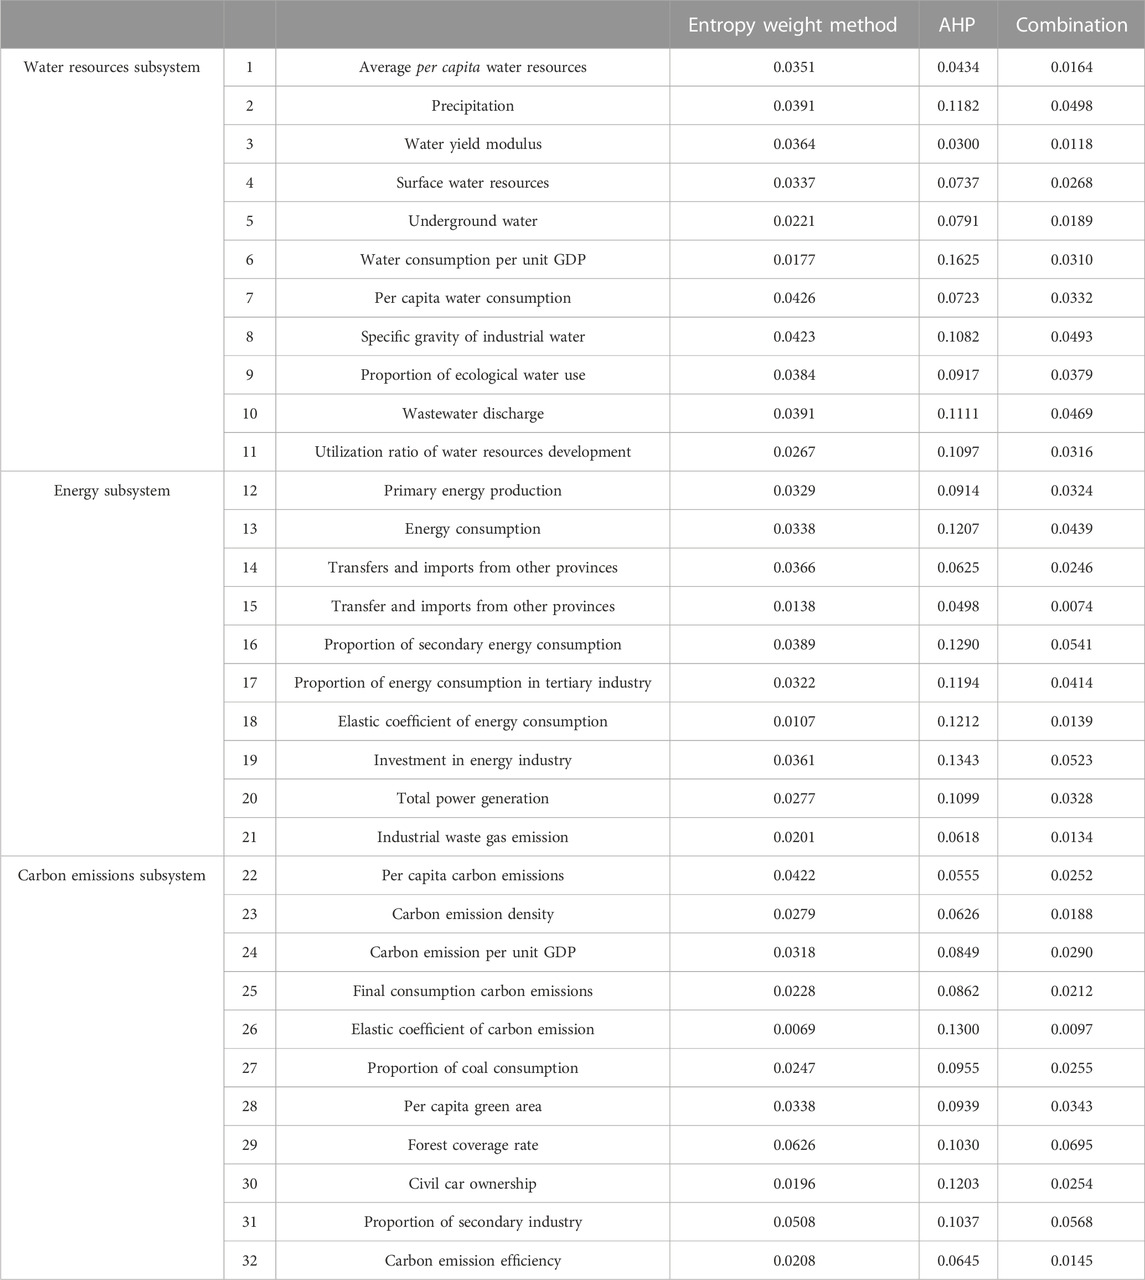
TABLE 3. Indicator weights.
According to the WEC system evaluation index system, a comprehensive WEC evaluation function was constructed, which can reflect the development level of each subsystem. A larger index equates to better development (Li, 2022); the calculation formulae are as follows:
where W(w), E(e), and C(c) are the comprehensive evaluation indices of the water resources, energy, and carbon emissions subsystems, respectively, and wi, ei, and ci are the sums and calculations of each evaluation index subsystem weight; xit, yit, and zit are the standardized values of each subsystem evaluation index, t is the year, and i is the number of subsystem indices.
Coupling refers to the fact that multiple systems affect each other through interaction; the internal interconnections of the water resources, energy, and carbon emissions subsystems form a complex large system (Zhang et al., 2022). The coupling degree can be used to analyze the strength of subsystem interaction; its calculation formula is as follows:
where C is the coupling degree, C∈[0, 1], and a smaller value equates to a smaller internal connection of the system; the evaluation level refers to the classification of relevant literature (Zhang, 2022), as shown in Table 4.
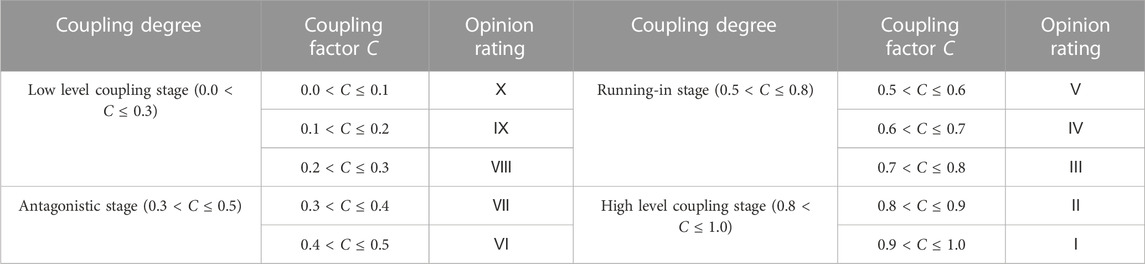
TABLE 4. Coupling stage and evaluation level.
The coupling degree model cannot reflect the coordinated development quality of the subsystems. Therefore, a coupling coordination degree model (Xiong, 2020) was constructed to better explore the coupled development of the WEC system. The calculation formula is as follows:
where D is the degree of coupling coordination, D∈[0, 1]; T is the comprehensive evaluation index of the system; and a, b, and c are undetermined coefficients, which are the weights of importance of each subsystem. If the degrees of influence of each subsystem are the same, then a = b = c = 1/3 (Su, 2022).
To better study the coordinated development degree and stage of the WEC coupling system in the three northeastern Chinese provinces, the coupling coordination degree was divided into levels by referring to existing research results (Feng, 2022; Su, 2022), as shown in Table 5.
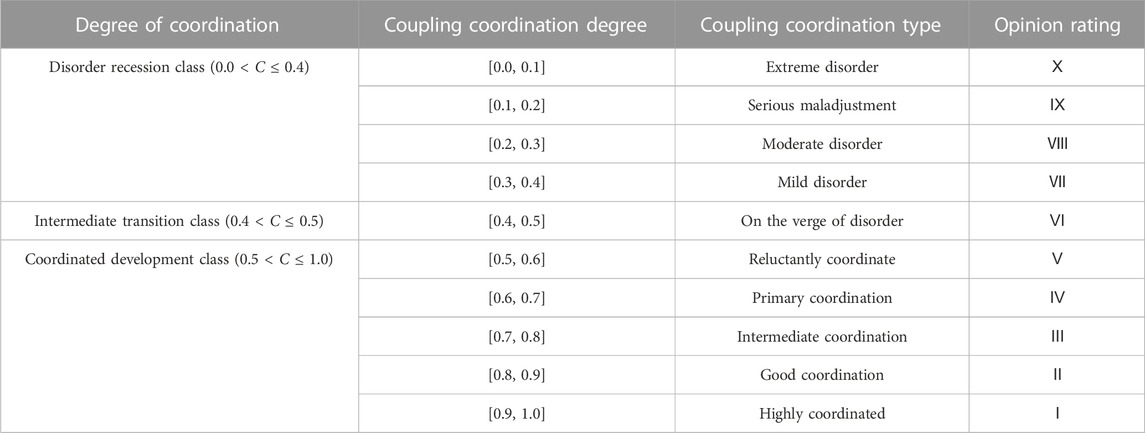
TABLE 5. Coupling coordination degree and evaluation level.
The WEC relationship is affected by many factors, such as society, economy, and environment, and its internal connections are relatively complex. We took the administrative regions of the three northeastern provinces of China as the boundary of our research area, started from the goal of “double carbon”, calculated carbon emissions from the perspectives of water use and drainage, and energy system production and consumption, and explored the coordinated development plan of water, energy, and carbon emissions (as shown in Figure 4).
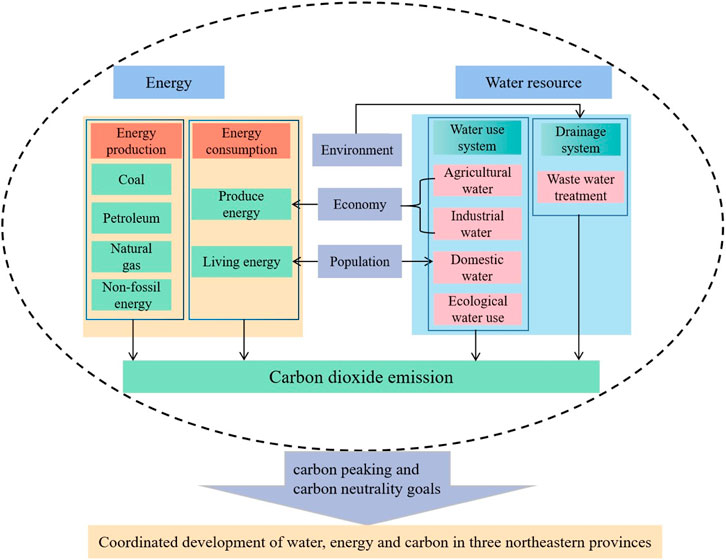
FIGURE 4. Research framework of the water‒energy‒carbon system.
The initial time of the model was set to 2020, the end time to 2040, and the time step to 1 year. The model included three internal subsystems (water resources, energy, and carbon emissions) and three external subsystems (economy, society, and environment). A system flow diagram was established, as shown in Figure 5.
(1) Water resource subsystem: The water resource subsystem was analyzed from the perspectives of water supply and water use. Variables included domestic water consumption, water consumption per unit of energy, water consumption per unit of GDP, and per capita domestic water consumption. The selection of variables can reflect the development of water resources, which is closely related to energy and carbon emissions.
(2) Energy subsystem: The energy subsystem was analyzed from the perspectives of energy investment, consumption structure, and pollution discharge. Variables included per capita living energy production, proportion of coal consumption, proportion of industrial water consumption, energy consumption of various industries, and other variables. The selection of variables can reflect changes in the gap between energy supply and demand, which is closely related to water resources and carbon emissions.
(3) Carbon system: The carbon subsystem was analyzed from the perspectives of energy, water resource carbon emissions, and GDP carbon emissions. Variables included carbon emissions during the process of water use, carbon emissions during the process of energy consumption, and carbon emission coefficients. The variables can reflect the current level and future development trend of carbon emissions, and can reflect the carbon emissions during the processes of water resource utilization, treatment, and energy consumption.
(4) Economic system: During production activity, economic development comes at the cost of consuming water resources and energy; economic development directly affects the level of investment in science and technology, which in turn affects the development and utilization of water resources and energy, and at the same time causes unit GDP changes in carbon emissions.
(5) Social system: With population as the main decision variable, the water resources and energy subsystems are connected through per capita energy consumption and per capita domestic water consumption.
(6) Environmental subsystem: The environmental subsystem selected variables such as wastewater treatment rate and domestic garbage harmless treatment rate to form a link between the water resource and energy subsystems.
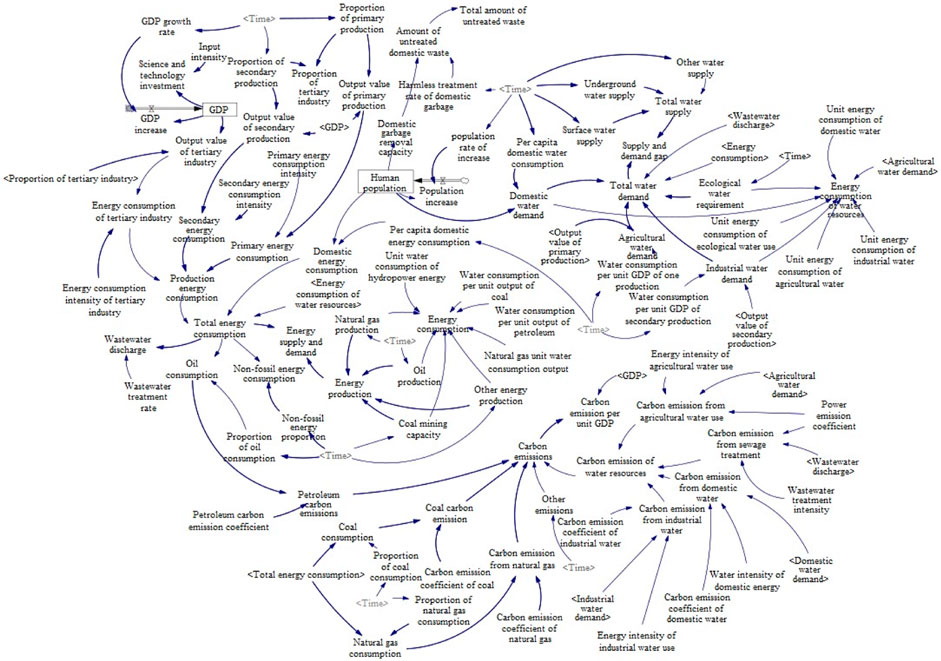
FIGURE 5. System flow diagram.
Data related to water resources in each region of the three northeastern provinces of China from 2001 to 2019 were obtained from the Water Resources Bulletin and “China Environmental Statistical Yearbook”; energy data were obtained from the “Energy Statistical Yearbook”; carbon emissions directly referred to the CEAD database; economic data were obtained from the “China Statistical Yearbook”; and population data were obtained from census data of the National Bureau of Statistics and the data of the Center for Resources and Environmental Science and Data. Other relevant constants were set according to the planning of relevant documents, and some missing data were supplemented using the moving average method via SPSS software. The main equations of the model for key variables are listed in Table 6.
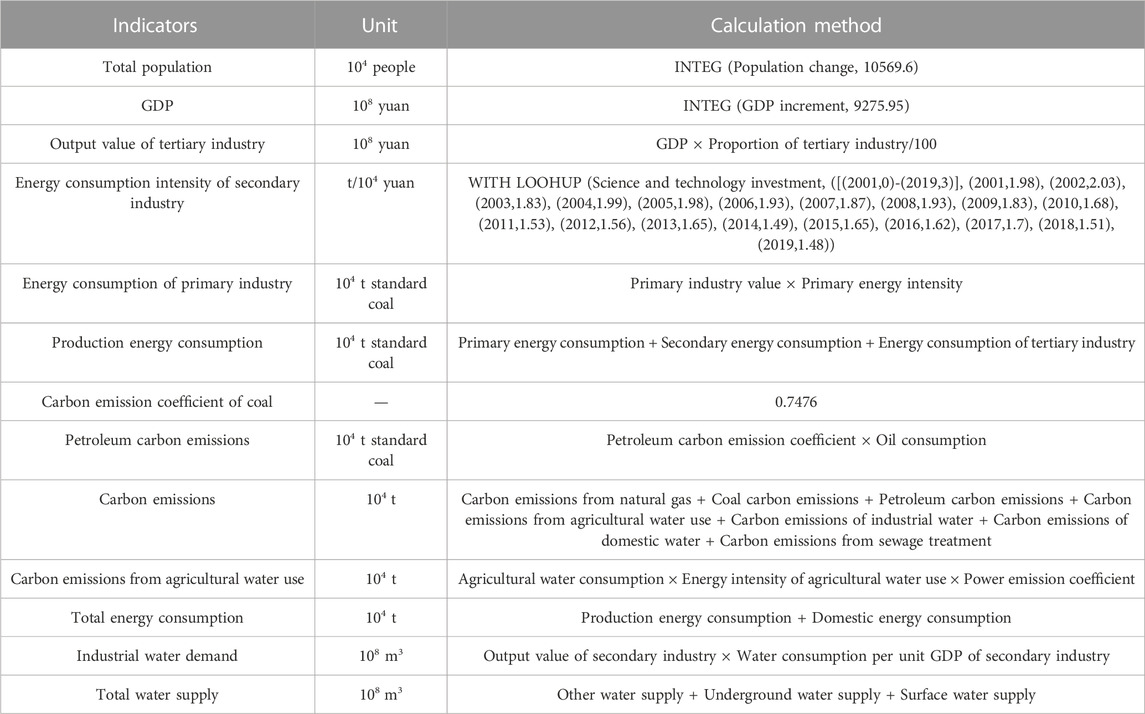
TABLE 6. Water‒energy‒carbon system evaluation indices for the three provinces of Northeastern China.
According to Eqs 7–9, the comprehensive evaluation indices of the water resources, energy, and carbon emissions subsystems, along with the WES system, were calculated; the change trends are shown in Figure 6. The fluctuation range of the comprehensive evaluation index of the water resources subsystem was large (0.0879–0.2551), with an overall upward trend. After 2007, the fluctuations were particularly evident, showing M- and N-like patterns. From 2007 to 2014, there was an M-like pattern, with peaks in 2010 and 2013, 2010 and 2013 may be the years with abundant precipitation in Northeast China, which leads to a relatively sufficient supply of water resources, so the evaluation index of water resources subsystem reaches the peak. In addition, the improvement of the economic and social development level in Northeast China in the past 2 years has led to an increase in the demand for water resources, so the three northeastern provinces have increased the development and utilization of water resources, thus improving the evaluation index of water resources subsystem. However, the peaks and valleys are between 2007 and 2011. In 2007, the content of groundwater resources and surface water resources was low, so the comprehensive index showed the lowest level during the study period, with a value of 0.0879; In 2011, the utilization rate of water resources was as high as 50.65%, which made the comprehensive index low. From 2014 to 2019, it showed “N”, and its peak value was in 2019. In 2019, the proportion of water consumption per unit GDP and industrial water consumption decreased, thus improving the development level of water resources system, and the highest comprehensive index value in 2019 was 0.2551. The peaks and valleys in 2015 and 2017 were mainly due to the low water yield modulus and per capita water consumption. In 2015, the values were 168,200 m/km2 and 1,237.32m³/person respectively, and in 2017, the values were 168,100 m/km2 and 1,248.18m³/person respectively. It may also be affected by climate change. In the past 2 years, extreme weather events, such as droughts and floods, may occur in Northeast China, which will lead to shortage or excess of water resources supply, thus affecting the evaluation index of water resources subsystem.
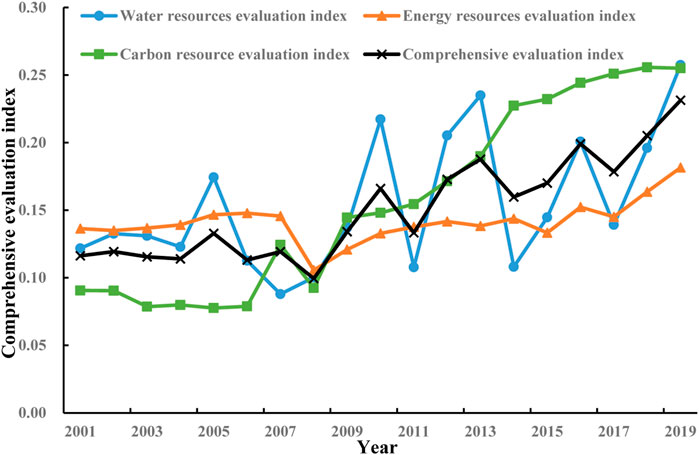
FIGURE 6. Comprehensive water‒energy‒carbon evaluation indices for the three provinces of Northeastern China.
From 2001 to 2019, the carbon subsystem comprehensive index showed an evident upward trend, having values between 0.0776 and 0.2557. Its value increased from 0.0906 in 2001 to 0.2551 in 2019, and its development level increased by 80.23%. The comprehensive index of the WEC system ranged from 0.0994 to 0.2314 over the period 2001–2019; its development level was low, but showed a fluctuating upward trend. The WEC comprehensive index was lowest in 2008 and highest in 2019; the reason behind this is that with the advancement of science and technology and improvement in economic level, water consumption per unit of GDP, carbon emissions per unit of GDP, and water resource development and utilization rate have been greatly reduced, while the amount of imports from other provinces, energy industry investment, and total power generation have been significantly reduced. Meanwhile, with the strengthening of ecological and environmental protection requirements and improvement in residents’ awareness, the per capita green area and forest coverage rate increased to 27.21 m2/person and 42.51%, respectively.
As shown in Table 7, the WEC coupling degree over the period 2001–2019 was between 0.9457 and 0.9985, being at a high-level coupling stage, rated as level I, indicating that there is a close relationship between the three subsystems. The level of coupling coordination was low (0.3151–0.4780), representing a state of mild disorder or near disorder, and the coordination level was rated level Ⅵ‒Ⅶ. The years from 2001 to 2009, 2011, and 2014 were mildly disordered, and the other years were on the verge of disorder. Taking the average levels during the study period, the coupling degree of the WEC system in the three northeastern provinces of China was 0.9775, coupling level was level I, coupling coordination degree was 0.3813, and coordination level was level VII. Therefore, it can be concluded that the water, energy, and carbon subsystems in the three northeastern provinces of China are closely connected, but affected by the comprehensive evaluation index, the degree of coordination is in the category of imbalance decline and intermediate transition, and the coupling coordination degree fluctuates and rises, but it is not the same as the “water-energy-carbon” system. There remains a long way to go to obtain a high degree of coordination of the carbon subsystem. In the future, we should aim to improve the coordinated development of the WEC system and promote the sustainable development of the region.
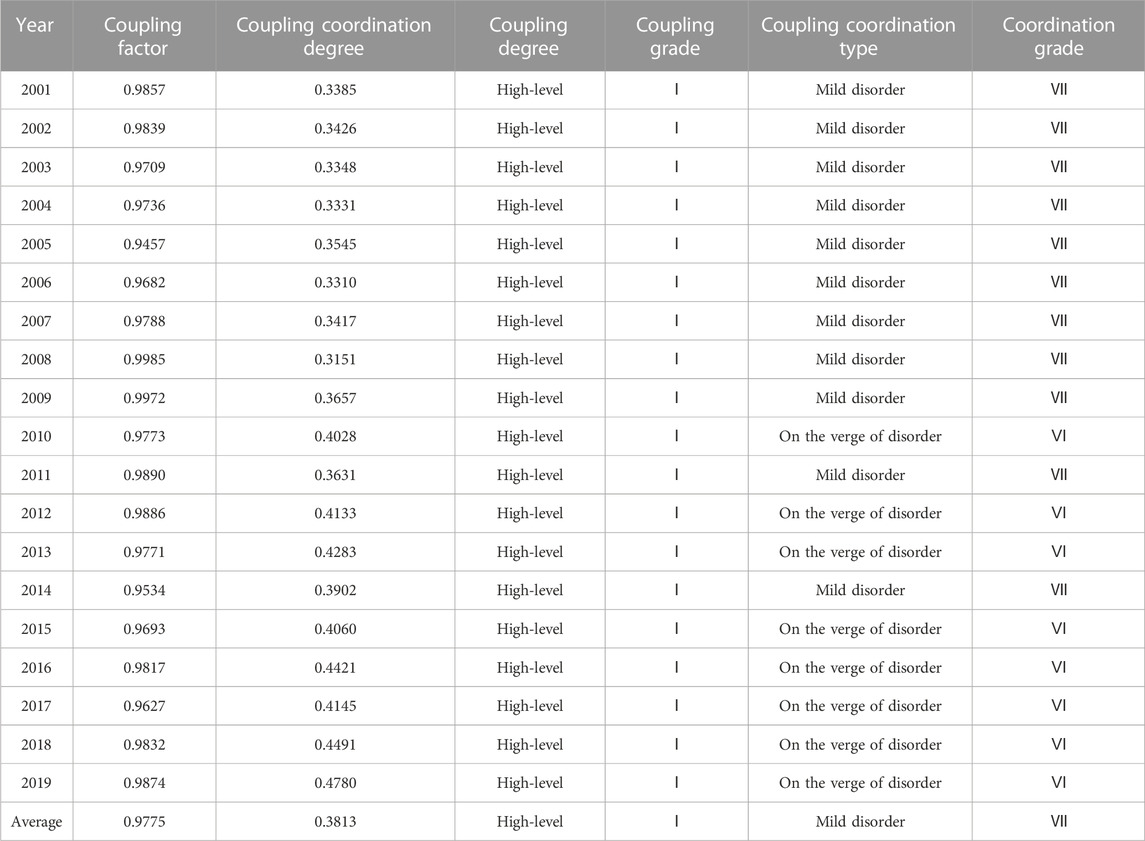
TABLE 7. Coupling coordination level of the water‒energy‒carbon system in the three provinces of Northeastern China.
Changes in the development level of the water resources subsystem are shown in Figure 7. The comprehensive index of water resources fluctuated greatly from 2001 to 2019; the largest fluctuations were in Heilongjiang Province (0.0680–0.2855), with smaller fluctuations in Jilin (0.0661–0.2733) and Liaoning (0.0763–0.2541) provinces. The temporal fluctuations in the comprehensive index of the water resources subsystem were not consistent across the three provinces. The highest precipitation occurred in Liaoning Province in 2012 (886.4 mm), while the utilization rate of water resources was the lowest of the study period (0.2600), resulting in the highest comprehensive index of the water resources subsystem (0.2541); the lowest value appeared in 2001. The impact of high emissions. The highest value of the water resources comprehensive evaluation index in Jilin Province was in 2019, and the lowest value was in 2003; this was mainly a result of the industrial water consumption and wastewater discharge being relatively large in 2003, and relatively small in 2019. In 2007, Heilongjiang Province saw its lowest reserves of groundwater resources, and at the same time, its ecological water consumption reached 560 million m3, which accounted for a high proportion, and the amount of wastewater discharge was small, resulting in a low comprehensive index of water resources in this year. In 2019, the per capita water resources and water resources development and utilization rate were relatively low, and the comprehensive evaluation index increased. From the perspective of fluctuation speed, each of the three provinces exhibited its fastest change from 2009 to 2014, mainly because during this period, the per capita water resources and precipitation, surface water resources, and groundwater resources of the three provinces fluctuated rapidly.
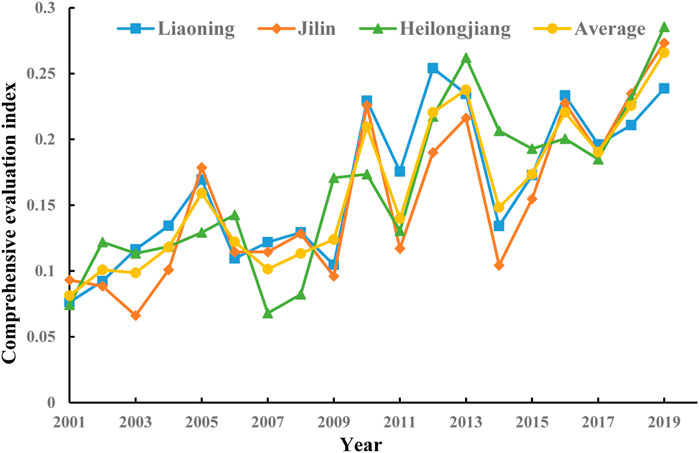
FIGURE 7. Comprehensive evaluation indices of the water resources subsystem in the three provinces of Northeastern China.
Changes in the development level of the energy subsystem are shown in Figure 8. The fluctuation of the energy comprehensive index from 2001 to 2019 was small; the fluctuation in Liaoning Province was the smallest (0.1424–0.1778), followed by Jilin Province (0.1045–0.2049), then Heilongjiang Province (0.1013–0.2068). The temporal fluctuations of the three energy-saving subsystem comprehensive indices were different. In 2019, Liaoning Province exhibited its highest export and import volume (325.1544 million tons). At the same time, the energy elasticity coefficient rose rapidly to 1.16, resulting in a minimum value of 0.1424 for the comprehensive index of the energy subsystem. The highest value of energy elasticity coefficient appeared in 2010, which is due to the influence of energy industry investment and high energy production. The highest value of the energy comprehensive evaluation index in Jilin Province was in 2015, and the lowest value was in 2004; this was mainly because the amount of imports from other provinces and the energy consumption of secondary industries accounted for a large proportion of the index in 2004. In 2019, the secondary industry accounted for a relatively small amount of energy consumption and generated a large amount of electricity. In 2009, Heilongjiang Province had the lowest reserves of groundwater resources and was also affected by the proportion of energy consumption in secondary industries. At the same time, the energy elasticity coefficient was low, resulting in a low comprehensive index of energy in this year. In 2019, the proportion of energy consumption was affected by the same factors as those of Jilin Province. In 2019, the same as the influencing factors in Jilin Province, energy consumption accounted for a relatively small proportion and power generation was large, which led to an increase in the comprehensive evaluation index. In 2008 and 2015, the energy comprehensive evaluation indices of each of the three provinces were higher than that of the three Northeastern provinces as a whole; this was mainly because, during this period, the comprehensive per capita water resources and water production moduli of the three Northeastern provinces, groundwater resources, and utilization rate of water resources were the lowest.
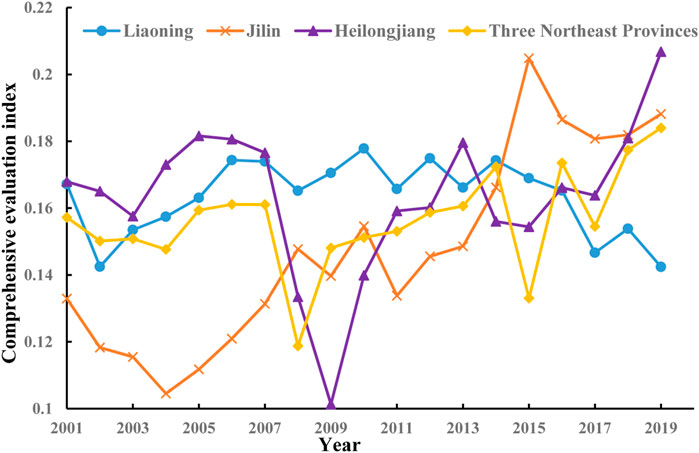
FIGURE 8. Comprehensive evaluation indices of the energy subsystem in the three provinces of Northeastern China.
Changes in the development level of the carbon subsystem are shown in Figure 9. The carbon comprehensive index showed an upward trend from 2001 to 2019; it rose the greatest amount in Liaoning Province (0.0840–0.2601), followed by Jilin Province (0.1045–0.2362), then Heilongjiang Province (0.1291–0.2254). The temporal fluctuations of the carbon subsystem comprehensive index in Jilin and Liaoning provinces were roughly the same, but were different in Heilongjiang Province. In Liaoning Province, the highest value of the carbon subsystem comprehensive index (0.2601) occurred in 2015, owing to the influence of the carbon emission elasticity coefficient and per capita green area (accounting for 78.6% of the index), while the lowest value occurred in 2003. In 2015, Jilin Province was affected by a low carbon emission elasticity coefficient and high carbon emission efficiency, resulting in a high carbon system comprehensive evaluation index. The lowest value in Jilin Province occurred in 2003, mainly because the carbon emission per unit of GDP reached 5.44 tons/10,000 yuan. In 2018, the carbon emission elasticity coefficient was low and the proportion of secondary industry was only 27.5%, and the rating index increased. In 2014, the overall carbon system comprehensive evaluation index of the combined three northeastern provinces was higher than those of each of the three provinces, and the carbon emission coefficient and carbon emission efficiency were relatively high. In 2015, the comprehensive evaluation index of carbon emissions in the three provinces combined was lower than those of each of the three northeastern provinces, mainly because the comprehensive carbon emission elasticity coefficient of each of the three Northeastern provinces was high during this period.
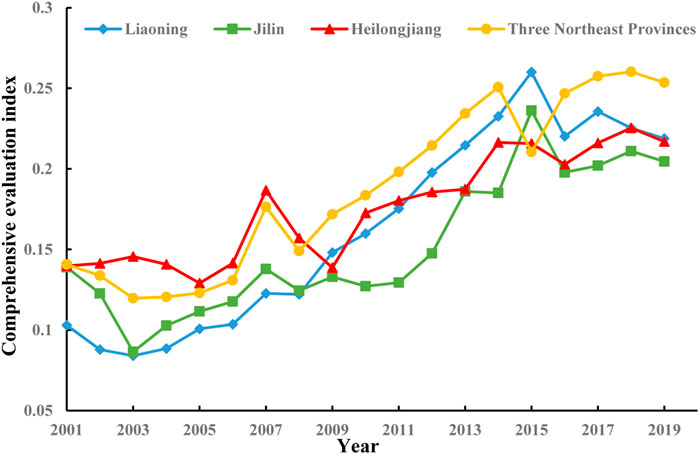
FIGURE 9. Comprehensive evaluation indices of the carbon emissions subsystem in the three provinces of Northeastern China.
During the period 2001–2019, the coupling degrees of Liaoning, Jilin, and Heilongjiang provinces were all at a high level, and the coupling level was rated grade I. From a spatial point of view, the coupling degree of the three Northeastern provinces gradually increased from South to North. The average coupling degrees of Liaoning, Jilin, and Heilongjiang provinces were 0.9569, 0.9783, and 0.9811, respectively. During the study period, the coupling coordination degree was ordered Jilin Province < Heilongjiang Province < Liaoning Province, being 0.3608, 0.3783, and 0.3820, respectively, and the imbalance in the central part of the three Northeastern provinces was more serious than that in the Northern and Southern parts. During this period, there are obvious differences in economic structure among the three Northeastern provinces. The Southern region (such as Liaoning Province) is relatively developed, with a high degree of industrialization and more heavy industries and manufacturing industries. The Northern region (such as Heilongjiang) is dominated by agriculture and resource development. This difference in economic structure leads to the difference in economic development level between the north and the South, and then affects the overall coordination. The distribution of resources in the three Northeastern provinces is also uneven. The Southern region has more resources such as coal, oil and metal minerals, while the Northern region is relatively scarce. The unbalanced distribution of resources has further aggravated the imbalance between the North and the South. As shown in Figure 10, in 2006, the coupling coordination degree of Liaoning Province was 0.3243, while that of Heilongjiang Province was 0.3384, both being rated as grade Ⅷ, and falling into the moderate disorder stage of the disorder decline category. In 2012, the coupling coordination degree of Liaoning Province was 0.4428, while that of Heilongjiang Province was 0.4133; both provinces were on the verge of imbalance, and the coupling level was grade Ⅵ; the coupling coordination degree of Jilin Province was 0.3802, rated as grade Ⅶ, and being in the mild disorder stage of disorder recession. In 2019, Liaoning, Jilin, and Heilongjiang provinces all entered the stage of intermediate transition and were on the verge of disorder, with an evaluation grade of VI and coupling coordination degrees of 0.4504, 0.4673, and 0.4780, respectively. From the perspective of development stage, the coupling and coordination levels of Liaoning, Jilin, and Heilongjiang provinces began to enter the stage of being on the verge of imbalance in 2010, 2015, and 2012, respectively; the level of coupling coordination in Liaoning Province fell back to the stage of moderate imbalance in 2011 and 2014.
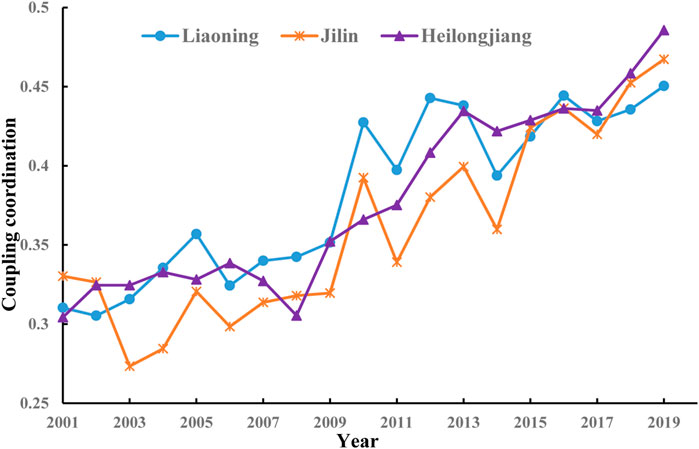
FIGURE 10. Coupling coordination of the three provinces of Northeastern China.
We selected historical data of four indicators (GDP, total energy consumption, carbon emissions, and water demand) from 2001 to 2019 to verify the validity of the WEC system dynamic model. Usually, the simulation effect is good if the error is within 10%, and the model is considered valid; when the error is between 10% and 20%, the model parameters can be adjusted to reduce the error; when the error exceeds 20%, the model is considered unusable, and the relationship between variables needs to be re-established. The error calculation formula is as follows:
After verification, it was found that the simulation accuracy of water demand and population was high, and the error was controlled within 1%, while the simulated values of GDP and total energy consumption were within 10%. Selected results are shown in Table 8; these passed the accuracy test. The errors between the simulated and actual values were within a reasonable range, thus proving that the model is valid.
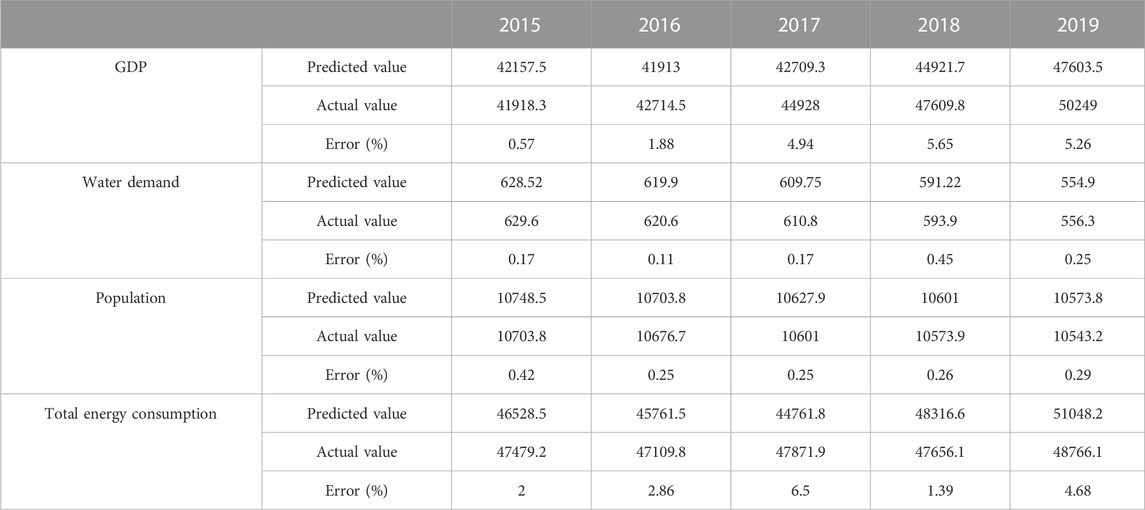
TABLE 8. Model verification.
We selected GDP growth rate, energy structure adjustment, improvement of residents’ awareness, and industrial structure as decision variables, and compared the initial conditions to simulate and predict changes in water resources and energy consumption, carbon emissions, and carbon emissions per unit of GDP from 2020 to 2040. We explored four types of schemes, with the feasibility of each scenario providing an optimization direction for policy management.
SCHEME 1: Economic regulation. With improvements in technology and globalization, the level of future economic development will be further improved, and the GDP growth rate will increase to 8%.
SCHEME 2: Adjustment of energy structure. With improvements in the national education level and residents’ awareness of energy conservation, coupled with the government’s vigorous promotion of low-carbon development, the per capita energy and water resource consumptions are set to be reduced by 20% in 2040. At the same time, under the requirements of China’s “double carbon” goal, the future industrial structure will develop towards a clean energy structure; hence, the proportion of coal is set to drop to 45.5%, proportion of oil to 19.8%, proportion of natural gas to 18.7%, and proportion of non-fossil energy will increase to 16.1%.
SCHEME 3: Adjustment of industrial structure. The proportion of primary industry remains unchanged, while the remaining proportion of industry flows from secondary to tertiary industries; the proportion of secondary industry decreases by 10% and proportion of tertiary industry increases by 10%.
SCHEME 4: Comprehensive adjustment. The GDP growth rate increases to 8%, per capita energy and water consumptions decrease by 20%, proportion of secondary industry decreases by 10%, and proportion of tertiary industry increases by 10%.
Through scenario setting, we focused on analyzing the changes in water resource consumption, energy consumption, and carbon emissions in the three northeastern provinces of China, and used the average values of the three provinces as representative data to analyze specific changes in Liaoning, Jilin, and Heilongjiang. We clarified the direction of development and explored ways to achieve energy-saving and low-carbon development requirements.
As shown in Figure 11, under comprehensive control, the consumption of water resources in the three northeastern provinces shows a predicted upward trend from 2020 to 2040. In 2040, water resource consumption will have increased by 34.45 billion m3 compared with the initial conditions, with an average annual increase of 6.565 billion m3. In 2001, water resource consumption was 520.38 billion m3, and by 2040, the simulated results of the five schemes give values over three times that of 2001. The consumption of water resources under the regulation of Schemes 1, 4 is higher than that of the initial scheme; the consumption of water resources under the economic regulation scheme (Scheme 1) is the largest, mainly because the increase in GDP growth rate means an increased output value for the three major industries; meanwhile, the three major industries need to consume water resources during the process of development, among which industrial and agricultural water occupies a relatively high proportion of the total. The consumption of water resources under the regulation of Schemes 2, 3 is lower than that of the initial scheme, and the adjustment of industrial structure (Scheme 3) provides the greatest reduction in the consumption of water resources. The consumption of water resources in Liaoning Province is predicted to be higher than that of the other two provinces, with an average annual increase of 1.246 billion m3; this is followed by Heilongjiang Province (1.117 billion m3), then Jilin Province (792 million m3).
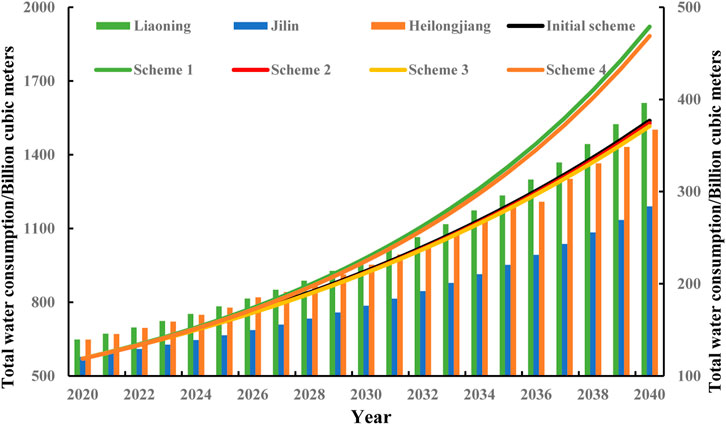
FIGURE 11. Change in water resource consumption in the three provinces of Northeastern China from 2020 to 2040.
It can be seen that under the comprehensive regulation and control scenario, the current level of science and technology is maintained. With development of the economy, future water resource consumption will not be lower than it is at the current level of development. Therefore, while the economy is developing, investment in science and technology should be increased to improve water resource utilization efficiency. During the future development process, the government should strengthen publicity and education, and reduce water resource consumption by regularly holding “water-saving, low-carbon development”-related theme activities. In terms of industrial structure, the proportion of primary industry remains largely unchanged during the development process, while secondary industry gradually flows towards tertiary industry. Secondary industries consume high levels of water resources; therefore, industrial structure adjustment appears to be the most effective option to control water consumption.
As shown in Figure 12, under the comprehensive adjustment scheme, the energy consumption is predicted to increase by 169.06 million tons of standard coal compared with the initial conditions. From 2020 to 2040, the average annual growth rate of energy consumption is predicted to be 43.3341 million tons of standard coal, which is 24.5% higher than the average annual growth rate of the initial scheme. The simulated change trend in energy consumption is consistent across the five schemes, showing an evident upward trend. Based on the years in which we have measured values (2001–2019), the energy consumption growth rate has been relatively fast, while during the predictive period (2020–2040), the growth rate slows down considerably. According to the initial scheme, energy consumption will increase at a rate of 33.757 million tons of standard coal per year, reaching 879.313 million tons of standard coal by 2040. Energy consumption under the control of Schemes 1, 4 is higher than that of the initial plan, with values of 1,108.96 million and 1,278.02 million tons of standard coal, respectively. Scheme 1 has the highest energy consumption, because an increase in GDP growth rate leads to an increase in energy consumption intensity, thereby increasing energy consumption. Under the comprehensive control plan (Scheme 4), although the energy consumption of the three Northeastern provinces is predicted to increase compared with the initial scheme, the proportion of clean energy increases while that of fossil energy decreases, which meets the requirements of green development. Energy consumption under the control of Schemes 2, 3 is lower than that of the initial scheme; by 2040, it is predicted to be 1,098.98 million and 1,032.28 million tons of standard coal, respectively. Among these two schemes, the energy consumption is predicted to be lowest under the adjustment of industrial structure, which can effectively slow down the energy consumption rate. This is mainly because secondary industries consume abundant energy. During the development process, reducing the proportion of secondary industries can greatly reduce energy consumption. Therefore, the transformation of industrial structure should be accelerated to reduce energy consumption. Liaoning Province has a large industrial presence, and its energy consumption is much higher than that of the other two provinces (1.5 times that of Heilongjiang Province and 3.5 times that of Jilin Province), with an average annual growth rate of 2,103.2 tons of standard coal.
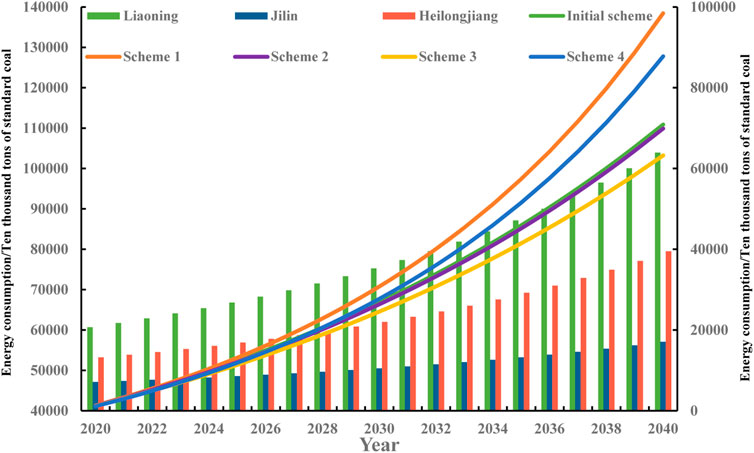
FIGURE 12. Change in energy consumption in the three provinces of Northeastern China from 2020 to 2040.
In summary, timely transformation of industrial structure can effectively reduce the growth rate of energy consumption, alleviate energy shortages, and narrow the energy gap. In the future development process, we should focus on implementing the industrial transformation strategy, speed up the adjustment and transformation of the old industrial bases in Northeast China, focus on enhancing the ability of scientific and technological innovation, intensify the structural reform of the supply side, vigorously develop emerging industries, form diversified products, promote the energy structure to adapt to the modern market, and at the same time change the energy structure, make full use of non-fossil energy such as light energy and wind energy, improve the development and utilization rate of clean energy, and promote the sustainable development of resource-based cities in the region.
As shown in Figure 13, under the comprehensive adjustment scheme, carbon emissions are predicted to be reduced by 29.215 million tons compared with the initial conditions. Over the period 2020–2040, the average annual growth rate of carbon emissions is predicted to be 21.534 million tons under the comprehensive adjustment scheme, which is 5.7% lower than that under the initial scheme. The carbon emissions of the three northeastern provinces show an increasing trend from 2020 to 2040 under all five simulation schemes, and the growth of carbon emissions under Scheme 1 is significantly higher than that under the other schemes. This is mainly a result of the increase in production and social activities that promote economic development, resulting in a rapid increase in carbon emissions by 2040, reaching 180741.2 million tons, which is 1.54 times that seen in 2020. This shows that developing the economy without paying attention to energy conservation and emission reduction will generate abundant carbon emissions. In contrast, the lowest carbon emissions are predicted under Scheme 3. Until 2037, the carbon emissions of Scheme 3 are higher than those of Scheme 4, mainly because the faster the economic development, the faster the carbon emissions will increase, so the carbon emissions generated by comprehensive regulation will be higher than those generated by industrial restructuring with the increase of time. From the perspective of the three Northeastern provinces, the carbon emissions of Liaoning Province increased by 12.308 million tons, Jilin Province increased by 7.667 million tons and Jilin Province increased by 2.824 million tons, and the carbon emissions rates of the three provinces all decreased, among which Liaoning Province had the largest space for carbon emissions to decrease.
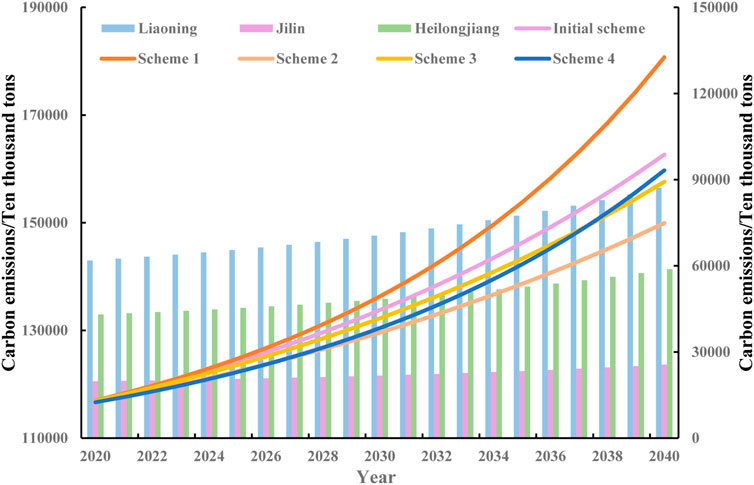
FIGURE 13. Change in carbon emissions in the three provinces of Northeastern China from 2020 to 2040.
From the perspective of GDP growth rate, energy structure and industrial structure, the impact on emission reduction is different, and the effect of adjusting residents’ awareness and energy structure is better than that of reducing the proportion of secondary industry. The increase in GDP growth will increase carbon emissions. Based on the national “14th Five-Year Plan” requirements, Scheme 2 is conducive to achieving low-carbon goals. Therefore, the key direction of carbon emission reduction in the future should be the transformation of energy structure and the improvement of residents’ awareness of energy conservation.
On the basis of the above WEC simulation results, the adjustment of energy structure in Scheme 2 and the improvement of residents’ consciousness can effectively reduce carbon emissions, and the adjustment of industrial structure in Scheme 3 has obvious influence on water resources and energy, but Scheme 4 integrates multiple decision variables and is more based on the actual development of the three northeastern provinces than the other three schemes, so we explored the linking relationships and trend changes of the three subsystems from 2020 to 2040 with reference to Scheme 4. As shown in Figure 14, the energy consumption of the three northeastern provinces was relatively high, being the dominant factor in the WEC system; hence, it was used as the independent variable, while the total water demand and carbon emissions were the dependent variables.
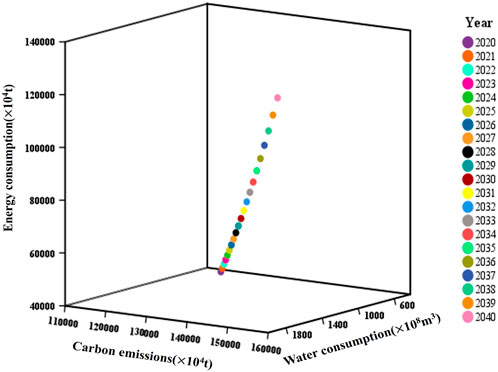
FIGURE 14. Variation trend of the water‒energy‒carbon relationship.
Over the period 2020–2040, the correlation (R2) of the three WEC elements in the three northeastern provinces is 0.9, that is, there is a strong correlation between the three variables. In the future, total water consumption, energy consumption, and carbon emissions will all show an increasing trend year on year. The growth rate will be relatively slow from 2020 to 2025, and will accelerate after 2025. In 2040, compared with 2020, both water resources and energy consumption will have increased by more than three times; carbon emissions will have increased by nearly 36.92%. However, although the total amounts of all three elements will be higher than the current level of development, the efficiency of water resource utilization will be markedly improved, the gap between supply and demand will be reduced, and the WEC system will be improved in the direction of synergistic optimization. Therefore, under the control of Scheme 4, water, energy, and carbon will develop towards each other in a well-promoted direction, so that the synergy of the entire system will be improved.
In recent years, WEC research has become a hot topic. Through analyzing the changing trend of the WEC relationship, we here show that relevant measures can promote economic growth, reduce pollution, improve water quality, and bring other benefits. Among these measures, the improvement of residents’ awareness in Scheme 2 can effectively reduce water resource and energy consumption, thereby reducing carbon emissions. To this end, the governments of the three northeastern provinces of China should strengthen publicity and public education and vigorously advocate suitable green consumption (Dang, 2021); they should also give more financial support to environmental protection work and stimulate the public to actively maintain the environment, with the aim of forming positive interactions between humans and the ecological environment (Li, 2016). Adjusting the industrial structure in Scheme 3 reduces water resource consumption by 2.222 billion m3, energy consumption by 76.68 million tons of standard coal, and carbon emissions by 50.38 million tons. Therefore, the three northeastern provinces should vigorously develop tertiary industries, actively develop productive service industries (Wang, 2021), improve traditional industries, promote the development of high-tech industries, and adhere to the road of new industrialization. Scheme 3 also proposes measures to optimize energy structure, including strengthening the use of non-fossil energy, improving the level of technological research and development in the field of new energy, promoting green and high-quality development (Shen, 2022), and phasing out traditional heating products with low heat production efficiency, leading to a transition to a low-carbon energy consumption structure (Wang et al., 2022).
Previous research on the WEC system has focused on the relationship between the three parameters, but there has been a lack of coordination and analysis of system coupling, and a recognition that the system is complex and changeable. It is necessary to consider the reliability of data and accuracy of index selection, especially when it comes to economics. The dynamic reaction chains in social and environmental fields are complex and cumbersome, and variables closely related to decision variables should be established as much as possible to ensure the integrity of the system. Therefore, this study clarifies that there is a close connection between water, energy, and carbon in the three northeastern provinces of China, but the degree of coordination is low. At the same time, within a certain error range, simulation results can accurately reflect changes in the consumption of water resources and energy, and carbon emissions. Combined with the actual situation of the three provinces in Northeastern China, we chose a reasonable simulation program and put forward corresponding policy suggestions. Our results are consistent with the actual changes in the three provinces in northeastern China, can objectively reflect the change trend of the WEC system in these provinces, and can provide a reference for comprehensive resource management and carbon emission reduction decision-making.
Despite these achievements, the WEC system requires further detailed study, and the following improvements should be made in future research: 1) Perfecting the index selection: the WEC system is complex and dynamic, and affected by many factors (Yu, 2020); in this paper, owing to difficulties in data acquisition, the selected evaluation index system may not have been comprehensive enough, which may have caused certain errors in the results. The index system should be further improved in future research. 2) Optimizing the system model: in the process of system dynamics modeling, the three northeastern provinces were treated as independent regions, and the migration of water, energy, and carbon between regions was not considered. In future research, the impact of WEC migration processes on the system should be discussed in more detail. Moreover, in this paper, we only selected some factors for research; for example, in the energy subsystem, only the main chemical energy sources (coal, oil, and natural gas) were analyzed, and the energy types were not subdivided. In future research, the influencing factors should be refined and variables should be added. 3) Missing data: a small number of index data in the model were missing. In this paper, SPSS software was used to supplement data using the moving average method, which can easily cause errors. In future research, data collection should be strengthened to improve accuracy.
According to the goal of “dual carbon”, this study clarified the relationship between water, energy, and carbon. Firstly we analyzed the coupling coordination of the WEC system, then constructed a dynamic model of the WEC system in three provinces in northeastern China. Finally, we simulated future water resource, energy consumption and carbon emissions, and explored the development path of energy conservation. Our main conclusions are as follows:
(1) The comprehensive index of the entire WEC system over the period 2001–2019 ranged from 0.0994 to 0.2314, indicating that the development level of the WEC system in the three northeastern provinces of China is relatively low, but shows a fluctuating upward trend.
(2) From a temporal perspective, the coupling degree of the WEC system in the three northeastern provinces of China from 2001 to 2019 was between 0.9457 and 0.9985. From a spatial point of view, the degree of coupling coordination in the central region was higher than that in the Northern and Southern regions: Jilin Province (0.3608) < Heilongjiang Province (0.3783) < Liaoning Province (0.3820).
(3) Water resources, energy consumption and carbon emissions all showed an increasing trend during the study period, with water resources consumption increasing the fastest. Under Scheme 4, compared with 2020, water resources, energy consumption and carbon emissions will increase by 230.4%, 210.7% and 36.9% respectively.
The original contributions presented in the study are included in the article/Supplementary Material, further inquiries can be directed to the corresponding author.
YC: Project administration, Supervision, Writing–review and editing. JL: Methodology, Visualization, Writing–original draft. LX: Funding acquisition, Investigation, Writing–review and editing. JY: Formal Analysis, Software, Supervision, Writing–review and editing. KL: Conceptualization, Methodology, Visualization, Writing–review and editing. NZ: Supervision, Visualization, Writing–review and editing. XJ: Conceptualization, Supervision, Visualization, Writing–review and editing. MW: Software, Visualization, Writing–review and editing. FM: Supervision, Writing–review and editing. HZ: Supervision, Writing–review and editing.
The author(s) declare financial support was received for the research, authorship, and/or publication of this article. This work was supported by the National Natural Science Foundation of China [grant number 42001407], the National Natural Science Foundation of China [Grant Number 42001416], the Shenzhen Science and Technology Program [grant number RCBS20221008093124064], the Guangdong Basic and Applied Basic Research Foundation [grant number 2019A1515110729], the Belt and Road Initiative Water and Sustainable Development Science and Technology Key Fund [grant number 2021nkzd02].
The authors declare that the research was conducted in the absence of any commercial or financial relationships that could be construed as a potential conflict of interest.
All claims expressed in this article are solely those of the authors and do not necessarily represent those of their affiliated organizations, or those of the publisher, the editors and the reviewers. Any product that may be evaluated in this article, or claim that may be made by its manufacturer, is not guaranteed or endorsed by the publisher.
Briones-Hidrovo, A., Rey, J. R. C., Dias, A. C., Tarelho, L. A., and Beauchet, S. (2022). Assessing a bio-energy system with carbon capture and storage (BECCS) through dynamic life cycle assessment and land-water-energy nexus. Energy Convers. Manag. 268, 116014. doi:10.1016/j.enconman.2022.116014
Chen, R., Guo, X., Xiong, B., Wang, Y., and Chen, Q. (2021). Climate change, land degradation and food insecurity:linkages and potential solutions. Acta Ecol. Sin. 41, 2918–2929. doi:10.5846/stxb201909221976
Chen, S., Tan, Y., and Liu, Z. (2019). Direct and embodied energy-water-carbon nexus at an inter-regional scale. Appl. Energy 251, 113401. doi:10.1016/j.apenergy.2019.113401
Chhipi-Shrestha, G., Hewage, K., and Sadiq, R. (2017). Water–energy–carbon nexus modeling for urban water systems: System dynamics approach. J. Water Resour. Plan. Manag. 143, 04017016. doi:10.1061/(asce)wr.1943-5452.0000765
Cui, W., Jiao, W., Min, Q., Wu, M., and Sun, Y. (2020). Environment impact assessment on traditional agricultural systems based on carbon foootprint:a case study of Qingtian rice-fish culture system. Acta Ecol. Sin. 40, 4362–4370. doi:10.5846/stxb201911162472
Dang, R. (2021). Research on the coupling coordination of water-land-energy-food system in gansu province master. Gan Su Sheng, China, Gansu Agricultural University.
Duan, C., and Chen, B. (2016). Energy-water-carbon nexus at urban scale. Energy procedia. 104, 183–190. doi:10.1016/j.egypro.2016.12.032
Elkhafif, M. A. (1996). An iterative approach for weather-correcting energy consumption data. Energy Econ. 18, 221–230. doi:10.1016/0140-9883(96)00010-2
Feng, M. (2022). Impact of rapid urbanization on water-energy-carbon coupling system: A case study of zhengzhou. Zhengzhou, China, North China University of Water Resources and Electric Power.
Gao, P., Fan, L., Hong, Y., Han, B., Lv, W., Bai, C. E., et al. (2022). Thoroughly studying and implementing the spirit of the important speeches made by general secretary Xi Jinping,and accelerating the construction of an economic system with Chinese characteristics. J. Manag. World 38, 1–56. doi:10.19744/j.cnki.11-1235/f.2022.0085
Han, S., Feng, Y., Zhang, F., Yang, C., Yao, Z., Zhao, W., et al. (2015). Metal-phosphide-containing porous carbons derived from an ionic-polymer framework and applied as highly efficient electrochemical catalysts for water splitting. Adv. Funct. Mater. 25, 3899–3906. doi:10.1002/adfm.201501390
Hiloidhari, M., Vijay, V., Banerjee, R., Baruah, D., and Rao, A. B. (2021). Energy-carbon-water footprint of sugarcane bioenergy: A district-level life cycle assessment in the state of Maharashtra, India. Renew. Sustain. Energy Rev. 151, 111583. doi:10.1016/j.rser.2021.111583
Hong, J., Li, Y., and Cai, W. (2021). Stimulating China's carbon emission peak path under different scenarios based on RICE-LEAP model. Resour. Sci. 43, 639–651. doi:10.18402/resci.2021.0401
Kotagodahetti, R., Hewage, K., Karunathilake, H., and Sadiq, R. (2022). Long-term feasibility of carbon capturing in community energy systems: A system dynamics-based evaluation. J. Clean. Prod. 377, 134460. doi:10.1016/j.jclepro.2022.134460
Li, D., Lu, J., Xie, X., Yu, H., Li, Y., and Wu, S. (2022a). Optimization simulation of land space zoning based on the classification constraints of main functional zones from the perspective of carbon neutrality: A case study of fujian province. Acta Ecol. Sin. 42, 10111–10126. doi:10.5846/stxb202112173585
Li, F., and Han, Y. (2022b). Research on the spatial-temporal coupling and coordination of the development and utilization of water resources and high-quality economic development in China. J. Econ. Water Resour. 40, 24–32+102. doi:10.3880/j.issn.10039511.2022.06.004
Li, G., Li, Y., Jia, X., Du, L., and Huang, D. (2016). Prof. Joseph E. Bavaria: Innovation is the only way for surgeons to move forward. Manag. Rev. 28, 11–26. doi:10.3978/j.issn.2221-2965.2015.12.08
Li, R., Zhao, R., Xie, Z., Xiao, L., Chuai, X., Feng, M., et al. (2022c). Water–energy–carbon nexus at campus scale: Case of north China university of water resources and electric power. Energy Policy 166, 113001. doi:10.1016/j.enpol.2022.113001
Li, Z. (2019). The analysis of the relationship between energy carbon emissions and water resources in surround cities of Beijing-Tianjin. Beijing, China: China University of Mining & Technology.Doctor
Liang, M., Huang, G., Chen, J., and Li, Y. (2022). Development of non-deterministic energy-water-carbon nexus planning model: A case study of Shanghai, China. Energy 246, 123300. doi:10.1016/j.energy.2022.123300
Meng, F., Liu, G., Liang, S., Su, M., and Yang, Z. (2019). Critical review of the energy-water-carbon nexus in cities. Energy 171, 1017–1032. doi:10.1016/j.energy.2019.01.048
Nikolov, N. T., and Fox, D. G. (1994). A coupled carbon-water-energy-vegetation model to assess responses of temperate forest ecosystems to changes in climate and atmospheric CO2. Part I. Model concept. Environ. Pollut. 83, 251–262. doi:10.1016/0269-7491(94)90040-x
Qu, Y., Yuan, Y., Guo, L., and Li, Y. (2022). Initial allocation of SO 2 emission rights based on the combination weighting method: Evidence from China’s thermal power plants. Environ. Sci. Pollut. Res. 29, 14743–14753. doi:10.1007/s11356-021-15745-x
Shen, L. (2022). Study on security guarantee and implementation strategy of China's natural resources towards carbon neutrality. J. Nat. Resour. 37, 3037–3048. doi:10.31497/zrzyxb.20221201
Su, X. (2022). Carbon reduction consumption in Shanghai based on water saving and analysis and relationship between water and energy master. Shanghai, China: East China Normal University.
Tian, P. (2021). Water-Energy-Carbon nexus in China's trade network:An analysis with multi-regional input-output paradigm. Beijing, China: North China Electric Power University.
Valek, A. M., Sušnik, J., and Grafakos, S. (2017). Quantification of the urban water-energy nexus in México City, México, with an assessment of water-system related carbon emissions. Sci. Total Environ. 590, 258–268. doi:10.1016/j.scitotenv.2017.02.234
Venkatesh, G., and Brattebø, H. (2011). Energy consumption, costs and environmental impacts for urban water cycle services: Case study of Oslo (Norway). Energy 36, 792–800. doi:10.1016/j.energy.2010.12.040
Wang, F., Cao, J., Wang, N., Jiao, Y., and Li, Y. (2022). Consumption and coupling of virtual water and virtual energy in the pase 20 years and predicting their demand for the next decade in China. China Environ. Sci. 42, 4919–4930. doi:10.19674/j.cnki.issn1000-6923.20220507.004
Wang, H., Xiao, L., and Liao, B. (2022). Simulation of China's carbon emission reduction Path based on system dynamics. J. Nat. Resour. 37, 1352–1369. doi:10.31497/zrzyxb.20220517
Wang, W. (2021). Research on high end development of manufacturing industry in Northeast old industrial base. Liaoning, China: Liaoning University.
Wang, X., Zhao, S., Liu, X., Duan, H., and Song, J. (2021). Carbon neutrality oriented provincial consumption-based carbon emission reduction models:based on the multi-regional input-output model. Ecol. Econ. 37, 43–50.
Wu, M. (2019). Study on water-energy-carbon emission relationship and policy coordination control in Shanxi Province, Master. Beijing, China: China University of Petroleum.
Xiong, J., Wang, W., He, S., Yin, Y., and Tang, C. (2020). Spatial-temporal pattern and influencing factors of coupling and coordination of tourism urbanization system in dongting lake region. Sci. Geogr. Sinca 40, 1532–1542. doi:10.13249/j.cnki.sgs.2020.09.015
Yang, X., Feng, W., and Ran, X. (2019). Introduction to new energy and sustainable development. Chongqing, China: Chongqing University Press.
Yang, X., Wang, Y., Sun, M., Wang, R., and Zheng, P. (2018). Exploring the environmental pressures in urban sectors: An energy-water-carbon nexus perspective. Appl. Energy 228, 2298–2307. doi:10.1016/j.apenergy.2018.07.090
Yang, Z., Li, Z., Rao, Y., Yang, L., Xue, Y., Zhang, Y., et al. (2022). Ultrasensitive multiplex SERS immunoassay based on porous Au-Ag alloy nanoparticle-amplified Raman signal probe and encoded photonic crystal beads. Ecol. Econ. 38, 13–20. doi:10.1007/s00604-022-05539-4
Yoon, P. R., Lee, S.-H., Choi, J.-Y., Yoo, S.-H., and Hur, S.-O. (2022). Analysis of climate change impact on resource intensity and carbon emissions in protected farming systems using Water-Energy-Food-Carbon Nexus. Resour. Conservation Recycl. 184, 106394. doi:10.1016/j.resconrec.2022.106394
Yu, J. (2020). Study on carbon emission of water system in zhengzhou city based on "Water-Energy-Carbon" nexus, master. Zhengzhou, China: North China University of Water Resources and Electric Power.
Zhang, K., Miao, M., and Zhang, L. (2022). Carbon peaking and carbon neutrality goals and reflections on China's energy transition Part I —— energy Transition,Carbob peaking and carbon neutrality. Sino-Global Energy 27, 1–6.
Zhang, M., and Han, B. (2022a). The study on the coupling and coordinated development of water resources utilization and industrial structure in the yellow river basin. J. Xi'an Shiyou Univ. Sci. Ed. 31, 1–9+16. doi:10.3969/j.issn.1008-5645.2022.05.001
Zhang, Q., Wang, X., Hu, T., Wang, K., and Gong, L. (2022b). Assessing the effectiveness and fairness of carbon tax based on the water-energy-carbon nexus of household water use. J. Clean. Prod. 359, 132063. doi:10.1016/j.jclepro.2022.132063
Zhang, Y., Khan, S. U., Swallow, B., Liu, W., and Zhao, M. (2022c). Coupling coordination analysis of China's water resources utilization efficiency and economic development level. J. Clean. Prod. 373, 133874. doi:10.1016/j.jclepro.2022.133874
Zhao, L., Han, Z. L. Y., Milind, K., Zhang, Z., and Ding, M. (2016). The Coupling interaction mechanism of regional water-land-energy-carbon system. Acta Geogr. Sin. 71, 1613–1628. doi:10.11821/dlxb201609012
Zhao, R., Liu, Y., Tian, M., Ding, M., Cao, L., Zhang, Z., et al. (2018). Impacts of water and land resources exploitation on agricultural carbon emissions: The water-land-energy-carbon nexus. Land Use Policy 72, 480–492. doi:10.1016/j.landusepol.2017.12.029
Zheng, D., Wang, J., Li, Y., Jiang, J., and Lv, L. (2021). Spatial-temporal variation of water resources stress and its influencing factors based on water-saving in China. Sci. Geogr. Sinca 41, 157–166. doi:10.13249/j.cnki.sgs.2021.01.017
Zhou, Q., Zou, J., Rong, Y., Liu, A., Li, Y., and He, X. (2023). Moment estimation -TOPSIS-RSR-based comprehensive evaluation of water resources carrying capacity in Kunming. Water Resour. Hydropower Eng. 54, 73–84. doi:10.13928/j.cnki.wrahe.2023.02.007
Keywords: double carbon target, water-energy-carbon system, coupling coordination, system dynamics, scenario simulation, three provinces in Northeastern China
Citation: Cao Y, Li J, Xie L, Yao J, Li K, Zhang N, Ji X, Wang M, Mo F and Zhai H (2023) Coupling coordination of the water‒energy‒carbon system in three provinces of Northeastern China. Front. Environ. Sci. 11:1261339. doi: 10.3389/fenvs.2023.1261339
Received: 19 July 2023; Accepted: 14 August 2023;
Published: 31 August 2023.
Edited by:
Yahui Guo, Central China Normal University, ChinaReviewed by:
Weichao Yang, Tianjin Chengjian University, ChinaCopyright © 2023 Cao, Li, Xie, Yao, Li, Zhang, Ji, Wang, Mo and Zhai. This is an open-access article distributed under the terms of the Creative Commons Attribution License (CC BY). The use, distribution or reproduction in other forums is permitted, provided the original author(s) and the copyright owner(s) are credited and that the original publication in this journal is cited, in accordance with accepted academic practice. No use, distribution or reproduction is permitted which does not comply with these terms.
*Correspondence: Jing Li, TGlKaW5nMjAyMjUyMEAxNjMuY29t; Linfu Xie, bGluZnV4aWVAc3p1LmVkdS5jbg==
Disclaimer: All claims expressed in this article are solely those of the authors and do not necessarily represent those of their affiliated organizations, or those of the publisher, the editors and the reviewers. Any product that may be evaluated in this article or claim that may be made by its manufacturer is not guaranteed or endorsed by the publisher.
Research integrity at Frontiers
Learn more about the work of our research integrity team to safeguard the quality of each article we publish.