 Lili Yang
94% of researchers rate our articles as excellent or good
Learn more about the work of our research integrity team to safeguard the quality of each article we publish.
Find out more
ORIGINAL RESEARCH article
Front. Environ. Sci., 26 April 2022
Sec. Atmosphere and Climate
Volume 10 - 2022 | https://doi.org/10.3389/fenvs.2022.832710
This article is part of the Research TopicDust and Polluted Aerosols: Sources, Transport and Radiative EffectsView all 13 articles
In order to improve the accuracy of dust storm prediction and reduce the damage and losses by a dust storm event, it is necessary to conduct an in-depth study on the same. The data of the national air quality stations, backward trajectories generated by the Hybrid Single-Particle Lagrangian Integrated Trajectory model (HYSPLIT), and the lidar network data from Wuwei, Baiyin, and Dingxi were used to study a large-scale dust storm event that occurred from 12 to 14 May 2019. This study explores the cause of the dust storm and physical characteristics of dust aerosols in three-dimensional space, as well as its impact on air quality. Results show that the dust storm was caused by the eastward movement of the East Asian trough and affected most cities in northern China from northwest to southeast. Consequently, the air quality deteriorated seriously, especially over the Hexi Corridor. The hourly peak concentrations of PM10 in Wuwei and Baiyin were close to 3,000 μg·m−3. The observations from the lidar network show that the dust intensities were similar at different cities, and their extinction coefficients were close. However, the depolarization ratio varied with sources and the physical characteristics of dust particles. According to the simulation results of extinction coefficients and particle concentrations, due to the impact of dust transported at high altitudes, the concentration of particles in Dingxi did not decrease with the increase in altitude. The particle concentrations from ground-based monitoring were lower than those of Baiyin and Wuwei, while particle concentrations above 0.3 km were higher than those of Baiyin and Wuwei.
Since 1990, with the rapid development of industries and urbanization, as a consequence of economic growth and population aggregation, China’s urban ambient air quality has been seriously deteriorated, with air pollution growing into one of the most concerned environmental issues in China. Many scholars in the environmental field have been focusing on the research of PM2.5 and O3 (Lou et al., 2016; Maji et al., 2017; Chen et al., 2020; Jiang and Xia, 2021). In addition, in response to the severe air pollution situation, China introduced the “Air Pollution Prevention and Control Action Plan” and the “Air Pollution Prevention and Control Law” in September 2013 and August 2015, respectively. By combining the effective measures in the field of air pollution prevention and control over the years, China has made more comprehensive regulations on the problems of pollution in various fields. With the implementation of a series of environmental protection measures, China’s ambient air quality has been greatly improved during the 13th Five-Year Plan period (Zeng et al., 2019; Maji et al., 2020; Zhao et al., 2020; Hu et al., 2021), especially in a megalopolis. However, in northern China, especially in northwest China, due to the geographic proximity to several large deserts, the area is prone to be hit by dust storms, which causes heavy pollution (Wu and Kai, 2016; Guo et al., 2019; Yang et al., 2021a; Rupakheti et al., 2021; Zhang et al., 2021). According to the statistics (Yang et al., 2021b), the dust events in China decreased year by year, but the strong dust storm did not decrease during 2015–2020. Therefore, research on dust events cannot be ignored.
At present, the monitoring method of dust events is relatively limited, with ground-based monitoring stations as main approaches, which only represent the dust intensity over the ground, and cannot detect the dust intensity of high altitudes and the height of dust. With the advancement of science and technology, a series of satellites has been successfully launched, and the pieces of remote sensing equipment carried by them have realized the vertical monitoring of aerosols. Therefore, most scholars studied dust events based on the aerosol optical depth (AOD) obtained from the secondary product of satellites (Banks et al., 2013; Feng et al., 2015; Long et al., 2015; Guo et al., 2017; Reiji, 2018). However, the relationship between the temporal and spatial variability of the AOD and the ground-monitoring particulate matter varies with places (Li et al., 2014a; Li et al., 2015; Xu et al., 2021) and seasons (Schafer et al., 2008; Li et al., 2014b; Hu et al., 2016; Ma et al., 2016). Due to various uncertainty sources such as calibration, surface parameterization, and assumptions in aerosol retrieval models, there is great uncertainty in the AOD retrieved by the satellite. Therefore, if the AOD retrieved by the satellite is used to retrieve particle concentrations, the error will be further increased. Additionally, polar orbiting satellites pass through the same area twice a day in a fixed time, which cannot capture the whole process of the weather system or pollution process. On the other hand, satellites cannot detect the atmospheric conditions under the clouds.
The ground-based lidar fills the gap with higher temporal resolution, which is widely applied in fields such as urban scenarios, environment, ecology, and so on (Bai et al., 2021; Floutsi et al., 2021; Taubert et al., 2021). The aerosol lidar is widely used in the study of dust events. Salgueiro et al. (2021) studied the pollution process jointly affected by a forest fire and Saharan desert dust aerosols over southwestern Europe on June 21, 2019, by using a multi-wavelength Raman lidar and Sun photometer and summarized the different characteristics of forest fire and dust aerosol particles. Janicka et al. (2017) have conducted a similar research study by using the aerosol-polarization-Raman PollyXT-UW lidar for a serious pollution caused by forest fires and dust events in Warsaw, Central Poland, on 10 July 2013. In order to better understand the differences between dust aerosols and anthropogenic pollutants in large spatial scales in China, Banks et al. (2017) employed an elastic lidar to investigate the vertical profiles of aerosols along the Yangtze River during the Yangtze River Campaign of winter 2015. Durable Saharan dust event incursions over the city of Sofia, Bulgaria, on 15 and 23 April, and aerosol layers extraordinary in altitude (up to 15 km) were detected by an Nd:YAG-laser-based lidar (Atanaska et al., 2017).
A ground-based lidar can detect the vertical distribution of aerosols, but the monitoring of an individual lidar cannot reflect the characteristics of aerosols in three-dimensional space. In order to promote the continuous improvement of air quality in the Beijing–Tianjin–Hebei area and surrounding areas, the China National Environmental Monitoring Centre (CNEMC) established a comprehensive three-dimensional observation network of air pollution in 2017, including 37 lidars (Wang et al., 2019), which are mainly deployed in Beijing, Tianjin, Hebei, Henan, Shandong, Shanxi, and other regions. In order to obtain the characteristics of dust in three-dimensional space, reveal the source, transmission, and development trend of dust, and improve the method of dust monitoring, the Department of Ecology and Environment of Gansu Province successively built multiple lidars in Gansu Province from 2019 to 2020, filling the gap of the lidar network in northwest China.
In this study, the dust event that occurred from 11 to 14 May 2019 (all times mentioned in this study refer to Beijing time) was comprehensively analyzed based on the lidar network in northwest China, combined with the data from China’s national urban air quality monitoring stations, National Centers for Environmental Prediction (NCEP) reanalysis data, and HYSPLIT backward trajectory. The dust sources and the synoptic system were thoroughly studied, as well as the changes of particle sizes and concentrations in the process of dust transmission, especially in the vertical direction. By fitting the extinction coefficient and the particle concentration, the monitoring of particle concentration was extended from the ground to a high altitude, which realized the research of lidar data from qualitative to quantitative. This study will help us to further understand the process of dust storms, provide a basis for the improvement of numerical prediction, contribute to the prediction and early warning of dust events, and reduce the harm caused by dust.
The data and methodology are introduced briefly in Section 2. The distribution of three-dimensional space and transmission and development of the dust event are shown in Section 3. Section 4 gives the conclusion and possible further improvements to this study.
The stations of the three lidars for capturing the dust storm are located in Wuwei (102.65°E, 37.91°N), Baiyin (104.13°E, 36.54°N), and Dingxi (104.61°E, 35.60°N). The three lidars are of the same type, named as AGHJ-I-LIDAR, whose laser is Nd:YAG and emits wavelengths of 355 and 532 nm. The aerosols in the atmosphere produce Mie scattering after encountering with the emitted laser, and the scattering signals with the direction of 180° (backscattering) are received and are then divided into three channels, which are 355 nm parallel, 532 nm parallel, and 532 nm vertical, respectively. The maximum pulse energy of 355 and 532 nm wavelengths reach 25 and 30 mJ, respectively. The spatial resolution of the lidar is 7.5 m, the temporal resolution is 5 min, the maximum detection distance is 10 km, and the blind zone and incomplete-overlap zone are 30 and 120 m, respectively. The characteristics of atmospheric aerosol were studied by converting the received signal into the extinction coefficient and depolarization ratio (Lee and Noh, 2015; Nishizawa et al., 2017; Niu et al., 2019; Panahifar et al., 2020). The specific algorithm was presented elsewhere (Yang et al., 2021a).
HYSPLIT (Draxler and Hess, 1998) was originally jointly developed by the Air Resources Laboratory (ARL) of the National Oceanic and Atmospheric Administration (NOAA) and the Bureau of Meteorology, Australia. HYSPLIT calculates and analyzes the transport and diffusion trajectory and settlement of air pollutants based on meteorological data and the Lagrange method. The data of the Global Data Assimilation System (GDAS) from the NCEP are used as the initial field of HYSPLIT, and the horizontal resolution is 1 × 1.
The observational data of PM2.5 and PM10 hourly concentrations were released on the National Urban Air Quality Real-Time Release Platform of CNEMC. The data are monitored by the automatic monitoring instruments installed in the national urban air quality monitoring stations with the temporal resolution of 1h, which work continuously throughout the year, and there are 1,436 stations in China. The collection duration of PM2.5 and PM10 concentrations is required to stay at least 20 h per day and at least 45 min per hour, according to the ambient air quality standard (GB 3095–2012); otherwise, the data shall be deemed invalid.
The data used to analyze the synoptic system guiding dust storms were derived from NCEP reanalysis data, which assimilate real-time observation data such as station data, satellite observation, ships, and planes. The horizontal resolution is 2.5 × 2.5, and the time resolution is 6 h. The pressure level is divided into 17 layers (1,000, 925, 850, 700, 600, 500, 400, 300, 250, 200, 150, 100, 70, 50, 30, 20, and 10 hPa). The temperature and wind field in ground data were derived from the 0.995 sigma level.
The dust storm that occurred from 11 to 14 May 2019 seriously affected most cities in northern China. Many studies show that the Himawari geostationary satellite has advantages in dust detection (Bessho, et al., 2016; She et al., 2018; Xia et al., 2019; Zhang et al., 2019). As shown in Figure 1, the Himawari-8 detection results at 09:00 a.m. on May 11 with less cloud influence were selected. It can be seen that the dust over the Taklimakan Desert was very serious, and it was transmitted eastward to the west of Hexi Corridor and Inner Mongolia.
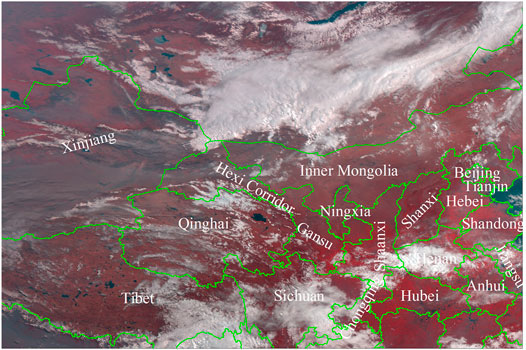
FIGURE 1. Spatial distribution of clouds and dust storms derived from the Himawari-8 geostationary satellite at 09:00 BT on 11 May.
The dust event caused a sharp increase in the concentration of particulate matter in the atmosphere. In order to explore the impact of the dust event on the ambient air quality, the mass concentration of PM10 and PM2.5 monitored on the ground was used to study the impact in the horizontal direction, and the ground-based lidar network was used to study the impact in the vertical direction.
In order to show the impact scope, intensity, and trend of the dust event, Figure 2 shows the distribution of the hourly concentration of PM10 monitored on the ground from 06:00 a.m. on May 11 to 06:00 a.m. on May 13; it can be seen that the process of dust transmission takes place from west to east. Meanwhile, the hourly concentration of PM10 and PM2.5 of nine cities from 00:00 a.m. on May 11 to 00:00 a.m. on May 14 was selected to have a thorough understanding of the impact of the dust process on the urban ambient air quality (Figure 3A). The cities arranged from top to bottom in Figure 3A were from west to east in the geographical location (Figure 3B); it also showed the process of dust transmission from west to east, and the trend of PM2.5 and PM10 hourly concentrations was consistent during the dust process.
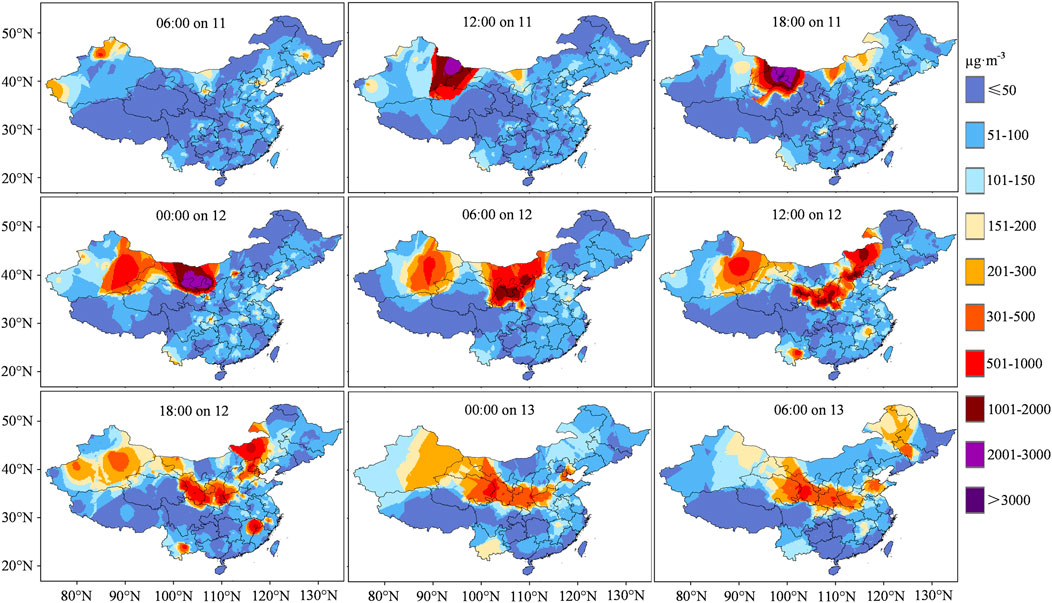
FIGURE 2. Distribution of the hourly concentration of PM10 monitored on the ground from 06:00 on 11 May to 06:00 on 13 May.
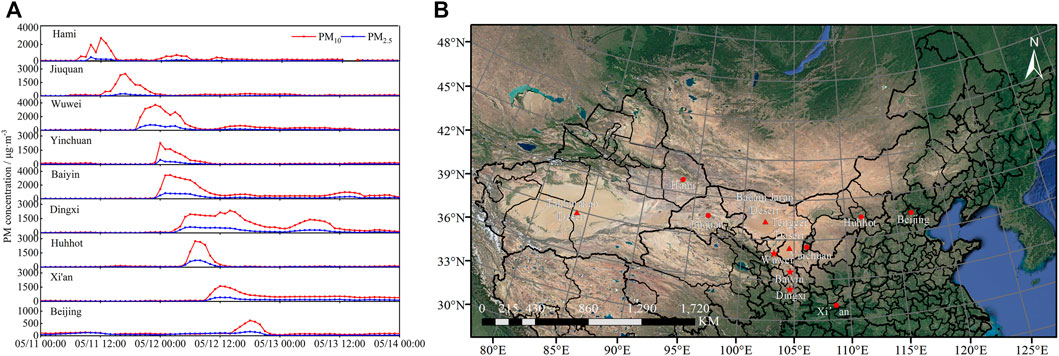
FIGURE 3. Hourly concentration of PM10 and PM2.5 of nine cities from 00:00 on 11 May to 00:00 on 14 May (A); locations of the studied cities and their surrounding geomorphic characteristics, ● represents cities, ▲ represents deserts, and ★ represent lidar stations (B).
As can be seen from Figure 2, there was little impact of dust at 06:00 a.m. on May 11; however, the concentration of PM10 in Hami increased to 574 μg·m−3 at 08:00 a.m. (Figure 3A), and the air quality deteriorated to serious pollution. The north of Xinjiang and the west of the Hexi Corridor were obviously affected at 12:00 p.m.; the concentration of PM10 in Hami reached the peak of 2,759 μg·m−3, and the concentration of PM2.5 increased to 230 μg·m−3. Subsequently, the dust transmitted from west to east, and the dust intensity in Hami decreased significantly. The west of the Hexi Corridor began to be affected by dust (Figure 2). As a result, the concentration of PM10 in Jiuquan gradually increased, and the ambient air quality deteriorated into serious pollution at 13:00 (Figure 3A), and the PM10 concentration reached the peak of 2,464 μg·m−3 until 17:00; the PM2.5 concentration reached the peak concentration of 244 μg·m−3 at the same time. Then, the dust continued to move eastward; the PM10 concentration in Jiuquan gradually decreased, and it was 1808 μg·m−3 at 18:00 and 94 μg·m−3 at 01:00 on May 12. The dust moved very slowly (60 km·h−1) in the Hexi Corridor and did not affect Wuwei until 20:00 on May 11 (Figure 3A). The PM10 concentration in Wuwei suddenly increased from 76 μg·m−3 in the previous hour to 1,498 μg·m−3 and reached a peak of 2,703 μg·m−3 at 23:00; at the same time, the PM2.5 concentration reached 614 μg·m−3. The peak concentration of PM10 in Wuwei was significantly higher than that in the upwind area, which might be due to the superposition of the dust in the Badain Jaran Desert. As can be seen from Figure 2, the air quality in the west of the Hexi Corridor improved significantly at 00:00 on 12 May, and the eastward movement of the dust affected the central and western part of Inner Mongolia, the central and eastern part of the Hexi Corridor, and the central part of Gansu and Ningxia. Yinchuan and Baiyin were hit by dust almost at the same time (Figure 3A); the PM10 concentration increased to 2,250 μg·m−3 and 1,407 μg·m−3 at 00:00 on 12 May, respectively, and the PM2.5 concentration increased to 483 μg·m−3 and 514 μg·m−3, respectively. Then, the PM10 concentration in Yinchuan gradually decreased, and the air quality improved at 12:00. Nevertheless, the dust intensity in Baiyin continued to increase after 00:00 on 12 May, and the peak concentration of PM10 and PM2.5 reached 2,727 μg·m−3 and 614 μg·m−3 at 02:00, which was second to Wuwei. The influence of dust in Baiyin lasted for a long time, and the concentration of PM10 did not drop to 264 μg·m−3 until 00:00 on 14 May, which might be due to the superposition of the dust in the Tengger Desert. In addition, the dust was transmitted from Wuwei to Baiyin at an average speed of 50 km·h−1. Compared with other cities, the PM10 concentration in Dingxi increased slowly (Figure 3A), with the level of 347 μg·m−3 at 03:00 on 12 May, and the peak concentration of PM10 and PM2.5 reached 2045 μg·m−3 and 478 μg·m−3 at 06:00 on 12 May; the dust intensity was weaker than that in upwind cities, but the PM10 concentration decreased slowly. As a result, the heavy pollution in Dingxi lasted for a long time. It is preliminarily considered that the dust was mainly floating dust when it was transmitted to Dingxi, combined with the local topographic conditions that were not conducive to the diffusion of pollutants. Huhhot was affected by dust for a short time (Figure 3A), with the peak concentration of PM10 and PM2.5 reaching 2,732 μg·m−3 and 714 μg·m−3 at 07:00 on 12 May, and the air quality improved after 13:00. Xi’an was slightly affected by dust (Figure 3A), but it lasted for a long time; the PM10 concentration decreased to 144 μg·m−3 until 13:00 on the 15th. The duration of dust influence lasted for the shortest time in Beijing, with the concentration of PM10 increasing to 226 μg·m−3 at 15:00 on 12 May, and decreased to 83 μg·m−3 at 22:00. When the dust was transported to Beijing (Figure 3A), the intensity of dust weakened significantly, and the peak concentration of PM10 was only 618 μg·m−3.
It can be seen from Figure 2 that most cities in northern China were affected by dust on 12 May, with the central and eastern part of Gansu, Ningxia, Shaanxi, and most parts of Inner Mongolia being hit the hardest. The front air mass of the dust reached the Beijing–Tianjin–Hebei area. The intensity of dust increased significantly, especially in Lanzhou, which is located in the center of Gansu, with a daily average concentration of PM10 reaching 1,275 μg·m−3, which was 8.5 times the secondary standard of PM10 specified in GB3095-2012. The floating dust was transported to the Yangtze–Huaihe region, and the scope of dust impact was further expanded on 13 May. Gansu, Ningxia, and Shaanxi remained as the central areas of strong dust, and the daily average concentration of PM10 was about 500 μg·m−3. Sichuan, Hubei, Henan, Shandong, Anhui, and Jiangsu were newly affected areas by floating dust, and the daily average concentration of PM10 was 200–300 μg·m−3. The dust concentration in the Beijing–Tianjin–Hebei area decreased significantly. On 14 May, with the gradual diffusion and settlement of dust during the transportation process, the impact scope was not significantly expanded compared with the previous day. The influence of dust in upwind cities gradually ended, and the dust intensity was significantly weakened. The daily average concentration of PM10 in the affected cities remained at about 250 μg·m−3. Subsequently, the strong cold air moved to the south and east and removed pollution obviously. The impact of the dust event gradually ended, and the ambient air quality improved after the 14th.
In summary, the strong dust event lasted for a long time and affected a wide area. The northern part of Xinjiang was first affected on 11 May, and then, the dust spread to the Beijing–Tianjin–Hebei area and the Yangtze–Huaihe region, which affected most cities in northern China. The ambient air quality deteriorated into serious pollution, and the air quality in the Hexi Corridor was the most affected. Until 14 May, the affected cities were dominated by floating dust, and the impact of dust gradually weakened. The variation trend of PM10 and PM2.5 was consistent, but the concentration of PM10 was significantly greater than that of PM2.5, indicating that the particles were carried mostly by coarse particles, and the proportion of coarse particles in cities near the source was higher. When dust was transmitted to downwind cities, it was mainly in the form of floating dust, and the proportion of fine particles increased slightly. In addition, the transmission speed of dust in the Hexi Corridor was about 50–60 km·h−1. Combined with the moving path of dust and the distance between cities, the dust rising time of downwind cities can be effectively predicted, which plays a guiding role in the qualitative prediction of dust in downwind cities.
The data of national air quality stations are mainly derived by ground-based monitoring, which cannot reflect the change characteristics of particles in the vertical direction. As a piece of active remote sensing equipment, the aerosol lidar makes up for the disadvantage that particle monitoring is limited to the ground. The results from the lidar can not only reflect the distribution characteristics of particles in the vertical direction but also reflect the particle size and morphological characteristics of particles. According to the development height of the dust, the detection results of the three aerosol lidars within 3 km from 12:00 on 11 May to 00:00 on 14 May are shown in Figure 4. In order to explore the monitoring effect of the three aerosol lidars, the curves of hourly PM10 concentrations (the black solid line) monitored from the ground were superimposed on the distribution of the extinction coefficient on the left side of Figure 4. It can be seen that the near-ground extinction coefficients were consistent with the variations of PM10 concentrations. During periods of strong dust, the extinction coefficients of the three lidars were all greater than 1 km−1. The temporal and spatial distribution of the extinction coefficient of Wuwei (Figure 4A) shows that the dust in Wuwei was mainly concentrated within the height of 0.8 km from 19:00 on 11 May to 04:00 on 12 May, and the strong dust (extinction coefficient greater than 1 km−1) was distributed within the height of 0.4 km; the ground PM10 concentration in some periods was over 2000 μg·m−3. From 07:00 to 12:00 on 12 May, the near-ground extinction coefficients were low, and the corresponding PM10 concentrations were low (less than 200 μg·m−3). However, there was a strong dust zone at an altitude of 1.0–1.5 km during this period; the extinction coefficients in some areas were close to 2 km−1, and the strong dust zone showed a sinking trend. It was expected that the local air quality would deteriorate again during the dust deposition process, and the monitoring results showed that the near-ground extinction coefficients and corresponding PM10 concentrations increased again after 12:00. From the extinction coefficients of Baiyin (Figure 4C), it can be seen that during the dust period, the vertical height of dust development of Baiyin was mainly concentrated at the height of about 1.5 km. The strong dust of Baiyin was concentrated within 0.3 km from 22:00 on 11 May to 08:00 on 12 May, and the extinction coefficients in some periods were even greater than 2 km−1, corresponding to the ground-monitoring PM10 concentration greater than 2000 μg·m−3. Then, the extinction coefficients weakened with the weakening of the dust intensity and enhanced again at 10:00–14:00 on 13 May, corresponding to the extinction coefficients greater than 1 km−1. However, at this time, the corresponding PM10 concentration only reached about 500 μg·m−3, indicating that the high-altitude dust transmission was significantly increased compared with the previous period of strong dust. From the extinction coefficients of Dingxi (Figure 4E), it can be seen that the vertical height of dust development of Dingxi was close to that of Baiyin, but the strong dust developed to the height of 0.6 km, which was higher than that of Wuwei and Baiyin. When it comes to the duration of the dust process among the three cities, it lasted the longest in Dingxi, while Baiyin and Wuwei had undergone similar duration. Therefore, the higher the development height of strong dust was, the longer it took for aerosol particles to settle and the longer the dust events lasted.
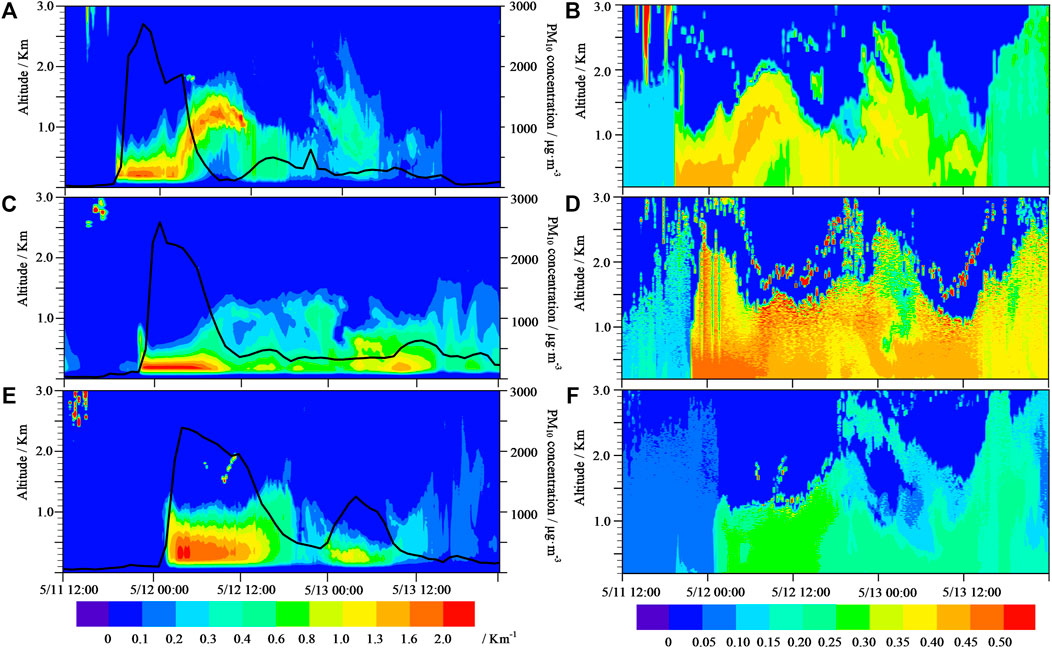
FIGURE 4. Extinction coefficient (left panel) and depolarization ratio (right panel) of the lidar network from 12:00 on 11 May to 00:00 on 14 May (from top to bottom: Wuwei (A, B), Baiyin (C, D), and Dingxi (E, F); black solid line: hourly PM10 concentrations monitored from the ground).
The temporal and spatial distribution of depolarization ratios is shown in the right side of Figure 4. The depolarization ratios increased significantly during the dust process, and at the same lidar station, the higher the dust intensity was, the greater the extinction coefficients and the greater the depolarization ratios became. With the weakening of the dust intensity, the depolarization ratios decreased, indicating that the proportion of non-spherical particles carried in strong dust was higher than that in floating dust. Wuwei and Baiyin, as the cities near the sources, had significantly higher depolarization ratios than Dingxi over the period of strong dust. Therefore, it can be inferred that the proportion of non-spherical particles in the dust near the source was higher. In the dust process of transmission to the downwind cities, the non-spherical particles were affected by both air resistance and sedimentation and settled faster than the spherical particles. Therefore, when the dust was transported to the downwind cities, the proportion of non-spherical particles decreased. In addition, the dust intensities of Baiyin and Wuwei were similar, but the depolarization ratios of Baiyin (Figure 4D) were significantly greater than those of Wuwei (Figure 4B). Combined with the backward trajectory of Figure 8, it showed that the depolarization ratios in different sources with similar dust intensities were not necessarily close.
The results of the lidar completely showed the development and transmission of dust, which played a positive guiding role in the nowcasting of dust in local and downwind cities. The higher the development height of strong dust was, the longer the duration of dust events lasted. The extinction coefficients with similar dust intensities were close, but the depolarization ratios were not necessarily close. The reason may be due to different sources, or that spherical particles may be easier to transport, and non-spherical particles may be easier to settle in the downwind transmission of dust.
In order to obtain the temporal and spatial changes of particle concentration during dust events, especially the changes in vertical height, the mass concentration of the particulate matter obtained by the aerosol lidar is the direction that many scholars (Xiang et al., 2015; Yang et al., 2021a) have been working on. The extinction coefficients at 200 m height from 12:00 on 11 May to 00:00 on 14 May were selected to fit with the ground-monitoring particle concentration, and the fitting results are presented in Figure 5. The relative humidity of each lidar station during the fitting period was less than 80%, so the influence of water vapor on the extinction coefficient was ignored. It was found that the extinction coefficients at 200 m height had a high correlation with the concentrations of PM10 and PM2.5 monitored on the ground, and when the particle concentrations were greater, the correlation was higher, and the fitting effect was better. The fitting curves of Wuwei and Dingxi were close to linearity. However, due to the influence of meteorological conditions such as humidity (Lagrosas et al., 2017; Lv et al., 2017), when the extinction coefficients of Baiyin increased to a certain extent, the change was not obvious with the increase of particle concentration, and the reason needs to be further explored.
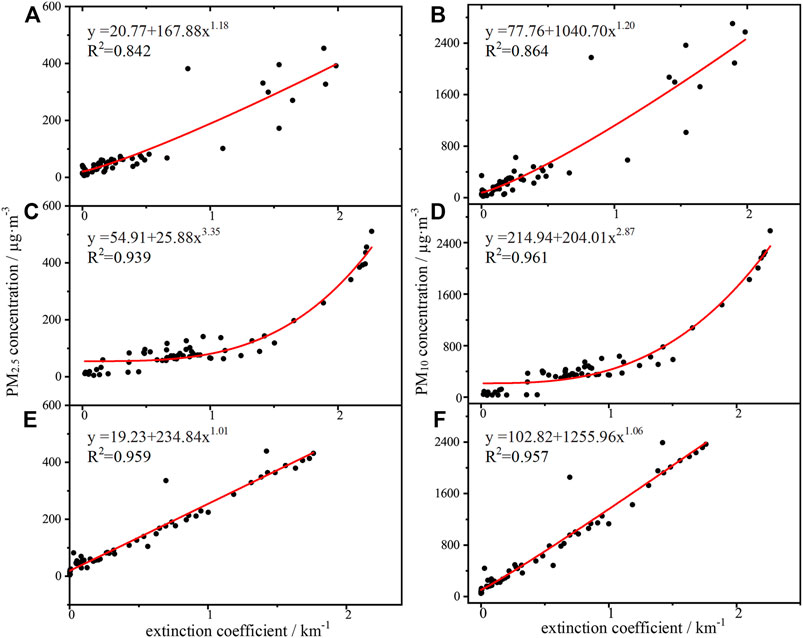
FIGURE 5. Relationship between the extinction coefficient and PM2.5 (left panel), PM10 (right panel) concentration monitored on the ground (from top to bottom: Wuwei (A,B), Baiyin (C,D), and Dingxi (E,F).
y = a + bxc (Figure 5) was selected as the best fitting formula after the comparison of various fitting formulas. The parameters c of Wuwei and Dingxi were close to 1, indicating a linear fitting, and the parameter c of Baiyin were 3.35 and 2.87 for PM2.5 and PM10, respectively. Fortunately, the fitting effect of the extinction coefficients of each lidar with the concentration of PM2.5 and PM10 was very good. Compared with Baiyin and Dingxi, the fitting results of Wuwei were slightly worse, the correlation coefficient (R2) of fitting PM2.5 and PM10 were 0.842 and 0.864, respectively. The R2 of the fitted PM2.5 of Baiyin and Dingxi were 0.939 and 0.959, and the R2 of the fitted PM10 were 0.961 and 0.957, respectively.
Based on the aforementioned analysis, the greater the particle concentration, the better is the fitting effect. Therefore, the period when the PM10 concentrations exceeded 500 μg·m−3 was selected to estimate the distribution of the average concentration of PM2.5 and PM10 at different heights (Figure 6). The selected periods for Wuwei, Baiyin, and Dingxi were 20:00 on 11 May to 06:00 on 12 May, 00:00–12:00 on 12 May, and 04:00 on 12 May to 10:00 on 13 May, respectively. The distribution of the average concentrations of PM2.5 and PM10 at different heights can been seen from Figures 6A, B.
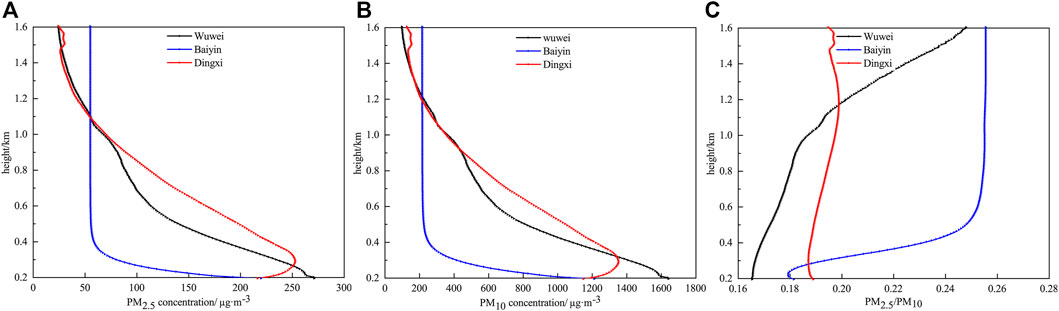
FIGURE 6. Vertical variation of PM2.5 and PM10 average concentrations over the strong dust period (A) PM2.5; (B) PM10; and (C) PM2.5/PM10.
The concentrations of PM2.5 and PM10 in Wuwei gradually decreased with the increase in altitude. The average concentration of PM2.5 decreased from 520 μg·m−3 on the ground to 270 μg·m−3 at 0.2 km height and to 67 μg·m−3 at 1 km height, and the average concentration of PM10 decreased from 2,437 μg·m−3 on the ground to 1,639 μg·m−3 at 0.2 km height and to 364 μg·m−3 at 1 km height. The concentrations of PM2.5 and PM10 in Baiyin decreased rapidly with the increase in altitude within 0.4 km. The average concentration of PM2.5 decreased from 515 μg·m−3 on the ground to 193 μg·m−3 at 0.2 km height and to 59 μg·m−3 at 0.4 km height, and the average concentration of PM10 decreased from 2088 μg·m−3 on the ground to 1,071 μg·m−3 at 0.2 km height and to 255 μg·m−3 at 0.4 km height. Combined with Figure 4C, the extinction coefficients above 0.4 km height were very small, indicating that the dust intensities were very small and the fitting would lead to a large error, so it would not be analyzed. The average concentration of PM2.5 in Dingxi decreased from 325 μg·m−3 on the ground to 225 μg·m−3 at 0.2 km height, and the average concentration of PM10 decreased from 1,314 μg·m−3 on the ground to 1,198 μg·m−3 at 0.2 km height. However, the difference between Wuwei and Baiyin was that within the altitude of 0.2–0.3 km, the average concentrations of PM2.5 and PM10 in Dingxi gradually increased with the increase in altitude, which increased to 253 μg·m−3 and 1,351 µg·m−3, respectively at the altitude of 0.3 km. The concentrations of PM2.5 and PM10 above 0.3 km gradually decreased again with the increase in altitude, and decreased to 71 μg·m−3 and 357 µg·m−3, respectively, at 1 km altitude, which was close to the average concentrations of PM2.5 and PM10 at 1 km altitude in Wuwei. Also, it can be seen from Figures 6A, B that although the ground particle concentration in Dingxi was lower than that in Baiyin and Wuwei, the particle concentration in the height of 0.3–0.9 km was higher than that in Baiyin and Wuwei. Figure 6C shows the variation of the value of PM2.5/PM10 during the selected period. The value of PM2.5/PM10 of Wuwei and Baiyin increased with the increase in altitude, while the value of PM2.5/PM10 of Dingxi did not change significantly with altitude, indicating that in cities near sources, low altitude was dominated by coarse particles, and the proportion of fine particles was small and increased with the increase in height. The value of PM2.5/PM10 gradually tended to be stable in the vertical direction during transmission to the downwind. On the other hand, the value of PM2.5/PM10 of Dingxi within 0.3 km was higher than that in Baiyin and Wuwei, which further proved that coarse particles were easier to settle when the dust was transported to the downwind.
By retrieving the distribution of PM2.5 and PM10 average concentrations at different heights during strong dust events, it is found that when a dust event occurred, the particle concentrations did not necessarily decrease with the increase in altitude. The ground particle concentrations in Dingxi were lower than those in Baiyin and Wuwei, but the high-altitude particle concentrations above 0.3 km were higher than those in Baiyin and Wuwei. The slow settlement of high-altitude particulate matter had a longer impact on the local ambient air quality. The average concentrations of PM2.5 and PM10 in Baiyin and Wuwei gradually decreased with the increase in altitude, indicating that the dust mainly came from the surrounding sources. The maximum average concentrations of PM2.5 and PM10 in Dingxi were located near the height of 0.3 km, indicating that high-altitude transmission was the main source. For Wuwei and Baiyin, the low altitude was dominated by coarse particles, and the proportion of fine particles was low. When the dust was transported to Dingxi, the value of PM2.5/PM10 in the vertical direction gradually tended to be stable and greater than that of Wuwei and Baiyin, which further proved that coarse particles were easier to settle during the transmission.
An in-depth understanding of the synoptic system guiding the dust event will help to improve the accuracy of dust event forecasting and effectively reduce disasters and losses caused by the dust event. In order to explore reasons for the occurrence and development of the dust event, the synoptic system that led to the dust event was deeply analyzed (Figure 7). The East Asian trough moved eastward, which became even stronger under the influence of cold air in high latitudes, resulting in the dust event.
FIGURE 7. Synoptic situation during the dust storm: (A) 500 hPa at 08:00 on 11 May; (B) surface at 08:00 on 11 May; (C) 500 hPa at 20:00 on 11 May; (D) surface at 20:00 on 11 May; (E) 500 hPa at 20:00 on 12 May; and (F) surface at 20:00 on 12 May.
The synoptic situation of 500 hPa at 08:00 on 11 May is shown in Figure 7A; the trough moved to the eastern part of northern Xinjiang, the southern branch of the trough extended to 40°N, and the wind speed near the trough reached 38 m·s−1. There was a cold center near Sajan; the cold trough slightly lagged behind the height trough, and the cold advection after the height trough was strong, indicating that the East Asian trough was still in the strengthening stage. The east of the Hexi Corridor was dominated by a weak northwest airflow; the low-altitude water vapor was very weak, and the temperature continued to rise, which provided certain thermal conditions for the front of the cold air. Led by the East Asia trough, the strong cold air on the ground moved southeast along the northwest. The strong wind behind the front caused strong dust from the east of northern Xinjiang to the west of the Hexi Corridor. Following the East Asian trough, the cold air moved eastward, and the high-pressure center had crossed the Sajan, with strong strength, and the central strength reached more than 1,035 hPa (Figure 7B). The cold front was located at the border between China and Mongolia in an east–west direction, and there was an obvious thermal low pressure in the front side of the front. Due to the development of thermal low pressure, the cold front was further strengthened, the isobars behind the front were dense, and there was a wide range of gale areas. The tail of the cold front had crossed the Tianshan Mountains and affected the eastern part of northern Xinjiang. The Hexi Corridor was under the control of thermal low pressure in the front side of the front. As the East Asian trough moved eastward, it gradually turned to the north–south direction; the cold front gradually turned to the northeast–southwest direction and entered the Hexi Corridor through the northwestern path. The strong wind behind the front caused the dust event in the Hexi Corridor from west to east.
Due to the supplement of cold air in high latitudes, the East Asian trough deepened and strengthened on 11 May, and the movement speed of the East Asian trough was relatively slow. It took 12 h until 20:00 on 11 May (Figure 7C) to move from the eastern part of northern Xinjiang to the west of the Hexi Corridor. The enhancement of convergence and ascending movement in the front of the East Asian trough promoted further enhancement of the ground thermal low pressure. Affected by the northwest gale after the cold front, the Hexi Corridor had experienced strong dust weather and was most obviously affected by dust. At the same time, it can be seen that there was a new trough generation and development in the north of Sajan, which blocked the cold air supplement of the East Asian trough. At this time, the cold center behind the trough had been significantly weakened, and the trough would enter a period of rapid movement toward the east. The development of the thermal low pressure in the front side of the front in central Inner Mongolia and Ningxia had created favorable conditions for the further enhancement of the cold front (Figure 7D), resulting in a wide range of strong wind areas in the central and western Inner Mongolia; this caused a strong dust event in the Badain Jaran Desert and Tengger Desert and further enhanced the dust in the middle and east of the Hexi corridor. Therefore, the dust became the strongest when it moved to the east of the Hexi Corridor.
It can be seen from 500 hPa at 20:00 on 12 May (Figure 7E) that the trough had moved to the eastern part of northern China, and the intensity was obviously weakened, and the ground cold air quickly moved eastward and weakened, resulting in floating dust in the middle and eastern parts of China, but the dust stayed for a long time. Since then, the cold air moved rapidly eastward following the East Asian trough. At the same time, due to the weakening of the East Asian trough and lack of subsequent supplement of cold air, the strength of the ground cold high pressure weakened rapidly during the eastward movement. The cold high-pressure center moved to the north of Shaanxi, and the center strength was only 1,020 hPa at 20:00 on 12 May (Figure 7F). Moreover, during the eastward movement of cold high pressure, in the northern section, it can follow the movement of the trough, with fast moving speed and strong intensity. However, in the south section, there is no obvious system for it to follow, leading to rapidly weakening intensity and slower movement speed. At the same time, the front end of the cold front reached the west of Shandong; therefore, the dust moved eastward to the Yangtze–Huaihe region, but the dust intensity was obviously weakened.
In order to further explore the source of the dust event, the HYSPLIT backward trajectory was used to analyze the dust transmission path at different heights of the three aerosol lidar stations. The strong dust was mainly concentrated below 1,500 m, according to the lidar detection results. Therefore, the 24-h backward trajectories of the dust transmission at three altitudes of 200 m, 500, and 1,000 m at the time of PM10 peak concentration in Wuwei, Baiyin, and Dingxi were selected.
Figure 8A shows the backward trajectories of Wuwei at 23:00 on 11 May. The source at 1,000 m in Wuwei was different from those at 500 and 200 m. At 02:00 on 11 May, the 1,000 m high-altitude dust was located in the Kumtag Desert and then gradually spread from the ground to a high altitude. The dust spread to a height of 1,000 m when it reached Wuwei, where the 1,000 m high-altitude dust in Wuwei originated. The dust of 500 and 200 m in Wuwei came from the 500–1,000 m altitude in the northwest of Inner Mongolia and gradually settled. Multiple sources were superimposed when the dust passed through the Badain Jaran Desert. Combined with the backward trajectory analysis of different heights, the dust of Wuwei mainly came from Kumtag Desert, deserts near northwest Inner Mongolia, and the Badain Jaran Desert, and the dust at high and low altitudes was affected along different paths.
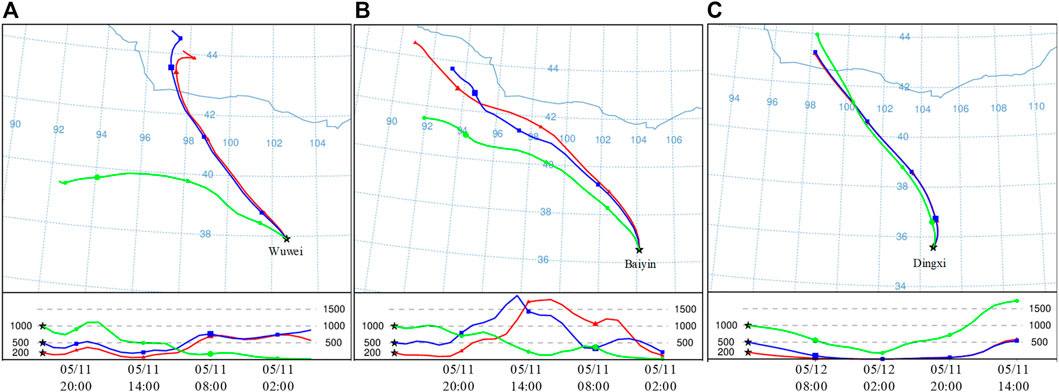
FIGURE 8. 24-h HYSPLIT backward trajectories: (A) Wuwei at 23:00 on 11 May; (B) Baiyin at 02:00 on 12 May; and (C) Dingxi at 14:00 on 12 May.
According to the HYSPLIT backward trajectory analysis of Baiyin at 02:00 on 12 May, the sources within the height of 200–1,000 m were relatively consistent (Figure 8B). The dust was located near Hami at 02:00 on 11 May and then gradually diffused from the ground to the high altitude. After 14:00, the dust at 200–500 m gradually settled to the ground through the Hexi Corridor, but the dust at 1,000 m spread to the high altitude, and the dust moved to the vicinity of the Badain Jaran Desert at 20:00. Subsequently, dust at different heights was transmitted to Baiyin along the northwest path at a relatively stable altitude.
The HYSPLIT backward trajectories of Dingxi at 14:00 on 12 May are shown in Figure 8C. The paths of the dust were very consistent, which came from the border between China and Mongolia and were transported along the northwestern path. At about 20:00 on 11 May, the dust passed through the Badain Jaran Desert and settled here. Then, the dust at the height of 1,000 m was superimposed with the dust of the Badain Jaran Desert and diffused to the high altitude. The dust at the height of 200–500 m was transported close to the ground and diffused to the high altitude when passing through the Tengger desert at 08:00 on 12 May. Combined with the backward trajectory analysis of different heights, the dust in Dingxi mainly came from the sandy land on the border of China and Mongolia, Badain Jaran Desert, and Tengger Desert. The dust in high and low altitudes came from different sources and affects Dingxi along the same path.
HYSPLIT backward trajectory analysis shows that the high- and low-altitude dust in Wuwei had different sources and paths, which was mainly from the Kumtag Desert, near northwest Inner Mongolia, and the Badain Jaran Desert. The high-altitude dust was transmitted along the northwest by the western path, and the low-altitude dust was transmitted along the northwestern path. The sources of Baiyin were relatively consistent, which came from the desert and Gobi near Hami, superimposed with the dust of the Badain Jaran Desert, and were transmitted along the northwestern path. The high- and low-altitude dust paths in Dingxi were very consistent, but the sources were slightly different. The near surface dust mainly came from the Tengger Desert, and the high-altitude dust came from the border of China and Mongolia and the Badain Jaran Desert. Combined with the detection data from lidars, the results indicate that in addition to the impact of dust intensity, different sources of dust also had an impact on the lidar results, especially on the depolarization ratio.
At present, dust monitoring is relatively simple, mainly relying on ground particle monitors and satellites. However, the ground particle monitors can only obtain the ground dust intensity, and the satellites are seriously affected by clouds. Therefore, there is a lack of monitoring in the vertical direction of dust, which cannot reflect the development and transmission characteristics of dust in three-dimensional space. In order to solve this problem and realize the qualitative to quantitative research of the aerosol lidar in dust detection, a dust event in China from 11 to 14 May 2019 was studied as a case. The study analyzed the horizontal and vertical characteristics of dust and the physical characteristics of dust particles in a comprehensive way; the synoptic system and the sources of dust and the following conclusions were obtained.
The East Asian trough moved eastward to lead the eastward diffusion and transmission of the dust event from the eastern part of northern Xinjiang and the western Hexi Corridor on 11 May, resulting in the deterioration of the ambient air quality in most cities in northern China, causing serious pollution, of which the Hexi Corridor was the most seriously affected. The PM10 hourly peak concentration of Wuwei and Baiyin was close to 3,000 μg·m−3, and the dust impact was significantly weakened on 14 May. The qualitative analysis of lidar network monitoring results combined with HYSPLIT backward trajectories show that when the dust intensities were the same in different cities, the extinction coefficients were close, but the depolarization ratios were not necessarily close. As cities close to the sources, the sources of Wuwei and Baiyin were not only high-altitude transmission but also superimposed with the dust of the surrounding deserts. As a city far away from the source, the source of Dingxi was mainly high-altitude transmission. In addition, for Wuwei and Baiyin, the proportion of coarse particles and non-spherical particles carried in dust was higher than that in Dingxi. It is preliminarily considered that the sedimentation velocity and resistance coefficient of non-spherical particles were greater than spherical particles; therefore, coarse particles and non-spherical particles were easier to settle. The fitting effect between the extinction coefficient and the PM2.5 and PM10 concentrations monitored on the ground was very good. Through the fitting, it is found that the particle concentration in Dingxi did not necessarily decrease with the increase of height during the dust period. The ground particle concentrations in Dingxi were lower than those in Baiyin and Wuwei, but the high-altitude particle concentrations above 0.3 km were higher than those in Baiyin and Wuwei.
Using the aerosol lidar network can not only reflect the development characteristics of dust in the vertical direction but can also effectively show the change characteristics of aerosol particle sizes and morphology and realize the quantitative analysis of particle concentration in three-dimensional space, which is of significant importance for informing the forecasting of the dust event.
The datasets presented in this study can be found in online repositories. The names of the repository/repositories and accession number(s) can be found below: The data of P.M. and PM10 concentration for this study can be found in the National Urban Air Quality Real-Time Release Platform of the China National Environmental Monitoring Center (http://106.37.208.233:20035/). The NCEP/NCAR reanalysis data were provided by NOAA (https://psl.noaa.gov/data/gridded/data.ncep.reanalysis.html). The lidar data in the article can be directly contacted with the first author.
SZ conceived and designed the experiments; LY analyzed the data and wrote the manuscript; YY contributed and analyzed Figure 4; LW and HT reviewed and edited the manuscript; YX and YC helped with discussion; and XL processed lidar preliminary data. All authors contributed critically to the drafts and gave final approval for publication.
This work was jointly supported by the Foundation for National Natural Science Foundation of China (No. 42075126; No. 41975019), Natural Science Foundation of Gansu Province of China (No. 21JR7RA691; No. 20JR5RA122; No. 20JR10RA444). This work was supported by Supercomputing Center of Lanzhou University.
Authors YX and XL were employed by Wuxi CAS Photonics Co., Ltd.
The remaining authors declare that the research was conducted in the absence of any commercial or financial relationships that could be construed as a potential conflict of interest.
All claims expressed in this article are solely those of the authors and do not necessarily represent those of their affiliated organizations, or those of the publisher, the editors, and the reviewers. Any product that may be evaluated in this article, or claim that may be made by its manufacturer, is not guaranteed or endorsed by the publisher.
The authors are grateful to CNEMC for providing the data on PM2.5 and PM10 concentrations and greatly appreciate NOAA for sharing the NCEP/NCAR reanalysis data. We acknowledge the reviewers and the editor for their valuable comments and suggestions.
Bai, L., Li, Y., Cen, M., and Hu, F. (2021). 3D Instance Segmentation and Object Detection Framework Based on the Fusion of Lidar Remote Sensing and Optical Image Sensing. Remote Sensing 13 (16), 3288. doi:10.3390/rs13163288
Banks, J. R., Brindley, H. E., Flamant, C., Garay, M. J., Hsu, N. C., Kalashnikova, O. V., et al. (2013). Intercomparison of Satellite Dust Retrieval Products over the West African Sahara during the Fennec Campaign in June 2011. Remote Sensing Environ. 136, 99–116. doi:10.1016/j.rse.2013.05.003
Banks, J. R., Brindley, H. E., Stenchikov, G., and Schepanski, K. (2017). Satellite Retrievals of Dust Aerosol over the Red Sea and the Persian Gulf (2005-2015). Atmos. Chem. Phys. 17, 3987–4003. doi:10.5194/acp-17-3987-2017
Bessho, K., Date, K., Hayashi, M., Ikeda, A., Imai, T., Inoue, H., et al. (2016). An Introduction to Himawari-8/9— Japan’s New-Generation Geostationary Meteorological Satellites. J. Meteorol. Soc. Jpn. 94, 151–183. doi:10.2151/jmsj.2016-00929
Chen, L., Zhu, J., Liao, H., Yang, Y., and Yue, X. (2020). Meteorological Influences on PM2.5 and O3 Trends and Associated Health burden since China's Clean Air Actions. Sci. Total Environ. 744, 140837. doi:10.1016/j.scitotenv.2020.140837
Deleva, A. D., Peshev, Z. Y., Dreischuh, T. N., and Stoyanov, D. V. (2017). “Lidar Observations of Aerosol Loadings Extended throughout the Troposphere,” in Proc. SPIE 10226, 19th International Conference and School on Quantum Electronics, 5 January 2017 (Laser Physics and Applications), 102260X. doi:10.1117/12.2264235
Draxler, R. R., and Hess, G. D. (1998). An Overview of the HYSPLIT 4 Modeling System for Trajectories, Dispersion and Deposition. Aust. Meteorol. Mag. 47 (4), 295–308.
Feng, Q., Cui, S., and Zhao, W. (2015). Effect of Particle Shape on Dust Shortwave Direct Radiative Forcing Calculations Based on Modis Observations for a Case Study. Adv. Atmos. Sci. 32 (9), 1266–1276. doi:10.1007/s00376-015-4235-3
Floutsi, A. A., Baars, H., Radenz, M., Haarig, M., Yin, Z., Seifert, P., et al. (2021). Advection of Biomass Burning Aerosols towards the Southern Hemispheric Mid-latitude Station of Punta Arenas as Observed with Multiwavelength Polarization Raman Lidar. Remote Sensing 13 (1), 138–155. doi:10.3390/rs13010138
Guo, J., Xia, F., Zhang, Y., Liu, H., Li, J., Lou, M., et al. (2017). Impact of Diurnal Variability and Meteorological Factors on the PM2.5 - AOD Relationship: Implications for PM2.5 Remote Sensing. Environ. Pollut. 221, 94–104. doi:10.1016/j.envpol.2016.11.043
Guo, P., Yu, S., Wang, L., Li, P., Li, Z., Mehmood, K., et al. (2019). High-altitude and Long-Range Transport of Aerosols Causing Regional Severe Haze during Extreme Dust Storms Explains Why Afforestation Does Not Prevent Storms. Environ. Chem. Lett. 17, 1333–1340. doi:10.1007/s10311-019-00858-0
Hu, Z., Jin, Q., Ma, Y., Pu, B., Ji, Z., Wang, Y., et al. (2021). Temporal Evolution of Aerosols and Their Extreme Events in Polluted Asian Regions during Terra's 20-year Observations. Remote Sensing Environ. 263, 112541. doi:10.1016/j.rse.2021.112541
Hu, Z., Zhao, C., Huang, J., Leung, L. R., Qian, Y., Yu, H., et al. (2016). Trans-Pacific Transport and Evolution of Aerosols: Evaluation of Quasi-Global WRF-Chem Simulation with Multiple Observations. Geosci. Model. Dev. 9, 1725–1746. doi:10.5194/gmd-9-1725-2016
Janicka, L., Stachlewska, I. S., Veselovskii, I., and Baars, H. (2017). Temporal Variations in Optical and Microphysical Properties of mineral Dust and Biomass Burning Aerosol Derived from Daytime Raman Lidar Observations over warsaw, poland. Atmos. Environment 169, 162–174. doi:10.1016/j.atmosenv.2017.09.022
Jiang, B., and Xia, D. (2021). Ammonia Control Represents the Key for PM2.5 Elimination: Insights for Global Air Pollution Control Interconnected from PM2.5 Events in China. Clean. Techn. Environ. Pol. 23 (1), 829–841. doi:10.1007/s10098-020-01923-x
Lagrosas, N., Ong, P. M. B., Shiina, T., and Kuze, H. (2017). Diurnal Behavior of Aerosol Extinction Coefficient Based on Lidar and Ground Sampling Instruments, 35th Japanese Laser Sensing Symposium. At: National Institute of Information and Communications Technology (NICT) 4-2-1, Nukui-Kitamachi, Koganei, Tokyo 184–8795. Japan.
Lee, K.-H., and Noh, Y. M. (2015). Multi-wavelength Raman LIDAR for Use in Determining the Microphysical, Optical, and Radiative Properties of Mixed Aerosols. ajae 9, 91–99. doi:10.5572/ajae.2015.9.1.091
Li, J., Carlson, B. E., and Lacis, A. A. (2014a). Application of Spectral Analysis Techniques in the Intercomparison of Aerosol Data: Part III. Using Combined PCA to Compare Spatiotemporal Variability of MODIS, MISR, and OMI Aerosol Optical Depth. J. Geophys. Res. Atmos. 119 (7), 4017–4042. doi:10.1002/2013JD020538
Li, J., Carlson, B. E., and Lacis, A. A. (2014b). Application of Spectral Analysis Techniques in the Intercomparison of Aerosol Data. Part II: Using Maximum Covariance Analysis to Effectively Compare Spatiotemporal Variability of Satellite and AERONET Measured Aerosol Optical Depth. J. Geophys. Res. Atmos. 119 (1), 153–166. doi:10.1002/2013JD020537
Li, J., Carlson, B. E., and Lacis, A. A. (2015). How Well Do Satellite AOD Observations Represent the Spatial and Temporal Variability of PM 2.5 Concentration for the United States? Atmos. Environ. 102, 260–273. doi:10.1016/j.atmosenv.2014.12.010
Long, X., Li, N., Tie, X., Cao, J., Zhao, S., Huang, R., et al. (2016). Urban Dust in the Guanzhong basin of china, Part I: a Regional Distribution of Dust Sources Retrieved Using Satellite Data. Sci. Total Environ. 541, 1603–1613. doi:10.1016/j.scitotenv.2015.10.063
Lou, C.-R., Liu, H.-Y., Li, Y.-F., and Li, Y.-L. (2016). Socioeconomic Drivers of PM2.5 in the Accumulation Phase of Air Pollution Episodes in the Yangtze River Delta of China. Ijerph 13 (10), 928–947. doi:10.3390/ijerph13100928
Lv, L., Liu, W., Zhang, T., Chen, Z., Dong, Y., Fan, G., et al. (2017). Observations of Particle Extinction, PM2.5 Mass Concentration Profile and Flux in north China Based on mobile Lidar Technique. Atmos. Environ. 164, 360–369. doi:10.1016/j.atmosenv.2017.06.022
Ma, X. Y., Wang, J. Y., Yu, F. Q., Jia, H. L., and Hu, Y. N. (2016). Can MODIS AOD Be Employed to Derive PM2.5 in Beijing-Tianjin-Hebei over China? Atmos. Res. 181, 250–256. doi:10.1016/j.atmosres.2016.06.018
Maji, K. J., Dikshit, A. K., Arora, M., and Deshpande, A. (2017). Estimating Premature Mortality Attributable to PM2.5 Exposure and Benefit of Air Pollution Control Policies in China for 2020. Sci. Total Environ. 612, 683–693. doi:10.1016/j.scitotenv.2017.08.254
Maji, K. J., Li, V., and Lam, J. C. K. (2020). Effects of China's Current Air Pollution Prevention and Control Action Plan on Air Pollution Patterns, Health Risks and Mortalities in Beijing 2014-2018. Chemosphere 260. doi:10.1016/j.chemosphere.2020.127572
Nishizawa, T., Sugimoto, N., Matsui, I., Shimizu, A., Hara, Y., Itsushi, U., et al. (2017). Ground-based Network Observation Using Mie-Raman Lidars and Multi-Wavelength Raman Lidars and Algorithm to Retrieve Distributions of Aerosol Components. J. Quant. Spectrosc. Ra 188, 79–93. doi:10.1016/j.jqsrt.2016.06.031
Niu, H. W., Kang, S. C., Gao, W. N., Wang, Y. H., and Paudyal, R. (2019). Vertical Distribution of the Asian Tropopause Aerosols Detected by CALIPSO. Environ. Pollut. 253, 207–220. doi:10.1016/j.envpol.2019.06.111
Panahifar, H., Moradhaseli, R., and Khalesifard, H. R. (2020). Monitoring Atmospheric Particulate Matters Using Vertically Resolved Measurements of a Polarization Lidar, In-Situ Recordings and Satellite Data over Tehran, Iran. Sci. Rep. 10, 20052. doi:10.1038/s41598-020-76947-w
Reiji, K. (2018). Satellite-based Mapping of Dust Erodibility in Northeast Asia. Nat. Hazards 92, 19–25. doi:10.1007/s11069-016-2393-y
Rupakheti, D., Yin, X. F., Rupakheti, M., Zhang, Q. G., Li, P., Rai, M., et al. (2021). Spatio-temporal Characteristics of Air Pollutants over Xinjiang, Northwestern China. Environ. Pollut. 268, 115907. doi:10.1016/j.envpol.2020.115907
Salgueiro, V., Costa, M. J., Guerrero-Rascado, J. L., Couto, F. T., and Bortoli, D. (2021). Characterization of forest Fire and Saharan Desert Dust Aerosols over South-Western Europe Using a Multi-Wavelength Raman Lidar and Sun-Photometer. Atmos. Environ. 252, 118346. doi:10.1016/j.atmosenv.2021.118346
Schafer, K., Harbusch, A., Emeis, S., Koepke, P., and Wiegner, M. (2008). Correlation of Aerosol Mass Near the Ground with Aerosol Optical Depth during Two Seasons in Munich. Atmos. Environ. 42, 4036–4046. doi:10.1016/j.atmosenv.2008.01.060
She, L., Xue, Y., Yang, X. H., Guang, J., Li, Y., Che, Y. H., et al. (2018). Dust Detection and Intensity Estimation Using Himawari-8/AHI Observation. Remote Sens. 10, 490. doi:10.3390/rs10040490
Taubert, F., Fischer, R., Knapp, N., and Huth, A. (2021). Deriving Tree Size Distributions of Tropical Forests from Lidar. Remote Sens. 13 (1), 131–154. doi:10.3390/rs13010131
Wang, Y. S., Gong, Z. Y., Liu, Z. R., Tang, G. G., Cheng, L. J., Che, F., et al. (2019). Construction and Application of Comprehensive Observation Network for Air Pollution in Beijing-Tianjin-Hebei and its Surrounding Areas. Res. Environ. Sci. 32 (10), 1651–1663. (In Chinese). doi:10.13198/j.issn.1001-6929.2019.09.12
Wu, J., and Kai, K. (2016). Characteristics of Dust Outbreaks and Their Relation to Strong Wind and Land Surface Conditions in the Gobi Desert and Northern China, 1999-2013. J. Arid Land. 26, 51–57. doi:10.14976/jals.26.2_51
Xia, X. L., Min, J. Z., Wang, Y. B., Shen, F. F., Yang, C., and Sun, Z. D. (2019). Assimilating Himawari-8 AHI Aerosol Observations with a Rapid-Update Data Assimilation System. Atmos. Environ. 215, 116866. doi:10.1016/j.atmosenv.2019.116866
Xiang, Y., Zhang, T. S., Zhao, X. S., Liu, J. G., Dong, Y. S., Fan, G. Q., et al. (2015). “Retrieval of PM2.5 Concentration from Lidar Data,” in Light, Energy and the Environment, OSA Technical Digest (Online), Paper EM3A.6 (Washington, DC, USA: Optical Society of America). doi:10.1364/ee.2015.em3a.6
Xu, Y. L., Huang, Y., and Guo, Z. Y. (2021). Influence of AOD Remotely Sensed Products, Meteorological Parameters, and AOD-PM2.5 Models on the PM2.5 Estimation. Stoch. Env. Res. Risk A. 35 (3), 1–16. doi:10.1007/s00477-020-01941-7
Yang, L. L., Hu, Z. Y., Huang, Z. W., Wang, L. N., Han, W. Y., Yang, Y. P., et al. (2021a). Detection of a Dust Storm in 2020 by a Multi-Observation Platform over the Northwest China. Remote Sens. 13 (6), 1056–1074. doi:10.3390/rs13061056
Yang, L. L., Zhang, S. W., Huang, Z. W., Yang, Y. P., Wang, L. N., Han, W. Y., et al. (2021b). Characteristics of Dust Weather in China from 2015 to 2020. Atmos. 12 (8), 952–964. doi:10.3390/atmos12080952
Zeng, Y. Y., Cao, Y. F., Qiao, X., Seyler, B. C., and Tang, Y. (2019). Air Pollution Reduction in China: Recent success but Great challenge for the Future. Sci. Total Environ. 663, 329–337. doi:10.1016/j.scitotenv.2019.01.262
Zhang, J., Zhou, C. H., Gui, H. L., and Zhang, X. Y. (2021). Biological Crust in Sand and Dust Storm Source Areas of Asia and its Impact on Dust Emission. Adv. Clim. Change Res. 12 (3), 395–408. doi:10.1016/j.accre.2021.05.007
Zhang, Z. Y., Wu, W. L., Fan, M., Tao, M. H., Wei, J., Jin, J., et al. (2019). Validation of Himawari-8 Aerosol Optical Depth Retrievals over China. Atmos. Environ. 199, 32–44. doi:10.1016/j.atmosenv.2018.11.024
Keywords: dust, lidar network, particle concentration, synoptic situation, HYSPLIT backward trajectory, extinction coefficient
Citation: Yang L, Zhang S, Tao H, Yang Y, Wang L, Cui Y, Xu Y and Li X (2022) Comprehensive Analysis of a Dust Storm by a Lidar Network Combined With Multiple Data. Front. Environ. Sci. 10:832710. doi: 10.3389/fenvs.2022.832710
Received: 10 December 2021; Accepted: 28 February 2022;
Published: 26 April 2022.
Edited by:
Longlei Li, Cornell University, United StatesReviewed by:
Eduardo Landulfo, Instituto de Pesquisas Energéticas e Nucleares (IPEN), BrazilCopyright © 2022 Yang, Zhang, Tao, Yang, Wang, Cui, Xu and Li. This is an open-access article distributed under the terms of the Creative Commons Attribution License (CC BY). The use, distribution or reproduction in other forums is permitted, provided the original author(s) and the copyright owner(s) are credited and that the original publication in this journal is cited, in accordance with accepted academic practice. No use, distribution or reproduction is permitted which does not comply with these terms.
*Correspondence: Shuwen Zhang, zhangsw@lzu.edu.cn
Disclaimer: All claims expressed in this article are solely those of the authors and do not necessarily represent those of their affiliated organizations, or those of the publisher, the editors and the reviewers. Any product that may be evaluated in this article or claim that may be made by its manufacturer is not guaranteed or endorsed by the publisher.
Research integrity at Frontiers
Learn more about the work of our research integrity team to safeguard the quality of each article we publish.