 Haixia Duan
 Wei Hou2*
94% of researchers rate our articles as excellent or good
Learn more about the work of our research integrity team to safeguard the quality of each article we publish.
Find out more
ORIGINAL RESEARCH article
Front. Environ. Sci., 13 May 2022
Sec. Atmosphere and Climate
Volume 10 - 2022 | https://doi.org/10.3389/fenvs.2022.820452
This article is part of the Research TopicDust and Polluted Aerosols: Sources, Transport and Radiative EffectsView all 13 articles
The spring sand-dust weather can be disastrous in China. It seriously endangers agricultural production, transportation, air quality, people’s lives and property, and is a subject of sustained and extensive concern. Currently, few studies have been conducted to analyze sand-dust events in North China from the perspective of sand-dust processes. Although there are a few studies on the spatio-temporal variation characteristics of sand-dust processes, they are mainly based on outdated data or case studies of major sand-dust events. In this study, the evolution characteristics of sand-dust processes in China over the last 60 years are studied based on the identification method and several characteristic quantities (including duration and impact range) of sand-dust weather processes defined in the Operational Regulations of Monitoring and Evaluation for Regional Weather and Climate Processes newly issued by the China Meteorological Administration in 2019. First, through statistics, we obtain the annual occurrence frequency, annual days, and the annual number of affected stations of sand-dust processes (including sand-dust storms, blowing sand, and suspended dust) from January 1961 to May 2021. Based on the Mann–Kendall test (MK) and Ensemble Empirical Mode Decomposition (EEMD), we analyzed evolution trends and probability distribution characteristics of annual occurrence frequency, annual days, and the annual number of affected stations of sand-dust processes. In addition, we investigate the start time of the first and the last dust processes in each of the past 60 years, as well as the seasonal distribution characteristics of sand-dust processes. The results show that under the background of global warming, the sand-dust weather in China tends to decrease significantly. Specifically, the annual occurrence frequency and annual days showed an upward trend before the 1980s and a significant downward trend after that, as well as the significant turnarounds in the annual number of dust processes that occurred in the 1990s and around 2010. Moreover, the sand-dust processes tend to start later and end earlier. The sand-dust processes are mainly concentrated between March and May, with the highest occurrence probability in April.
Sand-dust weather can be disastrous and seriously damage the ecological environment (Sun et al., 2001), causing excessive loss of soil and nutrients in source areas and aggravating land desertification (Chandler et al., 2004; Kielgaard et al., 2004; Zobeck and Pelt, 2006). In addition, it can bring serious environmental pollution (Giannadaki et al., 2013; Knippertz and Stuut, 2014; Pu et al., 2015; Guo et al., 2018; Tian et al., 2019) to downstream areas, seriously endangering human health (Mott et al., 2005; Goudie, 2014; Tong et al., 2017). Sand-dust weather can also lead to mesoscale to large-scale climate adjustment (Idso and Brazel, 1977; Littmann, 1991). Specifically, dust aerosols contribute large amounts of fine particles (Bishop et al., 2002; Evan et al., 2009; Hsu et al., 2009; Mahowald, 2011; Prospero et al., 2012) to marine and terrestrial ecosystems, thus affecting regional and global climate change (Huang et al., 2014), including changes in the hydrological cycle (Goudie, 2009; Huang et al., 2010a), marine primary productivity (Mahowald et al., 2005; Han et al., 2008), radiation balance, cloud formation (Huang et al., 2014; Li et al., 2016), glacier formation and melting (Calov et al., 2005; Krinner et al., 2006; Bar–Or et al., 2008), and global carbon and energy cycles (Mahowald et al., 2005; Jickells et al., 2006; Ling et al., 2014). Dust aerosols can also affect precipitation through aerosol-cloud-precipitation interactions (Huang et al., 2010b; Carslaw et al., 2013; Jin et al., 2016; Jin and Wang, 2018).
Arid and semi-arid areas are prone to sand-dust weather. These areas include the North American Great Plains, North Africa, the Middle East, the Mongolian Gobi Desert, and Central Asia (Ahmed et al., 1987; Chen et al., 1995; Alpert and Ganor, 2001; Natsagdorj et al., 2003; Worster, 2004; Alizadeh–Choobari et al., 2016; Beyranvand et al., 2019). As a part of the sand-dust storm area in Central Asia, northern China is one of the few areas in the world where sand-dust weather occurs frequently. Asia is the second-largest source of dust in the world due to the large deserts in the Middle East, Central Asia, and East Asia (Jin et al., 2021), and approximately 40% of the dust aerosols in the world come from Asia (Zhang et al., 2003a; Tanaka and Chiba, 2006). The sand-dust weather in northern China is mainly distributed in the Northwest and North of the country. However, the impact of sand-dust weather is not limited to these regions. Eastern China (Zhang et al., 2013; Wang and Chen, 2016; Yang et al., 2017), East Asia (Chung et al., 2005; Huang et al., 2014; Lee et al., 2014; Yumimoto and Takemura, 2015; Kashima et al., 2016), North America and Europe (Husar et al., 2001; Tratt et al., 2001; Uno et al., 2001; Bishop et al., 2002; Chun et al., 2002; Grousset et al., 2003; Grousset et al., 2003; Zhang et al., 2003b; Mukai et al., 2004; Chung et al., 2005; Yuan and Zhang, 2006; Stith et al., 2009; Creamean et al., 2013; Liu et al., 2013), and even the Arctic (Stone et al., 2005) are affected by dust from North China.
Sand-dust weather endangers the human living environment and socio-economy (Chen et al., 2004; Liu et al., 2006; Meng and Lu, 2007; Goudie, 2009; Tam et al., 2012). Dust aerosols have a significant impact on the atmospheric system, air pollution, marine and terrestrial ecosystems, and regional and global climate change (Bryant, 2013; Wang et al., 2015; Mao et al., 2019; Jin et al., 2021). Therefore, human beings increasingly recognize that sand-dust weather is not just a severe meteorological disaster, but also a considerable global ecological and environmental problem (Shao and Dong, 2006; Jin et al., 2017). Currently, numerous studies have been conducted on the spatio-temporal variations of sand-duct events in northern China, which are of great significance to improving understanding of sand-dust storms and effectively controlling their occurrence. However, most of these studies examine the statistical characteristics of sand-dust weather based on a single station (Quan et al., 2001; Kurosaki et al., 2011; Shao et al., 2013; Shao et al., 2013; Kim and Choi, 2015; Kang et al., 2016; Yong et al., 2021), and they rarely analyze sand-duct events in northern China from the perspective of sand-dust processes or focus on the local characteristics of sand-dust weather (Natsagdorj et al., 2003; Liu et al., 2004; Zhang et al., 2005; Wang et al., 2006; Tang et al., 2013; Zhao et al., 2013; Guan et al., 2014; Liu et al., 2014). Moreover, although there are a few previous studies on the spatio-temporal variations of sand-dust processes, they are mainly based on outdated data from the “China Severe Sand-Dust Storm Series and Its Supporting Dataset (1960–2007)” (Sun et al., 2001; Zhou and Wang, 2002; Guan et al., 2017; Wang et al., 2020) or case studies of major sand-dust events (Husar et al., 2001; Chung et al., 2003; Zhang et al., 2005; Shao and Mao, 2016).
To improve the monitoring and forecasting of significant regional weather and climate processes in China and establish a relatively unified index system at national and regional levels, the China Meteorological Administration issued the Regulations of Monitoring and Evaluation for Regional Weather and Climate Processes in 2019. Combined with the spatial distribution characteristics of the current ground-based meteorological observation network in China, this file specifies the identification methods of four important regional weather and climate processes (rainstorm, high temperature, drought, and sand-dust), as well as the calculation methods of characteristic quantities such as duration and impact range. In this study, to better understand and analyze the evolution characteristics of sand-dust processes in China in the last 60 years, we first statistically obtained sand-dust processes in China from January 1961 to May 2021 by using the regional sand-dust process identification method. We then analyzed the interdecadal, interannual, and seasonal variation characteristics of regional sand-dust processes from the perspectives of occurrence frequency, duration, and the influence range of sand-dust processes at different levels, to provide a theoretical basis for improving understanding of regional sand-dust processes in China, which can finally improve the sand-dust forecast and disaster prevention.
In this study, sand-dust weather is divided into three levels, i.e., sand-dust storm, blowing sand, and suspended dust. According to the Operational Regulations of Monitoring and Evaluation for Regional Weather and Climate Processes, we obtained the occurrence frequency, total duration, and the number of affected stations of sand-dust processes each year from January 1961 to May 2021, based on the Mann-Kendall test and the ensemble empirical mode decomposition (EEMD) method. The present study then analyzes the evolution trends and probability distribution characteristics of the above three statistical indicators. Meanwhile, the start time of the first and last sand-dust weather processes for each year are investigated, and the seasonal distribution characteristics of sand-dust processes are analyzed.
According to the meteorological observation standard issued by the China Meteorological Administration in 1979 (Central Meteorological Bureau, 1979), sand-dust storms, blowing sand, and suspended dust are all classified as sand-dust events. Among them, sand-dust storms are the most disastrous. They are generally defined as a storm carrying a large amount of sand and dust, which makes the air severely turbid and reduces the horizontal visibility to below 1,000 m. Note that the severe sand-dust storm with the greatest destructive power can reduce the horizontal surface visibility to below 50 m or even 0 m. Blowing sand is usually defined as a weather phenomenon with horizontal visibility of 10,000–1,000 m, which is caused by strong wind carrying a large amount of sand and dust. Suspended dust is the weakest of the three sand-dust categories. It is usually caused by airflows in the mid-upper troposphere transporting dust from the windward direction, or by some fine dust suspended in the lower troposphere (horizontal visibility below 10,000 m) after a sand-dust storm. 20:00 LST (Local Standard Time; the same below) was selected as the recording mode. If there were two or more sand-dust records before 20:00 LST in 1 day, it was considered a sand-dust day. If the sand-dust event lasts after 20:00 LST, it was considered two sand-dust days (Central Meteorological Bureau, 1979).
Through remote sensing and field observation, it has been determined that the main sand-dust source areas in China include the Tarim Basin (Taklamakan Desert), the Alxa Gobi (Badain Jaran Desert, Tengger Desert, Ulan Buh Desert and Hexi Corridor), the Junggar Basin (Gurbantunggut Desert), the Ordos Plateau and the southeastern Inner Mongolia Plateau (Duce et al., 1980; Iwasaka et al., 1983; Dong et al., 2000; Qiu et al., 2001; Sun et al., 2001; Prospero et al., 2002; Qian et al., 2004). The Tarim Basin and the Junggar Basin are both located in Xinjiang. Due to large deserts in the basins, the sand-dust weather in these two regions is quite frequent, especially in the Tarim Basin where the average annual sand-dust weather is more than 100 days, with individual areas exceeding 200 days (Qian et al., 2002; Wang et al., 2005; Wan et al., 2013). However, due to the closed terrain of these basins and the prevailing easterly wind at the opening of the eastern edge of the basin, small-scale sand-dust events often stay in basins and have little impact on the downstream areas. Thus, the sand-dust processes are often studied separately in these two areas (Goudie, 1983, 2009; Washington et al., 2003; Wang et al., 2005; Qian et al., 2007; Ganor et al., 2010; Xu et al., 2016; Yang et al., 2016; Li et al., 2018). Because the focus of this study is to reveal the evolution characteristics of regional sand-dust processes in China, the small-scale sand-dust processes in these two basins are not considered due to their limited impact. Therefore, the study area in this research does not include Xinjiang. However, the sand-dust processes originating in Xinjiang that extend and have an influence on downstream areas are still considered.
The data of this study comes from the “dust (storm) data set (v1. 0)” established by the meteorological information center of the China Meteorological Administration in 2013, this data set contains the daily observations of dust weather phenomena (including sand-dust storms, blowing sand, and suspended dust) from more than 2,400 national surface meteorological stations in 31 provinces (cities and autonomous regions) in China since January 1954. The missing rate of daily observations of weather phenomena in the data set is less than 1%, the accuracy of element data is close to 100%, and it is automatically updated and extended every day. The observation of sand-dust storms blowing sand and suspended dust in the data set conform to the requirements of the criterion of surface meteorological observation, and the process of data quality control includes basic parameter check, data missing inspection, climatological limit value check, variation range inspection, internal consistency inspection, time consistency inspection, comprehensive analysis of quality control code, spatial consistency inspection and marking of quality control code.
The data used in this study range from 1 January 1961, to 31 May 2021, including the daily observations of the sand-dust storm, blowing sand, and suspended dust derived from 1945 ground-based meteorological stations in China, except for Xinjiang (Figure 1). These data are provided by the National Meteorological Information Center of the China Meteorological Administration. To ensure the integrity and reliability of the data, the selected stations have data records dating from least 1 January 1961. The data missing rate of all stations is less than 1%. All data can be downloaded from the China Meteorological Data Service Center (http://data. cma. cn).
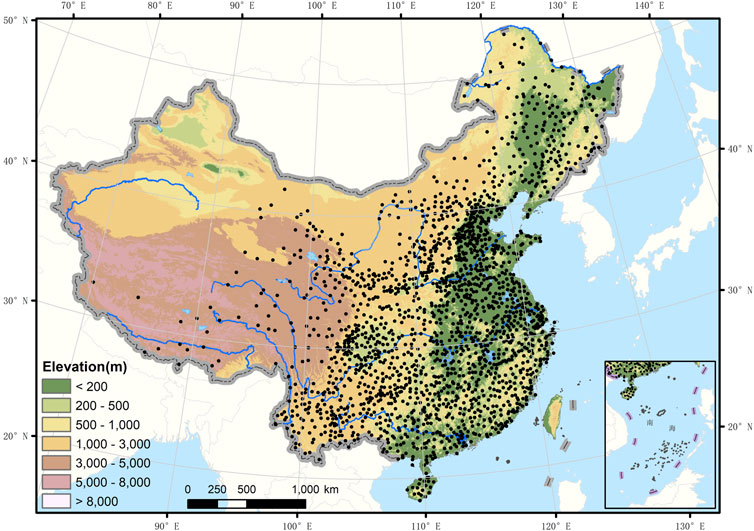
FIGURE 1. Study area and station distribution.
According to the national standard of Classification of sand-dust weather (GB/T20480-2017, Niu et al., 2017), a sand-dust process is defined as a weather process that lasts for at least 1 day. For a sand-dust process at a single station, if a station monitors continuous sand-dust weather, it is determined that there is a sand-dust process at that station. Note that the shortest duration of a sand-dust process at a single station is 1 day. In terms of regional sand-dust weather, if there are not less than 3% of adjacent stations (adjacent distance ≤200 km) with suspended dust or severer sand-dust weather on a certain day, that day should be regarded as a regional sand-dust weather day. The distance (D) between adjacent station A and station B is calculated by the following equation Eq. 1.
where
The Mann-Kendall test is a rank-based nonparametric test, which has the advantage of being able to test for linear or nonlinear trends, it is a classical technique for climate diagnosis and prediction (Mann, 1945; Kendall, 1975). The MK method can be used to determine the presence or absence of abrupt climate changes in a climate series and, when present, it can be used to determine the timing of the abrupt changes. The MK method is also often used to detect trends in the frequency of precipitation and drought under the influence of climate change. This study was used to analyze time series data for trends in dust and sand processes. The MK was used because it is distribution-free, robust to outliers, and has a high capacity for non-normally distributed data (Yue et al., 2002; Onoz and Bayazit, 2003). Our analysis shows that the annual time series of annual total frequency and total days of sand-dust processes are not significantly autocorrelated at the 90% confidence level. Therefore, the effect of autocorrelation on trend estimation can be ignored (Hu et al., 2021).
Huang et al. (1998) proposed the Empirical Mode Decomposition (EMD) method and successfully developed the Hilbert-Huang transform by combining the EMD method with the Hilbert spectrum analysis. According to the EMD method, a series of data sequences with different characteristic scales are formed by repeatedly screening and decomposing the signal into a series of fluctuations and a trend term. Each sequence is called an Intrinsic Mode Function (IMF) component, and the IMF component with the lowest frequency represents the time series of the general trend or mean value of the original signal (Huang and Wu, 2008; Wu et al., 2011). Due to the adaptability of the EMD method in signal analysis, the EMD method has been widely used in various fields. However, the signal sometimes has the phenomenon of mode mixing in the application process, which affects the analysis effect of the EMD method. To solve this problem, Wu and Huang (2009) proposed the EEMD method, in which the uncorrelated Gaussian white noise can be artificially added to the original signal to eliminate the phenomenon of mode mixing. Currently, the EEMD method has been frequently used to detect the scale variation characteristics (Guo et al., 2016; Lin et al., 2016; Sankaran, 2017; Deng and Fu, 2019; Li and Yue, 2020) and to predict the trends of climate element series (Liang and Ding, 2012; Diodato and Bellocchi, 2014; Zhang and Yan, 2014; Qi et al., 2017; Bi et al., 2018).
As shown in Figure 2A, the annual total number and duration of sand-dust processes in China exhibit a general trend of first increasing and then decreasing from 1961 to 2020. Specifically, the annual total number of sand-dust processes gradually increased from 1961 to 1979, peaked in 1979, and then decreased rapidly until the 21st century. For the annual total days of sand-dust processes, it increased from 1961 to 1965 and reached its peak in 1965, then gradually increasing after a decrease in 1966, with two sub-peaks in 1972 and 1976. After 1976, the annual total days rapidly decreased, with a valley value of 6 days in 1997. There was a short active period of sand-dust weather between 1998 and 2002, and the annual frequency and total days of sand-dust processes increased. After 2002, they both decreased again. Compared with 1961–1999, the annual average frequency and total days of sand-dust processes in 2000–2020 decreased by 71.4 and 78%, respectively.
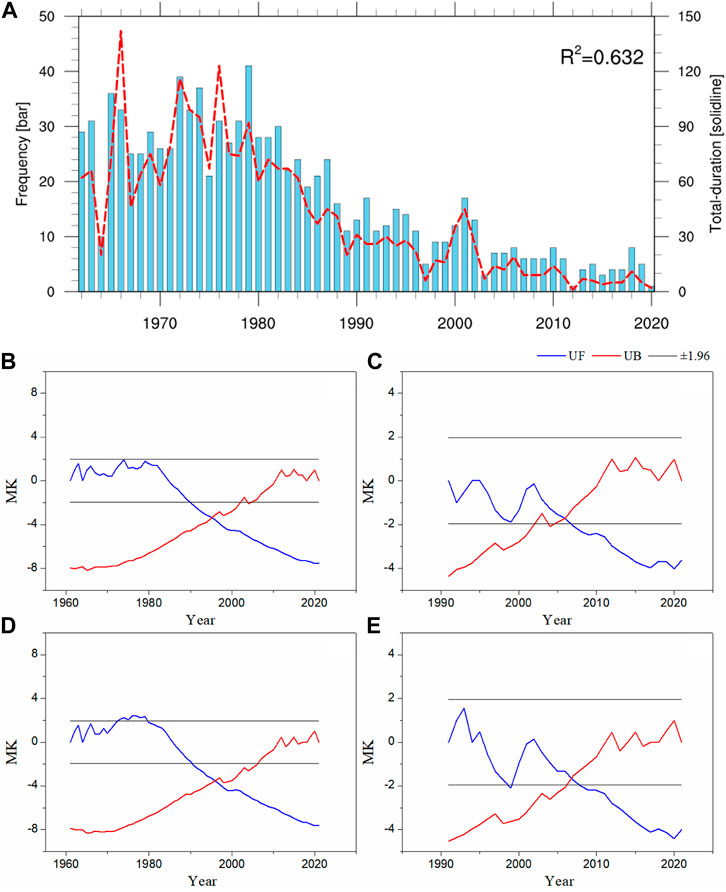
FIGURE 2. (A) Annual total frequency (blue histogram) and total days (red solid line; unit: day) of sand-dust processes. Test results of (B,C) annual total frequency and (D,E) annual total days of sand-dust processes during 1961–2020 by the MK. The blue line represents UF in the MK method, the red line represents UB, and the black line is ±1.96 (0.05 significance). (B) and (D) are the detection of the 1961–2020 sequence, and (C) and (E) are the detection of the 1991–2020 sequence.
According to the MK results, Figures 2B,D are for the detection of the sequence from 1961 to 2020. The annual frequency and annual sand-dust days showed an increasing trend before the 1990s, followed by a decreasing trend, and the decreasing trend was even greater. The change trends of annual frequency and total days of sand-dust processes significantly turned around in the 1990s and around 2006. In the late 1990s, the annual frequency and the annual number of dust days dropped significantly, indicating a sudden change. Further testing of the sequence from 1991 to 2020 (Figures 2C,E) indicated that the UF values of the annual total frequency and annual total days of sand-dust processes were basically below 0 after the 1990s, indicating that the overall trend was decreasing after the 1990s. The intersection of UF and UB in the confidence interval around 2006, that is, there was an obvious mutation in 2006. That is to say, the annual total frequency and annual total days were significantly reduced after the mutation. Therefore, China’s sand dust underwent significant mutations in the late 1990s and around 2006. The annual average frequency of sand-dust processes was 27 in the period 1961–1989, 10 between 1990 and 2010, and 4 between 2011 and 2020. For annual sand-dust days, the value was 69 before 1990, 20 in 1990–2010, and 5 in 2011–2020.
It is worth noting that although the data for 2021 ends in May, the frequency of sand-dust processes and total days increased sharply in 2021, reaching the maximum since 2003. The frequency and total days of sand-dust processes in 2021 were 10 and 19, respectively.
From 1961 to 2020, the annual longest duration of sand-dust processes in China increased first and then decreased (Figure 3A). Specifically, it tended to increase before 1973 and decrease after 1973. In addition, the annual longest duration of sand-dust processes fluctuated greatly during 1961–1973, with low values in 1964, 1967, and 1970, and high values in 1963, 1966, and 1969, reaching the peak in 1969 (18 days) and sub-peak in 1973 (16 days). After 1973, the annual longest duration of sand-dust processes began to decrease gradually. In the early 1980s (1981–1986), the duration of sand-dust processes was relatively long, but it was relatively short in the 1990s. The year 2000 is a high-value year of the longest duration (11 days), and subsequently, the longest duration of sand-dust processes decreased rapidly until 2020.
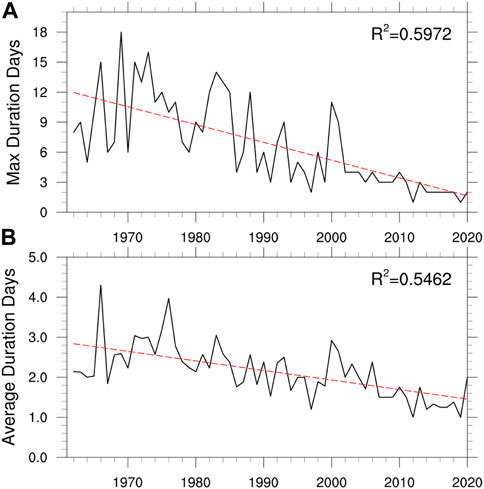
FIGURE 3. Time evolution of (A) annual longest duration and (B) annual average duration of sand-dust processes from 1961 to 2020. The red dotted line denotes the linear trend.
The evolution of the average duration of sand-dust processes is slightly different from that of the longest duration (Figure 4B), showing an overall increasing-decreasing-increasing evolution trend. Specifically, the average duration of sand-dust processes trended to increase before the 1970s, decrease from the 1970s to 1990s, increase slightly in the early 2000s, decrease in the late 2000s, and increase in 2020. Among them, the average duration of sand-dust processes was the maximum (4.3 days) in 1966, followed by 1976 (3.97 days) and 2000 (2.92 days), and the least (1 day) in 2012 and 2019. From January to May 2021, the average duration of sand-dust processes was 2 days, and the longest duration was 4 days.
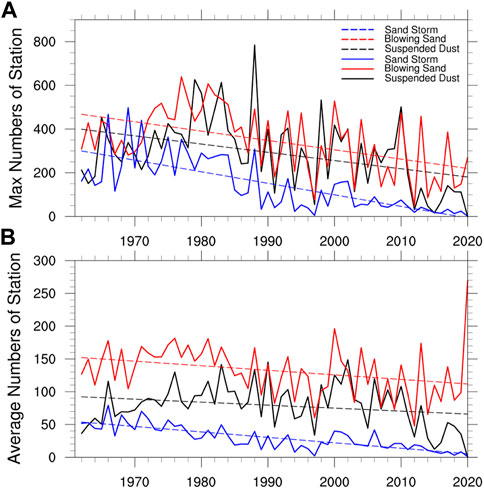
FIGURE 4. The annual (A) maximum and (B) average number of stations (solid line) for different categories of sand-dust processes, and their linear trends (dotted line).
In this paper, the “maximum number of stations” refers to the maximum number of stations affected by each sand-dust process in a year. The “average number of stations” refers to the average number of stations affected by each sand-dust process in a year. From trends of the maximum station number for suspended dust, blowing sand and sand-dust storms (Figure 4A). The annual maximum number of stations with different categories of sand-dust processes shows a decreasing-increasing-decreasing-increasing trend from 1961 to 2020. Specifically, the number of sand-dust stations for different grades of sand-dust processes decreased in the early 1960s, the maximum numbers of suspended dust and blowing-sand processes increased to the peak in the late 1970s. The maximum number of sand-dust storm stations was slightly different from suspended dust and blowing sand, it increased to its peak in the mid-1970s. After that, the maximum number of stations for the three sand-dust categories gradually decreased. It reached the valley in the late 2010s. Subsequently, it increased again in the 2020s. From January to May 2021, the maximum number of stations for suspended dust, blowing sand, and sand-dust storm processes were 339, 394, and 103, respectively. Among them, the maximum numbers of suspended dust and blowing sand in 2021 were significantly more than the multi-year average values from 1961 to 2020 (288 and 345 stations, respectively), while the maximum number of sand-dust storm stations was less than the multi-year average (150 stations).
The maximum number of stations for suspended dust and blowing sand were significantly more than that of sand-dust storms during 1961–2020, except for the late 1960s to the early 1970s. In the past 60 years, the average number of maximum blowing sand stations (329 stations) was more than that of suspended dust and sand-dust storm stations.
From the average number of stations for different sand-dust processes (Figure 4B), it can be found that the average number of blowing sand stations is the largest, followed by suspended dust and sand-dust storms. The average number of stations for suspended dust and blowing sand show a decreasing-increasing-decreasing-increasing trend, and they both peaked in the 1970s, with two valley values in the early 1960s and the end of the 2020s. The average number of blowing sand stations in 2020 was 269, followed by 196 in 2001. Since 1961, the average number of sand-dust storm stations has shown a decreasing-increasing-decreasing-increasing trend. Specifically, the average number of sand-dust storm stations was largest in the 1960s, reaching a minimum in the early 1990s, before increasing again in the early 2000s, and then continuing to decrease until early 2020, when it increased again.
Figure 5 shows the start time of the first and last sand-dust processes each year. The first sand-dust process in China mainly occurred in early January before the 1990s. After that, the start time of the first sand-dust process was gradually delayed and postponed to March after the 2000s. The start time in 2021 was January 13. The last sand-dust process in each year tends to start earlier. Specifically, the start time was basically in December before the 1990s. After that, it gradually advanced to mid-late May after the 2000s. In other words, over the past 60 years, the start time of sand-dust processes was delayed and the end time advanced.
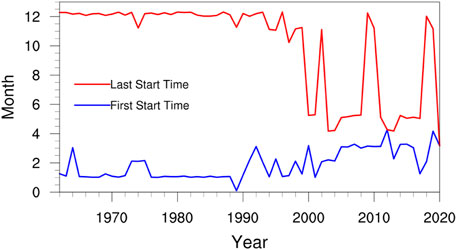
FIGURE 5. Start time of the first (solid blue line) and last sand-dust (solid red line) processes each year.
Table 1 lists the top 10 years with the maximum number of stations for suspended dust, blowing sand, and sand-dust storm processes during 1960–2020, as well as the months with the maximum number of sand-dust stations in 10 years. It can be seen that the top 10 years were mainly before the 1990s, including 4 years (1980, 1982, 1983, and 1988) in the 1980s. In addition, in the top 10 years, the months with the maximum number of suspended dust stations are concentrated in spring, with six instances in April, two storms in May, and only one occurrence in December. The top 10 years with the maximum number of blowing sand stations also mainly appeared before the 1990s, mostly in the 1970s–1980s. After the 1990s, only the year 2000 ranks in the top 10. In the top 10 years, the month with the maximum number of blowing sand stations was April, followed by February, with instances only happening once in January, March, and December. The top 10 years with the maximum number of sand-dust storm stations appeared all before the 1990s, with 3 times in the 1960s, 4 times in the 1970s, and 3 times in the 1980s. In addition, for the month with the maximum number of sand-dust storm stations, April is the most frequent (7 times), followed by March (2 times) and February (1 time).
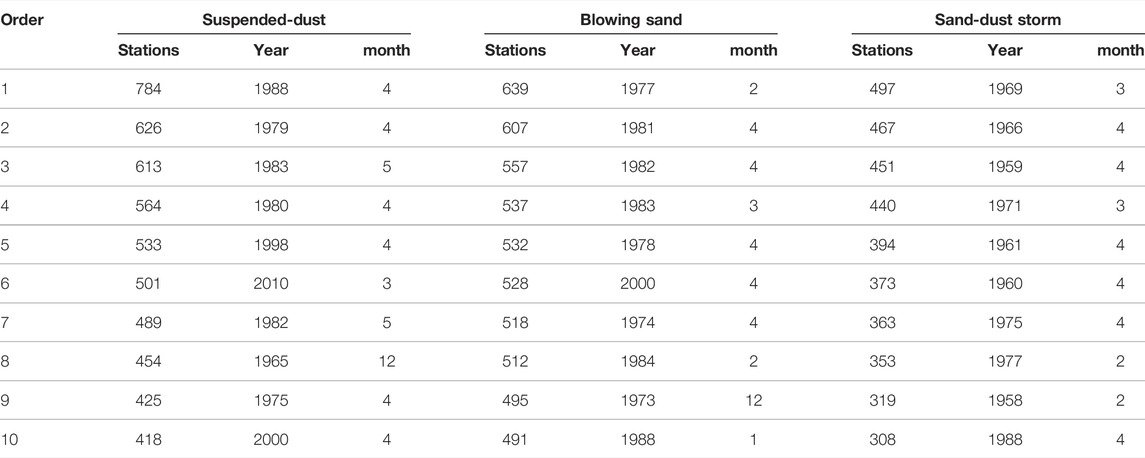
TABLE 1. The top 10 years with the maximum number of sand-dust stations for different sand-dust categories during 1961–2020, and the months with the maximum number of sand-dust stations in the 10 years.
Therefore, the top 10 years with the maximum number of sand-dust stations for different sand-dust categories are mainly before the 1990s, and the sand-dust processes mainly occur in April.
Table 2 lists the top 10 years with the most sand-dust processes, the months with the most sand-dust processes in the 10 years, and the maximum number of affected stations in a sand-dust process from 1961 to 2020. The top 10 years with the most suspended dust processes are mainly before the 1980s, including 3 years (1963, 1965, and 1966) in the 1960s, 6 years (1972, 1973, 1974, 1976, 1978, and 1979) in the 1970s and only 1 year (1982) after the 1980s. For the top 10 years with the most sand-dust processes, the annual total durations of sand-dust weather are all more than 60 days, with the most duration days in 1966. In addition, for the maximum number of sand-dust stations in these 10 years, the average value is 375, and the maximum is 626 in 1979. The maximum number of suspended dust stations mainly appear in April, followed by May and December (2 times). For the maximum number of blowing sand stations, the average is 471 in the 10 years, and the monthly distribution of the maximum number of blowing sand stations is relatively scattered, i.e., three times in April, twice in December, and once in January, February, March, and November. For the annual maximum number of sand-dust storm stations, the average is 248 in the 10 years, and the maximum mainly appears in spring, i.e., six times in April and once in January, March, May, and December.
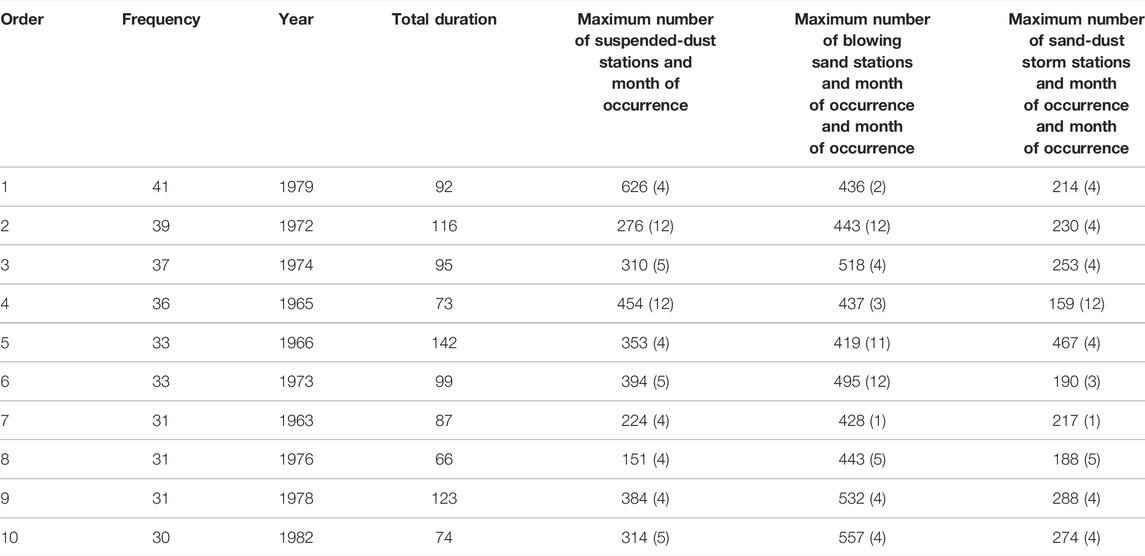
TABLE 2. The top 10 years with the most sand-dust processes, the months with the most sand-dust processes in the 10 years, and the maximum number of affected stations in a sand-dust process during 1961–2020.
Overall, the top 10 years with the most sand-dust processes are concentrated in the 1960s and 1970s, and the month with the most sand-dust processes is mainly April. In the years with more sand-dust processes, the maximum number of affected stations for different categories of sand-dust processes is also more than the average.
Figure 6 shows the probability distributions of the annual frequency, the maximum number of affected stations, annual total days, average days, and maximum duration of sand-dust processes. The probability distribution of the annual frequency of sand-dust processes is mainly concentrated 5–14 times and 26–32 times. The largest probability was six occurrences (5.6%), followed by 8–12 (4%) and 26–32 (about 3%). Considering the probability distribution of the maximum number of affected stations for different categories of sand-dust processes (Figure 6B), the number of suspended-dust stations is mainly concentrated in stations 220–430. The probability of 220 and 430 stations is the largest (8%), followed by 120 stations (6.3%), and the probability of exceeding 600 stations was 2%. The probability distribution of the maximum number of blowing-sand stations was relatively scattered, and the maximum probability (10%) appears in about 450 stations. The probability reaches 5% when the maximum number is 130–140, 220–240, or 300–320. The probability of storms affecting more than 600 stations is 1.5%. The maximum number of dust-dust storm stations has the highest probability for 60 stations (13.5%), followed by 30 stations (8.5%) and 110–130 stations, 160 stations, 230 stations, and 280 stations (more than 5%).
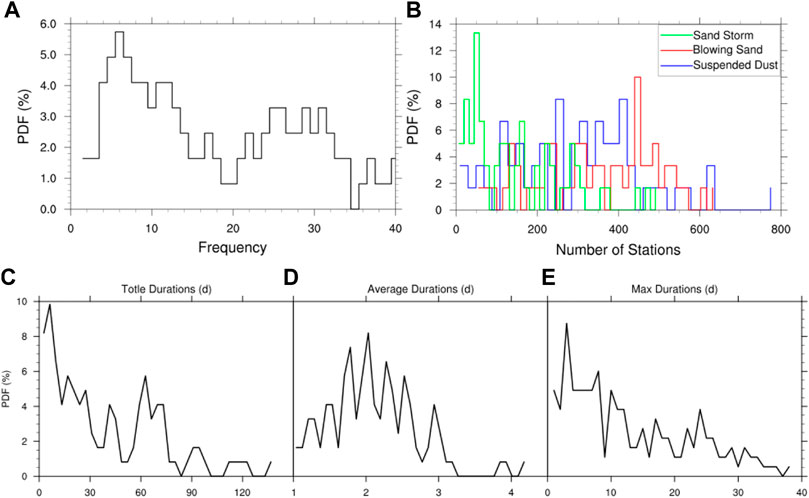
FIGURE 6. Probability distributions of (A) annual total frequency, (B) maximum number of affected stations, (C) annual total days, (D) average days, and (E) maximum duration for different categories of sand-dust processes.
The probability distribution of sand-dust process durations (Figures 6C–E) show that the annual total days of sand-dust processes are mainly about 5 days, followed by 10–30 days and 60–75 days (4%). The average probability of an annual total duration exceeding 100 days is 0.6%. The annual average days of sand-dust processes are mainly 1–3 days. The probability of 2 days is more than 6%, and the probability of 3 days is 3%. The maximum duration of sand-dust processes is mainly 1–8 days, of which the probability of 3 days is the largest (8%), followed by 10–12 days (4%). The probability with the maximum duration reaching 25 days exceeds 3%, and it is 1% for more than 30 days.
The annual total days of sand-dust processes are divided into 11 grades, i.e., 1–9, 10–19, 20–29, 30–39, 40–49, 50–59, 60–69, 70–79, 80–89, 90–99, and ≥100 (days), as shown in Figure 7A. The results suggest that the frequency of 1–9 is the most (14 times), accounting for 21%, followed by 20–29 (10 times; 15%). In addition, the frequency for 10–19 and 60–69 is 9 times, accounting for 13%. Overall, for the annual total days of sand-dust processes, the frequency is the most (33 times; 49%) within 30 days, followed by 60–79 (16 times; 23%). The frequency of more than 100 days is 3 times, accounting for 4%.
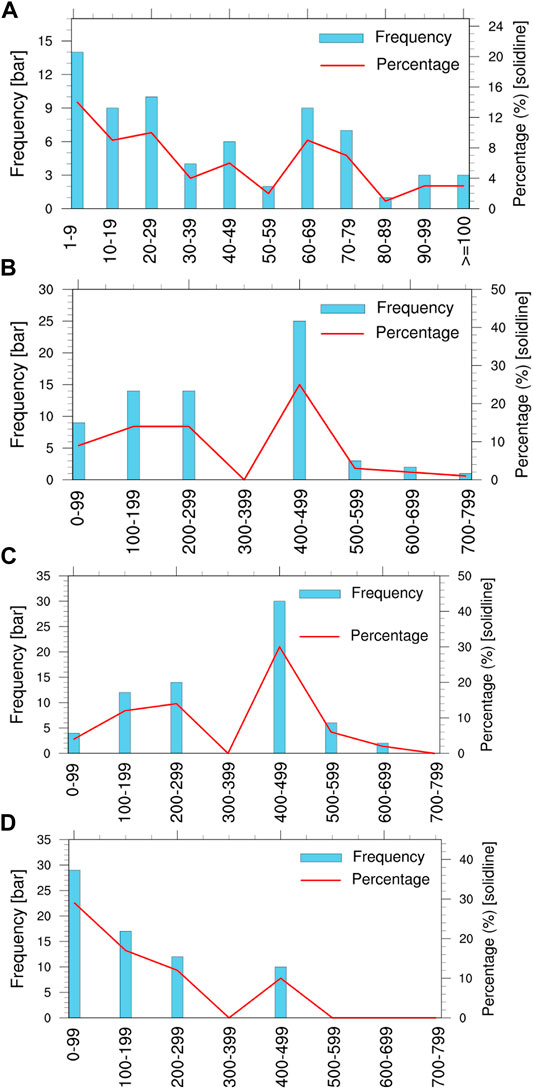
FIGURE 7. Frequency and probability of (A) the number of sand-dust processes, (B) maximum number of suspended-dust stations, (C) maximum number of blowing-sand stations, and (D) maximum number of sand-dust storm stations.
The maximum number of suspended-dust stations is divided into eight grades, i.e., 0–99, 100–199, 200–299, 300–399, 400–499, 500–599, 600–699, and 700–799, as shown in Figure 7B. The results indicate that the maximum number of suspended-dust stations is mainly concentrated in grades 100–299 and 400–499. Specifically, the highest probability is in grades 400–499 (45%), followed by grades 200–299 (15 times; 23%) and grades 100–199 (14 times; 19%). Similar to the suspended dust, the probability of the maximum number of blowing-sand stations (Figure 7C) is the largest in grades 400–499 (35%), followed by grades 100–199 and 200–299 (both 14 times; 20%). In addition, the frequency for grades 0–99 is 9 times, accounting for 14%. For the maximum number of sand-dust storm stations (Figure 7D), the probability is the highest in grades 0–99 (24 times; 38%), followed by grades 200–299 (17 times; 23%), 200–299 (13 times; 15%) and 400–499 (12 times; 14%). No sand-dust storms can affect more than 500 stations.
It can be seen that in the sand-dust processes in China, the probability of a large-scale sand-dust process is greater than the probability of a small-scale sand-dust process. Generally, during the small-scale sand-dust weather, the intensity of sand-dust is weak, mainly by suspended-dust. During the occurrence of large-scale sand-dust weather, the intensity of sand-dust is strong, mainly by blowing sand and sand storms.
Figure 8A shows the percentile box-type diagrams of the maximum number of affected stations, the average number of affected stations, the maximum number of affected stations in a single day for all the sand-dust processes (1,028 in total), and the number of affected stations for different categories of sand-dust processes from 1961 to 2020. The results show that the maximum number of affected stations for all the sand-dust processes is concentrated between 100 and 300, with an average value of 258 and a maximum value of 1,579. The average number of affected stations is concentrated between 100 and 200, with an average of 153 and a maximum value of 659. The maximum number of affected stations in a single day is concentrated between 100 and 300, with an average of 202 and a maximum of 1,122. In all the sand-dust processes, the number of suspended-dust stations is mainly concentrated between 30 and 120, with an average of 80 stations and a maximum of 784 stations. The number of blowing-sand stations is more than that of suspended-dust stations, and it is mainly concentrated between 70 and 200, with an average of 136 stations and a maximum of 639 stations. For a single sand-dust storm process, the number of affected stations is mainly concentrated between 10 and 50, with an average of 41 stations and a maximum of 497 stations.
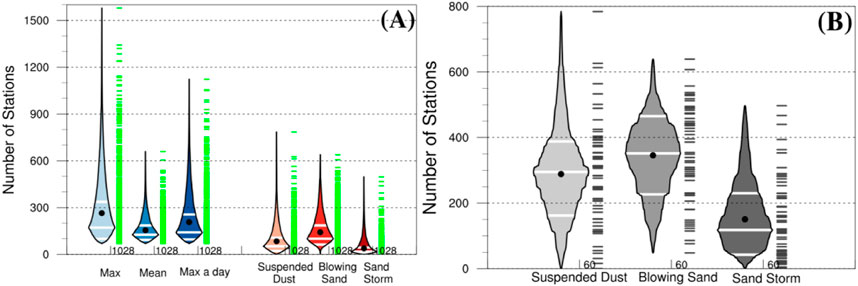
FIGURE 8. (A) Percentile box-type diagrams of the maximum, the average number of affected stations, the maximum number of stations in a single day for all sand-dust processes, and the number of affected stations for different categories of sand-dust processes during 1961–2020. (B) Percentile box-type diagrams of the maximum number of affected stations for different categories of sand-dust processes during 1961–2020. Black dots in boxes are average values, and white lines from the bottom to the top in boxes are the first, second, and third quartiles, respectively.
From the percentile box-type diagrams of the maximum number of affected stations for different categories of sand-dust processes during 1961–2020 (Figure 8B), the maximum number of suspended-dust stations is mainly concentrated between 180 and 390, with an average of 289 and a maximum of 784. The maximum number of blowing-sand stations is mainly concentrated between 220 and 460, with an average of 346 and a maximum of 639. The maximum number of sand-dust storm stations is concentrated between 50 and 230, with an average of 150 and a maximum of 497.
Figure 9 shows the monthly frequency of the annual maximum number of affected stations for different categories of sand-dust processes. The annual maximum number of suspended-dust stations mainly appears from March to May, including 41.7% in April and 25% in March, and appears only in June during summer and only in October during autumn, and the probability is 8.3% in winter. The annual maximum number of blowing-sand stations also mainly occurs in spring (March–May), 39.3% in April, 34.4% in March, and 8.3% in February. The probability of the maximum number of blowing-sand stations in winter is 15%, which is more than that of suspended dust and sand-dust storm weather. The maximum number of blowing-sand stations never appears in summer, and the probability is 2% in October. The probability of the maximum number of sand-dust storm stations reaches 82% in spring, with 55.7% in April, 24.6% in March, and 1.6% in May. The probability of annual maximum sand-dust storm stations is 1.6% in June, 0% in autumn, and, 4.9% in January–February.
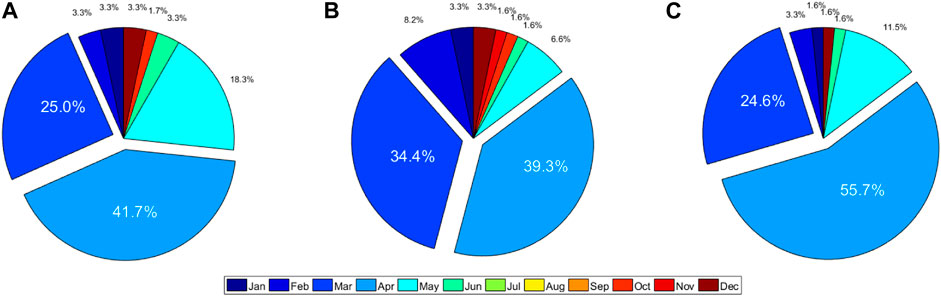
FIGURE 9. Monthly probability of the maximum number of affected stations for (A) suspended-dust, (B) blowing sand, and (C) sand-dust storm processes.
In summary, during 1961–2020, the probability of the annual total frequency of sand-dust processes is mainly concentrated 5–14 times and 26–32 times, with a maximum probability of 6 times. The annual total duration has a maximum probability of 5 days, followed by 60–70 days. The maximum numbers of suspended-dust, blowing-sand, and sand-dust storm stations are concentrated between 220 and 430, about 450 and about 60, respectively. The annual maximum numbers of affected stations for suspended dust, blowing sand and sand-dust storm are mainly concentrated in 180–390, 220–460, and 50–230, respectively. In addition, the months with the most affected stations by sand-dust processes mainly concentrate from March to May, with the highest probability in April.
The EEMD is quite suitable for analyzing nonlinear and non-stationary time series. It has the advantages of local stabilization processing and no need to pre-set basis function, and it can effectively solve the problems of mode mixing in the EMD.
From Figure 10A, it can be found that the annual total frequency of sand-dust processes before 1986 shows positive anomalies, except for 1963, while it is a negative anomaly during 1986–2020. By the EEMD of the annual number of sand-dust processes, we obtain four IMF components and one trend component (Res). Each component is relatively independent and can reflect the inherent multi-time scale oscillation mode in the initial sequence.
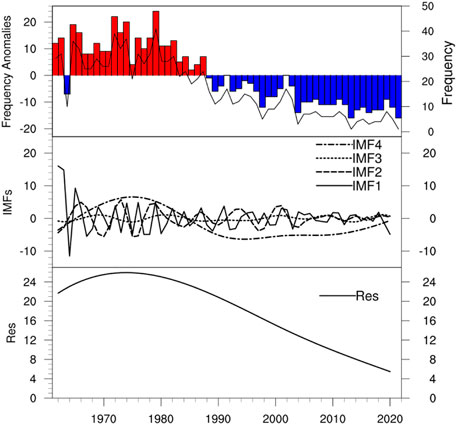
FIGURE 10. The anomalies evolution and the EEMD results of the annual total number of sand-dust processes.
Figure 10B shows the subsequence of the number of sand-dust processes between 1961 and 2020 using the EEMD. The results suggest that quasi-periodic oscillations of different time scales show strong or weak non-uniform changes with time in the same period. Specifically, the IMF1 component has the largest amplitude, with the highest fluctuation frequency. With time increasing, the amplitude and frequency of other IMF components decrease in turn, and corresponding fluctuation periods gradually increase. The IMF1 component has a 4–5-year periodic variation, a 6–8-year periodic variation for the IMF2 component, and a 10-year periodic variation for the IMF3 component. The trend component Res increases slightly and then decreases rapidly from 1961 to 2020.
The annual total duration of sand-dust processes and the anomaly evolution are given in Figure 11. There are positive anomalies before 1984, except for 1963. After 1984, there are negative anomalies, except for 1985 and 2000 when there are weak positive anomalies. This result indicates that annual total days of sand-dust processes are generally more than average before the mid-1980s and less than average thereafter. The IMF components and Res component decomposed by the EEMD show that there is a 4–5-year periodic variation for IMF1, a 6–8-year periodic variation for IMF2, and a 30-year periodic variation for IMF3. The Res component presents a significant decreasing trend from 1961 to 2020.
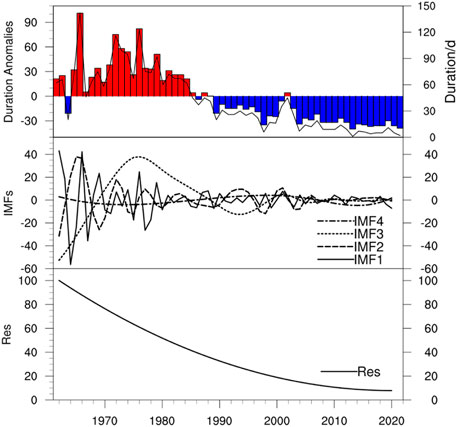
FIGURE 11. Same as Figure 10, but for the annual total days of sand-dust processes.
According to the EEMD results of the maximum number of affected stations for different categories of sand-dust processes (Figure 12), it can be found that the IMF1 component for the suspended-dust processes shows a 4-year periodic variation before the 1990s, and the cycle period is reduced to about 3 years from 1990s to 2010s and turns back to 4 years after 2010. There is an 8-year periodic variation for the IMF2 component, a 15–20-year periodic variation for IMF3, and a 30-year periodic variation for IMF4. Moreover, the Res component increases first and then decreases between 1961 and 2020. Specifically, it increases from 1961 to the early 1980s and decreases after the 1980s. For the maximum number of blowing-sand stations, the periodic variations of IMF components are consistent with suspended-dust processes, and its Res component shows an increase-decrease-increase trend. Specifically, it tends to increase from 1961 to 1978 and 2012–2020 and decrease from 1978 to 2012. For sand-dust storms, periodic variations of IMF components are consistent with those of the suspended-dust and blowing-sand processes. The Res component shows an overall decreasing trend, but it tends to increase slightly from the late 2010s to 2020.
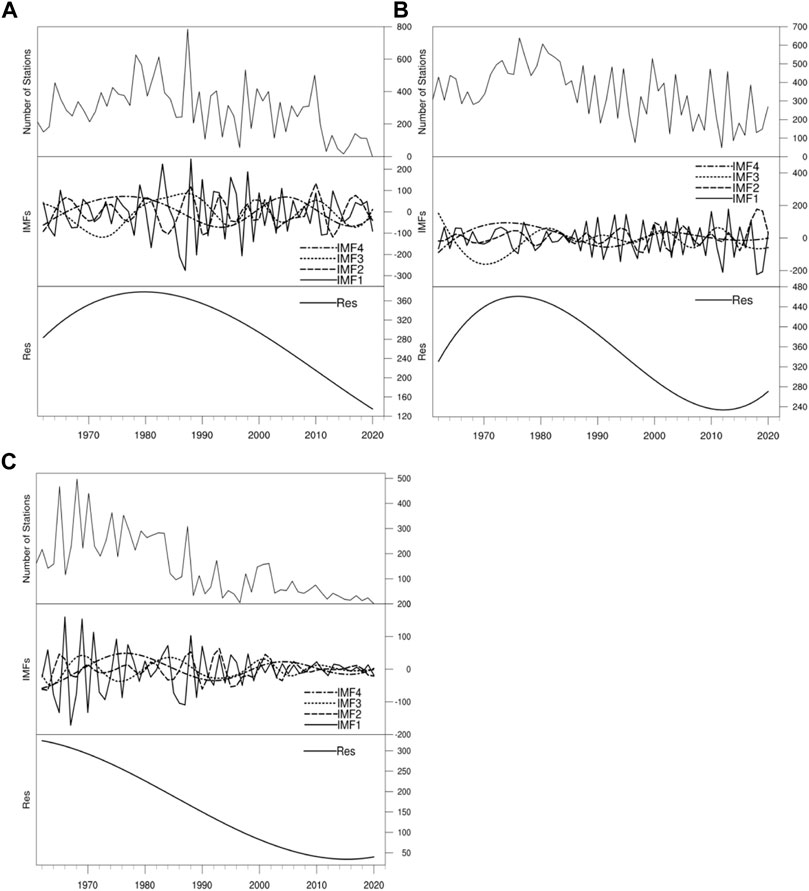
FIGURE 12. Annual maximum number of affected stations (top) and their EEMD results (bottom) for the (A) suspended dust, (B) blowing sand, and (C) sand-dust storm processes.
The relationships between the annual frequency and the annual total duration of sand-dust processes are shown in Figure 13A. It suggests that there is a positive linear correlation between them, and the correlation coefficient reaches 0.87. The annual total duration of sand-dust processes increases with the increase of their frequency. From the relationships between the annual total duration and the maximum number of affected stations for different categories of sand-dust processes (Figure 13B), it can be seen that there is no significant linear correlation between the total duration and the maximum number of suspended-dust stations, and the correlation coefficient is only 0.19, which fails to pass the significance test at 0.01 confidence level. However, the annual total duration of sand-dust processes positively correlates with the maximum number of affected stations for blowing-sand and sand-dust storm processes, and the correlation coefficients are 0.31 and 0.62, respectively, which both pass the significance test at a 0.01 confidence level.
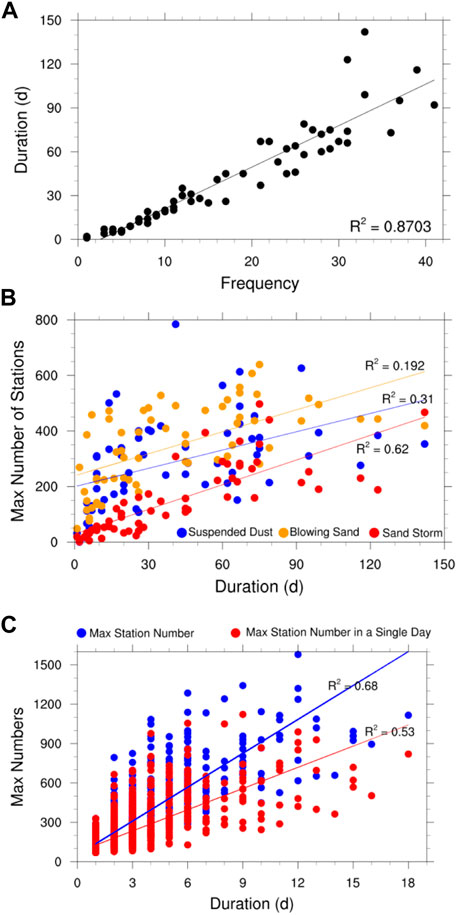
FIGURE 13. Scatter plots of all the sand-dust processes in 1961–2020. (A) Annual frequency and annual total duration. (B) Annual total duration and the maximum number of affected stations for different categories of sand-dust processes. (C) maximum duration, maximum numbers of affected stations in a single process and a single day.
Figure 13C presents the scatter plots of maximum duration, the maximum number of affected stations, and the maximum number of affected stations in a single day for all the 1,028 sand-dust processes. The results show that the maximum duration of sand-dust processes has linear correlations with both the maximum number of affected stations and the maximum number of affected stations in a single day, and the squared correlation coefficients reach 0.68 and 0.53, respectively, which both pass the significance test at 0.01 confidence level. In addition, the maximum duration of a single sand-dust process is mainly within 6 days, and the number of sand-dust stations in a single day mainly ranges between 100 and 600. The maximum number of affected stations for a single process is more than that of a single day, mainly concentrating in 200–900.
Figure 14 shows the spatial distribution of the number of sand-dust processes participated by each station in each decade from 1961 to 2020. It can be seen from the figure that the stations most involved in the sand-dust process are mainly in the central and western Inner Mongolia in northern China, the central Hexi Corridor in Gansu, Ningxia, Northern Shaanxi, and central and southern Hebei. Among them, central and western Inner Mongolia and northern Ningxia are the maximum value centers involved in the sand-dust process, and central and southern Hebei is the second maximum value center. During the period from 1961 to 1990, the average number of sand-dust processes in these areas reached more than 160 times/10a, among them, the participation times of central and western Inner Mongolia and northern Ningxia reached more than 220 times/10a, and the participation times of sand and dust process in central and southern Hebei reached more than 200 times/10a. Since the 1990s, the number of stations in northern China participating in sand-dust processes has decreased rapidly. From 1991 to 2000, only some parts of central and western Inner Mongolia recorded 80 times/10a. After 2011, the participation of most sites in China reduced to less than 40 times/10a.
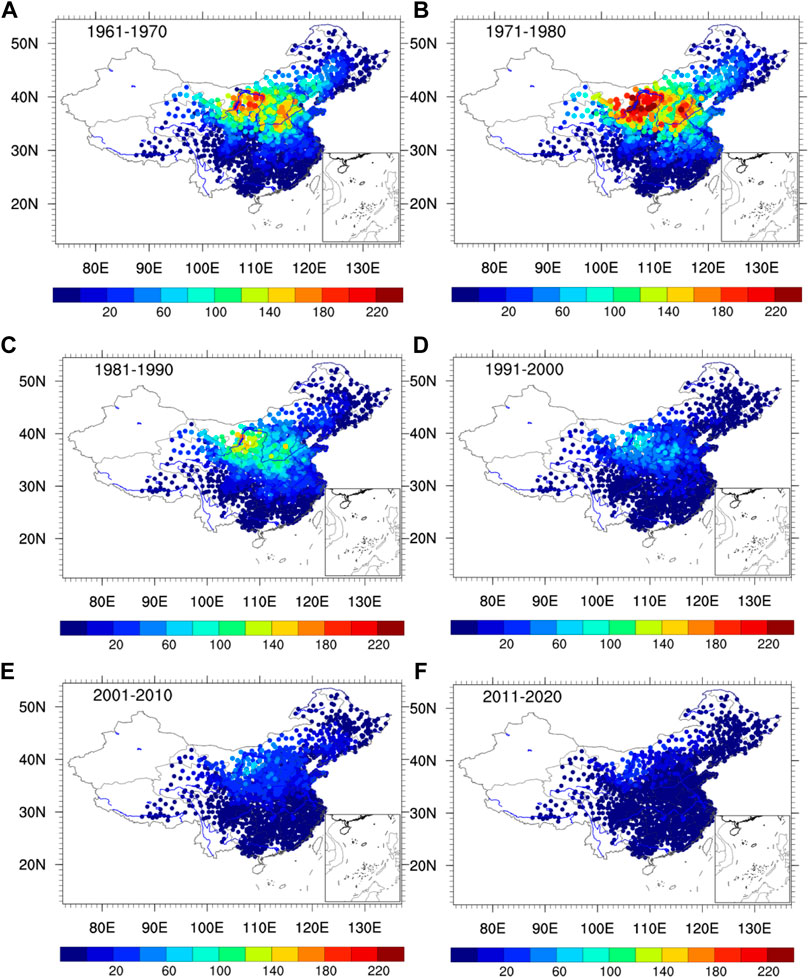
FIGURE 14. The spatial distribution map of the number of sand-dust processes participated by each station in each decade in China from 1961 to 2020.
In summary, there are obvious interannual fluctuations in dust activity in northern China, and dust activity in China, especially in northern China, has shown a decreasing trend in general over the past 60 years, but the trend varies significantly from region to region. Our results are also in general agreement with the analysis results using the Moderate Resolution Imaging Spectroradiometer (MODIS) aerosol optical thickness product (DOD) (Wang et al., 2021), which tests the reliability of MODIS aerosol inversion data from another perspective (Yu et al., 2020). Further analysis revealed that the maximum frequency of a single station participating in sand-dust processes was 245 times/10a from 1971 to 1980, 163 times/10a from 1981 to 1990, 90 times/10a from 1991 to 2000, 63 times/10a from 2001 to 2010 and 28 times/10a from 2011 to 2020.
Currently, most of the studies on sand-dust events in northern China are focused on the statistical characteristics of sand-dust weather at a single station, or they focus only on local features. Few studies have analyzed sand-duct events in northern China from the perspective of sand-dust processes. The few previous works on the spatio-temporal variation characteristics of the sand-dust processes are either based on outdated datasets or explore individual cases of major sand-dust events. Based on the identification methods and several characteristic quantities (including duration and impact range.) of sand-dust processes defined in the Operational Regulations of Monitoring and Evaluation for Regional Weather and Climate Processes, we analyzed the annual frequency, annual total duration, and the number of affected stations for different categories of sand-dust processes (including sand-dust storm, blowing sand and suspended dust) from January 1961 to May 2021. Based on the MK test and EEMD, we further analyzed evolution trends and the probability distribution characteristics of annual frequency, annual total duration, and the number of affected stations of sand-dust processes. In addition, the start time of the first and last sand-dust processes each year, as well as the seasonal distribution characteristics of sand-dust processes, were investigated.
The results show that the annual frequency, annual duration, maximum and average number of affected stations of sand-dust processes have all decreased significantly since the 1980s. The frequency and duration of sand-dust processes have two sudden change periods in the 1990s and around 2006. There is an increasing trend in the early 1980s, a significant decreasing trend in the 1980s–1990s, and since the late 1990s, the downward trend has been slow, especially after 206. Moreover, the start time of the first sand-dust process every year has been delayed from January to February, and the start time of the last sand-dust process has been advanced from December to May. Sand-dust processes mainly occur in spring (the most in April) and are less likely to occur in the summer. Furthermore, this study found that compared with 1961–1999, the average frequency and total duration of sand-dust processes 2000–2020 have decreased by 71.4 and 78%, respectively. Since the 1990s, the number of stations in northern China participating in sand-dust processes has decreased rapidly; from 1991 to 2000, only some parts of central and western Inner Mongolia reached 80 times/10a; after 2011, the number of participation of most sites in China has been reduced to less than 40 times/10a.
It is noteworthy that in 2021, the first sand-dust process in China occurred from January 13 to 14, more than 30 days earlier than the average in 2000–2020. In March 2021, China suffered from a severe sand-dust storm rarely seen in the past 10 years, which affected 19 provinces (districts and cities) and nearly half of the country’s land area. As of May 2021, the frequency and total duration of sand-dust processes in China increased sharply, reaching the maximum (10 times and 19 days) since 2003. As of October 2021, the annual amount of precipitation in northern China was the second largest in history, and rainstorms during the flood season had a high intensity and significant extremes. From July 17 to 22, an extreme rainstorm episode occurred in Henan Province of China, resulting in 292 deaths and 47 people going missing in Zhengzhou (https://www.mem.gov.cn/). In western China, the autumn rain started early, and the rainfall was highest compared to the same time of year previously. Moreover, the autumn rainfall in West China occurred significantly earlier (August 23), and was of larger intensity, with the most rainfall for the same period during other years in recent history. In September, the Weihe River experienced the largest flood for that time of year since 1935. The Yiluo River and Qin River suffered the largest floods for that time of year since 1950. Between October 3 and 6, the strongest autumn flood was recorded since meteorological records began in Shanxi Province. Meanwhile, high-temperature days were more than normal for this year, and the meteorological drought frequently occurred in the eastern part of southwest China, south China, and the eastern part of northwest China. Meanwhile, the number of landing typhoons was less, and only four typhoons landed in China, which is three fewer than in normal years (http://www.cma.gov.cn/).
Global warming has intensified the instability of the climate system and increased the possibility of extreme weather and climate events. Theoretically, water vapor will increase by 7% for every 1°C increase in temperature. This increase in water vapor makes heavy rain and rainstorms occur more frequently. Anomalies in the atmospheric circulation also cause instability in the climate system. As global warming increases, the intensity and frequency of extreme weather and climate events will be further enhanced in the future. In August 2021, the sixth assessment report of the Intergovernmental Panel on Climate Change (IPCC, 2021) revealed that all regions of the world will face intensified climate change and more severe weather extremes in the coming decades. A series of abnormal and extreme weather-climate events occurred in China in 2021. However, whether these indicate that 2021 is the beginning of a more intense period of climate change is unclear, and this issue requires further systematic research, examining the overall weather and climate characteristics and various external forcing factors in 2021.
The raw data supporting the conclusions of this article will be made available by the authors, without undue reservation.
WH initiated the study. HD, TF, WH, HW and PY interpreted the data. HD and WH wrote the article.
This work was supported by the National Natural Science Foundation of China (Grant: 42005058, 41675092), the Foundation of drought Meteorological Science Research (IAM202118), and the Northwest Regional Numerical Forecasting Innovation Team (grant no. GSQXCXTD-2020-02).
The authors declare that the research was conducted in the absence of any commercial or financial relationships that could be construed as a potential conflict of interest.
All claims expressed in this article are solely those of the authors and do not necessarily represent those of their affiliated organizations, or those of the publisher, the editors and the reviewers. Any product that may be evaluated in this article, or claim that may be made by its manufacturer, is not guaranteed or endorsed by the publisher.
We acknowledge the National Meteorological Information Center of China Meterological Administration for providing high quality data.
Ahmed, A. S., Ali, A. A., and Alhaider, M. A. (1987). Measurement of Atmospheric Particle Size Distribution during Sand/duststorm in Riyadh, Saudi Arabia. Atmos. Environ. (1967) 21, 2723–2725. doi:10.1016/0004-6981(87)90205-8
Alizadeh-Choobari, O., Ghafarian, P., and Owlad, E. (2016). Temporal Variations in the Frequency and Concentration of Dust Events over Iran Based on Surface Observations. Int. J. Climatol. 36, 2050–2062. doi:10.1002/joc.4479
Alpert, P., and Ganor, E. (2001). Sahara mineral Dust Measurements from TOMS: Comparison to Surface Observations over the Middle East for the Extreme Dust Storm, March 14-17, 1998. J. Geophys. Res. 106, 18275–18286. doi:10.1029/2000JD900366
Bar-Or, R., Erlick, C., and Gildor, H. (2008). The Role of Dust in Glacial-Interglacial Cycles. Quat. Sci. Rev. 27, 201–208. doi:10.1016/j.quascirev.2007.10.015
Beyranvand, A., Azizi, G., Alizadeh-Choobari, O., and Darvishi Boloorani, A. (2019). Spatial and Temporal Variations in the Incidence of Dust Events over Iran. Nat. Hazards 97, 229–241. doi:10.1007/s11069-019-03637-w
Bi, S., Bi, S., Chen, X., Ji, H., and Lu, Y. (2018). A Climate Prediction Method Based on EMD and Ensemble Prediction Technique. Asia-pacific J. Atmos. Sci. 54, 611–622. doi:10.1007/s13143-018-0078-z
Bishop, J. K. B., Davis, R. E., and Sherman, J. T. (2002). Robotic Observations of Dust Storm Enhancement of Carbon Biomass in the North Pacific. Science 298, 817–821. doi:10.1126/science.1074961
Bryant, R. G. (2013). Recent Advances in Our Understanding of Dust Source Emission Processes. Prog. Phys. Geogr. Earth Environ. 37, 397–421. doi:10.1177/0309133313479391
Calov, R., Ganopolski, A., Claussen, M., Petoukhov, V., and Greve, R. (2005). Transient Simulation of the Last Glacial Inception. Part I: Glacial Inception as a Bifurcation in the Climate System. Clim. Dyn. 24, 545–561. doi:10.1007/s00382-005-0007-6
Carslaw, K. S., Lee, L. A., Reddington, C. L., Pringle, K. J., Rap, A., Forster, P. M., et al. (2013). Large Contribution of Natural Aerosols to Uncertainty in Indirect Forcing. Nature 503, 67–71. doi:10.1038/nature12674
Central Meteorological Bureau (1979). Standard on the Surface Meteorological Observation. Beijing, China: China Meteorological Press, 186. (in Chinese).
Chandler, D. G., Blaesing–Thompson, S., and Busacca, A. (2004). Geospatial Assessment of Agricultural Lands Critical to Air Quality on the Columbia Plateau, Washington State. J. Soil Water Conserv. 59, 184–189.
Chen, Y.-S., Sheen, P.-C., Chen, E.-R., Liu, Y.-K., Wu, T.-N., and Yang, C.-Y. (2004). Effects of Asian Dust Storm Events on Daily Mortality in Taipei, Taiwan. Environ. Res. 95 (2), 151–155. doi:10.1016/j.envres.2003.08.008
Chun, Y., Boo, K.-O., Kim, J., Park, S.-U., and Lee, M. (2001). Synopsis, Transport, and Physical Characteristics of Asian Dust in Korea. J. Geophys. Res. 106 (D16), 18461–18469. doi:10.1029/2001jd900184
Chung, Y.-s., Kim, H.-s., Dulam, J., and Harris, J. (2003). On Heavy Dustfall Observed with Explosive Sandstorms in Chongwon-Chongju, Korea in 2002. Atmos. Environ. 37 (24), 3425–3433. doi:10.1016/s1352-2310(03)00360-1
Chung, Y. S., Kim, H. S., Park, K. H., Jugder, D., and Gao, T. (2005). Observations of Dust–Storms in China, Mongolia and Associated Dust Falls in Korea in spring 2003. Water Air Soil Pollut. Focus 5 (3), 15–35. doi:10.1007/s11267–005–0724–1
Creamean, J. M., Suski, K. J., Rosenfeld, D., Cazorla, A., DeMott, P. J., Sullivan, R. C., et al. (2013). Dust and Biological Aerosols from the Sahara and Asia Influence Precipitation in the Western U.S. Science 339, 1572–1578. doi:10.1126/science.1227279
Deng, Q., and Fu, Z. (2019). Comparison of Methods for Extracting Annual Cycle with Changing Amplitude in Climate Series. Clim. Dyn. 52, 5059–5070. doi:10.1007/s00382-018-4432-8
Diodato, N., and Bellocchi, G. (2014). Long-term winter Temperatures in central Mediterranean: Forecast Skill of an Ensemble Statistical Model. Theor. Appl. Climatol 116, 131–146. doi:10.1007/s00704-013-0915-z
Dong, Z. B., Wang, X. M., and Liu, L. Y. (2000). Wind Erosion in Arid and Semiarid China: An Overview. J. Soil Water Conserv 55, 439–444. doi:10.3321/j.issn:1000–694X.2000.02.007
Duce, R. A., Unni, C. K., Ray, B. J., Prospero, J. M., and Merrill, J. T. (1980). Long-Range Atmospheric Transport of Soil Dust from Asia to the Tropical North Pacific: Temporal Variability. Science 209, 1522–1524. doi:10.1126/science.209.4464.1522
Evan, A. T., Vimont, D. J., Heidinger, A. K., Kossin, J. P., and Bennartz, R. (2009). The Role of Aerosols in the Evolution of Tropical North Atlantic Ocean Temperature Anomalies. Science 324, 778–781. doi:10.1126/science.1167404
Ganor, E., Osetinsky, I., Stupp, A., and Alpert, P. (2010). Increasing Trend of African Dust, over 49 years, in the Eastern Mediterranean. J. Geophys. Res. 115, D07201. doi:10.1029/2009JD012500
Giannadaki, D., Pozzer, A., and Lelieveld, J. (2013). Modeled Global Effects of Airborne Desert Dust on Air Quality and Premature Mortality. Atmos. Chem. Phys. 13 (9), 957–968. doi:10.5194/acp–14–957–2014
Goudie, A. S. (2014). Desert Dust and Human Health Disorders. Environ. Int. 63, 101–113. doi:10.1016/j.envint.2013.10.011
Goudie, A. S. (1983). Dust Storms in Space and Time. Prog. Phys. Geogr. Earth Environ. 7, 502–530. doi:10.1177/030913338300700402
Goudie, A. S. (2009). Dust Storms: Recent Developments. J. Environ. Manage. 90, 89–94. doi:10.1016/j.jenvman.2008.07.007
Grousset, F. E., Ginoux, P., Bory, A., and Biscaye, P. E. (2003). Case Study of a Chinese Dust Plume Reaching the French Alps. Geophys. Res. Lett. 30, 1277. doi:10.1029/2002GL016833
Guan, Q., Sun, X., Yang, J., Pan, B., Zhao, S., and Wang, L. (2017). Dust Storms in Northern China: Long-Term Spatiotemporal Characteristics and Climate Controls. J. Clim. 30 (17), 6683–6700. doi:10.1175/jcli-d-16-0795.1
Guan, Q., Yang, J., Zhao, S., Pan, B., Liu, C., Zhang, D., et al. (2014). Climatological Analysis of Dust Storms in the Area Surrounding the Tengger Desert during 1960-2007. Clim. Dyn. 45, 903–913. doi:10.1007/s00382-014-2321-3
Guo, B., Chen, Z., Guo, J., Liu, F., Chen, C., and Liu, K. (2016). Analysis of the Nonlinear Trends and Non-stationary Oscillations of Regional Precipitation in Xinjiang, Northwestern China, Using Ensemble Empirical Mode Decomposition. Ijerph 13, 345. doi:10.3390/ijerph13030345
Guo, L., Fan, B., Zhang, F., Jin, Z., and Lin, H. (2018). The Clustering of Severe Dust Storm Occurrence in China from 1958 to 2007. J. Geophys. Res. Atmos. 123, 8035–8046. doi:10.1029/2018JD029042
Han, Y., Fang, X., Zhao, T., and Kang, S. (2008). Long Range Trans-Pacific Transport and Deposition of Asian Dust Aerosols. J. Environ. Sci. 20, 424–428. doi:10.1016/s1001-0742(08)62074-4
Hsu, S.-C., Liu, S. C., Arimoto, R., Liu, T.-H., Huang, Y.-T., Tsai, F., et al. (2009). Dust Deposition to the East China Sea and its Biogeochemical Implications. J. Geophys. Res. 114, D15304. doi:10.1029/2008JD011223
Hu, Z., Jin, Q., Ma, Y., Pu, B., Ji, Z., Wang, Y., et al. (2021). Temporal Evolution of Aerosols and Their Extreme Events in Polluted Asian Regions during Terra's 20-year Observations. Remote Sensing Environ. 263, 112541. doi:10.1016/j.rse.2021.112541
Huang, J., Minnis, P., Yan, H., Yi, Y., Chen, B., Zhang, L., et al. (2010b). Dust Aerosol Effect on Semi-arid Climate over Northwest China Detected from A-Train Satellite Measurements. Atmos. Chem. Phys. 10, 6863–6872. doi:10.5194/acp-10-6863-2010
Huang, J., Wang, T., Wang, W., Li, Z., and Yan, H. (2014). Climate Effects of Dust Aerosols over East Asian Arid and Semiarid Regions. J. Geophys. Res. Atmos. 119 (19), 11398–11416. doi:10.1002/2014JD021796
Huang, J., Zhang, C., Prospero, J. M., Yi, Y., Hu, Y., SunMack, –S., et al. (2010a). African Dust Outbreaks: a Satellite Perspective of Temporal and Spatial Variability over the Tropical Atlantic Ocean. J. Geophys. Res. 115, D05202. doi:10.1029/2009JD012516
Huang, N. E., Shen, Z., Long, S. R., Wu, M. C., Shih, H. H., Zheng, Q., et al. (1998). The Empirical Mode Decomposition and the Hilbert Spectrum for Nonlinear and Non-stationary Time Series Analysis. Proc. R. Soc. Lond. A. 454, 903–995. doi:10.1098/rspa.1998.0193
Huang, N. E., and Wu, Z. (2008). A Review on Hilbert-Huang Transform: Method and its Applications to Geophysical Studies. Rev. Geophys. 46, RG2006. doi:10.1029/2007RG000228
Husar, R. B., Tratt, D. M., Schichtel, B. A., Falke, S. R., Li, F., Jaffe, D., et al. (2001). Asian Dust Events of April 1998. J. Geophys. Res. 106 (D16), 18317–18330. doi:10.1029/2000jd900788
Idso, S. B., and Brazel, A. J. (1977). Planetary Radiation Balance as a Function of Atmospheric Dust: Climatological Consequences. Science 198, 731–733. doi:10.1126/science.198.4318.731
Iwasaka, Y., Minoura, H., and Nagaya, K. (1983). The Transport and Spacial Scale of Asian Dust-Storm Clouds: a Case Study of the Dust-Storm Event of April 1979. Tellus B: Chem. Phys. Meteorology 35, 189–196. doi:10.3402/tellusb.v35i3.14594
Jin, Q., and Wang, C. (2018). The Greening of Northwest Indian Subcontinent and Reduction of Dust Abundance Resulting from Indian Summer Monsoon Revival. Sci. Rep. 8. doi:10.1038/s41598-018-23055-5
Jin, Q., Wei, J., Lau, W. K. M., Pu, B., and Wang, C. (2021). Interactions of Asian mineral Dust with Indian Summer Monsoon: Recent Advances and Challenges. Earth-Science Rev. 215, 103562. doi:10.1016/j.earscirev.2021.103562
Jin, Q., Wei, J., Yang, Z.-L., and Lin, P. (2017). Irrigation-induced Environmental Changes Around the Aral Sea: an Integrated View from Multiple Satellite Observations. Remote Sensing 9 (9), 900. doi:10.3390/rs9090900
Jin, Q., Yang, Z.-L., and Wei, J. (2016). Seasonal Responses of Indian Summer Monsoon to Dust Aerosols in the Middle East, India, and China. J. Clim. 29, 6329–6349. doi:10.1175/JCLI-D-15-0622.1
Kang, L., Huang, J., Chen, S., and Wang, X. (2016). Long-term Trends of Dust Events over Tibetan Plateau during 1961-2010. Atmos. Environ. 125, 188–198. doi:10.1016/j.atmosenv.2015.10.085
Kashima, S., Yorifuji, T., Bae, S., Honda, Y., Lim, Y.-H., and Hong, Y.-C. (2016). Asian Dust Effect on Cause-specific Mortality in Five Cities across South Korea and Japan. Atmos. Environ. 128, 20–27. doi:10.1016/j.atmosenv.2015.12.063
Kim, H., and Choi, M. (2015). Impact of Soil Moisture on Dust Outbreaks in East Asia: Using Satellite and Assimilation Data. Geophys. Res. Lett. 42 (8), 2789–2796. doi:10.1002/2015GL063325
Kjelgaard, J., Sharratt, B., Sundram, I., Lamb, B., Claiborn, C., Saxton, K., et al. (2004). PM10 Emission from Agricultural Soils on the Columbia Plateau: Comparison of Dynamic and Time-Integrated Field-Scale Measurements and Entrainment Mechanisms. Agric. For. Meteorology 125, 259–277. doi:10.1016/j.agrformet.2004.04.004
Knippertz, P., and Stuut, J. B. W. (2014). Mineral Dust. Dordrecht, Heidelberg, New York, London: Springer.
Krinner, G., Boucher, O., and Balkanski, Y. (2006). Ice-free Glacial Northern Asia Due to Dust Deposition on Snow. Clim. Dyn. 27, 613–625. doi:10.1007/s00382-006-0159-z
Kurosaki, Y., Shinoda, M., and Mikami, M. (2011). What Caused a Recent Increase in Dust Outbreaks over East Asia? Geophys. Res. Lett. 38, a–n. doi:10.1029/2011GL047494
Lee, H., Honda, Y., Lim, Y.-H., Guo, Y. L., Hashizume, M., and Kim, H. (2014). Effect of Asian Dust Storms on Mortality in Three Asian Cities. Atmos. Environ. 89, 309–317. doi:10.1016/j.atmosenv.2014.02.048
Li, J., Wang, S., Chu, J., Wang, J., Li, X., Yue, M., et al. (2018). Characteristics of Air Pollution Events over Hotan Prefecture at the Southwestern Edge of Taklimakan Desert, China. J. Arid Land 10, 686–700. doi:10.1007/s40333-018-0096-9
Li, Y.-z., and Yue, C.-f. (2020). Prediction and Analysis of Non-stationary Runoff Extreme Sequence Based on ESMD Combination Prediction Model. Water Supply 20 (4), 1439–1452. doi:10.2166/ws.2020.058
Li, Y., Ren, F., Li, Y., Wang, P., and Yan, H. (2014). Characteristics of the Regional Meteorological Drought Events in Southwest China during 1960-2010. J. Meteorol. Res. 28 (3), 381–392. doi:10.1007/s13351-014-3144-1
Li, Z., Lau, W. K. M., Ramanathan, V., Wu, G., Ding, Y., Manoj, M. G., et al. (2016). Aerosol and Monsoon Climate Interactions over Asia. Rev. Geophys. 54, 866–929. doi:10.1002/2015RG000500
Liang, P., and Ding, Y. H. (2012). Extended Range Forecast Experiment Based on Intraseasonal Oscillation. Chin. J. Atmos. Sci. 36 (1), 102–116. doi:10.3878/j.issn.1006–9895.2012.01.09
Lin, D., Bueh, C., and Xie, Z. (2016). Relationship between Summer Rainfall over North China and India and its Genesis Analysis. Chin. J. Atmos. Sci. 40 (1), 201–214. doi:10.3878/j.issn.1006–9895.1503.14339
Ling, X., Guo, W., and Fu, C. (2014). Composite Analysis of Impacts of Dust Aerosols on Surface Atmospheric Variables and Energy Budgets in a Semiarid Region of China. J. Geophys. Res. Atmos. 119 (6), 3107–3123. doi:10.1002/2013JD020274
Littmann, T. (1991). Dust Storm Frequency in Asia: Climatic Control and Variability. Int. J. Climatol. 11, 393–412. doi:10.1002/joc.3370110405
Liu, C.-M., Young, C.-Y., and Lee, Y.-C. (2006). Influence of Asian Dust Storms on Air Quality in Taiwan. Sci. Total Environ. 368 (2–3), 884–897. doi:10.1016/j.scitotenv.2006.03.039
Liu, L. Y., Shi, P. J., Gao, S. Y., Zou, X. Y., Erdon, H., Yan, P., et al. (2004). Dustfall in China's Western Loess Plateau as Influenced by Dust Storm and Haze Events. Atmos. Environ. 38, 1699–1703. doi:10.1016/j.atmosenv.2004.01.003
Liu, Q., Liu, Y., Yin, J., Zhang, M., and Zhang, T. (2014). Chemical Characteristics and Source Apportionment of PM10 during Asian Dust Storm and Non-dust Storm Days in Beijing. Atmos. Environ. 91, 85–94. doi:10.1016/j.atmosenv.2014.03.057
Liu, Z., Fairlie, T. D., Uno, I., Huang, J., Wu, D., Omar, A., et al. (2013). Transpacific Transport and Evolution of the Optical Properties of Asian Dust. J. Quantitative Spectrosc. Radiative Transfer 116, 24–33. doi:10.1016/j.jqsrt.2012.11.011
Mahowald, N. (2011). Aerosol Indirect Effect on Biogeochemical Cycles and Climate. Science 334, 794–796. doi:10.1126/science.1207374
Mahowald, N. M., Baker, A. R., Bergametti, G., Brooks, N., Duce, R. A., Jickells, T. D., et al. (2005). Atmospheric Global Dust Cycle and Iron Inputs to the Ocean. Glob. Biogeochem. Cycles 19, a–n. doi:10.1029/2004GB002402
Mahowald, N. M., Muhs, D. R., Levis, S., Rasch, P. J., Yoshioka, M., Zender, C. S., et al. (2006). Change in Atmospheric mineral Aerosols in Response to Climate: Last Glacial Period, Preindustrial, Modern, and Doubled Carbon Dioxide Climates. J. Geophys. Res. 111, a–n. doi:10.1029/2005JD006653
Mann, H. B. (1945). Nonparametric Tests against Trend. Econometrica 13, 245–259. doi:10.2307/1907187
Mao, R., Hu, Z., Zhao, C., Gong, D.-Y., Guo, D., and Wu, G. (2019). The Source Contributions to the Dust over the Tibetan Plateau: A Modelling Analysis. Atmos. Environ. 214, 116859. doi:10.1016/j.atmosenv.2019.116859
Meng, Z., and Lu, B. (2007). Dust Events as a Risk Factor for Daily Hospitalization for Respiratory and Cardiovascular Diseases in Minqin, China. Atmos. Environ. 41 (33), 7048–7058. doi:10.1016/j.atmosenv.2007.05.006
Mott, J. A., Mannino, D. M., Alverson, C. J., Kiyu, A., Hashim, J., Lee, T., et al. (2005). Cardiorespiratory Hospitalizations Associated with Smoke Exposure during the 1997 Southeast Asian forest Fires. Int. J. Hyg. Environ. Health 208, 75–85. doi:10.1016/j.ijheh.2005.01.018
Mukai, M., Nakajima, T., and Takemura, T. (2004). A Study of Long-Term Trends in mineral Dust Aerosol Distributions in Asia Using a General Circulation Model. J. Geophys. Res. 109 (19), D19204. doi:10.1029/2003JD004270
Natsagdorj, L., Jugder, D., and Chung, Y. S. (2003). Analysis of Dust Storms Observed in Mongolia during 1937-1999. Atmos. Environ. 37, 1401–1411. doi:10.1016/s1352-2310(02)01023-3
Niu, R. Y., Tian, C. Y., Zhang, H. D., and Zong, Z. P. (2017). The Dust Weather Grade, GB/T20480-2017. Beijing, China: Standards Press of China. (in Chinese).
Onoz, B., and Bayazit, M. (2003). The Power of Statistical Tests for Trend Detection. Turkish J. Eng. Environ. Sci. 27 (4), 247–251.
Prospero, J. M., Bullard, J. E., and Hodgkins, R. (2012). High-Latitude Dust over the North Atlantic: Inputs from Icelandic Proglacial Dust Storms. Science 335 (6072), 1078–1082. doi:10.1126/science.1217447
Prospero, J. M., Ginoux, P., Torres, O., Nicholson, S. E., and Gill, T. E. (2002). Environmental Characterization of Global Sources of Atmospheric Soil Dust Identified with the Nimbus 7 Total Ozone Mapping Spectrometer (TOMS) Absorbing Aerosol Product. Rev. Geophys. 40 (1), 2–1. doi:10.1029/2000RG000095
Pu, W., Zhao, X., Shi, X., Ma, Z., Zhang, X., and Yu, B. (2015). Impact of Long-Range Transport on Aerosol Properties at a Regional Background Station in Northern China. Atmos. Res. 153, 489–499. doi:10.1016/j.atmosres.2014.10.010
Qi, Y., Qian, C., and Yan, Z. (2017). An Alternative Multi-Model Ensemble Mean Approach for Near-Term Projection. Int. J. Climatol. 37, 109–122. doi:10.1002/joc.4690
Qian, W., Quan, L., and Shi, S. (2002). Variations of the Dust Storm in China and its Climatic Control. J. Clim. 15, 1216–1229. doi:10.1175/1520-0442(2002)015<1216:votdsi>2.0.co;2
Qian, Y.-B., Wu, Z.-N., Yang, Q., Zhang, L.-Y., and Wang, X.-Y. (2007). Ground-surface Conditions of Sand-Dust Event Occurrences in the Southern Junggar Basin of Xinjiang, China. J. Arid Environments 70 (1), 49–62. doi:10.1016/j.jaridenv.2006.12.001
Qian, Y. B., Wu, Z. N., Zhang, L. Y., Shi, Q., and Wang, X. (2004). Ground–surface Conditions Resulting in Sand–Dust Storms in the South Junggar Basin. Arid Land Geogr. 27 (4), 540–542. doi:10.1117/12.528072
Quan, L., Shi, S., Zhu, Y., and Qian, W. (2001). Temporal–spatial Distribution Characteristics and Causes of Dust–Day in China. Acta Geogr. Sin. 4, 477–485. doi:10.11821/xb200104011
Ren, F., Cui, D., Gong, Z., Wang, Y., Zou, X., Li, Y., et al. (2012). An Objective Identification Technique for Regional Extreme Events. J. Clim. 25, 7015–7027. doi:10.1175/JCLI-D-11-00489.1
Sankaran, A. (2017). Unveiling the Multiscale Teleconnection between Pacific Decadal Oscillation and Global Surface Temperature Using Time-dependent Intrinsic Correlation Analysis. Int. J. Climatol. 37, 548–558. doi:10.1002/joc.4713
Shao, J., and Mao, J. (20162016). Dust Particle Size Distributions during Spring in Yinchuan, China. Adv. Meteorology 2016, 1–8. doi:10.1155/2016/6940502
Shao, Y., and Dong, C. H. (2006). A Review on East Asian Dust Storm Climate, Modelling and Monitoring. Glob. Planet. Change 52, 1–22. doi:10.1016/j.gloplacha.2006.02.011
Shao, Y., Klose, M., and Wyrwoll, K.-H. (2013). Recent Global Dust Trend and Connections to Climate Forcing. J. Geophys. Res. Atmos. 118, 107–111. doi:10.1002/jgrd.50836
Stith, J. L., Ramanathan, V., Cooper, W. A., Roberts, G. C., DeMott, P. J., Carmichael, G., et al. (2009). An Overview of Aircraft Observations from the Pacific Dust Experiment Campaign. J. Geophys. Res. 114 (D5), D05207. doi:10.1029/2008jd010924
Stone, R., Anderson, G., and Andrews, E. (2005). “Asian Dust Signature at Barrow: Observed and Simulated Incursions and Impact of Asian Dust over Northern Alaska,” in Proc. Workshop on Remote Sensing of Atmospheric Aerosols (Tucson, AZ: IEEE), 74–79.
Sun, J., Zhang, M., and Liu, T. (2001). Spatial and Temporal Characteristics of Dust Storms in China and its Surrounding Regions, 1960-1999: Relations to Source Area and Climate. J. Geophys. Res. 106 (10), 10325–10333. doi:10.1029/2000JD900665
Tam, W. W. S., Wong, T. W., Wong, A. H. S., and Hui, D. S. C. (2012). Effect of Dust Storm Events on Daily Emergency Admissions for Cardiovascular Diseases. Circ. J. 76 (3), 655–660. doi:10.1253/circj.cj-11-0894
Tanaka, T. Y., and Chiba, M. (2006). A Numerical Study of the Contributions of Dust Source Regions to the Global Dust Budget. Glob. Planet. Change 52 (1–4), 88–104. doi:10.1016/j.gloplacha.2006.02.002
Tang, Y., Han, G., Wu, Q., and Xu, Z. (2013). Use of Rare Earth Element Patterns to Trace the Provenance of the Atmospheric Dust Near Beijing, China. Environ. Earth Sci. 68, 871–879. doi:10.1007/s12665-012-1791-z
Tian, R., Ma, X., Jia, H., Yu, F., Sha, T., and Zan, Y. (2019). Aerosol Radiative Effects on Tropospheric Photochemistry with GEOS-Chem Simulations. Atmos. Environ. 208, 82–94. doi:10.1016/j.atmosenv.2019.03.032
Tong, D. Q., Wang, J. X. L., Gill, T. E., Lei, H., and Wang, B. (2017). Intensified Dust Storm Activity and Valley Fever Infection in the Southwestern United States. Geophys. Res. Lett. 44, 4304–4312. doi:10.1002/2017GL073524
Tratt, D. M., Frouin, R. J., and Westphal, D. L. (2001). April 1998 Asian Dust Event: a Southern California Perspective. J. Geophys. Res. 106 (D16), 18371–18379. doi:10.1029/2000JD900758
Uno, I., Amano, H., Emori, S., Kinoshita, K., Matsui, I., and Sugimoto, N. (2001). Trans-Pacific Yellow Sand Transport Observed in April 1998: A Numerical Simulation. J. Geophys. Res. 106 (D16), 18331–18344. doi:10.1029/2000jd900748
IPCC (2021). “Summary for Policymakers,” in Climate Change 2021: The Physical Science Basis. Contribution of Working Group I to the Sixth Assessment Report of the Intergovernmental Panel on Climate Change. Editors V. MassonDelmotte, P. Zhai, A. Pirani, S. L. Connors, C. Péan, S. Bergeret al. (Cambridge University Press).
Wan, D., Mu, G., Jin, Z., and Lei, J. (2013). The Effects of Oasis on Aeolian Deposition under Different Weather Conditions: a Case Study at the Southern Margin of the Taklimakan Desert. Environ. Earth Sci. 68, 103–114. doi:10.1007/s12665-012-1719-7
Wang, H.-J., and Chen, H.-P. (2016). Understanding the Recent Trend of Haze Pollution in Eastern China: Roles of Climate Change. Atmos. Chem. Phys. 16, 4205–4211. doi:10.5194/acp-16-4205-2016
Wang, H., Jia, X., Li, K., and Li, Y. (2015). Horizontal Wind Erosion Flux and Potential Dust Emission in Arid and Semiarid Regions of China: A Major Source Area for East Asia Dust Storms. Catena 133, 373–384. doi:10.1016/j.catena.2015.06.011
Wang, S., Wang, J., Zhou, Z., and Shang, K. (2005). Regional Characteristics of Three Kinds of Dust Storm Events in China. Atmos. Environ. 39, 509–520. doi:10.1016/j.atmosenv.2004.09.033
Wang, S., Yu, Y., Zhang, X.-X., Lu, H., Zhang, X.-Y., and Xu, Z. (2021). Weakened Dust Activity over China and Mongolia from 2001 to 2020 Associated with Climate Change and Land-Use Management. Environ. Res. Lett. 16, 124056. doi:10.1088/1748-9326/ac3b79
Wang, X., Hua, T., and Che, H. (2020). Temporal Variation of Dust Aerosol Pollution in Northern China. Arab J. Geosci. 13, 108. doi:10.1007/s12517-020-5073-x
Wang, Y., Zhuang, G., Sun, Y., and An, Z. (2006). The Variation of Characteristics and Formation Mechanisms of Aerosols in Dust, Haze, and clear Days in Beijing. Atmos. Environ. 40, 6579–6591. doi:10.1016/j.atmosenv.2006.05.066
Washington, R., Todd, M., Middleton, N. J., and Goudie, A. S. (2003). Dust-Storm Source Areas Determined by the Total Ozone Monitoring Spectrometer and Surface Observations. Ann. Assoc. Am. Geogr. 93 (2), 297–313. doi:10.1111/1467-8306.9302003
Weinan, C., Zuotao, Y., and Zhibao, D. (1995). Vertical Distribution of Grain-Size Parameters of Drifting Particles during Sand Storms in the Taklamakan Desert, Central Asia. Phys. Geogr. 16, 503–523. doi:10.1080/02723646.1995.10642568
Wu, Z., and Huang, N. E. (2009). Ensemble Empirical Mode Decomposition: a Noise-Assisted Data Analysis Method. Adv. Adapt. Data Anal. 01 (1), 1–41. doi:10.1142/S1793536909000047
Wu, Z., Huang, N., Wallace, J., Smoliak, B., and Chen, X. (2011). On the Time–Varying Trend in Global–Mean Surface Temperature. Clim. Dyn. 37 (3), 759–773. doi:10.1007/s00382-011-1128-8
Xin-fa, Q., Yan, Z., and Qi-long, M. (2001). Sand-dust Storms in China: Temporal-Spatial Distribution and Tracks of Source Lands. J. Geogr. Sci. 11, 253–260. doi:10.1007/BF02892308
Xu, L., Mu, G., He, J., Yang, F., Ren, X., Wan, D., et al. (2016). Variability of Dust Mass Concentrations and Deposition Rates under Different Weather Conditions in Cele Oasis, Southern Tarim Basin. Environ. Earth Sci. 75, 639. doi:10.1007/s12665-016-5430-y
Yang, X., Shen, S., Yang, F., He, Q., Ali, M., Huo, W., et al. (2016). Spatial and Temporal Variations of Blowing Dust Events in the Taklimakan Desert. Theor. Appl. Climatol 125, 669–677. doi:10.1007/s00704-015-1537-4
Yang, Y., Russell, L. M., Lou, S., Liao, H., Guo, J., Liu, Y., et al. (2017). Dust-wind Interactions Can Intensify Aerosol Pollution over Eastern China. Nat. Commun. 8, 15333–15338. doi:10.1038/ncomms15333
Yong, M., Shinoda, M., Nandintsetseg, B., Bi, L., Gao, H., and Wang, Y. (2021). Impacts of Land Surface Conditions and Land Use on Dust Events in the Inner Mongolian Grasslands, China. Front. Ecol. Evol. 9, 664900. doi:10.3389/fevo.2021.664900
Yu, H., Yang, Y., Wang, H., Tan, Q., Chin, M., Levy, R. C., et al. (2020). Interannual Variability and Trends of Combustion Aerosol and Dust in Major continental Outflows Revealed by MODIS Retrievals and CAM5 Simulations during 2003-2017. Atmos. Chem. Phys. 20 (1), 139–161. doi:10.5194/acp-20-139-2020
Yuan, W., and Zhang, J. (2006). High Correlations between Asian Dust Events and Biological Productivity in the Western North Pacific. Geophys. Res. Lett. 33 (07), L07603. doi:10.1029/2005GL025174
Yue, S., Pilon, P., Phinney, B., and Cavadias, G. (2002). The Influence of Autocorrelation on the Ability to Detect Trend in Hydrological Series. Hydrol. Process. 16 (9), 1807–1829. doi:10.1002/hyp.1095
Yumimoto, K., and Takemura, T. (2015). Long-term Inverse Modeling of Asian Dust: Interannual Variations of its Emission, Transport, Deposition, and Radiative Forcing. J. Geophys. Res. Atmos. 120 (4), 1582–1607. doi:10.1002/2014JD022390
Zhang, J., Dong, W. J., and Fu, C. B. (2005). Impact of Land Surface Deg-Radation in Northern China and Southern Mongolia on Re-gional Climate. Chin. Sci Bull 50, 75–81. doi:10.1360/04wd0054
Zhang, R., Jing, J., Tao, J., Hsu, S.-C., Wang, G., Cao, J., et al. (2013). Chemical Characterization and Source Apportionment of PM<sub>2.5</sub> in Beijing: Seasonal Perspective. Atmos. Chem. Phys. 13, 7053–7074. doi:10.5194/acp-13-7053-2013
Zhang, X., and Yan, X. (2014). A Novel Method to Improve Temperature Simulations of General Circulation Models Based on Ensemble Empirical Mode Decomposition and its Application to Multi-Model Ensembles. Tellus A: Dynamic Meteorology and Oceanography 66, 24846. doi:10.3402/tellusa.v66.24846
Zhang, X. Y., Gong, S. L., Shen, Z. X., Mei, F. M., Xi, X. X., Liu, L. C., et al. (2003b). Characterization of Soil Dust Aerosol in China and its Transport and Distribution during 2001 ACE-Asia: 1. Network Observations. J. Geophys. Res. 108 (9), a–n. doi:10.1029/2002jd002632
Zhang, X. Y., Gong, S. L., Zhao, T. L., Arimoto, R., Wang, Y. Q., and Zhou, Z. J. (2003a). Sources of Asian Dust and Role of Climate Change versus Desertification in Asian Dust Emission. Geophys. Res. Lett. 30 (24), 2272. doi:10.1029/2003GL018206
Zhao, Y., Li, H., Huang, A., He, Q., Huo, W., and Wang, M. (2013). Relationship between thermal Anomalies in Tibetan Plateau and Summer Dust Storm Frequency over Tarim Basin, China. J. Arid Land 5, 25–31. doi:10.1007/s40333-013-0138-2
Zijiang, Z., and Xiwen, W. (2002). Analysis of the Severe Group Dust Storms in Eastern Part of Northwest China. J. Geogr. Sci. 12 (3), 357–362. doi:10.1007/BF02837557
Keywords: China, sand-dust process, temporal evolution, EEMD, probability distributions
Citation: Duan H, Hou W, Wu H, Feng T and Yan P (2022) Evolution Characteristics of Sand-Dust Weather Processes in China During 1961–2020. Front. Environ. Sci. 10:820452. doi: 10.3389/fenvs.2022.820452
Received: 23 November 2021; Accepted: 21 March 2022;
Published: 13 May 2022.
Edited by:
Rui Mao, Beijing Normal University, ChinaReviewed by:
Yan Yu, Peking University, ChinaCopyright © 2022 Duan, Hou, Wu, Feng and Yan. This is an open-access article distributed under the terms of the Creative Commons Attribution License (CC BY). The use, distribution or reproduction in other forums is permitted, provided the original author(s) and the copyright owner(s) are credited and that the original publication in this journal is cited, in accordance with accepted academic practice. No use, distribution or reproduction is permitted which does not comply with these terms.
*Correspondence: Wei Hou, aG91d2VpMjk4NjE1QGNtYS5jbg==
Disclaimer: All claims expressed in this article are solely those of the authors and do not necessarily represent those of their affiliated organizations, or those of the publisher, the editors and the reviewers. Any product that may be evaluated in this article or claim that may be made by its manufacturer is not guaranteed or endorsed by the publisher.
Research integrity at Frontiers
Learn more about the work of our research integrity team to safeguard the quality of each article we publish.