 Jianrong Bi1,2,3*Zhengpeng Li1,3Dapeng Zuo1,3Fan Yang1,4Bowen Li1,3Junyang Ma1,3Zhongwei Huang1,2,3Qing He4
- 1Key Laboratory for Semi-Arid Climate Change of the Ministry of Education, College of Atmospheric Sciences, Lanzhou University, Lanzhou, China
- 2Collaborative Innovation Center for Western Ecological Safety, Lanzhou University, Lanzhou, China
- 3Gansu Provincial Field Scientific Observation and Research Station of Semi-Arid Climate and Environment, Lanzhou, China
- 4Taklimakan Desert Meteorology Field Experiment Station, Institute of Desert Meteorology, China Meteorological Administration (CMA), Urumqi, China
Dust aerosol vertical profiles are very essential to accurately evaluate their climate forcing and trans-subcontinental transportation to downstream areas. We initiated a joint comprehensive field experiment to investigate the vertical profiles and optical characteristics of dust aerosol in the hinterland of Taklimakan Desert (TD) during summer 2019. After smoothing the raw signals, the CHM15k ceilometer could distinctly detect a moderate intensity of dust layer, cloud layer, and subsequent rainfall process. The results showed that dust events frequently occurred in TD during the entire period; the overall mean PM2.5, PM10, PM2.5/PM10, and Ångström exponent are 110.4 ± 121.0 μg/m3, 317.2 ± 340.0 μg/m3, 0.35 ± 0.07, and 0.28 ± 0.12, respectively, suggesting that dust particles are predominant aerosol types in TD. There was an obvious summertime dust stagnation layer persistently hanged over the desert at 1.5–3.0-km height. A deep and intense daytime convective structure was also detected by the ceilometer, with maximum aerosol mixing layer height of ∼3 km that appeared at 12:00 UTC, which was in favor of lifting the ground-generated dust particles into the upper atmosphere. The normalized range-corrected signal log10(RCS), aerosol extinction σ(z), and backscattering coefficient β(z) of the ceilometer were higher than 6.2, 0.5 km−1, and 0.01 km−1 sr−1 for heavy dust storms, respectively, and the corresponding vertical optical range was smaller than 1.0 km. The aerosol lidar ratio was equal to 50 sr, which was greatly different from those of clear-sky cases. The retrieved σ(z) values were about 2.0, 0.5, 0.14, and 0.10 km−1 at 200-m height, respectively, under strong dust storm, blowing dust, floating dust, and clear-sky conditions. This indicated that the aerosol extinction coefficients under dust events were about 3–10 times greater than those of clear-sky cases. The statistics of the aerosol optical parameters under different dust intensities in TD were very helpful to explore and validate dust aerosols in the application of climate models or satellite remote sensing.
Introduction
Dust aerosol is one of the major aerosol types in the troposphere, which plays a pivotal role in affecting public health, transportation safety, air quality, and climatic effects. In view of climatic impacts, airborne dust particles could modulate the redistribution of radiation energy in the atmosphere by direct scattering and absorption of solar shortwave or terrestrial longwave radiation (i.e., aerosol–radiation interaction, Huang et al., 2014; Che et al., 2019a; Che et al., 2019b; Hu et al., 2020; Li et al., 2021) and acting as effective cloud condensation nuclei. They can indirectly promote or inhibit the precipitation intensity through altering cloud microphysical properties and lifetime (i.e., aerosol–cloud interaction, Twomey, 1977; Huang et al., 2006a; Huang et al., 2006b); thus, they have a far-reaching influence on the energy budget of Earth’s atmosphere system and relevant hydrological cycles (Rosenfeld et al., 2001; Yin and Chen, 2007; Li et al., 2016; Jin Q. et al., 2021) as well as accelerate snow melting by changing the surface albedo of snow and ice sheets (i.e., snow/ice albedo mechanism, Huang et al., 2011; Wang et al., 2013; Qian et al., 2014). Furthermore, dust aerosols usually carry rich nutrients and organic matters deposited on Earth’s surface and affect the biomass productivity of the Pacific Ocean and the atmosphere–ocean carbon exchange, hence exerting a crucial role in global biogeochemical cycle (Jickells et al., 2005; Maher et al., 2010; Shao et al., 2011).
The Taklimakan Desert (TD) in northwest China is an important dust source region of East Asia and frequently produces a lot of tiny soil particles every spring that are uplifted and injected into the upper atmosphere by strong surface winds and cold frontal cyclones (Ge et al., 2014; Huang et al., 2014; Chen et al., 2017a; Chen et al., 2017b; Hu et al., 2019a). These elevated dust aerosols can travel eastward over long distances on a subcontinental scale, even across the Pacific Ocean, and arrive at the west coast of North America within about 1 week via prevalent westerlies (Husar et al., 2001; Uno et al., 2009; Uno et al., 2011; Hu et al., 2019b). They then exert a profound effect on the ecological environment and climate change both regionally and globally. To date, there has been a great deal of intensive field campaigns (e.g., ACE-Asia, ADEC, PACDEX) and ground-based aerosol monitoring networks (e.g., ADNET, AERONET, CARSNET) for investigating Asian dust aerosols (Holben et al., 1998; Huebert et al., 2003; Shimizu et al., 2004; Mikami et al., 2006; Huang et al., 2008; Che et al., 2015; Che et al., 2019a; Che et al., 2019b), which are invaluable for comprehensively understanding the climatic impacts of mineral dust in East Asia. Earlier studies (Liao and Seinfeld, 1998; Huang et al., 2009; Hu et al., 2020) have demonstrated that the shortwave and longwave radiative heating rates of dust aerosols play an important role in influencing the thermal and dynamic structures of the atmosphere layer, which are significantly dependent on their optical properties and vertical profiles. The Intergovernmental Panel on Climate Change (IPCC Climate Change, 2013) indicated that the magnitude and sign of positive or negative radiative forcing of dust aerosol still remain a very big uncertainty due to lack of accurate information on their total loading, optical characteristics, and spatial and temporal distributions.
Kai et al. (2008) successfully observed the dust layer structure over the northern edge of TD during a heavy dust storm in April 2002 by using a depolarization lidar and showed that there was a dense dust layer that appeared at 5.5-km height with a depolarization ratio of 0.15–0.25. Huang et al. (2010) detected dust aerosol vertical profiles and their long-range transport with three micro-pulse lidar systems and implied that the height of the dust layer was primarily concentrated 2 to 3 km in northwest China during spring in 2008. Bi et al. (2017) indicated that a thick dust layer generally appeared below 4-km height with a depolarization ratio of 0.20–0.30 at Dunhuang, nearby the downstream of TD, during spring in 2012. The aforementioned publications mostly focused on the dust optical properties in spring but little on the dust vertical structures in summer. Jin L. et al. (2021) and Mu et al. (2021) found that, compared with spring, dust events also frequently occurred in TD during the summer season. Chen et al. (2017a) showed that the summer dust long-range transport in TD had a comparable contribution to East Asia as that in spring. Based on the Cloud–Aerosol Lidar and Infrared Pathfinder Satellite Observations (CALIPSO), Huang et al. (2007) revealed that summertime Taklimakan dust plumes transported southward and appeared over the Tibetan Plateau (about 4–7 km in altitude). Yumimoto et al. (2010) combined the ground-based lidars, CALIPSO, and numerical models and confirmed that summertime Taklimakan dust traveled eastward at 6–8 km in altitude and swept across the Pacific Ocean in mid-August 2009. Therefore, a comprehensive knowledge of summertime dust vertical profiles and uplifted height in Taklimakan Desert is vital to investigate their trans-subcontinental transport and climatic effects on a regional scale.
To elucidate the interactions among dust aerosol, cloud, and radiation budget and relevant climate influences over Taklimakan Desert, the Semi-Arid Climate and Environment Observatory of Lanzhou University (SACOL) and Institute of Desert Meteorology, China Meteorological Administration (CMA) jointly carried out an intensive field campaign in Tarim Basin during the summer of 2019. We deployed a set of state-of-the-art instruments at Tazhong site, which is located in the center of TD. The main instruments include the CHM15k ceilometer, sun/sky radiometer, an 80-m gradient meteorological tower, eddy covariance system, particulate mass monitor, and surface radiation fluxes (Bi et al., 2022). This study mainly explores the vertical profiles and optical properties of dust aerosol over TD during summer in 2019. The structure of this paper is organized as follows: Section 2 introduces the data, instrument information, and retrieval methods to solve the Mie scattering lidar equation. Section 3 presents the results and discussion, and the conclusion is given in Section 4.
Data and Methods
Site Information
Taklimakan Desert is the second largest shifting sand-dune desert in the world, which covers a total area of 3.376 × 10⁵ km2, with an east–west length of 1,000 km and a south–north width of 400 km. It is encompassed by huge mountains, with Tianshan Mountain to the north, Pamir Plateau to the west, Kunlun Mountains to the south, and over Lake Lop Nur and Kumtag Desert to the east (Pan et al., 2020; Bi et al., 2022). Tazhong station [38.968° N, 83.659° E, 1,100 m above mean sea level (MSL)] is situated in the hinterland of TD, and its climate pattern belongs to warm temperate continental desert climate, which gets abundant sunshine, sparse desert vegetation, and a significant diurnal temperature difference. Because of its unique topography and environmental features, the climate here is characterized by extreme drought, scarce precipitation (∼38 mm), intense evaporation (∼2,500–3,400 mm), frequent dust storms, and a deep boundary layer structure during daytime (Wang et al., 2016; Pan et al., 2020; Yang et al., 2021).
Dust Aerosol Measurements
The CHM15k ceilometer (Lufft, Germany) is an unattended and single-wavelength elastic lidar for continuously detecting the vertical profiles of aerosol and cloud. The ceilometer emits a solid-state laser pulse at 1,064-nm wavelength (Nd:YAG, class M1 laser) with a narrow line width of 0.38 nm, which facilitates excellent background light suppression (Heese et al., 2010). The laser has a nominal pulse energy of 8.0 μJ and a repetition frequency of 6,500 Hz, with separated-lens telescopes of 100-mm diameter for the transmitter and the receiver. The beam divergence angle and field of view are 0.33 and 0.45 mrad, respectively. An avalanche photo diode in photon counting mode is used to receive the attenuated backscattering signals from aerosol particles or cloud droplets with a 5-m vertical resolution and a 15-s temporal resolution. A fan and a heater are installed inside the device to automatically remove impurities and dewdrops from the window in real time .
A sun/sky radiometer (model CE-318, Cimel, France) is designed to automatically observe the direct solar irradiances and diffuse sky radiances at a wavelength range of 340–1,020 nm, with 1.2° full field-of-view every 15 min. These datasets are capable of retrieving the aerosol optical depth (AOD), Ångström exponent (AE), water vapor content (WVC), volume size distribution (dV/dlnR), and single scattering albedo (SSA). The inversion accuracies of AOD, dV/dlnR, and SSA are expected to be 0.01–0.02, 15–35%, and 0.03–0.05, respectively, for a newly calibrated field instrument (Holben et al., 1998; Che et al., 2015; Che et al., 2019a; Che et al., 2019b).
The CALIPSO is a polar-orbiting satellite that provides height-resolved profiles of aerosols and clouds on a global scale (Winker et al., 2007; Winker et al., 2009). It can measure the total attenuated backscattering signals at 532 and 1,064 nm, depolarization ratio at 532 nm, and attenuated color ratio with vertical resolution of 30 m below 8.2 km, which is commonly utilized to probe the three-dimensional distribution and transport of aerosol species both regionally and globally (Huang et al., 2008; Liu et al., 2008). In this study, we make use of level 1B products and vertical feature mask products, including the feature classification of cloud and aerosol types (Liu et al., 2009), to intercompare the vertical structures of dust aerosol and cloud detected by the ground-based ceilometer.
Other Ground-Based Measurements
Data on the hourly mean mass concentrations of particulate matters (e.g., PM2.5 and PM10, in µg/m3) are acquired from Chinese Environmental Protection Bureau (CEPB, www.chinaairdaily.com), which are based on electron absorption (Andersen Instruments and Wedding and Associates Beta Attenuation Monitors-BAM) or inertial mass weighing principal (R&P Tapered Element Oscillating Microbalance-TEOM) (U.S. EPA, 1991).
An 80-m gradient meteorological tower can continuously collect multiple meteorological variables at seven layers of different heights, for instance, air temperature (°C) and relative humidity (%; HMP155A, Vaisala, Finland), wind speed (ms−1) and wind direction (°; WindSonic Gill 2, England), ambient pressure (hPa; CS100, Setra, United States), precipitation (mm; 52203, YOUNG, United States), and sensible heat and latent heat fluxes (W m−2; CPEC310, Campbell, United States). All datasets are automatically sampled and stored in a Campbell data logger with 1- and 30-min time intervals (Yang et al., 2021). At the same time, the experimenters manually recorded the total cloud amount, cloud types, visibility, and weather conditions every 1 h during daytime, which can assist in identifying key weather processes, such as dust storm, rainy, cloudy, or clear-sky days.
Methods
The classical elastic Mie scattering lidar equation can be expressed as, follows:
where z is the distance between scattered particles, ceilometer lidar P(z) is the energy of backscatter signal at altitude z, X(z) is normalized range-corrected backscatter signal, C is the calibration constant of lidar, E is laser-emitted pulse energy, β(z) is backscattering coefficient (β) at z, and σ(z) is extinction coefficient at z.
Aerosols and air molecules are two main contributors for the total extinction σ(z) and backscattering β(z); hence, X(z) is also expressed as follows:
where the subscripts a and m represent aerosol and air molecule (Rayleigh), respectively. It is difficult to solve the backscatter lidar equation because there are two unknown variables in one equation: β(z) and σ(z). Fernald method (Fernald, 1984) is generally utilized to acquire an analytical solution of the lidar equation which defines a lidar ratio as the ratio of extinction to backscattering coefficient.
The lidar ratio of air molecule (Sm) can be determined by the standard atmospheric profile which has a constant value of 8π/3. The aerosol lidar ratio (Sa) might vary from 10 to 150 sr, which is primarily dependent on the aerosol species, chemical composition, size distribution, and refractive index of aerosol particles as well as on the wavelength of the incident light (Ackermann, 1998). Figure 1 presents a sensitivity study of different lidar ratio values (Sa = 30, 50, and 70 sr) influencing the inversion of aerosol extinction coefficient profiles at 20:00 UTC on September 27, 2019 at Tazhong. That time is a clear-sky condition with low aerosol concentrations, representing typical background levels in TD. We designate Sa the value of 30 under clear-sky condition as a reference. It is evident that there are relatively small influences for different Sa values on the retrievals of σ(z) below 500-m height, which is mainly due to the low aerosol concentrations at 500-m height range. However, those influences gradually increase with height from 500 m to 4 km and are closely linked to the aerosol concentrations—for instance, the retrieved σ(z) values at 1.1 km are 0.075, 0.097, and 0.115 km−1, respectively, for Sa of 30, 50, and 70 sr, which suggests that different Sa values (50 and 70 sr) would lead to the extinction coefficients of inversion being about 29.3 and 53.3% higher than that for the reference value (Sa = 30 sr). The corresponding σ(z) values at 2.8 km are 0.058, 0.082, and 0.108 km−1, respectively, for Sa of 30, 50, and 70 sr, resulting in errors of approximately 41.4 and 86.2%. Therefore, the calculation errors of aerosol extinction coefficient profiles strongly rely on the accuracy of the Sa value.
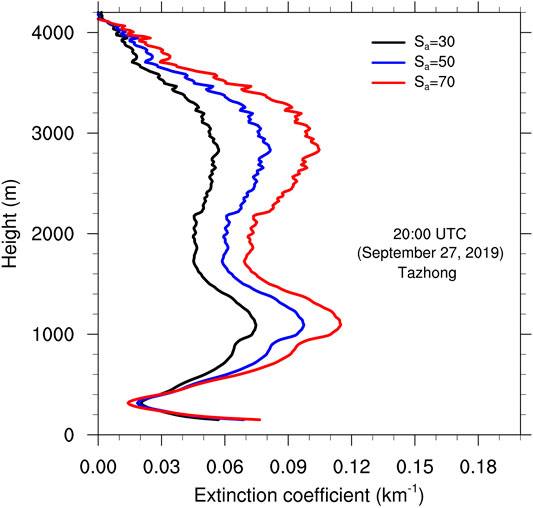
FIGURE 1. Sensitivity study of different lidar ratio values’ (Sa) influence on the inversion of aerosol extinction coefficient (km−1) profiles at 20:00 UTC on September 27, 2019 at Tazhong.
The volumetric aerosol lidar ratio can be effectively determined by the combination of an elastic backscatter lidar and a collocated sun/sky radiometer measurement (Huang et al., 2010). This method is mainly dependent on sky radiometer-derived high-precision AOD (∼0.01–0.02) during daytime as a constraint for the inversion of ceilometer signals. The AOD is obtained by the integral of σ(z) at atmospheric column. However, there are two major problems for the application of this method to the ceilometer. Firstly, the sun/sky radiometer only measured clear-sky AOD values during daytime, when the ceilometer signals are greatly affected by strong background light. Secondly, the lidar ratio estimated by ceilometer inversion is based on columnar AOD, which is largely influenced by the incomplete overlap height (∼150 m) of the ceilometer. This problem is especially serious for the cases wherein most of the aerosol particles are concentrated in the lower atmospheric layer (Wiegner and Geiß, 2012), for instance, in desert areas with frequent emissions of high concentrations of dust particle from near-surface. Fortunately, Liu et al. (2002) directly observed the Sa values of Asian dust by using a high-spectral-resolution lidar (HSRL) and Raman elastic-backscatter lidar and indicated that the measured Sa values ranged from 42 to 55 sr, with a total mean of 51 sr. Murayama et al. (2004) showed that the Sa of lofted Asian dust varied from 43 to 49 sr at 355 and 532 nm with a dual-wavelength Raman lidar. Tesche et al. (2009) implied that the average Sa values of African dust are in the range of 53–55 sr at 355, 532, and 1,064 nm during SAMUM 2006 by using ground-based Raman lidar and an airborne HSRL. Consequently, in this study, we designate Sa = 50 sr for dust aerosols and Sa = 30 sr for clear-sky conditions to retrieve the vertical profiles of backscattering and extinction coefficients.
Results and Discussion
Optical Characteristics of Dust Aerosols
Figure 2 depicts the time series of hourly average mass concentrations of PM2.5 and PM10 and the ratios of PM2.5/PM10 sampled at Hotan Environmental Protection Bureau from July 1 to September 30, 2019. Hotan (37.087° N, 79.927° E, 1,380 m above MSL) is about 300 km southwest of Tazhong, which is the closest environmental monitoring station to the center of TD. The results indicate that the hourly mean PM concentrations display dramatic day-to-day variations during the entire period. In about 90% of the total number days, the PM2.5 and PM10 concentrations are greater than 100 and 250 μg/m3, with maxima of 977 and 2,758 μg/m3 (which occurred in July 26), respectively, which are 27 times and 36 times higher than the values set by the World Health Organization Air Quality Guidelines of 35 μg/m3 for PM2.5 and 75 μg/m3 for PM10 (World Health Organization, 2005). The background levels of PM2.5 and PM10 concentrations can also remain at 50 and 130 μg/m3, respectively, under clear-sky conditions (September 20–30, 2019). Frequent dust events lead to significant variations of surface PM concentrations, for example, in July 15 and 26, August 13 and 17, and September 3 and 6. The ratio of PM2.5 to PM10 is a key indicator for distinguishing the relative contributions of fine-mode and coarse-mode particles. The corresponding ratios are all smaller than 0.50, implying that the coarse-mode particles are dominant in the surface particulate matters over TD. The overall hourly mean PM2.5, PM10, and PM2.5/PM10 are 110.4 ± 121.0 μg/m3, 317.2 ± 340.0 μg/m3, and 0.35 ± 0.07, respectively, during the whole period. Meanwhile, high levels of surface particulate matter concentrations persist for a long duration and cover a large spatial distribution over TD throughout the summer of 2019, which ultimately have adverse effects on human health, air quality, and traffic safety.
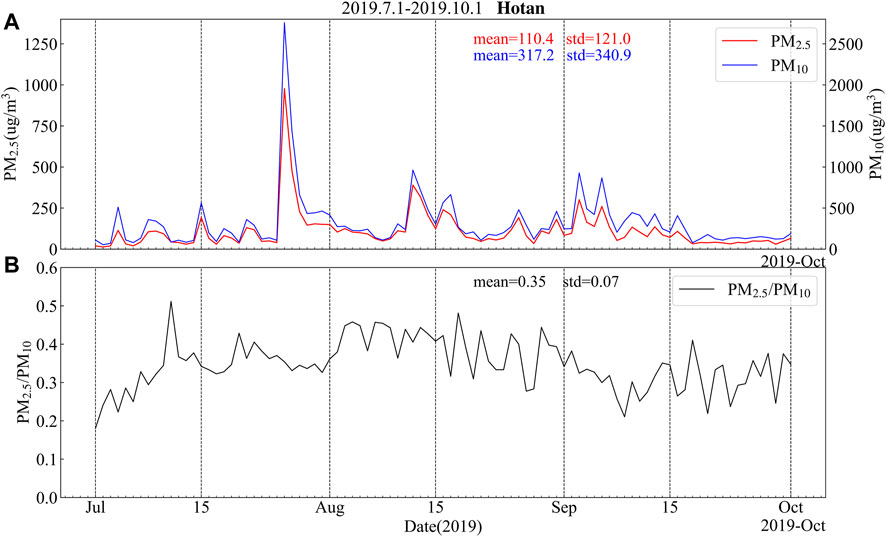
FIGURE 2. Time series of hourly mean mass concentrations of particulate matter (PM) at Hotan from July 1 to September 30, 2019. (A) PM2.5 (μg/m3) vs. PM10 (μg/m3). (B) Ratios of PM2.5/PM10. The corresponding total mean values and standard deviation are shown in the figures.
Figure 3 illustrates the time evolutions of AOD, AE, and WVC (in cm) derived from the sun/sky radiometer at Tazhong from July 2 to August 1, 2019. The Ångström exponent is generally used to reflect the size of aerosol particles, that is, small AE values (<0.60) indicate that coarse-mode particles are dominant, whereas large AE values (>1.0) represent the dominance of fine-mode particles. It is obvious that the aerosol optical properties at Tazhong also show remarkable diurnal variations, with the total averages of AOD500, AE440-870, and WVC at 0.73 ± 0.50, 0.28 ± 0.12, and 1.43 ± 0.36 cm, respectively. The AOD500 values vary from 0.20 to 3.0, and the AE440–870 values range from 0.03 to 0.64, which further confirms that dust particles in the columnar atmosphere are the predominant aerosol types in the hinterland of TD, with little impacts by human activities. All AOD500 values are greater than 1.0, and the corresponding AE440–870 values remain between 0.03 and 0.30 under several heavy dust events from September 26 to 30, 2019. In fact, Che et al. (2013) analyzed the multi-year (2004–2008) aerosol optical features and have also verified that coarse-mode dust aerosols are dominant in Tazhong. Thereby, it is reasonable that we specified a lidar ratio of 50 for dust aerosol to retrieve the dust extinction coefficient profiles.
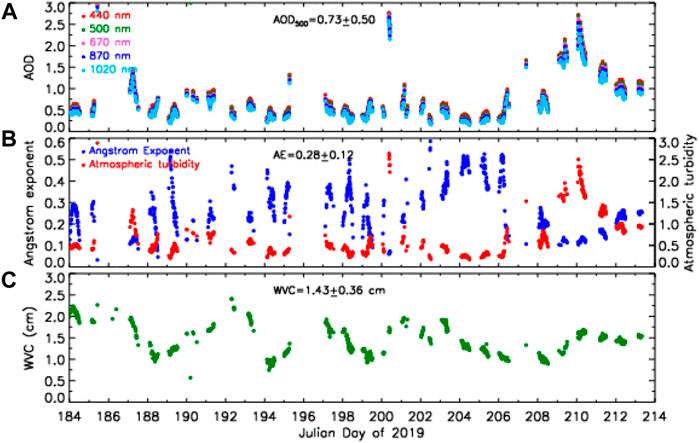
FIGURE 3. Time evolutions of aerosol optical properties retrieved by Cimel sun/sky radiometer at Tazhong from July 2 to August 1, 2019. (A) Aerosol optical depth. (B) Ångström exponent vs. atmospheric turbidity. (C) Water vapor content in centimeters. The corresponding overall mean values and standard deviation are shown in the figures.
Dust Aerosol Vertical Profiles
Figure 4 delineates the vertical profiles of dust aerosols and cloud layers at Tazhong on September 10, 2019 as measured by CALIPSO and the CHM15k ceilometer. The passing time of CALIPSO over Tazhong station is at 20:40 UTC, marked with a black dashed line in Figure 4C. The results suggest that both the ground-based ceilometer and the spaceborne CALIPSO can clearly detect the cloud layers (purple and light blue in Figure 4A) at 3–6 km and dust layers (yellow in Figure 4B) at 1–3 km height. Figure 4C shows the normalized range-corrected signal in logarithmic scale [log10(RCS)] as observed from the ceilometer. We can see that the log10(RCS) signals are weak below 1-km height during 00:00–04:00 UTC, and there is a lightly intense dust layer hanging at an altitude of 1–2.5 km, which is thought to be the transported dust aerosols from the surrounding areas. A moderately intense dust event begins to make an outbreak at 04:00 UTC, and locally generated dust particles are gradually lofted from the surface to the upper free atmosphere (∼2.5 km), accompanied by northwestward surface wind speeds of up to 6.0–8.0 m/s. Then, the dust storm reaches its strongest peak at 09:39 UTC, and the corresponding log10(RCS) signals at 200-m height are greater than 7.0, when the maximum wind speed was exceeding 17.0 m/s. Meanwhile, the log10(RCS) signals above 1-km height are slightly weak, which is primarily attributed to the high concentrations of dust particles causing an intense attenuation of weak laser energy of the ceilometer. There are two evident layers at 15:00 UTC; in other words, a dust aerosol layer occurs at 0–1.5-km height and a cloud layer appears at 3.5–5.0-km height. It is very interesting that the dust aerosols are gradually uplifted again at 16:00 UTC and reached an altitude of 3 km at 20:00 UTC; then, they are mixed evenly with clouds, which was effectively detected by both the ceilometer and CALIPSO. High-altitude clouds and water vapor carried by westerly cold front cyclones interplay with elevated dust particles via a series of complex cloud microphysical processes. Finally, a rainfall event appears at 23:30 UTC, and it shows that the log10(RCS) signals of the ceilometer exhibit a very strong vertical profile from the ground to 3-km height, which is mainly owing to the scattering of emitted laser energy by the falling raindrops. The occurrence of a rainfall episode is also demonstrated by the simultaneous datasets of rain gauge and hourly manual records. The whole dust storm event lasted for nearly 20 h, and it would undoubtedly exert a profound impact on the energy budget and precipitation distribution over the TD region. Similar interactions among dust aerosols, cloud layers, and precipitations have taken place approximately 10 times during the entire experiment period. This is very vital to uncover the feedback mechanism of the dust–cloud–precipitation process in Taklimakan Desert, which is worthy of further investigation in the future.
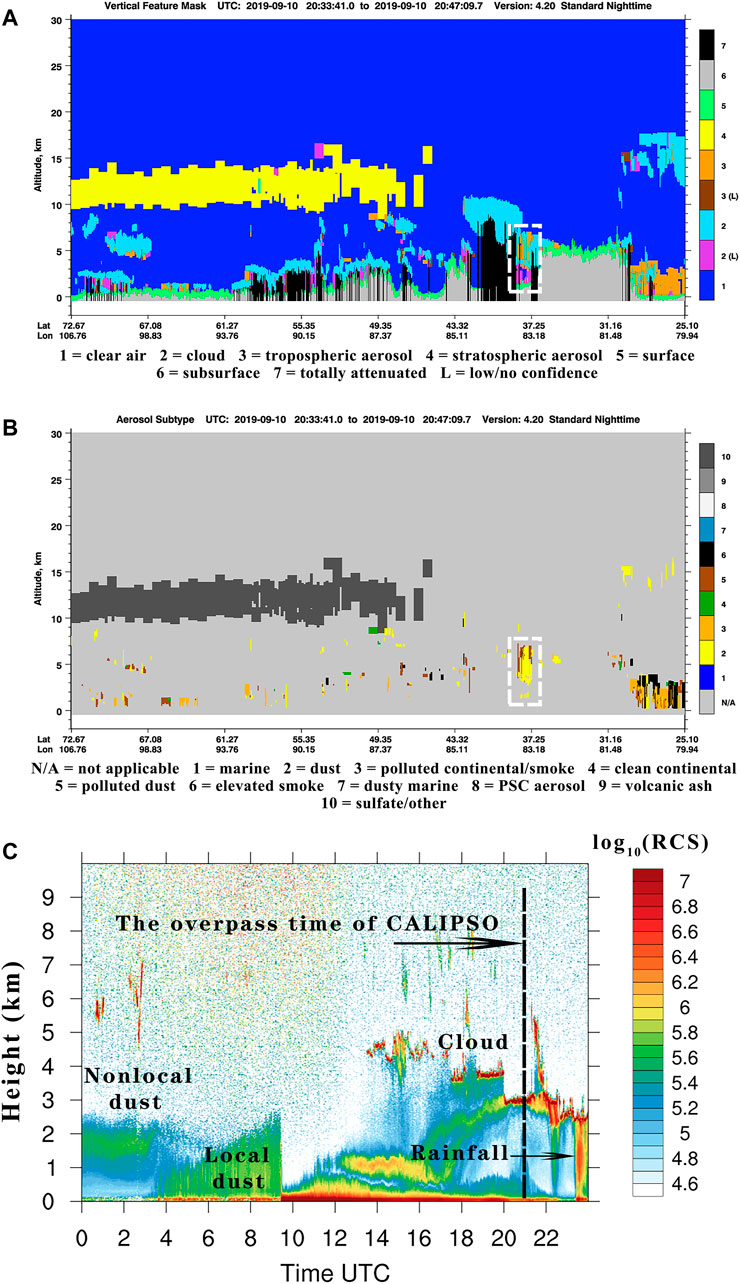
FIGURE 4. Vertical profiles of dust aerosols and cloud layers on September 10, 2019 at Tazhong. (A) Purple and light blue in white dashed rectangle show the cloud layers detected by CALIPSO Vertical Feature Mask products. (B) Yellow in white dashed rectangle shows the dust aerosol detected by CALIPSO. (C) Normalized range-corrected signal in logarithmic scale observed from the ceilometer. The black dashed line denotes the passing time of CALIPSO over Tazhong station. Height is above-the-ground level in kilometers.
As mentioned above, we collect the raw backscattering signals of the ceilometer at 5-m vertical resolution and 15-s temporal resolution. Because the emitted laser pulse energy is low (∼8.0 μJ), the signal-to-noise ratio (SNR) of the ceilometer is larger than 1 at 8.5-km height during nighttime. Nevertheless, influenced by strong background sunlight, the corresponding SNR value is about 1 at up to 4 to 5 km during daytime, depending on the aerosol loading (Heese et al., 2010). Figure 5A characterizes the raw backscattering signals of the ceilometer [log10(RCS)] at 01:30 UTC on August 14, 2019. The SNR is approximately equal to 1 at 2-km height but decreases seriously with height at above 2 km. There is a distinct aerosol layer at about 1.5 km and an evident cloud layer at 5.8 km in our case. However, due to the low SNR values, the backscattering signals of aerosols and clouds are relatively not obvious in Figure 5A. The vertical distributions of cloud layers at 5–6.5 km are also not apparent (see Figure 5C). Smoothing the raw signal can effectively suppress the noise, and aerosol or cloud layers could be clearly detected, as shown in Figures 5B, D. In the smoothing method, we recalculate the raw backscattering signals at 15-m vertical resolution and 30-min time interval. After smoothing, the SNR values of the ceilometer have been greatly improved, and the SNR is higher than 1 at 8-km height so that aerosol layers or cloud layers in the upper troposphere would be detected by the CHM15k ceilometer. Therefore, subsequently, the log10(RCS) signals and retrieved backscattering and extinction coefficients from the ceilometer are processed by a smoothing algorithm, except for special declarations.
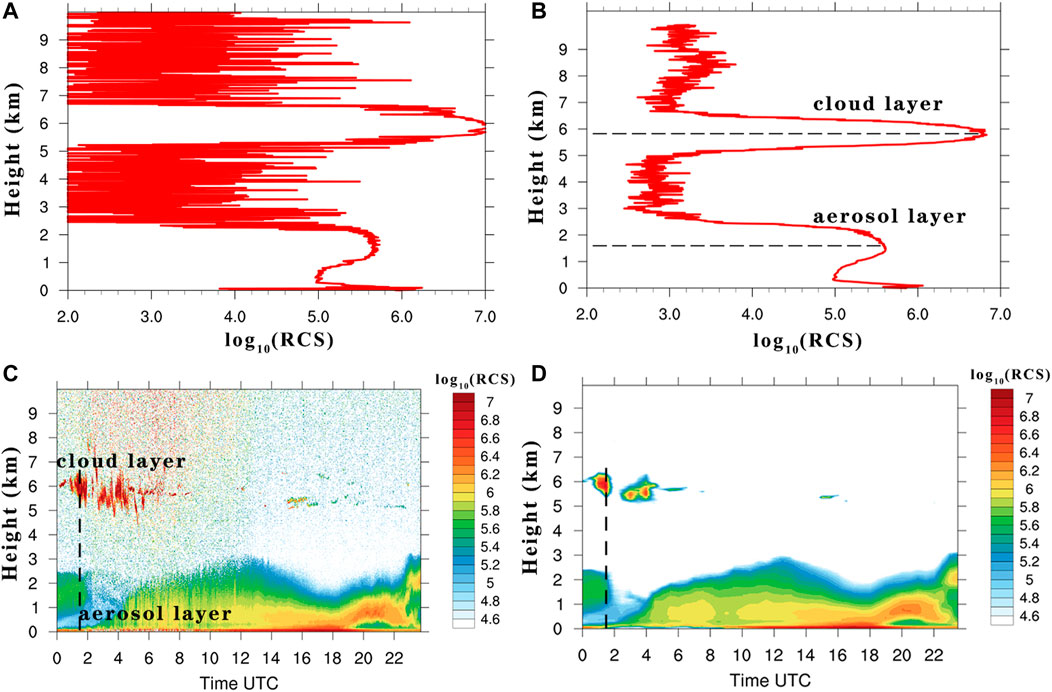
FIGURE 5. Normalized range-corrected signal in logarithmic scale [log10(RCS)] of the ceilometer at 01:30 UTC on August 14, 2019. (A) Raw signals with 5-m vertical resolution and 15-s interval. (B) Smoothed signals with 15-m vertical resolution and 30-min time interval. Time evolutions of log10(RCS) of the ceilometer on August 14, 2019. (C) Raw signals. (D) Smoothed signals. The black dashed line denotes the corresponding time of log10(RCS) in Figures 4A, B. There is a distinct dust aerosol layer from the surface to 2 km in height, and a visible cloud layer appears at a height of 5–6.5 km.
Figure 6 shows the diurnal variation of log10(RCS) of the ceilometer and the vertical profiles of aerosol extinction coefficient σ(z) during a typical blowing dust event on July 26, 2019. Dust aerosols are confined in the atmospheric boundary layer of 0–1-km height at 00:00–06:00 UTC, with the strongest signal peak located at about 200–300 m. As discussed above, the peak of log10(RCS) signals corresponds to the maxima of PM10 concentration and AOD500 of 2,758 μg/m3 and 3.0, respectively, as well as with AE440–870 of 0.03. Driven by strong surface winds (∼10 m/s) and the intense sensible flux heating in the afternoon, dust particles are gradually lifted upward from 06:00 UTC and dispersed over time. The dust vertical structures show an obvious stratification, and the log10(RCS) signal is the strongest near the ground surface and clearly drops with the increase of height. Figure 6B displays the vertical profiles of the aerosol extinction coefficient at various hours, and the Rayleigh extinction coefficient of air molecule is illustrated with a black line. There are no effective inversion results of σ(z) at 0–150 m, which is the height of the incomplete overlap factor of the ceilometer. It is clear that the maximum dust σ(z) value at 04:00 UTC exceeds 2.0 km−1 on 300 m and almost linearly decreases with height, close to 0 km−1 at 1.0-km height. This majorly indicates that a great deal of high-concentration dust aerosols near the surface has strong attenuation effects on laser pulse energy, which directly leads to very weak backscattering signals in the upper atmosphere. The σ(z) profile presents two distinct layers at 10:00 UTC along with the uplifted and diffused dust particles—that is, the σ(z) value is about 0.6 km−1 at 200 m and stays around 0.4 km−1 at 300 m, then decreases with height from 0.30 to 1.8 km, and is equal to 0 km−1 at 1.8 km. The extinction coefficient σ(z) at 19:00 UTC also shows prominent vertical variations, and there are three obvious dust layers. The σ(z) value is about 0.3 km−1 at 300 m but increases with height from 300 m to 1.3 km [σ(z) ∼0.65 km−1] and then slightly decreases with height from 1.3 to 3.0 km and is about 0.2 km−1 at 3.0 km.
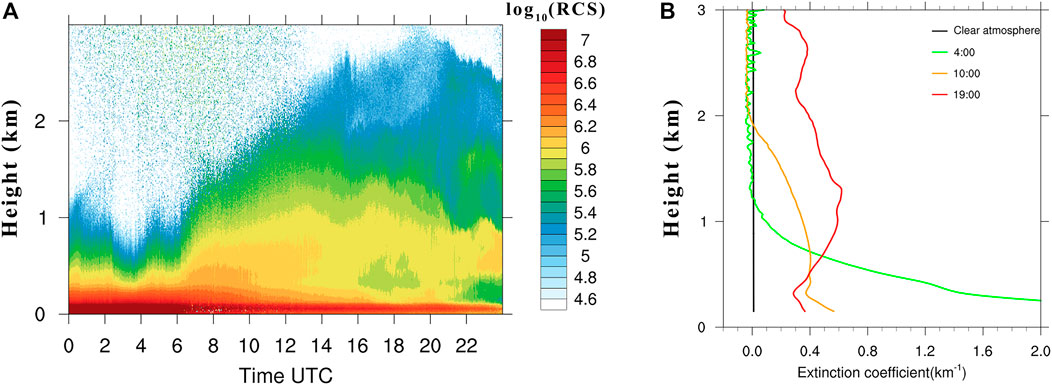
FIGURE 6. (A) Diurnal variation of log10(RCS) of the ceilometer on July 26, 2019. (B) Vertical profiles of aerosol extinction coefficient (km−1) at various hours on July 26, 2019. A distinct dust aerosol layer is lofted from 06:00 UTC. The black line illustrates the Rayleigh extinction coefficient of air molecules.
Figure 7 describes the time series of dust vertical profiles in August and September 2019 at Tazhong. It is evident that dust events frequently occur in the hinterland of TD during summer in 2019, and the occurrence frequencies and intensities of dust storms in August are significantly higher than those in September. The backscattering signals of the ceilometer are greatly intense from August10 to 21, implying that heavy dust events persistently make an outbreak during this period, with a maximum uplifted height of 4 km. Moderate dust events are still active from September 1 to 18, but there are 12 consecutive clear-sky days from September 19 to 30. The log10(RCS) signals of the ceilometer under clear-sky conditions are relatively weak, with all values less than 5.2, which is well representative of the background levels of dust aerosols in TD. Generally, the number of dusty days accounts for about 77% of the whole period, and most of the uplifted heights of dust layers are less than 3 km, although on occasional events these could reach up to 4 km. These elevated dust particles would heat up the atmospheric layer and alter the thermal structure of the atmosphere at daytime through absorption of solar radiation. On the other hand, the airborne dust aerosols could also prevent the surface longwave radiation emitted into outer space and play a vital role in heat preservation at nighttime. Whether the summertime dust aerosols can be transported downstream for a long distance is mainly dependent on the uplifted height (4 to 5 km) and the intensity of mid-latitude westerlies (Yumimoto et al., 2010; Chen et al., 2017b). Figure 7 also indicates that an obvious dust stagnation layer persistently hovers over the TD at 1.5–3.0-km height during summer in 2019. Affected by the surrounding huge mountains and the Mongolian cold frontal cyclone, the summertime high-altitude dust stagnation layer is not easily transported outside the Tarim Basin. After hanging over the desert for several days, most of the elevated dust particles are re-deposited in TD and nearby downstream arid regions through gravitational dry settlement or wet removal process. As a result, the transported contribution of the summertime Taklimakan dust to East Asian dust loading is relatively small.
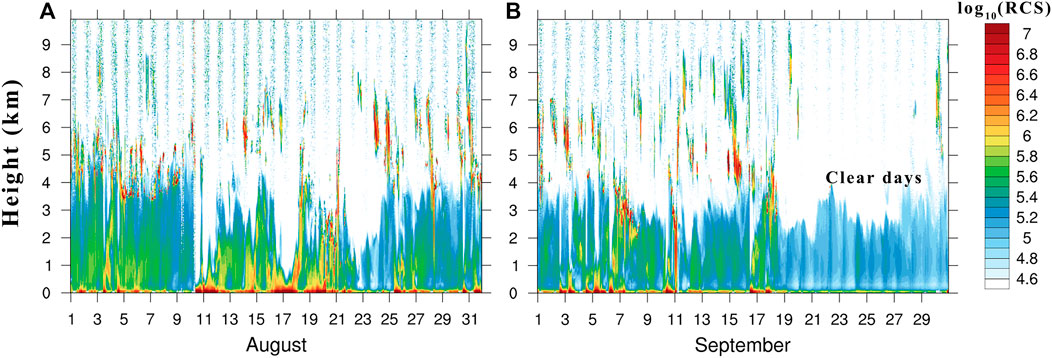
FIGURE 7. Time series of 30-min averaged log10(RCS) of the ceilometer after smoothing signals at Tazhong. (A) August. (B) September. There are 12 consecutive clear-sky days since September 19, 2019.
Aerosol Mixing Layer Height
The height of the atmospheric boundary layer (ABLH) is a key quantity to reflect the complex physical processes of turbulent mixing and convective development and could directly affect the vertical exchanges of water vapor, matters, momentum, and energy between the land surface and the upper atmosphere. The potential temperature gradient method is commonly used to calculate the ABLH based on radiosonde profile measurements, which is defined as the height at which the air temperature gradient is obviously discontinuous or the diurnal variation of temperature is close to disappearing (Holzworth, 1964; Liu and Liang, 2010; Dai et al., 2014). It is well known that the concentrations of water vapor or aerosols are high in the ABL, whereas they rapidly decrease in the free atmosphere. Thus, we can define the aerosol mixing layer height (AMLH) as the height at which the humidity or aerosol concentration gradient is evidently discontinuous. The AMLH primarily represents the vertical distributions of airborne particles in the lower atmosphere, which is slightly different from the traditional ABLH. Because the backscattering signal profile X(z) = P(z)z2 can well reflect the vertical distribution of aerosol concentrations, the gradient method or wavelet covariance transform method is usually utilized to retrieve the AMLH based on the backscattering signals. In the gradient method, the AMLH is defined as the height at which X(z) significantly decreases with z, namely, the height corresponding to the minimum of
Figures 8A, B outline the time evolutions of 30-min averaged log10(RCS) of the ceilometer under clear-sky and floating dusty conditions at Tazhong. The AMLH marked with black dots is superposed on the figures. It is apparent in Figures 8A, B that the AMLH exhibits a large fluctuating diurnal variation. Here we make use of a three standard deviation (3σ) criteria to inspect if any measurements fall within the 3σ range of the mean of AMLH for a certain whole day [i.e., mean (AMLH) ± 3σ]. In other words, any point that exceeds the mean by 3σ would be regarded as highly improbable and eliminated. The clear-sky days in Figures 8A,C are from September 19 to 30, 2019, and the floating dusty days in Figures 8B, D are from September 12 to 15, 2019. The results show that AMLHs present significant structural characteristics under two weather conditions, which is highly consistent with the change of log10(RCS) signals. The maximum values of AMLH are almost concentrated on 2–3.5 km, which is the height of the aforementioned dust stagnation layer. The AMLHs exhibit prominent diurnal variations, namely, they are usually a low stable layer in the morning (∼1.4–1.8 km) and at nighttime and are a high convective layer in the afternoon (∼2.0–2.8 km). The standard deviation generally decreases with the increase of AMLH. The diel variations of AMLHs under floating dusty conditions are more significant than those of clear-sky cases, which are possibly attributed to the relatively weak backscattering signals of the ceilometer caused by the low aerosol concentrations under clear-sky conditions. There is a deep daytime AMLH (∼3 km) convective structure and an obvious dust stagnation layer over the hinterland of TD during the whole period. The average maximum AMLHs under the two cases are about 2.5 and 2.8 km that appeared at 12:00 UTC, respectively, which is greatly consistent with the PBL height (3 to 4 km) measured from the radiosonde data (Zhang et al., 2011; Wang et al., 2016). The summertime AMLHs in Taklimakan Desert are remarkably larger than those in humid (∼800 m–1.5 km) or sub-humid (∼1.0–2.0 km) regions (Davis et al., 2000; Liu and Liang, 2010; Sawyer and Li, 2013; Kotthaus and Grimmond, 2018). Such a deep and intense AMLH convective structure is conducive to vertically uplift the dust particles generated from the desert surface into the upper atmosphere during summer and then exerts a far-reaching impact on the ecological environment and climate change.
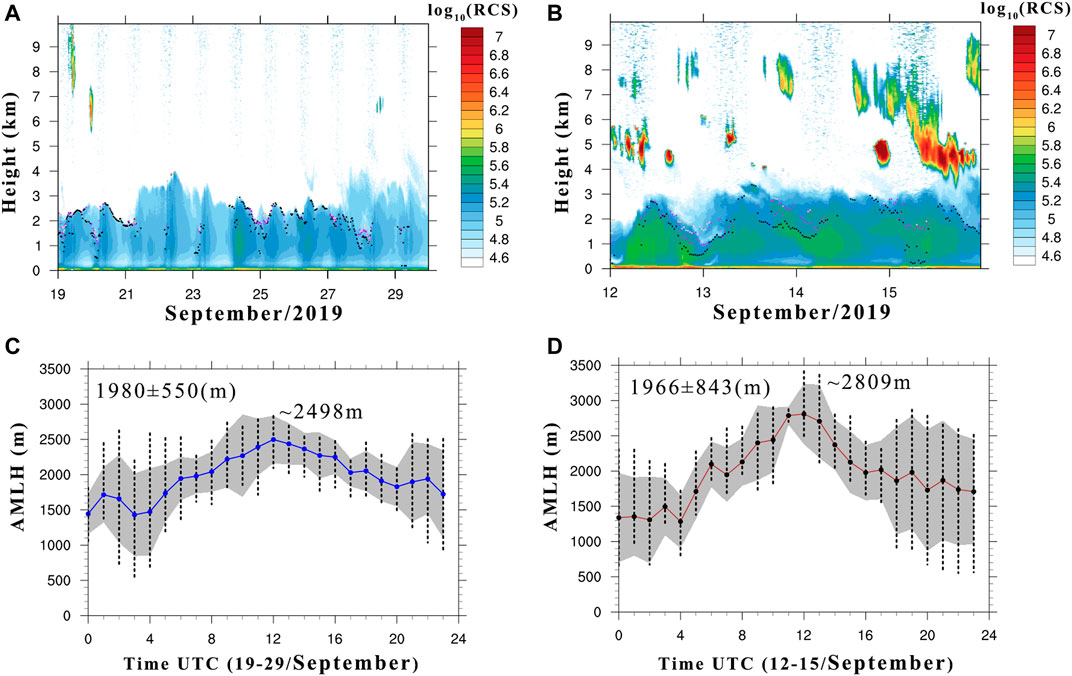
FIGURE 8. Time evolutions of 30-min averaged log10(RCS) of the ceilometer at Tazhong. The black dots show the aerosol mixing layer height (AMLH). (A) Background levels of low aerosol concentrations under clear-sky conditions from September 19 to 30, 2019. (B) Vertical distributions of dust aerosols under floating dusty days from September 12 to 15, 2019. Hourly average diurnal variations of AMLH (in m) at Tazhong. The black dashed lines indicate the maximum or minimum values at the corresponding hour. The gray shades denote plus or minus one standard deviation. (C) Clear-sky days from September 19 to 30, 2019. (D) Floating dusty days from September 12 to 15, 2019. The overall means and maximum AMLH are shown in the figures.
Threshold of Diverse Dust Aerosol Intensities
As mentioned above, the occurrences of dust episodes have a great contribution to the surface particulate concentrations over desert areas. In this study, we propose a quantitative threshold method to distinguish the different levels of dust events based on the hourly average mass concentrations of particulate matters (e.g., PM2.5 and PM10) and wind speed (ws). Note that the classification algorithm in this paper is somewhat different from the standard method of the World Meteorological Organization for identifying dust storms, which is mainly on the basis of horizontal visibility and wind speed. Therefore, the typical dust events can be classified as follows: (1) clear-sky condition: PM10 < 150 μg/m3, PM2.5 < 50 μg/m3, and ws < 2.0 ms−1; (2) floating dust: 150 μg/m3 ≤ PM10 < 400 μg/m3, PM2.5 ≥ 50 μg/m3, 2.0 ms−1 ≤ ws < 5.0 ms−1, lasting for 3 h at least; (3) blowing dust: 400 μg/m3 ≤ PM10 < 800 μg/m3, PM2.5 ≥ 100 μg/m3, 5.0 ms−1 ≤ ws < 10.0 ms−1, lasting for 3 h at least; (4) and dust storm: PM10 ≥ 800 μg/m3, PM2.5 ≥ 150 μg/m3, ws ≥ 10.0 ms−1, lasting for 3 h at least. Then, we can analyze the characteristics of the aerosol optical parameters under different dust intensities, such as normalized range-corrected signal log10(RCS), aerosol extinction [σ(z)] and backscattering [β(z)] coefficients, vertical optical range (VOR), and corresponding lidar ratio (Sa). Similar to the definition of horizontal visibility, the VOR is calculated as the height at which the integral of the aerosol extinction coefficient with z is equal to 3, namely:
Figure 9 draws the vertical profiles of log10(RCS), surface wind speed, and VOR under different dust events at Tazhong. Here the clear-sky days, floating dust, blowing dust, and strong dust storms are from September 21 and 22, August 12 and 13, August 3 and 4, July 25, and August 10, 2019, respectively. The backscattering signal intensities log10(RCS) and VORs of the ceilometer present pronounced diurnal variations with the increase of surface wind speed and persistence of high wind speed. The maximal AMLH values are about 4.0, 3.2, 2.5, and 1.0 km for clear-sky days, floating dust, blowing dust, and heavy dust storms, respectively, which is majorly owing to the different concentrations of dust particles produced from the surface and caused by different degrees of attenuation of emitted laser pulse energy. The log10(RCS) under clear-sky conditions are all lower than 5.2 and range from 5.2 to 5.8 under floating dust and from 5.6 to 6.2 under blowing dust. The log10(RCS) are higher than 6.2 for heavy dust storm cases. Affected by the lofted dust particles, the atmospheric turbidities significantly increase, and the corresponding VOR values vary from 3.2 to 4.0 km, from 2.0 to 3.5 km, from 1.5 to 3.0 km, and from 0.2 to 1.5 km, respectively. Obviously, the diurnal variations of VOR greatly fluctuate under strong dust storms and blowing dust. In comparison, the clear-sky VORs display relatively smooth variations. The overall mean VOR values are approximately 3.37, 2.64, 1.92, and 0.32 km for four typical weather types, respectively, as shown in Figure 9.
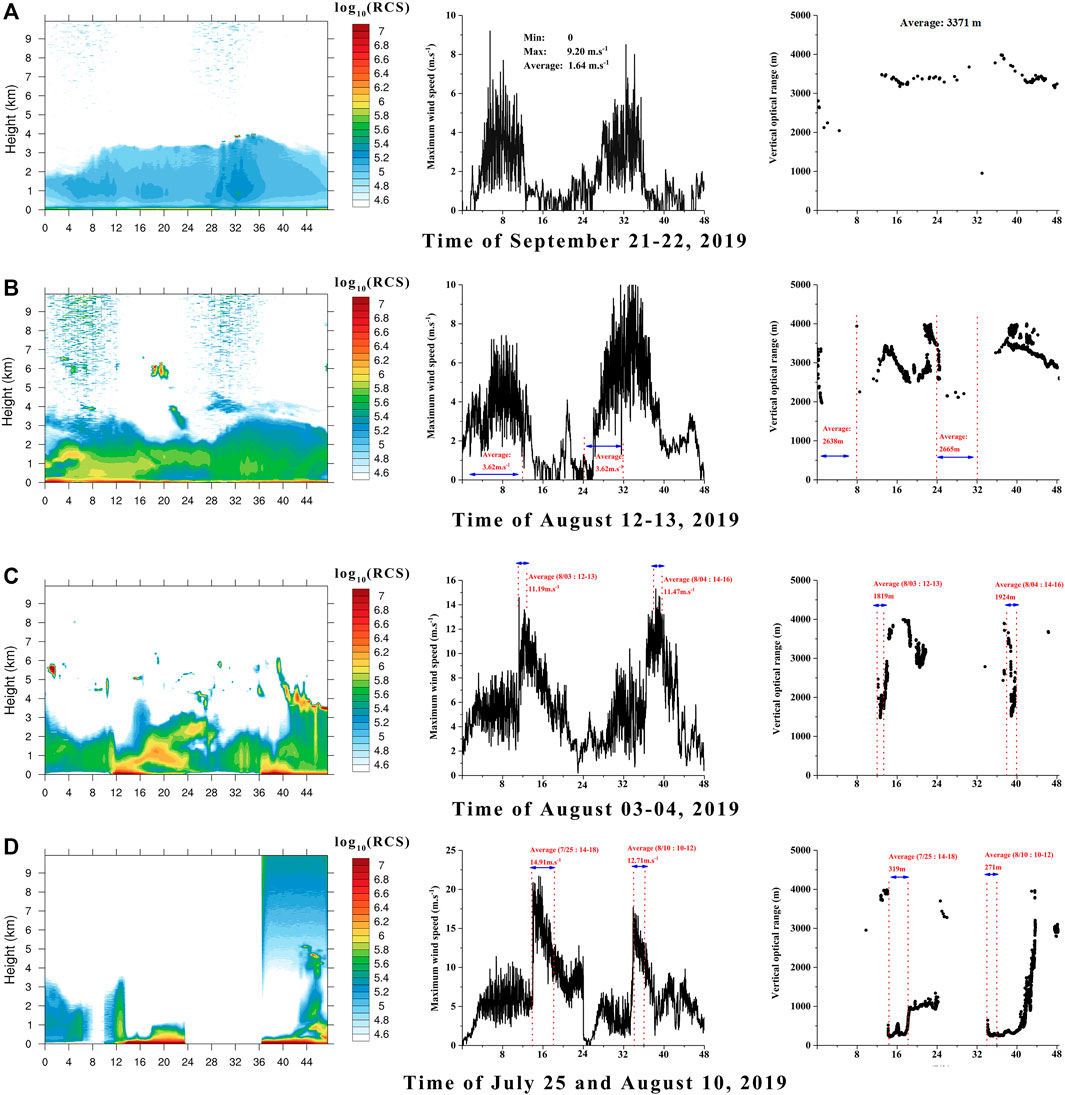
FIGURE 9. Left panels: vertical profiles of 30-min averaged log10(RCS) from the ceilometer. Middle panels: time series of instantaneous maximum surface wind speed (ms−1) with 1-min resolution. Right panels: time series of vertical optical range (in m) from the ceilometer. The mean values are shown in the figures. (A) Clear-sky days are from September 21 to 22, 2019. (B) Floating dusty days are from August 12 to 13, 2019. (C) Blowing dusty days are from August 3 to 4, 2019. (D) Strong dust storms are on July 25 and August 10, 2019.
Figure 10 shows the averaged vertical profiles of aerosol extinction coefficient at Tazhong under clear-sky, floating dust, blowing dust, and strong dust storm conditions. The clear-sky days include from September 21 to 29, 2019. The floating dusty days include July 27 and 29, August 12 and 13, and September 13. The blowing dusty days include July 26 and August 3 and 4. The strong dusty days include July 25, August 10, 11, and 17, and September 6 and 10. The results imply that the aerosol extinction coefficients σ(z) are all greater than 1.0 km−1 at 150–300-m height, with maximal σ(z) of 2.0 km−1 for strong dust storms. The corresponding σ(z) distinctly decreases with the increase of height, from 1.0 km−1 at 300 m to 0.3 km−1 at 1 km and 0.0 km−1 at 2.0 km, and then this remains at 0.0 km−1 from 2.0 to 5.0 km. This suggests again that the intense attenuation effects induced by massive airborne dust particles directly result in very weak backscattering signals above 2.0-km height. For the blowing dust case, the σ(z) value is about 0.50 km−1 at 200 m, linearly decreases with height, is 0.25 km−1 at 300 m, and then stays at around 0.30 km−1 from 300 m to 1.6 km; finally, it gradually decreases with height and is nearly 0.0 km−1 at 4.0 km. The σ(z) values are 0.10 km and 0.14 km−1 at 200-m height for clear-sky and floating dust, respectively, and both linearly reduce with height and are about 0.04 and 0.09 km−1 at 300 m. Then, the σ(z) values of the two cases nonlinearly increase with height and reach a maximum of 0.20 km−1 at 2.7 km for clear-sky case and a maximum of 0.32 km−1 at 2.6 km for floating dust case. Finally, the corresponding σ(z) values decrease again with height and stay at about 0.05 km−1 from 3.4 to 5.0 km. Generally, the aerosol extinction coefficients under dust cases are about 3–10 times higher than those in clear-sky conditions. These structural patterns reflect the influences of uplifted dust aerosols on the σ(z) vertical profiles at different heights.
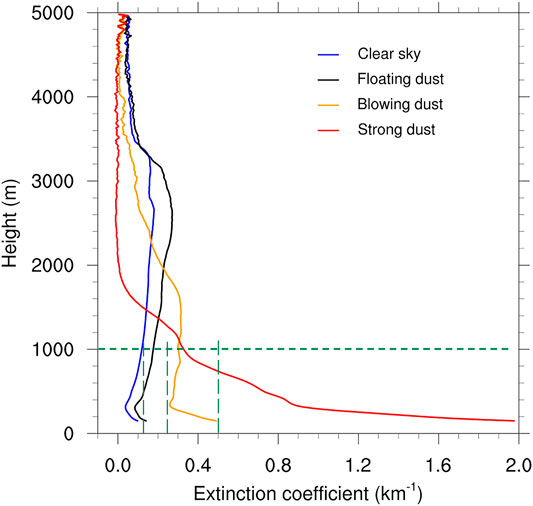
FIGURE 10. Averaged vertical profiles of aerosol extinction coefficient (km−1) at Tazhong under clear sky (blue), floating dust (black), blowing dust (orange), and strong dust storm (red) conditions. The clear-sky days were from September 21 to 29, 2019. The floating dusty days were July 27 and 29, August 12 and 13, and September 13, 2019. The blowing dusty days include July 26 and August 3 and 4, 2019. The strong dusty days include July 25, August 10, 11, and 17, and September 6 and 10, 2019.
Table 1 summarizes the statistics of aerosol optical parameters under different levels of dust intensity during summer in 2019 at Tazhong. It is evident that the log10(RCS), σ(z), and β(z) are less than 5.2, 0.12 km−1, and 0.004 km−1 sr−1 for clear-sky cases, respectively, and the corresponding VOR is greater than 3.0 km, while the lidar ratio Sa is 30 sr. The log10(RCS), σ(z), and β(z) are larger than 6.2, 0.5 km−1, and 0.01 km−1 sr−1 for strong dust storms, respectively, and the corresponding VOR is smaller than 1.0 km, while the lidar ratio Sa is 50 sr. The log10(RCS), σ(z), β(z), and VOR vary as 5.2–5.8, 0.12–0.25 km−1, 0.0024–0.005 km−1 sr−1, and 2.0–3.0 km under floating dust, respectively, and the corresponding aerosol optical characteristics are in the ranges 5.6–6.2, 0.25–0.50 km−1, 0.005–0.01 km−1 sr−1, and 1.0–3.0 km for blowing dust. Unlike the HSRL or Raman depolarized lidar, the CHM15k ceilometer can only provide vertical profile information of aerosol optical properties at 1,064 nm, and it lacks multi-channel profiles and depolarization ratio. However, these statistical variables are very helpful to investigate and validate dust aerosols in the application of climate models or satellite remote sensing.
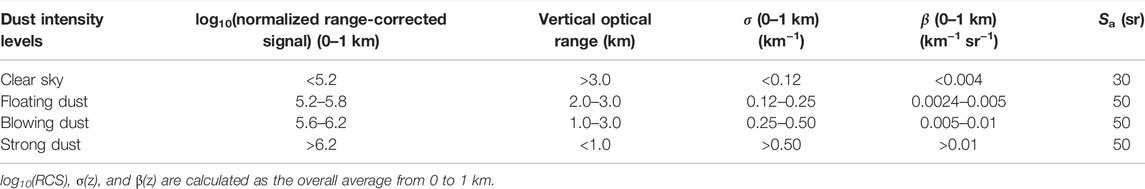
TABLE 1. Statistics of aerosol optical parameters under different levels of dust intensity during summer 2019 at Tazhong.
Conclusion
This study mainly examined the vertical profiles and optical properties of dust aerosol in the hinterland of Taklimakan Desert during summer in 2019. The primary findings are summarized in the following discussion.
Influenced by the abundant surface dust sources and strong wind speed, dust events frequently occurred in Taklimakan Desert during the whole inclusive period; the overall hourly mean PM2.5, PM10, PM2.5/PM10, and AE440–870 were 110.4 ± 121.0 μg/m3, 317.2 ± 340.0 μg/m3, 0.35 ± 0.07, and 0.28 ± 0.12, respectively, suggesting that dust particles were the predominant aerosol types in the hinterland of TD. Both the ground-based ceilometer and spaceborne CALIPSO could distinctly detect the dust aerosol, high-altitude cloud layer, and subsequent rainfall process. Affected by the surrounding huge mountains and the intensity of mid-latitude westerlies, there was an obvious summertime dust stagnation layer persistently hovering over the TD at 1.5–3.0-km height, and most of the uplifted dust particles were re-deposited in the TD and nearby downstream arid regions after hanging over the desert for several days. The AMLH exhibited prominent diurnal variations, which were usually a low stable layer in the morning and at nighttime (∼1.5 km) and a high convective layer in the afternoon (∼2.8 km). There was a deep and intense daytime convective structure with maximum AMLH of ∼3 km that appeared at 12:00 UTC, which was greatly consistent with the PBL height (3 to 4 km) measured from radiosonde data.
The backscattering signals log10(RCS), σ(z), and β(z) were less than 5.2, 0.12 km−1, and 0.004 km−1 sr−1 for clear-sky cases, respectively, and the corresponding VOR was greater than 3.0 km, while the lidar ratio Sa was 30 sr. In comparison, the log10(RCS), σ(z), and β(z) were larger than 6.2, 0.5 km−1, and 0.01 km−1 sr−1 for heavy dust storms, respectively, and the corresponding VOR was smaller than 1.0 km, while Sa was equal to 50 sr. The aerosol extinction coefficients σ(z) were about 2.0, 0.5, 0.14, and 0.10 km−1 at 200-m height, respectively, under strong dust storm, blowing dust, floating dust, and clear-sky conditions, and the corresponding values were 0.30, 0.30, 0.15, and 0.11 km−1 at 1 km. Generally, the aerosol extinction coefficients under dust events were about 3–10 times higher than those of clear-sky cases. The statistics of aerosol optical parameters under different dust intensities at Tazhong are very helpful to investigate and validate dust aerosols in the application of climate models or satellite remote sensing.
The findings of this paper directly confirmed the existence of a dust stagnation layer and a deep daytime convective structure over Taklimakan Desert in summer, which provide an invaluable dataset for surveying the uplifted and long-distance transportation of summertime Taklimakan dust particles. The interaction among dust aerosol, cloud, and precipitation plays a pivotal role in the radiation budget of the Earth–atmosphere system and concerning the hydrological cycle, but it still remains one of the biggest uncertainties in the current climate change. To uncover the complex feedback mechanism of dust–cloud–precipitation in desert source regions, in the future, we should integrate a variety of advanced detection methods (e.g., HSRL, Raman depolarized lidar, cloud radar), sophisticated satellite remote sensing algorithms (e.g., CALIPSO, CloudSat), and optimal and robust climate models to acquire three-dimensional and comprehensive multi-variable information of these complicated processes.
Data Availability Statement
The original contributions presented in the study are included in the article/Supplementary Material. Further inquiries can be directed to the corresponding author.
Author Contributions
JB coordinated and supervised the project. JB, ZL, DZ, FY, BL, JM, ZH, and QH contributed to field experiment and data analysis, research framework design, and writing the first drafts. ZL prepared data and completed all figures. JB revised the manuscript. All co-authors contributed to the interpretation of the results and to the text and approved it for publication.
Funding
This research was founded by the National Science Foundation of China (42075126), the Project of Field Scientific Observation and Research Station of Gansu Province (18JR2RA013), the Fundamental Research Funds for the Central Universities (lzujbky-2021-kb02 and lzujbky-2021-sp04), and China 111 Project (number B13045).
Conflict of Interest
The authors declare that the research was conducted in the absence of any commercial or financial relationships that could be construed as a potential conflict of interest.
Publisher’s Note
All claims expressed in this article are solely those of the authors and do not necessarily represent those of their affiliated organizations or those of the publisher, the editors, and the reviewers. Any product that may be evaluated in this article or claim that may be made by its manufacturer is not guaranteed or endorsed by the publisher.
Acknowledgments
The authors are grateful to the NASA scientific team for the provision of CALIPSO products and the Chinese Environmental Protection Bureau for providing data on the hourly mean PM2.5 and PM10 concentrations at Hotan. We would like to express special thanks to all staff of Taklimakan Desert Meteorology Field Experiment Station for supporting the field experiment. We also appreciate all reviewers and editors for their constructive and insightful comments.
References
Ackermann, J. (1998). The Extinction-To-Backscatter Ratio of Tropospheric Aerosol: A Numerical Study. J. Atmos. Oceanic Technol. 15 (4), 1043–1050. doi:10.1175/1520-0426(1998)015<1043:tetbro>2.0.co;2
Bi, J., Huang, J., Shi, J., Hu, Z., Zhou, T., Zhang, G., et al. (2017). Measurement of Scattering and Absorption Properties of Dust Aerosol in a Gobi farmland Region of Northwestern China - a Potential Anthropogenic Influence. Atmos. Chem. Phys. 17, 7775–7792. doi:10.5194/acp-17-7775-2017
Bi, J., Zuo, D., Yang, F., Zhang, L., Huang, Z., and Wang, T. (2022). Surface Radiation Characteristics and Downward Cloud Radiative Forcing in Southern Xinjiang during Summer 2019. Meteorol. Atmos. Phys. 134 (1), 13–23. doi:10.1007/s00703-021-00847-5
Che, H., Wang, Y., Sun, J., Zhang, X., Zhang, X., and Guo, J. (2013). Variation of Aerosol Optical Properties over the Taklimakan Desert in China. Aerosol Air Qual. Res. 13, 777–785. doi:10.4209/aaqr.2012.07.0200
Che, H., Zhang, X.-Y., Xia, X., Goloub, P., Holben, B., Zhao, H., et al. (2015). Ground-based Aerosol Climatology of China: Aerosol Optical Depths from the China Aerosol Remote Sensing Network (CARSNET) 2002-2013. Atmos. Chem. Phys. 15, 7619–7652. doi:10.5194/acp-15-7619-2015
Che, H., Xia, X., Zhao, H., Dubovik, O., Holben, B. N., Goloub, P., et al. (2019a). Spatial Distribution of Aerosol Microphysical and Optical Properties and Direct Radiative Effect from the China Aerosol Remote Sensing Network. Atmos. Chem. Phys. 19, 11843–11864. doi:10.5194/acp-19-11843-2019
Che, H., Gui, K., Xia, X., Wang, Y., Holben, B. N., Goloub, P., et al. (2019b). Large Contribution of Meteorological Factors to Inter-Decadal Changes in Regional Aerosol Optical Depth. Atmos. Chem. Phys. 19, 10497–10523. doi:10.5194/acp-19-10497-2019
Chen, S., Huang, J., Li, J., Jia, R., Jiang, N., Kang, L., et al. (2017a). Comparison of Dust Emissions, Transport, and Deposition between the Taklimakan Desert and Gobi Desert from 2007 to 2011. Sci. China Earth Sci. 60, 1338–1355. doi:10.1007/s11430-016-9051-0
Chen, S., Huang, J., Kang, L., Wang, H., Ma, X., He, Y., et al. (2017b). Emission, Transport, and Radiative Effects of mineral Dust from the Taklimakan and Gobi Deserts: Comparison of Measurements and Model Results. Atmos. Chem. Phys. 17, 2401–2421. doi:10.5194/acp-17-2401-2017
Dai, C., Wang, Q., Kalogiros, J. A., Lenschow, D. H., Gao, Z., and Zhou, M. (2014). Determining Boundary-Layer Height from Aircraft Measurements. Boundary-Layer Meteorol. 152 (3), 277–302. doi:10.1007/s10546-014-9929-z
Davis, K. J., Gamage, N., Hagelberg, C. R., Kiemle, C., Lenschow, D. H., and Sullivan, P. P. (2000). An Objective Method for Deriving Atmospheric Structure from Airborne Lidar Observations. J. Atmos. Oceanic Technol. 17 (11), 1455–1468. doi:10.1175/1520-0426(2000)017<1455:aomfda>2.0.co;2
Fernald, F. G. (1984). Analysis of Atmospheric Lidar Observations: Some Comments. Appl. Opt. 23, 652–653. doi:10.1364/AO.23.000652
Ge, J. M., Huang, J. P., Xu, C. P., Qi, Y. L., and Liu, H. Y. (2014). Characteristics of Taklimakan Dust Emission and Distribution: A Satellite and Reanalysis Field Perspective. J. Geophys. Res. Atmos. 119 (20), 11772–11783. doi:10.1002/2014JD022280
Heese, B., Flentje, H., Althausen, D., Ansmann, A., and Frey, S. (2010). Ceilometer Lidar Comparison: Backscatter Coefficient Retrieval and Signal-To-Noise Ratio Determination. Atmos. Meas. Tech. 3, 1763–1770. doi:10.5194/amt-3-1763-2010
Holben, B. N., Eck, T. F., Slutsker, I., Tanré, D., Buis, J. P., Setzer, A., et al. (1998). AERONET: A Federated Instrument Network and Data Archive for Aerosol Characterization. Remote Sensing Environ. 66 (1), 1–16. doi:10.1016/s0034-4257(98)00031-5
Holzworth, G. C. (1964). Estimates of Mean Maximum Mixing Depths in the Contiguous United States. Mon. Wea. Rev. 92 (5), 235–242. doi:10.1175/1520-0493(1964)092<0235:eommmd>2.3.co;2
Hu, Z., Huang, J., Zhao, C., Bi, J., Jin, Q., Qian, Y., et al. (2019a). Modeling the Contributions of Northern Hemisphere Dust Sources to Dust Outflow from East Asia. Atmos. Environ. 202, 234–243. doi:10.1016/j.atmosenv.2019.01.022
Hu, Z., Huang, J., Zhao, C., Ma, Y., Jin, Q., Qian, Y., et al. (2019b). Trans-Pacific Transport and Evolution of Aerosols: Spatiotemporal Characteristics and Source Contributions. Atmos. Chem. Phys. 19, 12709–12730. doi:10.5194/acp-19-12709-2019
Hu, Z., Huang, J., Zhao, C., Jin, Q., Ma, Y., and Yang, B. (2020). Modeling Dust Sources, Transport, and Radiative Effects at Different Altitudes over the Tibetan Plateau. Atmos. Chem. Phys. 20, 1507–1529. doi:10.5194/acp-20-1507-2020
Huang, J., Lin, B., Minnis, P., Wang, T., Wang, X., Hu, Y., et al. (2006a). Satellite-based Assessment of Possible Dust Aerosols Semi-direct Effect on Cloud Water Path over East Asia. Geophys. Res. Lett. 33, L19802. doi:10.1029/2006GL026561
Huang, J., Minnis, P., Lin, B., Wang, T., Yi, Y., Hu, Y., et al. (2006b). Possible Influences of Asian Dust Aerosols on Cloud Properties and Radiative Forcing Observed from MODIS and CERES. Geophys. Res. Lett. 33, L06824. doi:10.1029/2005GL024724
Huang, J., Minnis, P., Yi, Y., Tang, Q., Wang, X., Hu, Y., et al. (2007). Summer Dust Aerosols Detected from CALIPSO over the Tibetan Plateau. Geophys. Res. Lett. 34, L18805. doi:10.1029/2007GL029938
Huang, J., Minnis, P., Chen, B., Huang, Z., Liu, Z., Zhao, Q., et al. (2008). Long-range Transport and Vertical Structure of Asian Dust from CALIPSO and Surface Measurements during PACDEX. J. Geophys. Res. 113, D23212. doi:10.1029/2008JD010620
Huang, J., Fu, Q., Su, J., Tang, Q., Minnis, P., Hu, Y., et al. (2009). Taklimakan Dust Aerosol Radiative Heating Derived from CALIPSO Observations Using the Fu-Liou Radiation Model with CERES Constraints. Atmos. Chem. Phys. 9, 4011–4021. doi:10.5194/acp-9-4011-2009
Huang, Z., Huang, J., Bi, J., Wang, G., Wang, W., Fu, Q., et al. (2010). Dust Aerosol Vertical Structure Measurements Using Three MPL Lidars during 2008 China-U.S. Joint Dust Field experiment. J. Geophys. Res. 115, D00K15. doi:10.1029/2009JD013273
Huang, J., Fu, Q., Zhang, W., Wang, X., Zhang, R., Ye, H., et al. (2011). Dust and Black Carbon in Seasonal Snow across Northern China. Bull. Amer. Meteorol. Soc. 92, 175–181. doi:10.1175/2010BAMS3064.1
Huang, J., Wang, T., Wang, W., Li, Z., and Yan, H. (2014). Climate Effects of Dust Aerosols over East Asian Arid and Semiarid Regions. J. Geophys. Res. Atmos. 119, 11398–11416. doi:10.1002/2014JD021796
Huebert, B. J., Bates, T., Russell, P. B., Shi, G., Kim, Y. J., Kawamura, K., et al. (2003). An Overview of ACE-Asia: Strategies for Quantifying the Relationships between Asian Aerosols and Their Climatic Impacts. J. Geophys. Res. 108 (D23), 8633. doi:10.1029/2003JD003550
Husar, R. B., Tratt, D. M., Schichtel, B. A., Falke, S. R., Li, F., Jaffe, D., et al. (2001). Asian Dust Events of April 1998. J. Geophys. Res. 106 (D16), 18317–18330. doi:10.1029/2000jd900788
IPCC Climate Change (2013). “The Physical Science Basis,” in Contribution of Working Group I to the Fifth Assessment Report of the Intergovernmental Panel on Climate Change. Editors T. F. Stocker, D. Qin, G.-K. Plattner, M. Tignor, S. K. Allen, J. Boschunget al. (Cambridge, United Kingdom and New York, NY, USA: Cambridge University Press), 1535.
Jickells, T. D., An, Z. S., Andersen, K. K., Baker, A. R., Bergametti, G., Brooks, N., et al. (2005). Global Iron Connections between Desert Dust, Ocean Biogeochemistry, and Climate. Science 308, 67–71. doi:10.1126/science.1105959
Jin, L., He, Q., Li, Z., Deng, M., and Abbas, A. (2021). Interannual and Seasonal Variations of Sand-Dust Events in Tarim Basin, China. Res. Sq. doi:10.21203/rs.3.rs-327333/v1
Jin, Q., Wei, J., Lau, W. K. M., Pu, B., and Wang, C. (2021). Interactions of Asian mineral Dust with Indian Summer Monsoon: Recent Advances and Challenges. Earth-Science Rev. 215, 103562. doi:10.1016/j.earscirev.2021.103562
Kai, K., Nagata, Y., Tsunematsu, N., Matsumura, T., Kim, H.-S., Matsumoto, T., et al. (2008). The Structure of the Dust Layer over the Taklimakan Deser during the Dust Storm in April 2002 as Observed Using a Depolarization Lidar. J. Meteorol. Soc. Jpn. 86 (1), 1–16. doi:10.2151/jmsj.86.1
Kotthaus, S., and Grimmond, C. S. B. (2018). Atmospheric Boundary‐layer Characteristics from Ceilometer Measurements. Part 1: A New Method to Track Mixed Layer Height and Classify Clouds. Q.J.R. Meteorol. Soc. 144 (714), 1525–1538. doi:10.1002/qj.3299
Li, Z., Lau, W. K. M., Ramanathan, V., Wu, G., Ding, Y., Manoj, M. G., et al. (2016). Aerosol and Monsoon Climate Interactions over Asia. Rev. Geophys. 54, 866–929. doi:10.1002/2015RG000500
Li, L., Mahowald, N. M., Miller, R. L., Pérez García-Pando, C., Klose, M., Hamilton, D. S., et al. (2021). Quantifying the Range of the Dust Direct Radiative Effect Due to Source Mineralogy Uncertainty. Atmos. Chem. Phys. 21, 3973–4005. doi:10.5194/acp-21-3973-2021
Liao, H., and Seinfeld, J. H. (1998). Radiative Forcing by mineral Dust Aerosols: Sensitivity to Key Variables. J. Geophys. Res. 103, 31637–31645. doi:10.1029/1998JD200036
Liu, S., and Liang, X.-Z. (2010). Observed Diurnal Cycle Climatology of Planetary Boundary Layer Height. J. Clim. 23 (21), 5790–5809. doi:10.1175/2010jcli3552.1
Liu, Z., Sugimoto, N., and Murayama, T. (2002). Extinction-to-backscatter Ratio of Asian Dust Observed with High-Spectral-Resolution Lidar and Raman Lidar. Appl. Opt. 41 (15), 2760–2767. doi:10.1364/AO.41.002760
Liu, D., Wang, Z., Liu, Z., Winker, D., and Trepte, C. (2008). A Height Resolved Global View of Dust Aerosols from the First Year CALIPSO Lidar Measurements. J. Geophys. Res. 113, D16214. doi:10.1029/2007JD009776
Liu, Z., Vaughan, M., Winker, D., Kittaka, C., Getzewich, B., Kuehn, R., et al. (2009). The CALIPSO Lidar Cloud and Aerosol Discrimination: Version 2 Algorithm and Initial Assessment of Performance. J. Atmos. Ocean Technol. 26 (7), 1198–1213. doi:10.1175/2009jtecha1229.1
Maher, B. A., Prospero, J. M., Mackie, D., Gaiero, D., Hesse, P. P., and Balkanski, Y. (2010). Global Connections between Aeolian Dust, Climate and Ocean Biogeochemistry at the Present Day and at the Last Glacial Maximum. Earth-Science Rev. 99 (1-2), 61–97. doi:10.1016/j.earscirev.2009.12.001
Mikami, M., Shi, G. Y., Uno, I., Yabuki, S., Iwasaka, Y., Yasui, M., et al. (2006). Aeolian Dust experiment on Climate Impact: An Overview of Japan-China Joint Project ADEC. Glob. Planet. Change 52, 142–172. doi:10.1016/j.gloplacha.2006.03.001
Mu, L., Su, J., Mo, X., Peng, N., Xu, Y., Wang, M., et al. (2021). The Temporal-Spatial Variations and Potential Causes of Dust Events in Xinjiang Basin during 1960-2015. Front. Environ. Sci. 9, 727844. doi:10.3389/fenvs.2021.727844
Murayama, T., Müller, D., Wada, K., Shimizu, A., Sekiguchi, M., and Tsukamoto, T. (2004). Characterization of Asian Dust and Siberian Smoke with Multi-Wavelength Raman Lidar over Tokyo, Japan in spring 2003. Geophys. Res. Lett. 31, L23103. doi:10.1029/2004GL021105
Pan, H., Huo, W., Wang, M., Zhang, J., Meng, L., Kumar, K. R., et al. (2020). Insight into the Climatology of Different Sand-Dust Aerosol Types over the Taklimakan Desert Based on the Observations from Radiosonde and A-Train Satellites. Atmos. Environ. 238, 117705. doi:10.1016/j.atmosenv.2020.117705
Qian, Y., Yasunari, T. J., Doherty, S. J., Flanner, M. G., Lau, W. K. M., Ming, J., et al. (2014). Light-Absorbing Particles in Snow and Ice: Measurement and Modeling of Climatic and Hydrological Impact. Adv. Atmos. Sci. 32, 64–91. doi:10.1007/s00376-014-0010-0
Rosenfeld, D., Rudich, Y., and Lahav, R. (2001). Desert Dust Suppressing Precipitation: A Possible Desertification Feedback Loop. Proc. Natl. Acad. Sci. 98, 5975–5980. doi:10.1073/pnas.101122798
Sawyer, V., and Li, Z. (2013). Detection, Variations and Intercomparison of the Planetary Boundary Layer Depth from Radiosonde, Lidar and Infrared Spectrometer. Atmos. Environ. 79, 518–528. doi:10.1016/j.atmosenv.2013.07.019
Shao, Y., Wyrwoll, K.-H., Chappell, A., Huang, J., Lin, Z., McTainsh, G. H., et al. (2011). Dust Cycle: An Emerging Core Theme in Earth System Science. Aeolian Res. 2, 181–204. doi:10.1016/j.aeolia.2011.02.001
Shimizu, A., Sugimoto, N., Matsui, I., Arao, K., Uno, I., Murayama, T., et al. (2004). Continuous Observations of Asian Dust and Other Aerosols by Polarization Lidars in China and Japan during ACE-Asia. J. Geophys. Res. 109, D19S17. doi:10.1029/2002JD003253
Tesche, M., Ansmann, A., MüLLER, D., Althausen, D., Mattis, I., Heese, B., et al. (2009). Vertical Profiling of Saharan Dust with Raman Lidars and Airborne HSRL in Southern Morocco during SAMUM. Tellus B: Chem. Phys. Meteorology 61, 144–164. doi:10.1111/j.1600-0889.2008.00390.x
Twomey, S. (1977). The Influence of Pollution on the Shortwave Albedo of Clouds. J. Atmos. Sci. 34 (7), 1149–1152. doi:10.1175/1520-0469(1977)034<1149:tiopot>2.0.co;2
U.S. EPA (1991). Technical Assistance Document for Sampling and Analysis of Ozone Precursors. Report No. EPA 600/8-91-215. North Carolina: U. S. Environmental Protection Agency, Atmospheric Research and Exposure Assessment Laboratory. Research Triangle Park, NC.
Uno, I., Eguchi, K., Yumimoto, K., Takemura, T., Shimizu, A., Uematsu, M., et al. (2009). Asian Dust Transported One Full Circuit Around the globe. Nat. Geosci. 2, 557–560. doi:10.1038/NGEO583
Uno, I., Eguchi, K., Yumimoto, K., Liu, Z., Hara, Y., Sugimoto, N., et al. (2011). Large Asian Dust Layers Continuously Reached North America in April 2010. Atmos. Chem. Phys. 11, 7333–7341. doi:10.5194/acp-11-7333-2011
Wang, X., Doherty, S. J., and Huang, J. (2013). Black Carbon and Other Light-Absorbing Impurities in Snow across Northern China. J. Geophys. Res. Atmos. 118, 1471–1492. doi:10.1029/2012JD018291
Wang, M., Wei, W., He, Q., Yang, Y., Fan, L., and Zhang, J. (2016). Summer Atmospheric Boundary Layer Structure in the Hinterland of Taklimakan Desert, China. J. Arid Land 8 (6), 846–860. doi:10.1007/s40333-016-0054-3
Wiegner, M., and Geiß, A. (2012). Aerosol Profiling with the Jenoptik Ceilometer CHM15kx. Atmos. Meas. Tech. 5, 1953–1964. doi:10.5194/amt-5-1953-2012
Winker, D. M., Hunt, W. H., and McGill, M. J. (2007). Initial Performance Assessment of CALIOP. Geophys. Res. Lett. 34, L19803. doi:10.1029/2007GL030135
Winker, D. M., Vaughan, M. A., Omar, A., Hu, Y., Powell, K. A., Liu, Z., et al. (2009). Overview of the CALIPSO Mission and CALIOP Data Processing Algorithms. J. Atmos. Ocean Technol. 26 (11), 2310–2323. doi:10.1175/2009jtecha1281.1
World Health Organization (2005). Air Quality Guidelines for Particulate Matter, Ozone, Nitrogen Dioxide and Sulfur Dioxide. Global Update, E87950. Copenhagen: World Health Organization Regional Office for Europe.
Yang, F., He, Q., Huang, J., Ali, M., Yang, X., Huo, W., et al. (2021). Desert Environment and Climate Observations Network Over the Taklimakan Desert. B. AM. Meteorol. Soc. 102 (6), E1172–E1191. doi:10.1175/BAMS-D-20–0236.1
Yin, Y., and Chen, L. (2007). The Effects of Heating by Transported Dust Layers on Cloud and Precipitation: A Numerical Study. Atmos. Chem. Phys. 7, 3497–3505. doi:10.5194/acp-7-3497-2007
Yumimoto, K., Eguchi, K., Uno, I., Takemura, T., Liu, Z., Shimizu, A., et al. (2010). Summertime Trans-Pacific Transport of Asian Dust. Geophys. Res. Lett. 37, L18815. doi:10.1029/2010GL043995
Keywords: dust aerosol, aerosol extinction coefficient profile, dust stagnation layer, aerosol mixing layer height, Taklimakan Desert
Citation: Bi J, Li Z, Zuo D, Yang F, Li B, Ma J, Huang Z and He Q (2022) Dust Aerosol Vertical Profiles in the Hinterland of Taklimakan Desert During Summer 2019. Front. Environ. Sci. 10:851915. doi: 10.3389/fenvs.2022.851915
Received: 10 January 2022; Accepted: 17 February 2022;
Published: 13 April 2022.
Edited by:
Zhiyuan Hu, Sun Yat-sen University, ChinaReviewed by:
Huizheng Che, Chinese Academy of Meteorological Sciences, ChinaWencai Wang, Ocean University of China, China
Chao Liu, Nanjing University of Information Science and Technology, China
Copyright © 2022 Bi, Li, Zuo, Yang, Li, Ma, Huang and He. This is an open-access article distributed under the terms of the Creative Commons Attribution License (CC BY). The use, distribution or reproduction in other forums is permitted, provided the original author(s) and the copyright owner(s) are credited and that the original publication in this journal is cited, in accordance with accepted academic practice. No use, distribution or reproduction is permitted which does not comply with these terms.
*Correspondence: Jianrong Bi, bijr@lzu.edu.cn