 Hao Fan
 Chuanfeng Zhao
 Yikun Yang
94% of researchers rate our articles as excellent or good
Learn more about the work of our research integrity team to safeguard the quality of each article we publish.
Find out more
ORIGINAL RESEARCH article
Front. Environ. Sci., 14 June 2021
Sec. Atmosphere and Climate
Volume 9 - 2021 | https://doi.org/10.3389/fenvs.2021.692440
This article is part of the Research TopicAtmospheric Aerosols and their Interactions with Clouds, Radiation, and Climate on Regional ScalesView all 7 articles
Particulate Matter (PM) is an important indicator of the degree of air pollution. The PM type and the ratio of coarse and fine PM particles determine the ability to affect human health and atmospheric processes. Using the observation data across the country from 2015 to 2018, this study investigates the distribution and proportion of PM2.5 and PM10 at different temporal and spatial scales in mainland China; clarifies the PM2.5, PM10 and PM2.5/PM10 ratios interrelation; and classifies the dust, mixed, and anthropogenic type aerosol. It shows that the annual average concentration of PM2.5 and PM10 decreased by 10.55 and 8.78 μg m−3 in 4 years. PM2.5, PM10, and PM2.5/PM10 ratios show obvious while different seasonal variations. PM2.5 is high in winter and low in summer, while PM10 is high in winter and spring, and low in summer and autumn. Differently, the PM2.5/PM10 ratios are the highest in winter, and the lowest in spring. PM2.5/PM10 ratios show strong independence on PM2.5 and PM10, implying that it can provide extra information about the aerosol pollution such as aerosol type. A classification method about air pollution types is then further proposed based on probability distribution function (PDF) morphology of PM2.5/PM10 ratios. The results show that dust type mainly lies in the west of Hu-Line, mixed type pollution distributes near Hu-Line, and the anthropogenic type dominates over North China Plain and cities in southern China. The results provide insights into China’s future clean air policy making and environmental research.
1) PM2.5/PM10 ratios are decreasing year by year and the seasonal variation is obvious from 2015 to 2018.
2) PM2.5/PM10 ratios are independent on PM concentration and provides extra aerosol type information.
3) An urban pollution classification method based on PM2.5/PM10 ratios is proposed in this study.
4) The Hu-line is found as the good dividing line between dust and anthropogenic type aerosol pollution.
Due to its severe impact on human health and significant atmospheric visibility reduction, Particulate Matter (PM) has attracted increasing attention worldwide (Lelieveld et al., 2015; Gu et al., 2016; An et al., 2019; Zhang et al., 2019; Zhao et al., 2020). The source and composition of PM in the atmosphere are complex, which may be generated directly by the emission sources, or generated by the secondary conversion (Zhao et al., 2018a; Tan et al., 2019). Associated with the different meteorological conditions, the size and composition of PM in the atmosphere vary widely, and could cause various health hazards and weather and climate effects over different locations (Huang et al., 2014; Lelieveld et al., 2015; Liao et al., 2015; Wang et al., 2015; Zhao et al., 2017).
The PM is mainly classified based on the aerodynamic diameter. For example, PM2.5 and PM10 refer to particles with aerodynamic diameters less than or equal to 2.5 and 10 μm, respectively. PM2.5 is also called fine particles, while PM10 is composed of PM2.5 and PM2.5-10. Particles between 2.5 and 10 μm are mainly from natural sources, such as desert, while they may also be caused by human activities, such as road dust and industrial emissions (Gu et al., 2016; Zhou et al., 2016; Chen et al., 2017; Tian et al., 2018). In contrast, PM2.5 mainly comes from the combustion of fossil fuels, such as industrial coal combustion, motor vehicle exhaust, and so on (Zhang et al., 2019; Zhao et al., 2019; Fan et al., 2020). From the perspective of physical characteristics, coarse particles can be removed from the atmosphere quickly through dry and wet deposition, while fine particles have a longer life in the atmosphere. Correspondingly, the fine particles are more difficult to control. Also, fine particles are more harmful to humans due to their fine sizes (Kong et al., 2016; Zhou et al., 2016; Talbi et al., 2018; Hvidtfeldt et al., 2019). Understanding the proportion of fine particles in the atmosphere is important for air pollution control and related researches.
Because coarse particles (PM2.5-10) and fine particles (PM2.5) have different physical and chemical characteristics, the proportion of PM2.5 to PM10 could provide important extra information about the aerosol pollution, which is worthy to characterize. Actually, previous studies have found that the PM2.5/PM10 ratios can provide a series of important information such as the cause of pollution, the air pollution process, and the impact on life and health (Chu et al., 2015; Wang et al., 2015; Wu et al., 2015; Xu et al., 2017). Generally, a lower PM2.5/PM10 ratio indicates coarse particles dominant, which is more attributed to natural sources (Wang et al., 2015; Zhou et al., 2016; Tian et al., 2018). In contrast, higher PM2.5/PM10 ratios indicate that the air pollution is more from anthropogenic sources (Chu et al., 2015; Kong et al., 2017; Zhao et al., 2018a; Zhao et al., 2019; Fan et al., 2020). Previous studies found that the average PM2.5/PM10 ratios observed were 0.62 in Wuhan, and 0.54 and 0.44 in Beijing in winter and spring, respectively (Kong et al., 2016; Xu et al., 2017). In Europe with a higher level of urbanization, the PM2.5/PM10 ratios are between 0.39 and 0.74, with the lowest values occurring in Southern Europe and the highest values occurring in Eastern Europe (Eeftens et al., 2012). A regional study of mixed agricultural and industrial development in the state of São Paulo, Brazil showed that the PM2.5/PM10 ratios were in the range of 0.33–0.47 (Franzin et al., 2020). In Saudi Arabia in the Middle East, which is obviously affected by the desert and arid climate, the PM2.5/PM10 ratios are 0.25–0.52, and the average value is only 0.3 (Khodeir et al., 2012). Therefore, the PM2.5/PM10 ratios are affected by multiple factors such as the underlying surface, human activities, and meteorological conditions, resulting in large spatio-temporal variations (An et al., 2019; Zhang et al., 2019; Fan et al., 2020).
In China, air pollution has become one of the studies focus during recent years (Yang et al., 2016; Ding et al., 2017; Shi et al., 2018; Zhao et al., 2018b; Sweerts et al., 2019; Yang et al., 2019; Zhang et al., 2019; Zhao et al., 2019). On one hand, PM pollution is severe in China, attracting a lot of attentions from the public. On the other hand, China has begun to reduce emissions significantly since 2013 (Zhang et al., 2019; Fan et al., 2020). Regardless of the application of remote sensing products, ground observation data, or model simulations, PM, especially PM2.5, is often the most important air pollutant that is frequently studied. However, the related researches on the PM2.5/PM10 ratios are still insufficient until today, especially for their spatial distribution characteristics and temporal variations at national scale. A small number of existing researches have mainly focused on the short-term observation results at typical cities such as Beijing and Wuhan (Kong et al., 2016; Xu et al., 2017), or have used very limited ground-based remote sensing observations to represent regional features (Wang et al., 2015; Wu et al., 2015). In fact, China’s population and industry are highly unevenly distributed, and the temporal and spatial differences in air pollution are large. Therefore, it is highly demanded to investigate the spatial and temporal variations of PM2.5/PM10 ratios at national scale. In addition, classifying the changes of PM2.5/PM10 ratios can more effectively characterize the underlying atmospheric processes at regional scale (Chu et al., 2015; Wang et al., 2015; Talbi et al., 2018).
In order to fully understand the changes of air pollution in China and then make reliable policies to control air pollution, this study aims to quantify the PM2.5, PM10, PM2.5/PM10 ratios by using the ground observation data from 367 cities across the country between 2015 and 2018, to reveal their differences in spatial and temporal changes, and to propose a method to classify the air pollution types over various regions based on PM2.5/PM10 ratios.
China has a vast territory, with a north-south and east-west span of more than 5,000 km, and pollution has significant changes with time and space. In this study, we carry out the variation analysis of air pollutants at two spatial scales. One is the analysis of PM2.5, PM10, PM2.5/PM10 ratios in 367 cities across mainland China (Figure 1). The other is the analysis of PM2.5, PM10, PM2.5/PM10 ratios by dividing all stations into 31 provincial-level administrative units for their spatial difference comparison and regional feature.
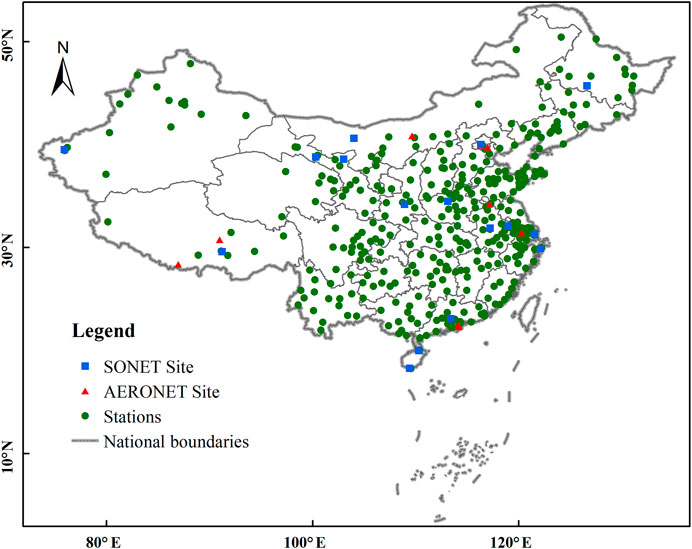
FIGURE 1. The spatial map about the study area and observation stations, along with the sites used for evaluation of our study results, which are SONET sites and AERONET sites.
The research period of this study is from January 1, 2015 to December 31, 2018. The PM2.5 and PM10 observation at national stations in each city is operated by the Ministry of Ecology and Environment of the People’s Republic of China, and the data are released on the website (http://www.mee.gov.cn/) of the China Ministry of Ecology and Environment in real-time.
At this stage, Aerosol Optical Depth (AOD) can be obtained from both ground-based and satellite based remote sensing. As shown in Figure 1, ground-based remote sensing of AOD used in this study was obtained from Aerosol Robotic Network (AERONET, https://aeronet.gsfc.nasa.gov/). This data was obtained through a multi-band solar photometer (CE-318). AERONET has accumulated a large amount of AOD data worldwide, with long time series and high accuracy, and is widely used as a standard for satellite inversion accuracy verification. In addition, this study takes use of atmospheric aerosol optical, physical, chemical, and radiation characteristics data obtained from long-term observations of the Solar-Sky Radiometer Observation Network (SONET, http://www.sonet.ac.cn) of the Chinese Academy of Sciences (Li et al., 2018; Li et al., 2019). It should be noted that the AOD data is not separately analyzed and calculated in this study, but is mainly used for comparison of results in the discussion.
PM2.5/PM10 ratio can provide information about the aerosol particle size distribution, based on which we would propose a method to classify aerosol types by setting up some threshold values. As shown later in Aerosol Type Classification Method UsingPM2.5/PM10Ratios section, one variable we mainly take use for aerosol type classification is the PDF distribution of PM2.5/PM10 ratios (Markonis et al., 2019), and the specific formula is as follows,
where P (a ≤ x ≤ b) is the probability of occurrence for PM2.5/PM10 ratios with values between a and b, and fX(x) is frequency of occurrence of PM2.5/PM10 ratios at a specific value of x between a and b.
In this study, we proposed the aerosol type classification method based on the spatiotemporal analysis of PM2.5/PM10 ratios. As indicated earlier, the classification takes use of the PDF of PM2.5/PM10 ratios, along with the skewness and kurtosis of related variables. Skewness is a measure of the direction and degree of skew of statistical data distribution, and is a numerical feature of the degree of asymmetry of statistical data distribution. The skewness includes normal distribution (Skewness = 0), right skewed distribution (Skewness >0), and left skewed distribution (Skewness <0). Kurtosis is a characteristic number that represents the peak value of PDF at the average value. Generally speaking, Kurtosis >0 represents a peak distribution, and Kurtosis <0 indicates a flat distribution (Fu and Pawlowski, 2016; Cain et al., 2017; Mei et al., 2017).
The specific classification methods are shown in Figure 2. First, we list the PDF of PM2.5/PM10 ratios at all stations, which are shown in Supplementary Figures S1–S5. Second, we analyze the PDF distribution type to examine whether it is unimodal or bimodal distribution. If the PDF is a bimodal distribution, the aerosol particle type at this site is preliminarily judged as a mixed type (type II). These cities include Shaoxing, Urumqi, Karamay, Xishuangbanna, Changji and Wujiaqu. Third, we further examine the range of peaks at all stations showing a single-peak distribution. The aerosol particles with PDF peak value <0.4 are classified as dust type (type I); with PDF peak value ranging from 0.4 to 0.6 are classified as the mixed type (type II); and those with PDF peak value >0.6 are classified as the anthropogenic type (type III). Fourth, according to the Kurtosis of the PDF distribution at each site, we determine whether the aerosols belong to the typical category under this broad category. If kurtosis ≥0, it means that the site’s PDF distribution is concentrated, which is a typical category of the type; if kurtosis <0, it means that the site’s PDF distribution is flat, which is an atypical category of the type. For example, when kurtosis ≥0, the dust type aerosol is classified as the typical dust type (type IA), otherwise it is the atypical dust type (type IB). Fifth, considering that the atypical mixed type is relatively complex, we further judged the type IIB according to Skewness. When Skewness <0, it indicates that the site belongs to the mixed type that is more polluted by anthropogenic; and when Skewness >0, it belongs to the mixed type that is more polluted by dust. It should be noted that although the selection of 0.4 and 0.6 as the classification criteria is subjective to a certain degree, it is consistent with the classification results of urban pollution types in previous studies (Wang et al., 2015; Xu et al., 2017; Tian et al., 2018). In addition, every 0.1 change in the threshold will cause approximately 3.8–7.1% of urban aerosol types to change.
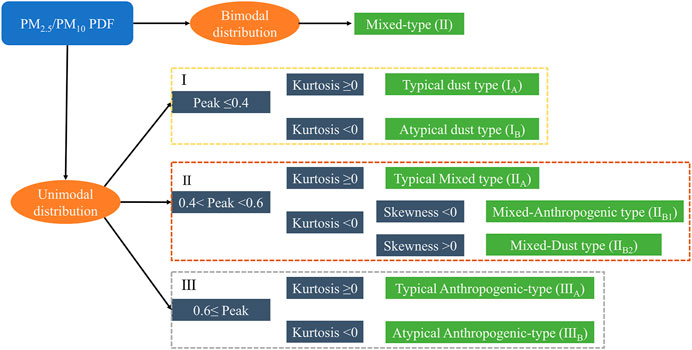
FIGURE 2. Flow chart of urban pollution classification method proposed in this study based on the PM2.5/PM10 ratios.
Cities classified according to this method can be summarized into three major categories of dust type (I), mixed type (II), and anthropogenic type (III), and seven small categories of typical dust type (IA) and atypical dust type (IB), typical mixed type IIA), mixed-anthropogenic type (IIB1) and mixed-dust type (IIB2), typical anthropogenic type (IIIA) and atypical anthropogenic type (IIIB) (Figures 2, 3). Figure 3 shows the PDF distributions over seven typical cities for each small category. These cities are located in the regions of Qinghai-Tibet Plateau (Xining), North China (Shijiazhuang, Hohhot), Northwest China (Hetian), East China (Jiaxing, Huzhou) and Central China (Yiyang). Thus, the cities have their typical region representative. Figure 3 also shows the differences in coarse and fine aerosol particles among these regions. Based on this classification method, we can quantitatively separate various types of air pollution, which will be described in detail in Air Pollution Classification section.
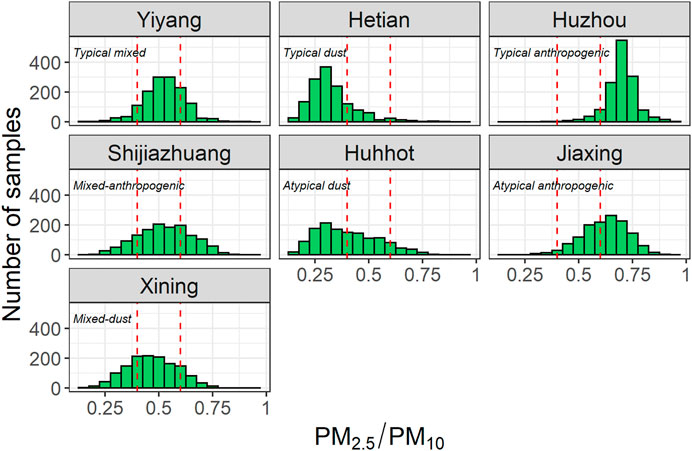
FIGURE 3. Schematic PDF distribution of PM2.5/PM10 ratios for seven types of urban pollution. The red dotted lines indicate the PM2.5/PM10 ratios of 0.4 and 0.6, respectively.
From 2015 to 2018, the annual average mass concentrations of PM2.5 and PM10 at all sites in China showed a decreasing trend (Figure 4). The average annual mass concentrations of PM2.5 in the 4 years are 48.63, 45.00, 42.91, and 38.08 μg m−3, and that for PM10 are 85.13, 80.77, 78.76 and 74.37 μg m−3 respectively. According to the China ambient air quality standards GB3095-2012 (http://www.mee.gov.cn/), the annual average concentration limits of PM2.5 and PM10 for good air quality are 35 and 70 μg m−3, respectively. As a result, the annual average concentration of PM2.5 exceeded the standard by 38.9 and 8.8% in 2015 and 2018, respectively; and the annual average concentration of PM10 exceeded the standard by 21.6 and 6.2% in 2015 and 2018, respectively. Same as the findings from previous studies (Wang et al., 2015; Zhang et al., 2019; Fan et al., 2020), PM2.5 has been the focus of air pollution control since 2013, so the rate of its decline has been faster than other air pollutants. Although PM10 declined more slowly, it is closer to the limit of air quality standards than PM2.5. While there is a decreasing trend, PM in the winter of 2016/2017 has not decreased significantly, as shown in Figure 4. This is because two large-scale severe haze events occurred in northern China at that time in winter, which even reached the highest level of air quality warning degree in China (An et al., 2019). The annual average change of PM2.5/PM10 ratios was similar as the change of PM2.5 and PM10 concentrations, and decreased from 0.57 in 2015 to 0.54 in 2018, which suggests that the proportion of fine PM in China is also slowly decreasing.
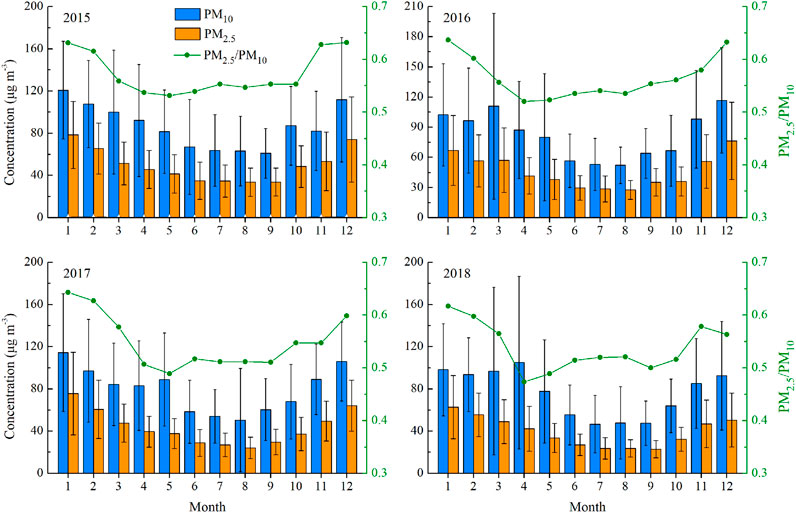
FIGURE 4. The monthly variation of average PM concentrations (PM2.5 and PM10) and PM2.5/PM10 ratios obtained from all national stations in 2015, 2016, 2017 and 2018.
Figure 4 also shows the monthly changes of PM2.5, PM10 and PM2.5/PM10 ratios during the study period. The monthly average PM2.5 has a clear seasonal variation in each year, high in winter and low in summer. This seasonal distribution of PM2.5 is associated with the combined effects of anthropogenic emissions and meteorology (Chu et al., 2015; An et al., 2019; Sun et al., 2019; Zhao et al., 2019; Fan et al., 2020). The relatively large amount of pollutant emissions in winter determine the high level of air pollution, and the meteorological conditions with more stable atmospheric status and less wet deposition are unfavorable for diffusion and removal of air pollutants in winter (Wang et al., 2015; Xu et al., 2017). PM10 is higher in winter and spring, especially in 2016 and 2018. The highest monthly average PM10 values appeared in March and April, with the largest standard deviation in spring. This suggests that the PM10 is more from natural sources (such as sandstorm), and the emission reduction treatment may only be effective for coarse particles emitted from anthropogenic sources (Khodeir et al., 2012; Chen et al., 2017; Yuan et al., 2019).
The seasonal variation of monthly average PM2.5/PM10 ratios is not completely consistent with that of PM2.5 and PM10. The highest PM2.5/PM10 ratio values occur in winter and the lowest values occur in April and May. The occurrence of the low PM2.5/PM10 ratio values may be directly related to the high values of PM10 from dust in spring. The PM2.5/PM10 ratios have very gentle variation from April to October in each year, with values about 0.55 in 2015–2016 and about 0.5 in 2017–2018. This also suggests that the monthly average of PM2.5/PM10 ratios in China has slightly declined for recent years, but the weak monthly variation pattern from spring to autumn remains basically unchanged.
We visualize the PM2.5/PM10 ratios at each site in the national map in four seasons (Figure 5) and find that the spatial distributions of PM2.5/PM10 ratios among the four seasons are significantly different. Almost at all stations there are the highest PM2.5/PM10 ratios in winter, and the PM2.5/PM10 ratios in the cities east of “Hu-Line” and the northern Xinjiang region in winter all reach above 0.6. As indicated earlier, this seasonal variation may be related to more emission in winter than in other seasons form the coal-fired heating and industrial activities in these areas, along with the more unfavorable meteorological conditions for diffusion (Huang et al., 2014; An et al., 2019). In the southern region, the humidity is relatively high in winter, and particle hygroscopic growth will further increase the proportion of fine particles (Xu et al., 2017; Zhao et al., 2018a; Yang et al., 2019). Therefore, the current “Hu-Line” still has a certain indicating significance not only for the speed of China’s economic development, but also for the classification of urban air pollution types.
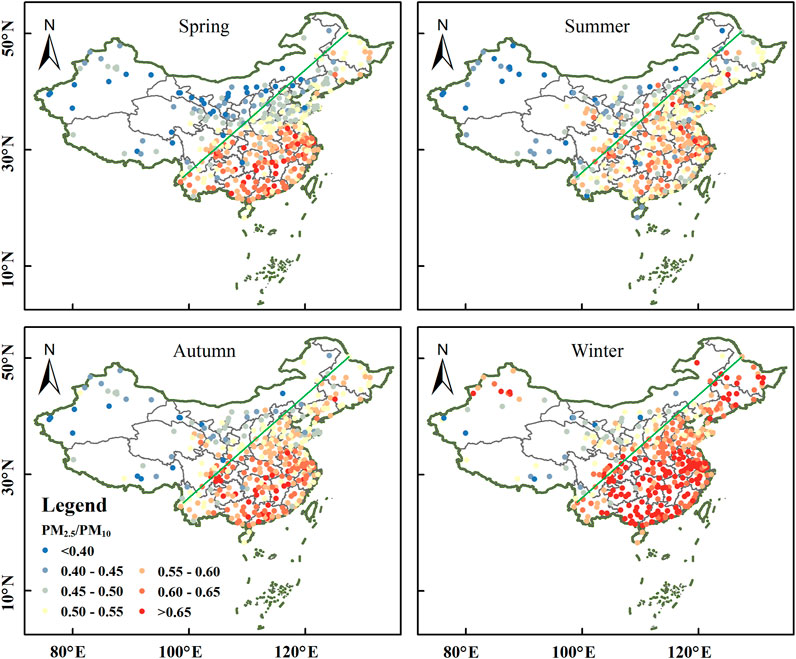
FIGURE 5. The spatial distributions of averaged PM2.5/PM10 ratios at national sites in China for four seasons of spring, summer, autumn and winter during the study period from 2015 to 2018. The green line represents the Hu-line.
In spring, China inland areas warm up to accelerate air drying with sparse natural vegetation (Fan et al., 2018), and windy weather condition causes sand and dust to travel from northwest China to the coast (Chen et al., 2017; Yuan et al., 2019), which results in high PM10 and low PM2.5/PM10 ratios in more cities in spring. The contrast is obvious at the Qinling Mountains—Huaihe River Line, in which the PM2.5/PM10 ratio is higher in the south with values almost all above 0.55, and lower in the north with values almost all below 0.5 except for a few cities in the northeast. We also find that the PM2.5/PM10 ratios in cities in the southern region are higher than that in northern regions in all four seasons, which implies that although there is more serious air pollution in north China regions such as the North China Plain and Fenwei Plain, the proportion of fine particles is higher in south China region.
In summary, the seasonal changes in the ratio of PM2.5/PM10 are mainly due to changes in anthropogenic emission and meteorological conditions in different seasons. Specifically, the higher ratio of PM2.5/PM10 in winter was mainly caused by higher emissions from heating and more stagnant weather conditions (Wang et al., 2015). On the contrary, more precipitation in summer and more sandstorms in spring result in a relatively low ratio of PM2.5/PM10 (Wang et al., 2015; Fan et al., 2020). Combined with previous studies (Zhang et al., 2019; Fan et al., 2020), the year-to-year decrease in the PM2.5/PM10 ratio found in this study should be mainly caused by rigid air quality control policies and emission reduction measures in recent years. As for the difference in the ratio of PM2.5/PM10 between regions, it is closely related to the effectiveness of governance, meteorology, and the background value of local pollution. For example, the North China has a relatively high PM10 due to the impact of dust, while southern China is more susceptible to the impact of monsoon precipitation, resulting in relatively low PM10.
We analyze the spatial distribution of PM2.5/PM10 ratios in 31 provinces along with the annual average of PM2.5 concentration in each province from 2015 to 2018, which is shown in Figure 6. Each column in Figure 6 represents the relative difference of annual average PM2.5/PM10 ratio at each province compared with the national average in every year from 2015 to 2018, which provides information about the spatial change of the fine particle proportion in 31 provinces. The high-value areas are mainly concentrated in the provinces in the North China Plain and surrounding provinces as well as Xinjiang Autonomous, which is consistent with the findings from previous studies (Huang et al., 2014; Fan et al., 2020).
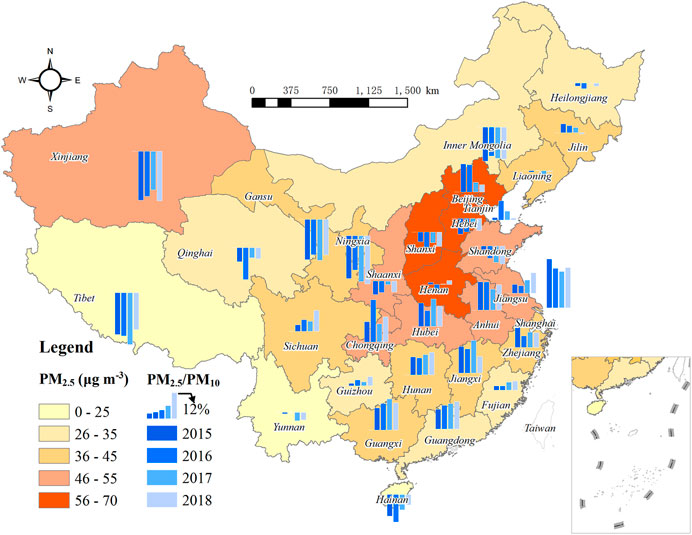
FIGURE 6. The spatial distribution of PM2.5/PM10 ratios in 31 provinces along with the annual average of PM2.5 concentration in each province from 2015 to 2018.
Figure 6 shows that PM2.5/PM10 ratios in Xinjiang, Tibet, Gansu, Inner Mongolia, Ningxia, Qinghai, and Hainan are far lower than the national average. All of these provinces are inland provinces in northwestern China except Hainan, with no obvious inter-annual changes of PM2.5/PM10 ratios during the study period. The PM2.5/PM10 ratios in the three northeast provinces are close to the national average. The four-year averages of PM2.5/PM10 ratios in Heilongjiang and Liaoning are lower than the national averages by 1.4 and 0.6%, respectively. In Jilin province, the PM2.5/PM10 ratios show a decreasing trend during the study period compared to the national averages, with values from 4.2% higher in 2015 to 0.7% lower than the national average in 2018. Except for Yunnan and Hainan provinces in southern China, the PM2.5/PM10 ratios in all other provinces have increasing trends during the study period compared to the national averages. Among them, Shanghai is the province with the highest PM2.5/PM10 ratios in the country for each year during the study period, with an average value of 19.6% higher than the national average during the four years. The proportions of fine particles to total in Sichuan, Chongqing, Guizhou, Guangxi, Guangdong, Hunan, Fujian and Jiangsu show increasing trends to varying degrees relatively to the national average. The changes of PM2.5/PM10 ratios in the northern and central provinces where air pollution is severe are even more complicated. PM2.5/PM10 ratios in Hebei, Shanxi, Shandong, and Shaanxi are lower than the national average, while Henan Province fluctuates between -1.8% below the national average and 2.2% above the national average. The PM2.5/PM10 ratios in Beijing and Tianjin have fallen rapidly compared to the national averages, decreasing by 9.9 and 8.3% respectively in four years. The results shown here also suggest that there is no clear relationship between the temporal variations of PM2.5 concentrations and PM2.5/PM10 ratios in each province. Table 1 further visually shows the changes in the ratio of PM2.5/PM10 in each province from 2015 to 2018, and whether it is significantly different from the national average. It clearly shows that the ratio of PM2.5/PM10 in each province is basically a downward trend from 2015 to 2018, which reflects the efficiency of air pollution control. Moreover, the ratio of PM2.5/PM10 in some provinces in southern China, such as Guangdong, Guangxi, and Jiangxi, is significantly higher than the national average, while provinces in northern China, such as Gansu, Ningxia, and Inner Mongolia, have the opposite result.
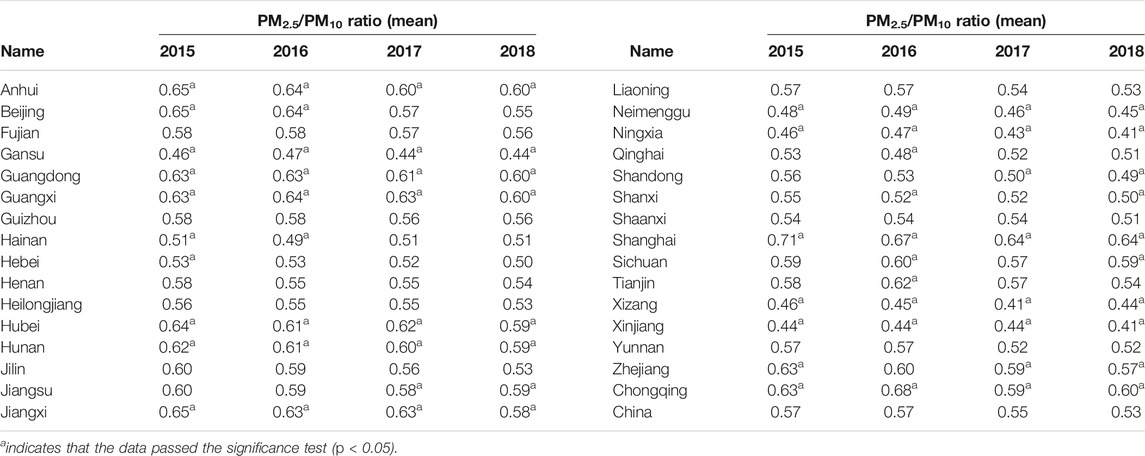
TABLE 1. The changes in the ratio of PM2.5/PM10 in each province and the country from 2015 to 2018.
PM2.5/PM10 ratios could provide the pollution source information (such as natural or anthropogenic sources) to some extent. As shown in Figures 7, 8, the PM2.5/PM10 ratios can serve as an extra indicator in addition to PM2.5 or PM10, and provide information about the aerosol types. PM2.5/PM10 ratios have no significant correlations with PM2.5 and PM10, as shown in Figures 7A,B. In contrast, Figure 7C has shown that PM2.5 and PM10 have a good linear relationship at the provincial level with R2 between 0.65 and 0.76, which passes the significance test (p < 0.001). This high correlation is consistent with the findings from previous researches (Wang et al., 2015; Kong et al., 2016; Talbi et al., 2018). In order to investigate the potential effects from different spatial scales, we also perform an analysis based on 367 site observations, which is shown in Figure 8. Figure 8A shows that the fitting trend of PM2.5/PM10 ratios and PM2.5 is almost parallel to the X axis, and the correlation is extremely low (0< R2 <0.04). Although PM2.5/PM10 ratios and PM10 have a negative linear relationship, the correlation is also low (0.07< R2 <0.21) as shown in Figure 8B. The negative relationship between PM2.5/PM10 ratios and PM10 is mainly due to a small amount of PM10 observations with concentrations greater than 175 μg m−3, which makes this relationship highly unreliable. In contrast, Figure 8C shows that PM2.5 and PM10 have a good linear correlation by using site observations with R2 between 0.64 and 0.79 (p < 0.001). In addition, it is found that the relationships found in Figure 8 vary little with time of year during the study period. All of these analysis results indicate that PM2.5/PM10 ratios can serve as an independent indicator of aerosol pollution.
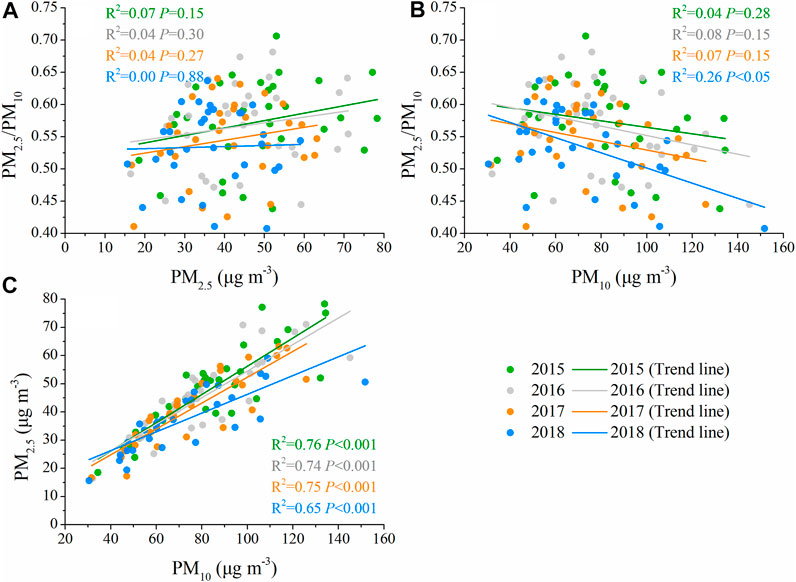
FIGURE 7. The scattered plots among PM2.5, PM10, and PM2.5/PM10 ratios at the provincial level during the study period. The green, gray, orange and blue colors are for data in year 2015, 2016, 2017 and 2018, respectively. (A–C) represent the correlation between PM2.5/PM10 and PM2.5, PM2.5/PM10 and PM10, and PM2.5 and PM10, respectively.
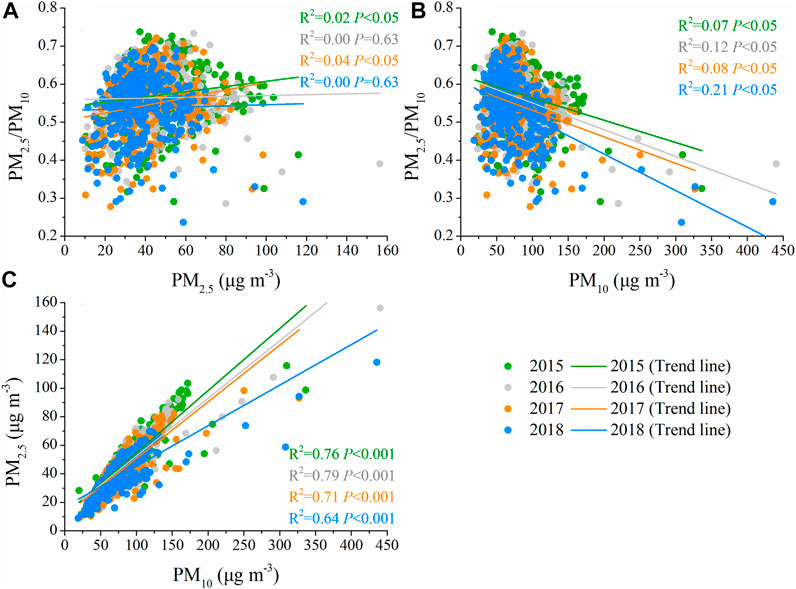
FIGURE 8. The scattered plots among the PM2.5, PM10 and PM2.5/PM10 ratios obtained from all national ground sites during the study period. The green, gray, orange and blue colors are for data in year 2015, 2016, 2017 and 2018, respectively. (A–C) represent the correlation between PM2.5/PM10 and PM2.5, PM2.5/PM10 and PM10, and PM2.5 and PM10, respectively.
We here use hourly PM2.5/PM10 ratio data from 367 sites in China during the study period to classify the characteristics of near surface air pollution. The detailed classification method and process have been given in Aerosol Type Classification Method Using PM2.5/PM10Ratios section, with the framework shown in Figure 2. Figure 9 shows the results of our classification. As shown, cities classified as sand and dust pollution (type I) are located in the west and north of “Hu-Line”; mixed pollution (type II) cities are mainly located near “Hu-Line,” North China Plain, Yunnan Provinces and some coastal cities; and anthropogenic pollution (type III) cities are almost all located in the southeast of “Hu-Line.”
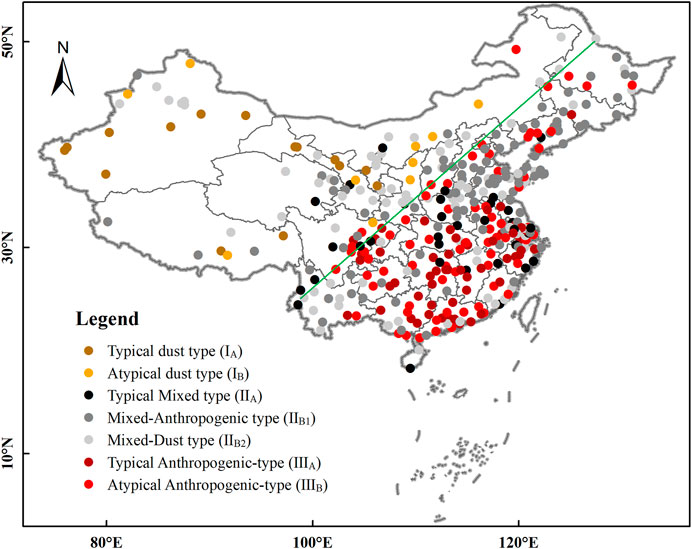
FIGURE 9. The spatial distribution of urban pollution classification results based on the PM2.5/PM10 rations using our proposed method. The colors represent the seven different classification methods and the green line indicates the Hu-line.
The desert and Gobi in China are mainly located in the northwest inland region. In addition, the central and western regions of the Inner Mongolia Plateau and the Qinghai-Tibet Plateau together form the main area of the west of the “Hu-Line.” The vegetation coverage is low in the northwest inland region (Chen et al., 2017; Fan et al., 2018; Yuan et al., 2019), and the absolute quantity and proportion of PM10 affected by natural sources are relatively high (Figures 3, 4). In recent years, the development of capital cities of every province and some industrial cities in northwestern China has increased the proportion of fine particles. Therefore, we found that industrial cities such as Lanzhou-Xining City Group, Urumqi, Yinchuan, and Baotou have shown mixed pollution type of aerosols.
Our analysis finds that in the cities of Sichuan Basin, central China, southern coast, and eastern China, the PM particles are mostly from anthropogenic pollution. The common characteristics of these regions are rapid industrial development, high urbanization rate, and high anthropogenic emissions (Wu et al., 2015; Liu et al., 2018; Xu et al., 2020). At the same time, these areas are far away from the natural sand and dust sources. Correspondingly, the dust particles caused by strong winds in spring in these areas are far less than that in those cities in Northwest and North China. In addition, the overall environmental humidity in the south is higher than that in the north, and the hygroscopic growth of new particles may also increase the proportion of PM2.5 (Zhao et al., 2018a; Wang et al., 2020). Therefore, under the combined effect of multiple causes, it appears as a type of anthropogenic pollution in the cities of Sichuan Basin, central China, southern coast, and eastern China. The North China Plain area is more susceptible to dust transport than the South, especially in spring (Chen et al., 2017; Yuan et al., 2019; Fan et al., 2020). Therefore, although the absolute amount of PM2.5 concentration in the North China Plain is the highest in the country, the proportion of fine particles is not the highest. This is also an important reason for more mixed pollution in the cities of the North China Plain.
While the PM concentration is found mainly determined by emissions, meteorological factors also play an important role by affecting the diffusion and generation of pollutants. Related studies (Yang et al., 2016; Zhou et al., 2016; Zhao et al., 2019) have shown that wind speed and PM2.5 concentration are usually negatively correlated, and if no precipitation occurs, relative humidity (RH) is generally positively correlated with PM2.5 concentration. Our research results also found that the ratio of PM2.5/PM10 in southern cities in China tends to be higher due to higher RH in winter (Figure 5). In this regard, emissions likely play a leading role in the ratio of PM2.5/PM10 at long time scale over a region with similar climatology. In contrast, when there is no significant difference in emissions, meteorological factors are more likely to play an important role.
Based on the analysis in the previous three sections, it can be found that PM2.5/PM10 ratios are important in indicating air pollution type and have very weak dependence on either PM2.5 or PM10. Currently, there are several studies that classified the “basic mode” (Li et al., 2019) and types of regional aerosols in China (Tian et al., 2018) using the ground-based observational data from aerosol remote sensing. However, ground-based aerosol remote sensing observation stations in China are very limited and unevenly distributed, as shown in Figure 1. Moreover, the remote sensing observations of aerosol properties generally represent the characteristics of aerosols at high altitudes, which is difficult or has relatively large uncertainties to represent the aerosol characteristics near surface. Compared with previous studies, this study breaks through the limitations of ground remote sensing sites and develops a nation-scale classification method for the proportion of fine particles, and comprehensively analyzes its environmental indicators (e.g., aerosol types).
Our research uses nation-scale ground-based observation data for multi-regional analysis and proposes a reliable aerosol type classification method. Using ground site observations at 24 sites in China, Wang et al. (2015) showed that PM2.5/PM10 ratios in western and northeastern cities in China are low, and that in northern and southwestern China are medium, and the highest values are in Yangtze River cities. Differently, we here have analyzed the PM2.5/PM10 ratios along with the PM2.5 and PM10 characteristics using much more ground stations and carried out the analysis from a national perspective with more findings including the aerosol type classification method and aerosol type distributions separated by the Hu-line.
In addition, we also evaluate the results of aerosol type classification based on AERONET site data (Kong et al., 2016; Tian et al., 2018) and aerosol modal division using SONET site data (Li et al., 2018; Li et al., 2019), which shows that the PM2.5/PM10 ratios calculated based on ground station observations provide consistent pollution type classification results. Our method is developed based on near-surface observation data, providing valuable aerosol type information of all provinces in mainland China, which is particularly helpful to the air quality control policy making for all provinces. It is very important to note that our current research only focuses on PM data from terrestrial ground observation sites with insufficient consideration of the chemical composition of aerosols. As the results show, there are mixed dust types in some cities in southern China, which are more likely affected by sea salt aerosols. Therefore, uncertainties could exist and further in-depth analysis for cities close to ocean is necessary in future.
Based on Figure 9, we have further divided the different seasons, and the results are shown in Figure 10. Like the previous analysis, there are more cities with anthropogenic type and dust type in winter and spring, and more cities with mixed type in summer and autumn. At the same time, we found that the ratio of PM2.5/PM10 changes all the time, so it is difficult to give a unique type of air pollution in a city. Obviously, the ratio of PM2.5/PM10 is constantly changing, so it is difficult to give the only type of air pollution in the city. Even though, our study provides a reference for changes in macroscopic air pollution characteristics.
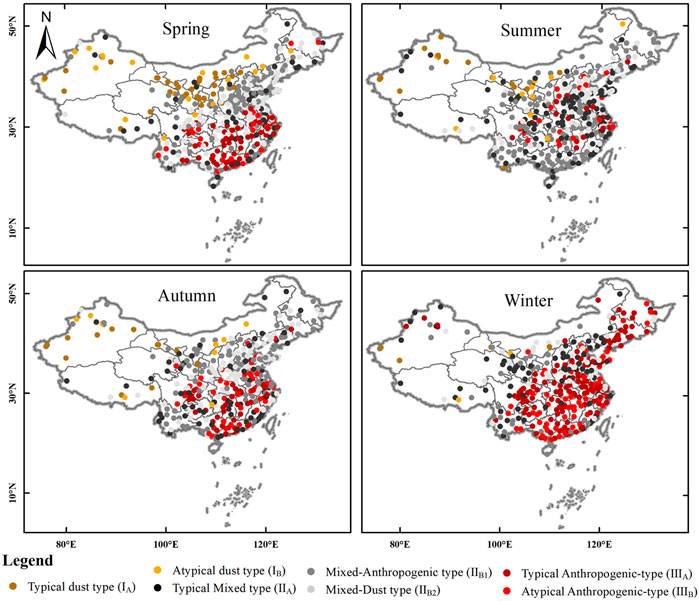
FIGURE 10. The spatial distribution of urban pollution classification results based on the ratio of PM2.5/PM10 in the four seasons.
With the PM2.5, PM10 concentration data from 367 cities, we investigate their temporal trends from 2015 to 2018, and analyze the spatiotemporal features of PM2.5/PM10 ratios at country level and provincial level. Moreover, we propose an air pollution type division method and classify the pollution types based on PM2.5/PM10 ratios.
During the study period, the concentrations of PM2.5 and PM10 show a significant declining trend. The annual average value of PM2.5/PM10 ratios also decreases year by year, but the change is small. PM2.5, PM10 and PM2.5/PM10 ratios all have obvious monthly and seasonal variations during the study period. Among them, PM2.5/PM10 ratios are the highest in winter, the lowest in spring, and are similar in summer and autumn with little fluctuation.
The PM2.5/PM10 ratios show clear spatial distribution. The PM concentration in southern China is relatively low, but PM2.5/PM10 ratios are higher than the national average, implying the dominance of anthropogenic pollution in the emission sources. Northwest China and North China are affected by more dust aerosols, while air particles in the south are more likely to absorb moisture and grow. Therefore, the PM2.5/PM10 ratios continue to increase from the northwest and north to the south. In China, PM2.5 and PM10 have a very good correlation at both the station scale and provincial scale, while PM2.5/PM10 ratios have no significant correlations with PM2.5 and PM10. The independence of PM2.5/PM10 ratio on either PM2.5 or PM10 indicates that it can serve as another variable to present the air pollution characteristics.
Using multi-year observation data, we propose an air pollution classification method based on PM2.5/PM10 ratios, which classifies the air pollution into three basic types and seven refined types. Roughly, cities classified as sand and dust pollution (basic type I) are located in the west and north of “Hu-Line”; mixed pollution (basic type II) cities are mainly located near “Hu-Line,” North China Plain, Yunnan Provinces and some coastal cities; and anthropogenic pollution (basic type III) cities are almost all located in the southeast of “Hu-Line.” In China, regional aerosol characteristics are very different, and changes in the proportion of fine particles at surface observation stations can provide information about the process of pollution discharge and weather impact. Obviously, our methods and research results provide support to better understand the formation mechanism of air pollution and evaluate its impact on human health, weather and climate.
The original contributions presented in the study are included in the article/Supplementary Material, further inquiries can be directed to the corresponding author.
CZ coordinated and supervised the project. CZ, HF, YY, and XY contributed to data analysis, research framework design, and writing the first drafts. HF prepared data and completed all figures. CZ revised the manuscript. All co-authors contributed to the interpretation of the results and to the text.
This research was funded by the National Natural Science Foundation of China, grant number 41925022, and 91837204; the National Key R&D Program on Monitoring, Early Warning and Prevention of Major Natural Disasters, grant number 2017YFC1501403; and the State Key Laboratory of Earth Surface Processes and Resources Ecology. The data used in this study is available at the website http://www.mee.gov.cn/ or by request to HF via ZmFuaGFvX2dlb0AxNjMuY29t.
The authors declare that the research was conducted in the absence of any commercial or financial relationships that could be construed as a potential conflict of interest.
The Supplementary Material for this article can be found online at: https://www.frontiersin.org/articles/10.3389/fenvs.2021.692440/full#supplementary-material
An, Z., Huang, R.-J., Zhang, R., Tie, X., Li, G., Cao, J., et al. (2019). Severe Haze in Northern China: A Synergy of Anthropogenic Emissions and Atmospheric Processes. Proc. Natl. Acad. Sci. USA 116 (18), 8657–8666. doi:10.1073/pnas.1900125116
Cain, M. K., Zhang, Z., and Yuan, K.-H. (2017). Univariate and Multivariate Skewness and Kurtosis for Measuring Nonnormality: Prevalence, Influence and Estimation. Behav. Res. 49 (5), 1716–1735. doi:10.3758/s13428-016-0814-1
Chen, S., Huang, J., Kang, L., Wang, H., Ma, X., He, Y., et al. (2017). Emission, Transport, and Radiative Effects of mineral Dust from the Taklimakan and Gobi Deserts: Comparison of Measurements and Model Results. Atmos. Chem. Phys. 17 (3), 2401–2421. doi:10.5194/acp-17-2401-2017
Chu, H.-J., Huang, B., and Lin, C.-Y. (2015). Modeling the Spatio-Temporal Heterogeneity in the PM10-PM2.5 Relationship. Atmos. EnvironmentEnviron. 102, 176–182. doi:10.1016/j.atmosenv.2014.11.062
Ding, J., Miyazaki, K., van der A, R. J., Mijling, B., Kurokawa, J.-i., Cho, S., et al. (2017). Intercomparison of NOx Emission Inventories over East Asia. Atmos. Chem. Phys. 17 (16), 10125–10141. doi:10.5194/acp-17-10125-2017
Eeftens, M., Tsai, M.-Y., Ampe, C., Anwander, B., Beelen, R., Bellander, T., et al. (2012). Spatial Variation of PM2.5, PM10, PM2.5 Absorbance and PMcoarse Concentrations between and within 20 European Study Areas and the Relationship with NO2 - Results of the ESCAPE Project. Atmos. Environ. 62, 303–317. doi:10.1016/j.atmosenv.2012.08.038
Fan, H., Zhao, C., and Yang, Y. (2020). A Comprehensive Analysis of the Spatio-Temporal Variation of Urban Air Pollution in China during 2014-2018. Atmos. Environ. 220, 117066. doi:10.1016/j.atmosenv.2019.117066
Fan, H., Zhao, W., Daryanto, S., Fu, B., Wang, S., and Wang, Y. (2018). Vertical Distributions of Soil Organic Carbon and its Influencing Factors under Different Land Use Types in the Desert Riparian Zone of Downstream Heihe River Basin, China. J. Geophys. Res. Atmos. 123 (14), 7741–7753. doi:10.1029/2018jd028268
Franzin, B. T., Guizellini, F. C., de Babos, D. V., Hojo, O., Pastre, I. A., Marchi, M. R. R., et al. (2020). Characterization of Atmospheric Aerosol (PM10 and PM2.5) from a Medium Sized City in São Paulo State, Brazil. J. Environ. Sci. 89, 238–251. doi:10.1016/j.jes.2019.09.014
Fu, W.-j., and Pawlowski, J. M. (2016). Correlating the Skewness and Kurtosis of Baryon Number Distributions. Phys. Rev. D. 93 (9), 091510. doi:10.1103/PhysRevD.93.091501
Gu, Y., Xue, Y., De Sales, F., and Liou, K. N. (2016). A GCM Investigation of Dust Aerosol Impact on the Regional Climate of North Africa and South/East Asia. Clim. Dyn. 46, 2353–2370. doi:10.1007/s00382-015-2706-y
Huang, R.-J., Zhang, Y., Bozzetti, C., Ho, K.-F., Cao, J.-J., Han, Y., et al. (2014). High Secondary Aerosol Contribution to Particulate Pollution during Haze Events in China. Nature 514 (7521), 218–222. doi:10.1038/nature13774
Hvidtfeldt, U. A., Sørensen, M., Geels, C., Ketzel, M., Khan, J., Tjønneland, A., et al. (2019). Long-term Residential Exposure to PM2.5, PM10, Black Carbon, NO2, and Ozone and Mortality in a Danish Cohort. Environ. Int. 123, 265–272. doi:10.1016/j.envint.2018.12.010
Khodeir, M., Shamy, M., Alghamdi, M., Zhong, M., Sun, H., Costa, M., et al. (2012). Source Apportionment and Elemental Composition of PM2.5 and PM10 in Jeddah City, Saudi Arabia. Atmos. Pollut. Res. 3 (3), 331–340. doi:10.5094/apr.2012.037
Kong, L., Xin, J., Liu, Z., Zhang, K., Tang, G., Zhang, W., et al. (2017). The PM2.5 Threshold for Aerosol Extinction in the Beijing Megacity. Atmos. Environ. 167, 458–465. doi:10.1016/j.atmosenv.2017.08.047
Kong, L., Xin, J., Zhang, W., and Wang, Y. (2016). The Empirical Correlations between PM2.5, PM10 and AOD in the Beijing Metropolitan Region and the PM2.5, PM10 Distributions Retrieved by MODIS. Environ. Pollut. 216, 350–360. doi:10.1016/j.envpol.2016.05.085
Lelieveld, J., Evans, J. S., Fnais, M., Giannadaki, D., and Pozzer, A. (2015). The Contribution of Outdoor Air Pollution Sources to Premature Mortality on a Global Scale. Nature 525 (7569), 367–371. doi:10.1038/nature15371
Li, Z. Q., Xu, H., Li, K. T., Li, D. H., Xie, Y. S., Li, L., et al. (2018). Comprehensive Study of Optical, Physical, Chemical, and Radiative Properties of Total Columnar Atmospheric Aerosols over China: An Overview of Sun-Sky Radiometer Observation Network (SONET) Measurements. B. Am. Meteorol. Soc. 99 (4), 739–755. doi:10.1175/bams-d-17-0133.1
Li, Z., Zhang, Y., Xu, H., Li, K., Dubovik, O., and Goloub, P. (2019). The Fundamental Aerosol Models over China Region: A Cluster Analysis of the Ground‐Based Remote Sensing Measurements of Total Columnar Atmosphere. Geophys. Res. Lett. 46 (9), 4924–4932. doi:10.1029/2019gl082056
Liao, H., Chang, W., and Yang, Y. (2015). Climatic Effects of Air Pollutants over china: A Review. Adv. Atmos. Sci. 32, 115–139. doi:10.1007/s00376-014-0013-x
Liu, L., Chen, Y., Wu, T., and Li, H. (2018). The Drivers of Air Pollution in the Development of Western China: The Case of Sichuan Province. J. Clean. Prod. 197, 1169–1176. doi:10.1016/j.jclepro.2018.06.260
Markonis, Y., Papalexiou, S. M., Martinkova, M., and Hanel, M. (2019). Assessment of Water Cycle Intensification over Land Using a Multisource Global Gridded Precipitation DataSet. J. Geophys. Res. Atmos. 124 (21), 11175–11187. doi:10.1029/2019jd030855
Mei, D., Liu, J., Ma, F., and Chen, W. (2017). Forecasting Stock Market Volatility: Do Realized Skewness and Kurtosis Help?. Physica A: Stat. Mech. its Appl. 481, 153–159. doi:10.1016/j.physa.2017.04.020
Shi, X., Zhao, C., Jiang, J. H., Wang, C., Yang, X., and Yung, Y. L. (2018). Spatial Representativeness of PM 2.5 Concentrations Obtained Using Observations from Network Stations. J. Geophys. Res. Atmos. 123, 3145–3158. doi:10.1002/2017JD027913
Sun, Y., Zhao, C., Su, Y., Ma, Z., Li, J., Letu, H., et al. (2019). Distinct Impacts of Light and Heavy Precipitation on PM 2.5 Mass Concentration in Beijing. Earth Space Sci. 6 (10), 1915–1925. doi:10.1029/2019EA000717
Sweerts, B., Pfenninger, S., Yang, S., Folini, D., van der Zwaan, B., and Wild, M. (2019). Estimation of Losses in Solar Energy Production from Air Pollution in China since 1960 Using Surface Radiation Data. Nat. Energ. 4 (8), 657–663. doi:10.1038/s41560-019-0412-4
Talbi, A., Kerchich, Y., Kerbachi, R., and Boughedaoui, M. (2018). Assessment of Annual Air Pollution Levels with PM1, PM2.5, PM10 and Associated Heavy Metals in Algiers, Algeria. Environ. Pollut. 232, 252–263. doi:10.1016/j.envpol.2017.09.041
Tan, W., Li, C., Liu, Y., Meng, X., Wu, Z., Kang, L., et al. (2019). Potential of Polarization Lidar to Profile the Urban Aerosol Phase State during Haze Episodes. Environ. Sci. Technol. Lett. 7 (2), 54–59. doi:10.1021/acs.estlett.9b00695
Tian, P., Zhang, L., Ma, J., Tang, K., Xu, L., Wang, Y., et al. (2018). Radiative Absorption Enhancement of Dust Mixed with Anthropogenic Pollution over East Asia. Atmos. Chem. Phys. 18 (11), 7815–7825. doi:10.5194/acp-18-7815-2018
Wang, H., Wang, Q., Gao, Y., Zhou, M., Jing, S., Qiao, L., et al. (2020). Estimation of Secondary Organic Aerosol Formation during a Photochemical Smog Episode in Shanghai, China. J. Geophys. Res. Atmos. 125, e2019JD032033. doi:10.1029/2019JD032033
Wang, Y. Q., Zhang, X. Y., Sun, J. Y., Zhang, X. C., Che, H. Z., and Li, Y. (2015). Spatial and Temporal Variations of the Concentrations of PM10, PM2.5 and PM1 in China. Atmos. Chem. Phys. 15 (23), 13585–13598. doi:10.5194/acp-15-13585-2015
Wu, F., Wang, W., Man, Y. B., Chan, C. Y., Liu, W., Tao, S., et al. (2015). Levels of PM 2.5/PM 10 and Associated Metal(loid)s in Rural Households of Henan Province, China. Sci. Total Environ. 512-513, 194–200. doi:10.1016/j.scitotenv.2015.01.041
Xu, G., Jiao, L., Zhang, B., Zhao, S., Yuan, M., Gu, Y., et al. (2017). Spatial and Temporal Variability of the PM2.5/PM10 Ratio in Wuhan, Central China. Aerosol Air Qual. Res. 17 (3), 741–751. doi:10.4209/aaqr.2016.09.0406
Xu, X., Huang, G., Liu, L., Guan, Y., Zhai, M., and Li, Y. (2020). Revealing Dynamic Impacts of Socioeconomic Factors on Air Pollution Changes in Guangdong Province, China. Sci. Total Environ. 699, 134178. doi:10.1016/j.scitotenv.2019.134178
Yang, Q., Yuan, Q., Yue, L., Li, T., Shen, H., and Zhang, L. (2019). The Relationships between PM2.5 and Aerosol Optical Depth (AOD) in mainland China: About and behind the Spatio-Temporal Variations. Environ. Pollut. 248, 526–535. doi:10.1016/j.envpol.2019.02.071
Yang, X., Zhao, C., Guo, J., and Wang, Y. (2016). Intensification of Aerosol Pollution Associated with its Feedback with Surface Solar Radiation and Winds in Beijing. J. Geophys. Res. Atmos. 121, 4093–4099. doi:10.1002/2015JD024645
Yuan, T., Chen, S., Huang, J., Wu, D., Lu, H., Zhang, G., et al. (2019). Influence of Dynamic and Thermal Forcing on the Meridional Transport of Taklimakan Desert Dust in Spring and Summer. J. Clim. 32 (3), 749–767. doi:10.1175/jcli-d-18-0361.1
Zhang, Q., Zheng, Y., Tong, D., Shao, M., Wang, S., Zhang, Y., et al. (2019). Drivers of Improved PM2.5air Quality in China from 2013 to 2017. Proc. Natl. Acad. Sci. USA 116 (49), 24463–24469. doi:10.1073/pnas.1907956116
Zhao, B., Wu, W., Wang, S., Xing, J., Chang, X., Liou, K.-N., et al. (2017). A Modeling Study of the Nonlinear Response of fine Particles to Air Pollutant Emissions in the Beijing-Tianjin-Hebei Region. Atmos. Chem. Phys. 17, 12031–12050. doi:10.5194/acp-17-12031-2017
Zhao, C., Li, Y., Zhang, F., Sun, Y., and Wang, P. (2018a). Growth Rates of fine Aerosol Particles at a Site Near Beijing in June 2013. Adv. Atmos. Sci. 35 (2), 209–217. doi:10.1007/s00376-017-7069-3
Zhao, C., Lin, Y., Wu, F., Wang, Y., Li, Z., Rosenfeld, D., et al. (2018b). Enlarging Rainfall Area of Tropical Cyclones by Atmospheric Aerosols. Geophys. Res. Lett. 45 (16), 8604–8611. doi:10.1029/2018gl079427
Zhao, C., Wang, Y., Shi, X., Zhang, D., Wang, C., Jiang, J. H., et al. (2019). Estimating the Contribution of Local Primary Emissions to Particulate Pollution Using High-Density Station Observations. J. Geophys. Res. Atmos. 124 (3), 1648–1661. doi:10.1029/2018jd028888
Zhao, C., Yang, Y., Fan, H., Huang, J., Fu, Y., Zhang, X., et al. (2020). Aerosol Characteristics and Impacts on Weather and Climate over the Tibetan Plateau. Natl. Sci. Rev. 7 (3), 492–495. doi:10.1093/nsr/nwz184
Keywords: particulate matter, air pollution, PM2.5/PM10 ratios, China, pollution type
Citation: Fan H, Zhao C, Yang Y and Yang X (2021) Spatio-Temporal Variations of the PM2.5/PM10 Ratios and Its Application to Air Pollution Type Classification in China. Front. Environ. Sci. 9:692440. doi: 10.3389/fenvs.2021.692440
Received: 08 April 2021; Accepted: 01 June 2021;
Published: 14 June 2021.
Edited by:
Pasquale Sellitto, UMR7583 Laboratoire inter-universitaire des systèmes atmosphèriques (LISA), FranceReviewed by:
Qianqian Zhang, National Satellite Meteorological Center (NSMC), ChinaCopyright © 2021 Fan, Zhao, Yang and Yang. This is an open-access article distributed under the terms of the Creative Commons Attribution License (CC BY). The use, distribution or reproduction in other forums is permitted, provided the original author(s) and the copyright owner(s) are credited and that the original publication in this journal is cited, in accordance with accepted academic practice. No use, distribution or reproduction is permitted which does not comply with these terms.
*Correspondence: Chuanfeng Zhao, Y3poYW9AYm51LmVkdS5jbg==
Disclaimer: All claims expressed in this article are solely those of the authors and do not necessarily represent those of their affiliated organizations, or those of the publisher, the editors and the reviewers. Any product that may be evaluated in this article or claim that may be made by its manufacturer is not guaranteed or endorsed by the publisher.
Research integrity at Frontiers
Learn more about the work of our research integrity team to safeguard the quality of each article we publish.