- Institute of Geotechnics, Technische Universität Bergakademie Freiberg, Freiberg, Germany
Introduction: A better understanding of the relationship between water saturation and seismic characteristics of loosely deposited sand is crucial for assessing the liquefaction potential of open-pit mine dumps. The classic elastic models, based on Gassmann’s theory, are commonly used to constrain water saturation from seismic data. However, while effective at low frequencies, these models fail to capture macroscopic wave-induced fluid flow and poroelastic effects at higher frequencies, which may hinder the application of laboratory results to field conditions. In contrast, Biot’s poroelastic theory enables seismic wave propagation modeling across a broad frequency range.
Methods: To evaluate poroelastic effects in seismic monitoring, we compare elastic and poroelastic models in terms of wave velocities, Poisson’s ratio, P-wave travel time, and surface wave dispersion across different frequencies. Our study incorporates numerical simulations and experimental data to assess the extent of discrepancies between these models.
Results: Our findings show that the poroelastic model predicts seismic wave velocities with up to a 6% difference compared to the elastic model. While minimal differences are observed in field-scale surveys, the discrepancies become more significant in pilot plant experiments and ultrasonic measurements as frequency increases. These results highlight the influence of poroelastic effects, which are not captured adequately by elastic models at higher frequencies.
Discussion: The observed frequency-dependent discrepancies suggest that elastic models may be insufficient for high-frequency seismic applications. This underscores the need for improved methodologies that integrate poroelastic effects to enhance the scalability of laboratory findings to field conditions.
1 Introduction
Open-pit lignite mining operations often create mine dumps composed of loosely deposited sands with high porosity and permeability. The risk of liquefaction in these dumps increases when water levels rise due to rainfall or other factors, posing significant environmental and geotechnical challenges. The degree of saturation in these sands is crucial in assessing the liquefaction potential (Molina-Gómez et al., 2023). Therefore, accurate estimation of the spatial distribution of saturation in loosely deposited sands is essential to map the risk of liquefaction.
Seismic methods provide a non-invasive technique that can cover large areas quickly and efficiently to explore the saturation distribution in loosely deposited sediments. These methods can complement other techniques such as time-domain reflectometry (Fenta and Szanyi, 2021), remote sensing (Mohanty, 2013; Plati et al., 2020), and ground-penetrating radar (Moghadas et al., 2010) to obtain a comprehensive understanding of subsurface conditions (Milani et al., 2015; Solazzi et al., 2021). Successful monitoring of saturation distribution requires proper modeling of the physical properties of porous media, which provides a quantitative link between the physical properties of the media and the seismic response. Loosely deposited sand, being a highly porous medium, necessitates that the physical model accounts for poroelastic effects due to the interaction between soil particles and pore fluid, which impacts wave propagation. A common approach is to use the Gassmann theory (Gassmann, 1951; Wood, 1955) in the elastic model to emphasize fluid effects (Morency et al., 2011), which, based on the low-frequency assumption, is widely used in practical applications such as shallow sediment exploration (Bachrach and Nur, 1998; Bachrach et al., 1998; 2000; Accaino et al., 2023), reservoir engineering (Chen and Zhang, 2017; Wang et al., 2022), and geofluid discrimination (Zong et al., 2015), as it simplifies the modeling of seismic wave propagation in porous media.
However, the elastic model is invalid in the high-frequency range as it cannot model the macroscopic wave-induced fluid flow, i.e., poroelastic effects in the high-frequency range. Meanwhile, seismic methods often rely on empirical correlations established in the laboratory for seismic inversion at the field scale. Correlating lab seismic data with field data provides a necessary database for constructing seismic models of specific geological areas. The frequency used in the lab is usually in the ultrasonic range (high-frequency range), where the mode of poroelastic effects differs from the seismic frequency range (low-frequency range). In this context, the poroelastic model (Biot, 1956a; Biot, 1956b) may be more appropriate for predicting the behavior of porous media across a wide frequency range, which also can incorporate more detailed information during parameterization and inversion compared to the elastic model. This has led to its use in various applications, including seismic exploration (Morency et al., 2011; Anthony and Vedanti, 2020; Alajmi et al., 2023), earthquake engineering (Meng et al., 2022), and soil dynamics (Chen et al., 2020). Furthermore, the poroelastic model has been extended and modified to account for complex phenomena such as anisotropy (Huang et al., 2022; Guo et al., 2022), heterogeneity (Wenzlau, 2009), and nonlinear behavior (Yang et al., 2021). Despite its advantages, the application of the poroelastic model in monitoring shallow sedimentary layers remains limited as the complexity of the environmental conditions, e.g., stiffness and saturation strongly depend on the depth in typical soils (Crane, 2013).
In this regard, some scholars have established the relationship between the seismic characteristics and the relevant properties of shallow loose media in the lab based on the poroelastic model, e.g., Emerson and Foray (2006); Whalley et al. (2012); Linneman et al. (2021). However, the measurement of seismic wave characteristics in lab sample tests provides only a single data point, which cannot be directly compared to field survey results, e.g., P-wave travel time curvestravel-time curves, and consider both the pressure dependence of the initial elastic modulus and the saturation distribution under practical conditions. Lab small-scale physical models using non-contact ultrasound techniques offer new perspectives for monitoring the saturation distribution in the shallow loose media (Bodet et al., 2010; 2014; Pasquet et al., 2016). Although some small-scale physical experiments have demonstrated the applicability of the poroelastic model in the ultrasonic frequency range (e.g., Barrière et al., 2012), there is still lacking However, a comprehensive theoretical model for partially saturated seismic wave propagation in partially saturated, loosely deposited sands to establish a connection between is still lacking, hindering the extrapolation of small-scale experimental results to field-scale observations. This limitation arises due to the frequency-dependent nature of poroelastic effects, as different frequency ranges are employed in small-scale physical experiments and field-scale observations. Therefore, it is necessary to compare the results between the elastic model and applications. To address this, we used the elastic model as a baseline and compared its predictions with those of the poroelastic model to investigate highlight the impact of poroelastic effects on seismic monitoring data in across different frequency ranges. Additionally, the theoretical model must account for the depth dependence of both the initial elastic modulus and the saturation distribution.
This paper aims to numerically explore poroelastic effects on seismic monitoring data in loosely deposited sands. To this end, we combine the poroelastic model saturated with two immiscible fluids and the Hertz-Mindin model, considering the saturation-depth profile, to get profiles of
2 Methodology
2.1 Background
In a typical open-pit mine dump scenario consisting of loosely deposited sands, as Figure 1a, the vadose zone exhibits varying degrees of saturation ranging from dry to partially saturated, while below the groundwater level, the sediment is fully saturated (Bachrach and Mukerji, 2012). Moreover, due to the complex seismic response of partially saturated loosely deposited sands, a small-scale physical model can be employed to validate relevant theories and media models. For instance, Pasquet et al. (2016) used a lab-scale controlled physical model (PM) consisting of glass beads (GBs), employing the ultrasonic technology to test the sensitivity of seismic monitoring results to different water table levels (Figures 1b, c).
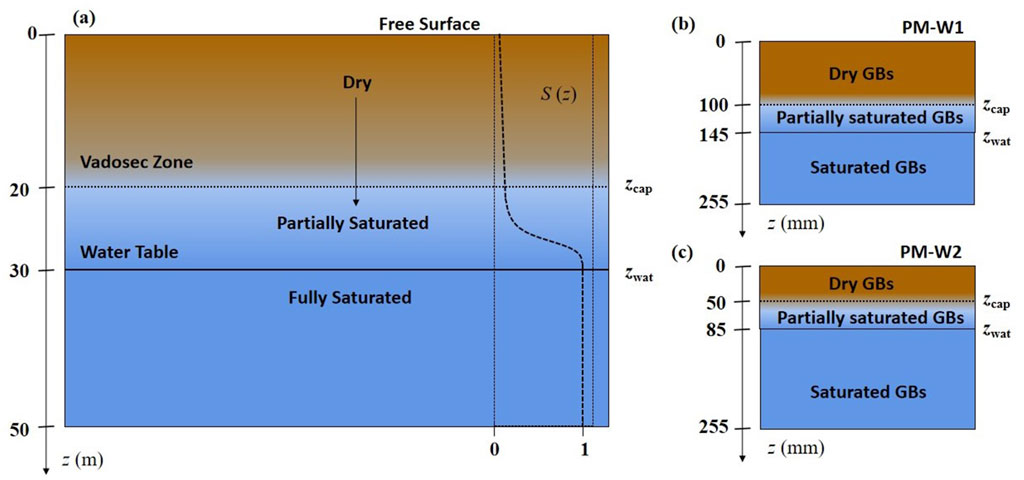
Figure 1. (a) A typical loosely deposited sand scenario and the saturation-depth profile. Small-scale physical model with different water level
As the model exhibits anisotropy only in the vertical direction, we consider a one-dimensional column of loosely deposited sand with properties dependent on the depth
2.2 Calculation of Vp and Vs
In this section, we present the poroelastic model considering the depth dependence of stiffness and saturation. For completeness and reference, a detailed summary of the derivation process of plane wave solution is presented in supplemental materials.
2.2.1 Governing equations of poroelastic model
Wave propagation in porous media (Biot, 1956a; Biot, 1956b) is formulated in terms of the primary variables solid skeleton displacement
where
The equilibrium equation of fluid is written as
where
In Biot’s theory, the poroelastic effects is frequency-dependent, which could be characterized by the viscodynamic factor in the frequency domain (Barrière et al., 2012):
where
In low-frequency conditions, i.e.,
2.2.2 Stiffness modulus of loosely deposited sands
In order to model the wave propagation characteristic in granular material, the Hertz-Mindlin model (Mavko et al., 2009) is employed to assess the stiffness modulus of the soil frame. The bulk and shear modulus are defined in Equations 5, 6, displayed as
and
where the
where
2.2.3 Effective fluid properties
The properties of the fluid mixture with water and gas can be evaluated in Equations 8–13. According to the work of Berryman (Berryman et al., 1988), the effective compressibility of fluid can be represented by the average of water and air compressibility (Wood, 1955):
where
and
were chosen here.
where
where
where
2.2.4 Saturation profile
The saturation profile is employed in this paper to consider the variation of saturation with depth. If the capillary pressure at the groundwater table is set as 0, and the depth at Earth’s surface is set as 0, according to the well-known van Genuchten’s model (Van Genuchten, 1980), the saturation-depth relationship is expressed in Equation 14:
where
could be obtained. From Equation 15, the capillary pressure profile is only related to the groundwater table. Nevertheless, since the contribution of capillary pressure to the effective pressure is also dependent on the saturation profile, this model can still be applied for extensive to more silty and clayey soils.
2.3 Seismic monitoring indicators
There are three indicators employed to assess the poroelastic effects on seismic monitoring in loosely deposited sands, i.e., Poisson’s ratio (Equation 16), P-wave travel time curve (Equations 17–19) and surface wave dispersion curves.
2.3.1 Poisson’s ratio
In the field of near-surface geophysics, borehole probing is a commonly employed technique for detecting groundwater tables. However, its large-scale applicability may be constrained by financial and other factors. Seismic surveys are used to acquire the spatial distribution of
where the values of
2.3.2 P-wave travel time curve
In general, the seismic refraction method can be applied to detect the saturation distribution of loosely deposited sands due to the sensitivity of P-wave velocity to saturation (Berryman et al., 2002). In shallow seismic refraction surveys, the P-wave travel time curve includes the direct wave in the near field and the refracted wave in the far field. Consider a layer of thickness
and
In this paper, the 1D model is discretized into a sufficient number of layers with equal thickness
where
2.3.3 Surface wave dispersion analysis
Surface wave dispersion analysis is a non-invasive geophysical technique used to quantitatively assess frequency-dependent changes in the phase velocities of surface waves (Foti et al., 2011; Mi et al., 2018; Zhang et al., 2020). This method primarily relies on the properties of Rayleigh waves (Elias and Alderton, 2020), which result from the superposition of wave propagation between different subsurface media interfaces. As the wavelength shortens and the depth of penetration increases, wave velocity varies with frequency, exhibiting a dispersive phenomenon. This dispersion is related to the physical properties of the subsurface, such as density, compressibility, and shear resistance. Consequently, analyzing the surface wave dispersion curve provides valuable insights into the characteristics and structure of the subsurface.
Rayleigh waves are primarily driven by S-waves (Flinchum et al., 2020), which typically increase with depth in loosely deposited sands. In surface wave dispersion analysis, the phase velocity at lower frequencies reflects the deeper S-wave velocity structure, while higher frequencies reveal the shallow structure (Flinchum et al., 2020). Consequently, the surface wave dispersion curve can be utilized to invert and obtain the 1D S-wave profile (Pasquet and Bodet, 2017). In this study, we investigate the influence of different models on the surface-wave dispersion curve across various scales. To construct surface-wave dispersion curves, the dispa python library1 is employed for the forward modeling of surface-wave dispersion.
3 Results and discussion
In this section, we numerically investigate the poroelastic effects on seismic monitoring in loosely deposited sands across various scale applications (corresponding to different frequency ranges). We first study the poroelastic effects on the velocities of P- and S-waves with different saturation degrees in the ultrasonic frequency range, where the macroscopic wave-induced fluid flow happens. Then we explore the poroelastic effects on the Poisson’s ratio, P-wave travel time, and surface wave dispersion with different frequency ranges.
3.1 Poroelastic effects on Vp and Vs
In the following, we first validate the model employing two sets of lab sample experimental results and briefly illustrate the influence of poroelastic effects on body wave propagation characteristics with different saturation degrees.
3.1.1 Experiment 1
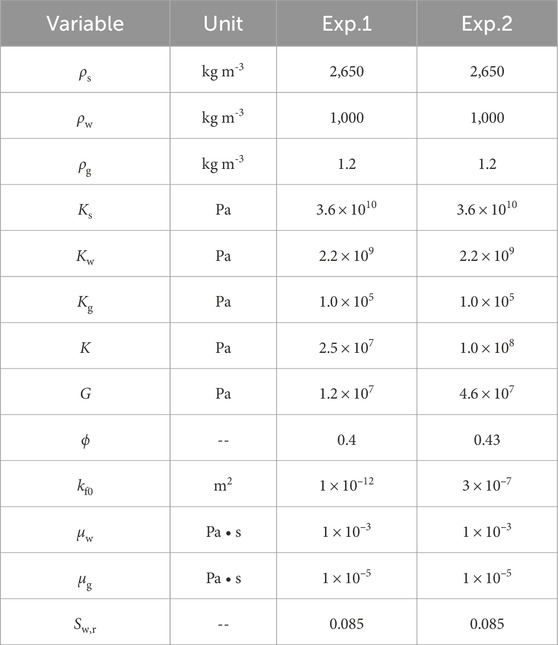
The first experimental study (Barrière et al., 2012) examines the effects of saturation (ranging from 0.1 to 0.9) on the characteristics of the fast P wave in an unconsolidated porous medium. Wave velocity and attenuation are determined using plane wave analysis, with material parameters listed in Table 1 (Exp.1). Additionally, the energy losses due to friction between sand particles are considered in the energy dissipation analysis. In natural soils and rocks, internal damping, known as hysteretic damping, is independent of frequency. The Constant-Q model is commonly used to characterize this behavior across all frequency ranges (Carcione, 2015). The frequency-dependent stiffness modulus is expressed in Equations 20, 21 (Barrière et al., 2012):
where
Figure 2 illustrates the effect of saturation on the fast P-wave velocity and wave attenuation. From those figures, it can be seen that the poroelastic model agrees better with the experimental data compared to the elastic model, which demonstrates the favorable predictive capability of the poroelastic model for fast P-wave characteristics. This discrepancy is attributed to the inability of Gassmann’s theory to accurately characterize the poroelastic effects at the exciting frequency
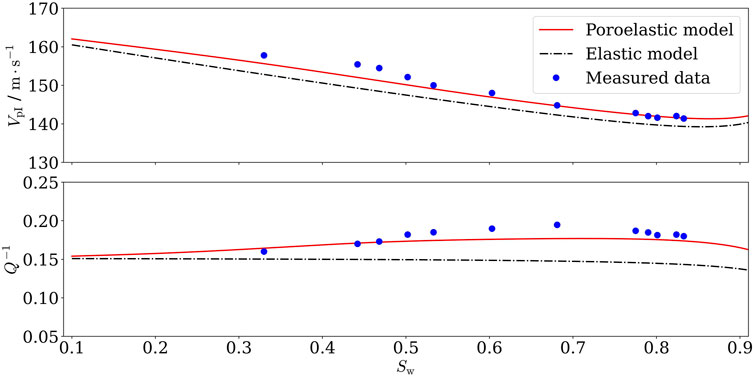
Figure 2. Effect of saturation on fast P wave propagation characteristics (exciting frequency
3.1.2 Experiment 2
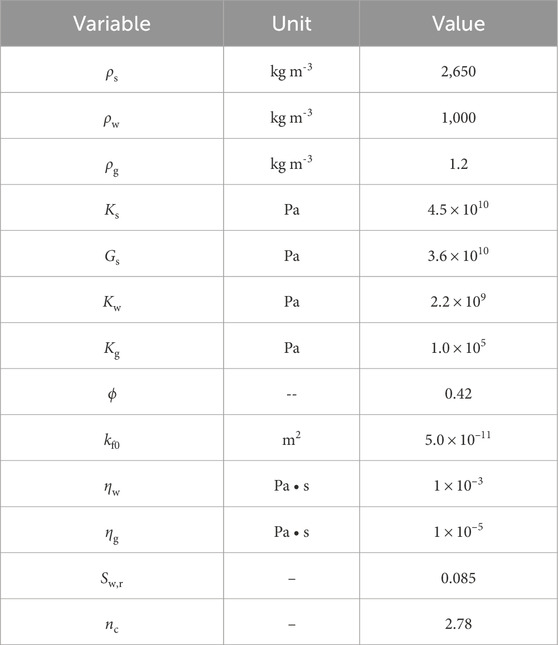
In the first experiment, the model was studied within a saturation range, from 0.1 to 0.9. However, the properties of fluid undergo significant changes when saturation is close to 1.0 (Whalley et al., 2012). Therefore, it is necessary to investigate the wave propagation characteristics in the near-saturated range (approximately
Figure 3 show the effect of saturation on fast P-wave, slow P-wave, and S-wave. The simulation results obtained from the poroelastic model generally align with the measured dataexcept for some discrepanciesattributed to the selected parameters (Gu et al., 2021). , with some discrepancies. These deviations are primarily due to parameter selection. For instance, the shear modulus used in the theoretical prediction was derived from S-wave measurements taken when the soil was nearly saturated (Gu et al., 2021). Additionally, the definition of effective permeability and viscosity influences the critical frequency, contributing to the observed differences. Moreover, the elastic model fails to predict the existence of the slow P-wave as it can not model mascopic wave-induced fluid flow. As saturation is close to 1.0, the velocity of the fast P-wave changes significantly due to sharp variations in the fluid properties. From Figure 3a, it can be observed that the predictive ability of the elastic model is comparable to the poroelastic model with saturation near 99.9%. This may be due to the dominance of changes in fluid properties as opposed to poroelastic effects.

Figure 3. Effect of saturation on body wave velocities (exciting frequency
For a better understanding of the poroelastic effect on seismic wave velocities in the high-frequency regime where pressure gradients in the fluid only serve to accelerate fluid motion, we compared the model predictions with experimental data in the fully saturated state, as shown in Figure 4. From those figures, it can be found there is a better agreement between the model predictions and the measured data. As shown in Figures 4a, c, there is a significant discrepancy of up to 6% between the elastic model and the poroelastic model, indicating the inability of the elastic model to characterize the poroelastic effect in the high-frequency regime.

Figure 4. Effect of frequency on body wave velocities in full saturation state: (a) fast P-wave; (b) slow P-wave; (c) S-wave.
3.2 Poroelastic effects on seismic monitoring in field surveys
According to Section 2, the dominant frequency of the source, set at
Figures 5b–d display the profiles of P-wave, S-wave, and Poisson’s ratio in the low-frequency range, respectively. From those figures, it can be found that there is a general consistency in the predictions of both poroelastic and elastic models, which has been validated through various field measurements, e.g., Bachrach and Nur (1998); Flinchum et al. (2020). It can be noted that both P- and S-wave velocity profiles exhibit a minor inflection point characterized by a localized decrease in velocity near the water table. This phenomenon can be attributed to a sudden increase in the effective density of the medium prior to the full saturation. As shown in Figure 5b, the P-wave velocity undergoes a sudden increase close to the water level. This is due to the abrupt alteration of the effective fluid bulk modulus
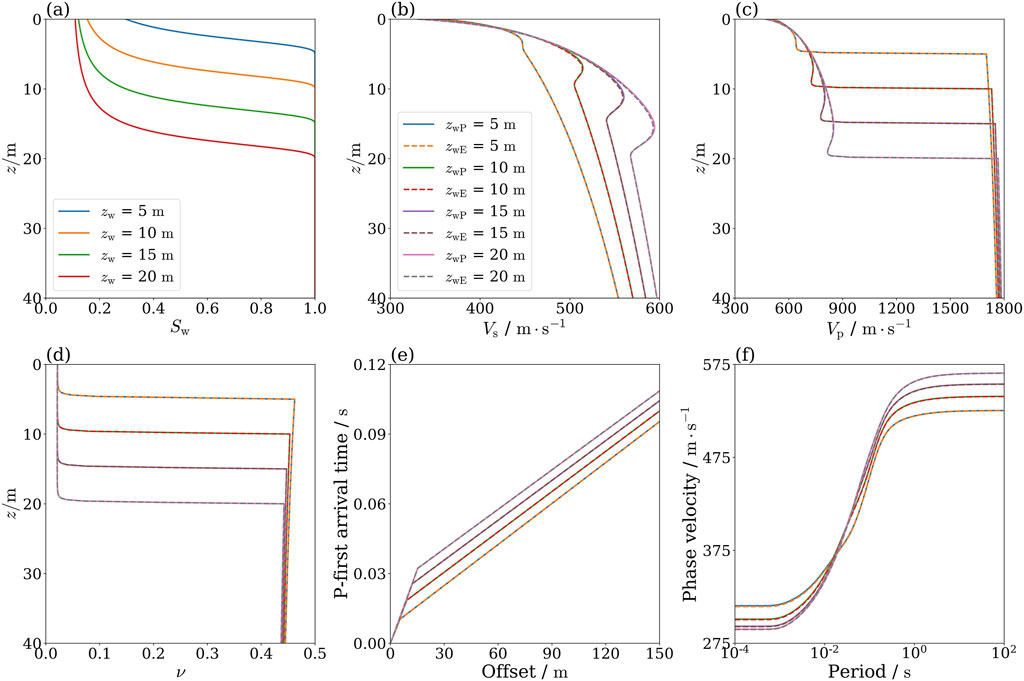
Figure 5. Comparison of results obtained from the elastic and poroelastic models at the field scale (
Figure 5e demonstrate the curves of P-wave travel time with different water tables. It is noticed from this figure the predicted results of the poroelastic model agree with the elastic model. This suggests that both models possess comparable predictive capabilities in the low-frequency range. Comparing the travel time curve among various water tables, it can be seen that there is a similarity in slopes among direct wave travel time curves which suggests that P-wave velocity remains relatively unaffected by saturation levels in the unsaturated region. The difference among the travel-time curves stems from fluctuations in the location of the water table. The slope of refracted wave travel time curves remains consistent, indicating that P-wave velocities near water table depths are basically the same. This is because P-wave velocity is mainly governed by the fluid in shallow loose media consistent with Figure 5c.
Figure 5f shows the surface wave velocity dispersion as a function of frequency simulated by the elastic and poroelastic models. From this figure it is noted that there is a notable agreement concerning surface wave velocity dispersion between two models. It also can be found that surface wave dispersion is significantly influenced by the alterations in the water table. By comparing the outcomes of different water tables, it is found there is notable variability in the low-frequency (high period) range indicating variations in the deep medium structure, e.g., water table location. Furthermore, in the high-frequency range (low period), it is observed discernible differences among the results of different saturation profiles. This suggests surface waves are responsive to changes in saturation of the vadose zone, while this sensitivity is not shown in the P-wave travel time curves.
3.3 Poroelastic effects on seismic monitoring in pilot plant surveys
For intermediate frequencies with regard to the ratio
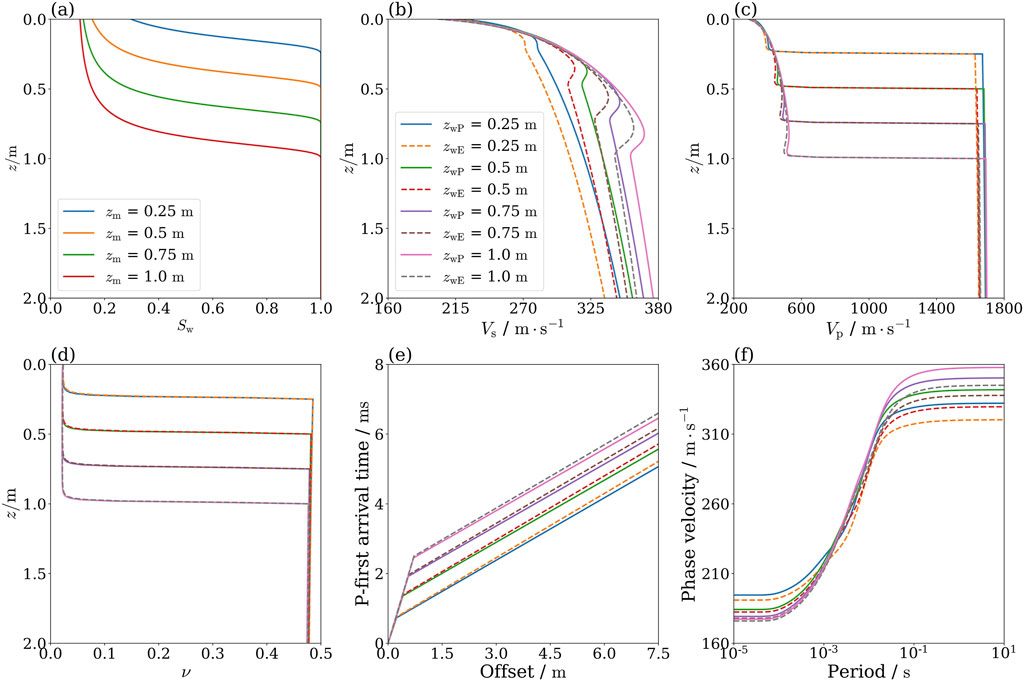
Figure 6. Comparison of results obtained from the elastic and poroelastic models at the pilot plant scale (
Figure 6b, c display the P- and S-wave velocity profiles of elastic and poroelastic models in the intermediate-frequency range. It can be seen from those figures that the poroelastic and elastic modeling results are broadly similar in the low saturation region, while a clear divergence occurs in the high saturation region. This divergence stems from the lower velocity dispersion observed at low saturation and higher at high saturation. Figure 6d shows the Poisson’s ratio profiles with different water table levels. There exists only a minor discrepancy between the outcomes of elastic and poroelastic models. This suggests that the influence of poroelastic effects on Poisson’s ratio profiles remains relatively consistent across low and intermediate-frequency conditions.
Figure 5e describes the P-wave travel time curves for the elastic and poroelastic models with different water table levels. From this figure, it can be seen that the major difference between the two models is in the refraction band, even though it is not significant. An indication of the apparent velocity near the water table is given by the slope of the refraction curve. Therefore, the velocity dispersion in the intermediate-frequency range are not sufficient to cause significant changes in the apparent velocity. Moreover, in the direct band region, both models produce nearly identical predictions due to minimal velocity dispersion in the unsaturated range.
Figure 5f illustrates the surface wave dispersion curves for the elastic and poroelastic models with different water table levels. It can be seen from this figure that there is a significant difference between the predictions of the two models, especially in the low-frequency region (high period). This observation indicates that the elastic model fails to adequately capture the poroelastic effects in the intermediate frequency range. Furthermore, in the high-frequency region (low period), there is also a marked difference between the predictions of the two models. Even though it is not as pronounced as in the low-frequency region, this finding further highlights the limitations of the elastic models.
3.4 Poroelastic effects on seismic monitoring in ultrasonic measurements
For high frequencies with regard to the ratio
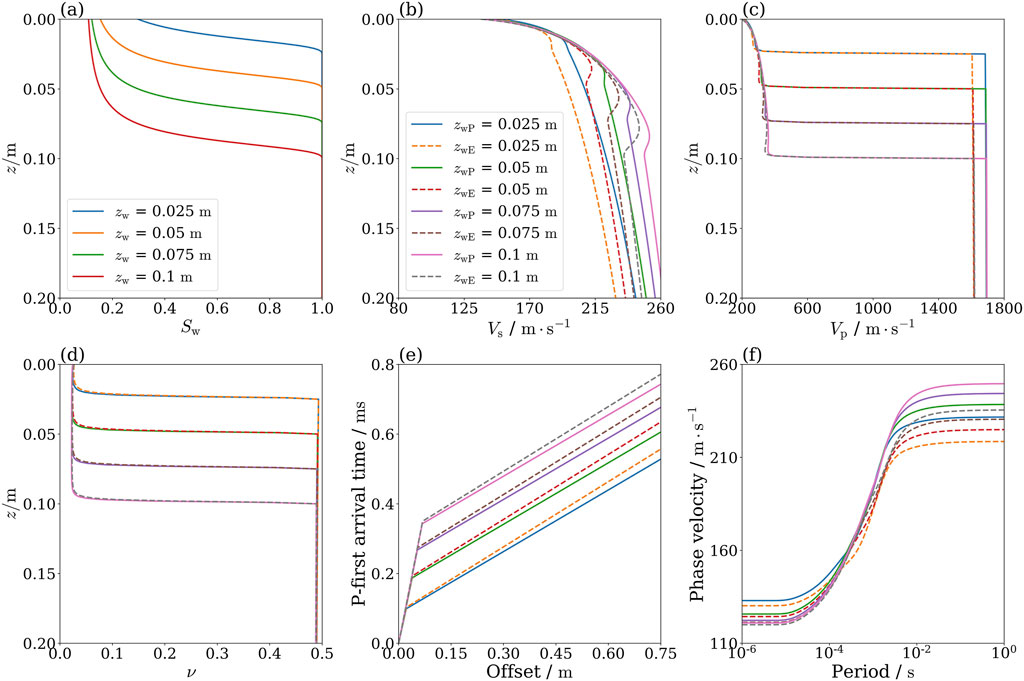
Figure 7. Comparison of results obtained from the elastic and poroelastic models at the ultrasonic scale (
Figure 7b, c show the P- and S-wave velocity profiles for the elastic and poroelastic models in the high-frequency range. It is clear from these figures that there is a significant difference between the elastic and poroelastic models in the prediction of body wave velocity profiles. Compared to the intermediate-frequency range, this difference becomes more apparent as the frequency increases. These observations suggest that the poroelastic effects on body waves is frequency-dependent. Figure 7d presents the Poisson’s ratio profiles of the elastic and poroelastic models for different water table conditions. It is worth noting that the results remain consistent regardless of which model or frequency range is chosen, as described in the previous section. A plausible explanation for the wave velocity dispersion is the frequency-dependent nature of the inertial interaction mass (Carcione, 2015). It is apparent that the Poisson’s ratio or
Figure 7e demonstrates the P-wave travel time curves for elastic and poroelastic models with different water table levels. It can be seen there is a significant decrease in the slope of the refractive section. This is due to the larger velocity dispersion in the high-frequency range. Figure 7F shows the surface wave dispersion curves for the elastic and poroelastic models with different water table levels. Compared to the pilot-scale results, the variability in the predictions of both models increases significantly, indicating that the lab results are not directly transferable to field application.
4 Conclusion
In this study, we investigate the impact of poroelastic effects on seismic monitoring results. The poroelastic signature is derived by contrasting elastic and poroelastic models. Based on the obtained results, the following conclusions can be drawn:
(1) A comparison of two sets of laboratory data investigates the poroelastic effects on body wave velocities. Besides, the inability of the elastic model to capture porous elastic effects in the high-frequency range is briefly illustrated. In low saturation conditions, the poroelastic effect exhibits a small frequency dependence, whereas the opposite is true in high saturation conditions, especially in the case of full saturation.
(2) Different frequencies typically correspond to applications at different scales (seismic site surveys, pilot plant surveys, and ultrasonic measurements). The Poisson’s ratio profile is an effective way to detect water table levels at various scales. Besides, the frequency-dependent poroelastic effect mainly affects the refractive wave band and surface wave dispersion curve.
(3) Seismic monitoring results exhibit high sensitivity to changes in water level, suggesting the feasibility of utilizing time-lapse seismic methods to monitor saturation distribution in loosely deposited sands.
These findings highlight the discrepancies in seismic monitoring results across different frequency ranges and can serve as a basis for parameterization across applications at various scales. However, some limitations of this work should be acknowledged. While the poroelastic effects on seismic monitoring results have been confirmed by comparing elastic and poroelastic models, more experimental data with different scales are needed for further validation. Additionally, incorporating the poroelastic effects involve only macroscopic wave-induced fluid flow in this paper. Incorporating the heterogeneous fluid distribution in porous media may provide insight into the poroelastic effects on seismic wave propagationdistribution-induced mesoscopic wave-induced fluid flow in poroelastic effects may provide more realistic predictions, especially for applications in natural sediments and mine tailings. Moreover, future research could explore the use of machine learning techniques to improve poroelastic parameter estimations. Recent studies have demonstrated that deep learning approaches can effectively infer complex subsurface properties from seismic data. Applying such methods to poroelastic modeling could enhance parameter inversion accuracy and reduce computational costs. In addition, the model could be extended to assess geohazards, e.g., liquefaction (Molina-Gómez et al., 2023) and landslides (Li et al., 2024; Fang et al., 2023).
Data availability statement
The raw data supporting the conclusions of this article will be made available by the authors, without undue reservation.
Author contributions
TD: Conceptualization, Data curation, Funding acquisition, Investigation, Software, Validation, Visualization, Writing – original draft, Writing – review and editing.
Funding
The author(s) declare that financial support was received for the research and/or publication of this article. The authors thank the support from the China Scholarship Council (CSC) project (No. 201906430070).
Acknowledgments
We thank all reviewers for valuable comments, and the Frontiers Editorial Office for improving the layout of this Research Topic.
Conflict of interest
The author declares that the research was conducted in the absence of any commercial or financial relationships that could be construed as a potential conflict of interest.
Generative AI statement
The author(s) declare that no Generative AI was used in the creation of this manuscript.
Publisher’s note
All claims expressed in this article are solely those of the authors and do not necessarily represent those of their affiliated organizations, or those of the publisher, the editors and the reviewers. Any product that may be evaluated in this article, or claim that may be made by its manufacturer, is not guaranteed or endorsed by the publisher.
Supplementary material
The Supplementary Material for this article can be found online at: https://www.frontiersin.org/articles/10.3389/feart.2025.1561168/full#supplementary-material
Footnotes
1https://github.com/keurfonluu/disba
References
Accaino, F., Col, F., Böhm, G., Picotti, S., Giorgi, M., Meneghini, F., et al. (2023). Petro-physical characterization of the shallow sediments in a coastal area in ne Italy from the integration of active seismic and resistivity data. Surv. Geophys. 44, 1211–1238. doi:10.1007/s10712-023-09776-x
Alajmi, M., Gei, D., Carcione, J., Qadrouh, A., and Ba, J. (2023). Methodology to monitor the seismic response to injected carbon dioxide: model and synthetic seismograms of co2 injection. Acta Geophys. 72, 1343–1353. doi:10.1007/s11600-023-01199-x
Anthony, E., and Vedanti, N. (2020). Simulation of seismic wave propagation in poroelastic media using vectorized biot’s equations: an application to a co2 sequestration monitoring case. Acta Geophys. 68, 435–444. doi:10.1007/s11600-020-00414-3
Bachrach, R., Dvorkin, J., and Nur, A. (1998). High-resolution shallow-seismic experiments in sand, part ii: velocities in shallow unconsolidated sand. Geophysics 63, 1234–1240. doi:10.1190/1.1444424
Bachrach, R., Dvorkin, J., and Nur, A. (2000). Seismic velocities and Poisson’s ratio of shallow unconsolidated sands. Geophysics 65, 559–564. doi:10.1190/1.1444751
Bachrach, R., and Mukerji, T. (2012). Analysis of 3D high-resolution seismic reflection and crosswell radar tomography for aquifer characterization: a case study. Houston, Texas: SEG library, 607–620.
Bachrach, R., and Nur, A. (1998). High-resolution shallow-seismic experiments in sand, part i: water table, fluid flow, and saturation. Geophysics 63, 1225–1233. doi:10.1190/1.1444423
Barrière, J., Bordes, C., Brito, D., Sénéchal, P., and Perroud, H. (2012). Laboratory monitoring of p waves in partially saturated sand. Geophys. J. Int. 191, 1152–1170. doi:10.1111/j.1365-246X.2012.05691.x
Berryman, J., Berge, P., and Bonner, B. (2002). Estimating rock porosity and fluid saturation using only seismic velocities. Geophysics 67, 391–404. doi:10.1190/1.1468599
Berryman, J. G., Thigpen, L., and Chin, R. C. Y. (1988). Bulk elastic wave propagation in partially saturated porous solids. J. Acoust. Soc. Am. 84, 360–373. doi:10.1121/1.396938
Biot, M. A. (1956a). Theory of propagation of elastic waves in a fluid-saturated porous solid. i. low-frequency range. J. Acoust. Soc. Am. 28, 168–178. doi:10.1121/1.1908239
Biot, M. A. (1956b). Theory of propagation of elastic waves in a fluid-saturated porous solid. ii. higher frequency range. J. Acoust. Soc. Am. 28, 179–191. doi:10.1121/1.1908241
Biot, M. A., and Willis, D. G. (1957). The elastic coefficients of the theory of consolidation. J. Appl. Mech. 24, 594–601. doi:10.1115/1.4011606
Bodet, L., Dhemaied, A., Martin, R., Mourgues, R., Rejiba, F., and Tournat, V. (2014). Small-scale physical modeling of seismic-wave propagation using unconsolidated granular media. Geophysics 79, T323–T339. doi:10.1190/geo2014-0129.1
Bodet, L., Jacob, X., Tournat, V., Mourgues, R., and Gusev, V. (2010). Elasticity profile of an unconsolidated granular medium inferred from guided waves: toward acoustic monitoring of analogue models. Tectonophysics 496, 99–104. doi:10.1016/j.tecto.2010.10.004
Chang, K. W., and Yoon, H. (2018). 3-D modeling of induced seismicity along multiple faults: magnitude, rate, and location in a poroelasticity system. J. Geophys. Res. Solid Earth 123, 9866–9883. doi:10.1029/2018JB016446
Chen, H., and Zhang, G. (2017). Estimation of dry fracture weakness, porosity, and fluid modulus using observable seismic reflection data in a gas-bearing reservoir. Surv. Geophys. 38, 651–678. doi:10.1007/s10712-017-9410-x
Chen, W., Jeng, D., Chen, W., Chen, G., and Zhao, H. (2020). Seismic-induced dynamic responses in a poro-elastic seabed: solutions of different formulations. Soil Dyn. Earthq. Eng. 131, 106021. doi:10.1016/j.soildyn.2019.106021
Crane, J. M. (2013). Effects of stress and water saturation on seismic velocity and attenuation in near surface sediments. Baton Rouge, Louisiana: Louisiana State University and Agricultural and Mechanical College.
Emerson, M., and Foray, P. (2006). Laboratory p-wave measurements in dry and saturated sand. Acta Geotech. 1, 167–177. doi:10.1007/s11440-006-0015-7
Fang, K., Tang, H., Li, C., Su, X., An, P., and Sun, S. (2023). Centrifuge modelling of landslides and landslide hazard mitigation: a review. Geosci. Front. 14, 101493. doi:10.1016/j.gsf.2022.101493
Fenta, M., and Szanyi, J. (2021). Fibre optic methods of prospecting: a comprehensive and modern branch of geophysics. Surv. Geophys. 42, 551–584. doi:10.1007/s10712-021-09634-8
Flinchum, B. A., Banks, E., Hatch, M., Batelaan, O., Peeters, L. J. M., and Pasquet, S. (2020). Identifying recharge under subtle ephemeral features in a flat-lying semi-arid region using a combined geophysical approach. Hydrology Earth Syst. Sci. 24, 4353–4368. doi:10.5194/hess-24-4353-2020
Foti, S., Parolai, S., Albarello, D., and Picozzi, M. (2011). Application of surface-wave methods for seismic site characterization. Surv. Geophys. 32, 777–825. doi:10.1007/s10712-011-9134-2
Gassmann, F. (1951). Elastic waves through a packing of spheres. GEOPHYSICS 16, 673–685. doi:10.1190/1.1437718
Grelle, G., and Guadagno, F. M. (2009). Seismic refraction methodology for groundwater level determination: “water seismic index”. J. Appl. Geophys. 68, 301–320. doi:10.1016/j.jappgeo.2009.02.001
Gu, X., Kangle, Z., Tessari, A., and Gao, G. (2021). Effect of saturation on the characteristics of p-wave and s-wave propagation in nearly saturated soils using bender elements. Soil Dyn. Earthq. Eng. 145, 106742. doi:10.1016/j.soildyn.2021.106742
Guo, J., Zhao, L., Chen, X., Yang, Z., Li, H., and Liu, C. (2022). Theoretical modelling of seismic dispersion, attenuation, and frequency-dependent anisotropy in a fluid saturated porous rock with intersecting fractures. Geophys. J. Int. 230, 580–606. doi:10.1093/gji/ggac070
Huang, X., Greenhalgh, S., Han, L., and Liu, X. (2022). Generalized effective biot theory and seismic wave propagation in anisotropic, poroviscoelastic media. J. Geophys. Res. Solid Earth 127, e2021JB023590. doi:10.1029/2021jb023590
Li, G., Hu, Z., Wang, D., Wang, L., Wang, Y., Zhao, L., et al. (2024). Instability mechanisms of slope in open-pit coal mines: from physical and numerical modeling. Int. J. Min. Sci. Technol. 34, 1509–1528. doi:10.1016/j.ijmst.2024.10.003
Linneman, D. C., Strickland, C. E., and Mangel, A. R. (2021). Compressional wave velocity and effective stress in unsaturated soil: potential application for monitoring moisture conditions in vadose zone sediments. Vadose Zone J. 20, e20143. doi:10.1002/vzj2.20143
Mavko, G., Mukerji, T., and Dvorkin, J. (2009). The rock physics handbook: tools for seismic analysis of porous media. 2 edn. Cambridge University Press.
Meng, K., Cui, C., Xu, C., Wang, B., Xin, Y., and Liang, Z. (2022). Approach for defective floating pile embedded in layered saturated soils and application in pile integrity test. Int. J. Numer. Anal. Methods Geomechanics 46, 2893–2912. doi:10.1002/nag.3432
Mi, B., Xia, J., Shen, C., and Wang, L. (2018). Dispersion energy analysis of Rayleigh and love waves in the presence of low-velocity layers in near-surface seismic surveys. Surv. Geophys. 39, 271–288. doi:10.1007/s10712-017-9440-4
Milani, M., Rubino, J., Ludovic, B., Sidler, R., and Holliger, K. (2015). Attenuation of sonic waves in water-saturated alluvial sediments due to wave-induced fluid flow at microscopic, mesoscopic and macroscopic scales. Geophys. J. Int., 146–147. doi:10.1093/gji/ggv287
Moghadas, D., André, F., Slob, E. C., Vereecken, H., and Lambot, S. (2010). Joint full-waveform analysis of off-ground zero-offset ground penetrating radar and electromagnetic induction synthetic data for estimating soil electrical properties. Geophys. J. Int. 182, 1267–1278. doi:10.1111/j.1365-246x.2010.04706.x
Mohanty, B. P. (2013). Soil hydraulic property estimation using remote sensing: a review. Vadose Zone J. 12 (06.0100), 1–9. doi:10.2136/vzj2013.06.0100
Molina-Gómez, F., Viana da Fonseca, A., Ferreira, C., and Caicedo, B. (2023). Improvement of cyclic liquefaction resistance induced by partial saturation: an interpretation using wave-based approaches. Soil Dyn. Earthq. Eng., 167. doi:10.1016/j.soildyn.2023.107819
Morency, C., Luo, Y., and Tromp, J. (2011). Acoustic, elastic and poroelastic simulations of CO2 sequestration crosswell monitoring based on spectral-element and adjoint methods. Geophys. J. Int. 185, 955–966. doi:10.1111/j.1365-246x.2011.04985.x
Morency, C., and Tromp, J. (2008). Spectral-element simulations of wave propagation in porous media. Geophys. J. Int. 175, 301–345. doi:10.1111/j.1365-246X.2008.03907.x
Pasquet, S., and Bodet, L. (2017). Swip: an integrated workflow for surface-wave dispersion inversion and profiling. Geophysics 82, WB47–WB61. doi:10.1190/geo2016-0625.1
Pasquet, S., Bodet, L., Bergamo, P., Guérin, R., Martin, R., Mourgues, R., et al. (2016). Small-scale seismic monitoring of varying water levels in granular media. Vadose Zone J. 15, 1–14. doi:10.2136/vzj2015.11.0142
Pasquet, S., Bodet, L., Dhemaied, A., Mouhri, A., Vitale, Q., Rejiba, F., et al. (2015). Detecting different water table levels in a shallow aquifer with combined p-surface and sh-wave surveys: insights from vp/vs or Poisson’s ratios. J. Appl. Geophys. 113, 38–50. doi:10.1016/j.jappgeo.2014.12.005
Plati, C., Loizos, A., and Gkyrtis, K. (2020). Assessment of modern roadways using non-destructive geophysical surveying techniques. Surv. Geophys. 41, 395–430. doi:10.1007/s10712-019-09518-y
Solazzi, S., Bodet, L., Holliger, K., and Jougnot, D. (2021). Surface-wave dispersion in partially saturated soils: the role of capillary forces. J. Geophys. Res. Solid Earth 126, e2021JB022074. doi:10.1029/2021jb022074
Uyanik, O. (2011). The porosity of saturated shallow sediments from seismic compressional and shear wave velocities. J. Appl. Geophys. 73, 16–24. doi:10.1016/j.jappgeo.2010.11.001
Van Genuchten, M. (1980). A closed-form equation for predicting the hydraulic conductivity of unsaturated soils. Soil Sci. Soc. Am. J. 44, 892–898. doi:10.2136/sssaj1980.03615995004400050002x
Wang, P., Cui, Y.-A., and Liu, J. (2022). Fluid discrimination based on inclusion-based method for tight sandstone reservoirs. Surv. Geophys. 43, 1469–1496. doi:10.1007/s10712-022-09712-5
Wenzlau, F. (2009). Poroelastic Modelling of Wavefields in Heterogeneous Media Poroelastische Modellierung von Wellenfeldern in Heterogenen Medien. Karlsruhe, Germany: Karlsruhe Institute of Technology.
Whalley, W., Jenkins, M., and Attenborough, K. (2012). The velocity of shear waves in unsaturated soil. Soil Tillage Res. 125, 30–37. doi:10.1016/j.still.2012.05.013
Yang, J., Yang, D., Han, H., Qiu, L., and Cheng, Y. (2021). A wave propagation model with the Biot and the fractional viscoelastic mechanisms. Sci. China Earth Sci. 64, 364–376. doi:10.1007/s11430-020-9668-5
Zhang, X., Roy, C., Curtis, A., Nowacki, A., and Baptie, B. (2020). Imaging the subsurface using induced seismicity and ambient noise: 3-D tomographic Monte Carlo joint inversion of earthquake body wave traveltimes and surface wave dispersion. Geophys. J. Int. 222, 1639–1655. doi:10.1093/gji/ggaa230
Zienkiewicz, O. (1982). Basic formulation of static and dynamic behaviours of soil and other porous media. Appl. Math. Mech. 3, 457–468. doi:10.1007/.BF01908222
Keywords: froward seismic modeling, seismic monitoring, loosely deposited sands, poroelastic effects, frequency-dependent
Citation: Deng T (2025) Poroelastic effects on seismic monitoring in partially saturated loosely deposited sands. Front. Earth Sci. 13:1561168. doi: 10.3389/feart.2025.1561168
Received: 15 January 2025; Accepted: 20 March 2025;
Published: 02 April 2025.
Edited by:
Wenling Tian, China University of Mining and Technology, ChinaReviewed by:
Pengju An, Ningbo University, ChinaJinrong Cao, China University of Mining and Technology, China
Copyright © 2025 Deng. This is an open-access article distributed under the terms of the Creative Commons Attribution License (CC BY). The use, distribution or reproduction in other forums is permitted, provided the original author(s) and the copyright owner(s) are credited and that the original publication in this journal is cited, in accordance with accepted academic practice. No use, distribution or reproduction is permitted which does not comply with these terms.
*Correspondence: Tengfei Deng, tengfei.deng@doktorand.tu-freiberg.de
 Tengfei Deng