 Zahid Shah
- 1School of Mining and Geosciences, Nazarbayev University, Astana, Kazakhstan
- 2Institute of Smart Systems and Artificial Intelligence (ISSAI), Nazarbayev University, Astana, Kazakhstan
- 3Institute of Geodesy and Geoinformation Science, Technical University of Berlin, Berlin, Germany
- 4School of Sciences and Humanities, Nazarbayev University, Astana, Kazakhstan
- 5Centre for Russian and Central Eurasian Mineral Studies, Natural History Museum, London, United Kingdom
- 6Anglo Rem CA Exploration Mining Ltd., Astana, Kazakhstan
Determining spatial parameters related to mineral deposits is crucial for analysing mineral prospectivity. These spatial parameters, called Geospatial Criteria (GC), can serve as input data for modelling mineral prospectivity. Porphyry Copper (Cu) deposits are the major source of the world’s Cu supply, and reliance on these deposits has significantly increased over the past decade. Kazakhstan produces 2%–4% of global Cu production, with most sources are porphyry Cu deposits. This study applies data-driven and knowledge-based overlay techniques to define region-scale GC for porphyry Cu deposits in Kazakhstan to be used for mineral prospectivity modelling. The spatial attributes of highly prospective porphyry Cu deposits in Kazakhstan are systematically integrated into a Geographic Information System (GIS) to identify and evaluate the GC. Regional spatial datasets, including tectonics, lithological, geochronological, gravity, and magnetic data related to porphyry Cu deposits in Kazakhstan are comprehensively compiled and integrated within the GIS environment. An overlay analysis and Venn diagram analysis are performed using anomalous geospatial data. This results in a prospective area map based on GC highlighting targeted zones for porphyry Cu deposits in Kazakhstan. The study presents a framework for mineral prospectivity mapping that is scalable and can be applied to similar geological settings worldwide. It enhances exploration targeting, reduces costs, and supports sustainable resource discovery.
1 Introduction
Geospatial Criteria (GC) are specific mappable parameters derived from geospatial data. The geospatial data include geological, geophysical, and other spatial attributes useful for targeting mineral deposits. Although this study utilizes the term GC to define the input parameters used for prospectivity mapping, the concept itself is not a novel one. Spatial geological and geophysical attributes are commonly used to guide mineral exploration in literature. For example, Joly et al. (2015) use the term “spatial criteria” in the context of prospectivity modeling to describe geological, geochemical, and geophysical datasets used as predictors of mineralization. Yousefi et al. (2019) elaborates on geospatial parameters in their proposal for Exploration Information Systems (EIS), emphasizing their role in integrating and analyzing datasets for mineral targeting. Porwal and Carranza (2015) highlight the integration of thematic layers, such as faults, lithological boundaries, and geophysical anomalies, as key criteria for prospectivity mapping. However, the term GC has not formalized in literature but serves as a descriptive phrase for the integration of mappable features relevant to mineralization.
Most high-grade ores have been extracted globally, leading exploration and mining companies to focus on low-grade ores. Consequently, there have been significant advancement in the development of techniques for mineral perspectivity mapping (MPM) over the last few decades. These techniques are based on the integration of various data sources, including geological, geochemical, and geophysical information, to assess the probability of potential areas for mineral deposits (Joly et al., 2015; Dadykin et al., 2021). Integrating geographical information systems (GIS) in MPM has significantly enhanced decision-making processes (Grupe, 1990). GIS facilitate the storage, analysis, and visualization of spatial data, enabling the integration of various datasets and the identification of patterns and relationships that may not be clearly visible (Bonham-Carter, 1994; Woodhouse et al., 2000). Therefore, the integration of spatial data has enhanced the efficiency and effectiveness of the MPM by reducing exploration costs resulting from unsuccessful exploration efforts and increasing the probability of new deposits in unexplored areas.
There are various approaches to MPM; however, the two basic approaches are (i) the knowledge-driven approach and (ii) the data-driven approach (Harris et al., 2015). The knowledge-driven approach to mineral prospectivity modelling integrates various geological, geochemical, and geophysical data layers according to the expertise of geologists (Maleki and Emery, 2020). The experts utilize their knowledge of ore-forming processes, spatial relationships between mineral deposits, and various geological features to assign weights and ratings to different data layers (Agterberg, 1992) and fuzzy logic (An and Moon, 2013). This approach is beneficial when limited data are available or ore-forming processes are poorly understood (Singh et al., 2022). The latter approach to mineral prospectivity modelling uses known mineral deposit locations as training points for estimating model parameters (Breiman, 2001; Vapnik, 1995; Maleki and Emery, 2020). This approach is often based on methods such as weights of evidence and logistic regression because they allow for quantifying the spatial relationships between mineral occurrences and various geological, geochemical, and geophysical features (Nikitin et al., 2022). On the contrary, the data-driven approach is beneficial when a large amount of data is available and the ore-forming processes are relatively well-understood (Singh et al., 2022). Both approaches have been applied to numerous mineral deposits, including porphyry Cu deposits (Rad and Busch, 2011).
Porphyry Cu deposits are large-sized, low-grade Cu ore bodies that are usually found in intrusive igneous rocks. In recent decades, they have become increasingly important as a source of the world’s copper supply, as the depletion of higher-grade ores has led to greater reliance on these deposits (Singer et al., 2022; Cunningham et al., 2007). Estimated porphyry Cu deposits globally account for ∼57% of discovered Cu (Singer, 1995). In the context of Kazakhstan, mineral prospectivity modeling techniques are particularly relevant due to the country’s vast resources of porphyry Cu deposits. The porphyry Cu deposits of Kazakhstan are part of the Central Asia Cu belt, the fourth most endowed province after the Andes, the North American Cordillera, and Southeast Asia. Berger et al. (2010) comprehensively assessed porphyry Cu deposits in western Central Asia, including Kazakhstan, using remote sensing Techniques. The vast area of the Central Asian Orogenic Supercollage comprises amalgamated collages formed during the Neoproterozoic to the Mesozoic (Yakubchuk et al., 2012). According to Seltmann and Porter (2005), magmatic arcs linked to Altaid and Transbaikal Mongolian Orogenic microplates (collages) are part of a broad Palaeozoic subduction- accretion. The evolution of these tectonic collages began in the Neoproterozoic and continued until the early Mesozoic. The tectonics of the region are also linked to the closure of back-arc rift basins situated behind margins facing the paleo ocean. Porphyry-type ore deposits were formed during the Ordovician and Jurassic periods, with Kazakhstan experiencing its most significant period of porphyry ore formation during the Palaeozoic era (Yakubchuk et al., 2012).
There has been considerable research focusing on the creation of predictor maps or targeting criteria for mineral deposits (Porwal and Carranza, 2015; Kreuzer et al., 2020; Yousefi and Nykänen, 2017; Knox-Robinson and Wyborn, 1997). However, there has been no research on creating regional-scale GC or input parameters for mineral deposits to be used in mineral MPM, specifically for porphyry Cu deposits in Kazakhstan. Porwal and Carranza (2015) and Yousefi and Nykänen (2017) have demonstrated how various MCDM methods are useful in integrating various datasets for mineral exploration. For instance, Weight of Evidence (WoE) has been widely used for prospectivity mapping by assigning statistical weights to evidence layers based on known deposit occurrences (Agterberg, 1992). Similarly, Analytic Hierarchy Process (AHP) is able to assign relative importance to different criteria through expert input (Saaty, 1980), while Logistic Regression (LR) and Frequency Ratio (FR) have facilitated the quantitative analysis of spatial relationships, as demonstrated by Rad and Busch (2011). These MCDM methods provide robust frameworks for integrating datasets; however, their application requires well-structured, high-resolution data to ensure precise predictions.
Previous studies, such as those by Seltmann and Porter (2005) and Yakubchuk et al. (2012), have highlighted the tectonic and lithological framework of the region, while Berger et al. (2010) used remote sensing techniques to assess porphyry Cu deposits in Central Asia. Despite these contributions, no systematic methodology exists to define geospatial criteria for prospectivity mapping of porphyry Cu deposits in Kazakhstan. This paper addresses this gap by focusing on the GIS-based analysis of highly prospective porphyry Cu deposits in Kazakhstan as a case study. The spatial attributes of these deposits are integrated into the GIS environment to determine GC. Based on the input parameters extracted from GC, the prospective area map of the porphyry Cu deposit in Kazakhstan has been created. To our knowledge, this is the very first study to use regional-scale GC in a systematic manner for porphyry Cu prospectivity mapping in Kazakhstan. The results serve as a baseline for future exploration efforts in one of the world’s most promising mineral belts. The study defines GC that can be updated with high-resolution deposit-scale datasets, enabling scalability for local exploration targets. This makes the approach applicable at both regional and local scales. The results obtained from this study can be further enhanced by incorporating the Exploration Information System (EIS) as described by Yousefi et al. (2019). The EIS concept fits into the hierarchical nature of mineral exploration which starts with broad regional-scale analyses and progressively narrows down to deposit-scale targeting as higher-resolution data is incorporated. The resultant input parameters that can be used for MPM of Porphyry Cu deposits in Kazakhstan.
2 Study area
The study area includes nine highly prospective porphyry Cu deposits in Kazakhstan (Figure 1), as reported by Seltmann and Porter (2005) and Yakubchuk et al. (2012). It includes a 5- km buffer zone for each deposit, and studies cover each zone’s geophysical and geological characteristics. The deposits include Yubileinoe, Benqala, Bozshakol, Nurkazgan, Kounrad, Borly, Sayak, Aktogai and Koksai.
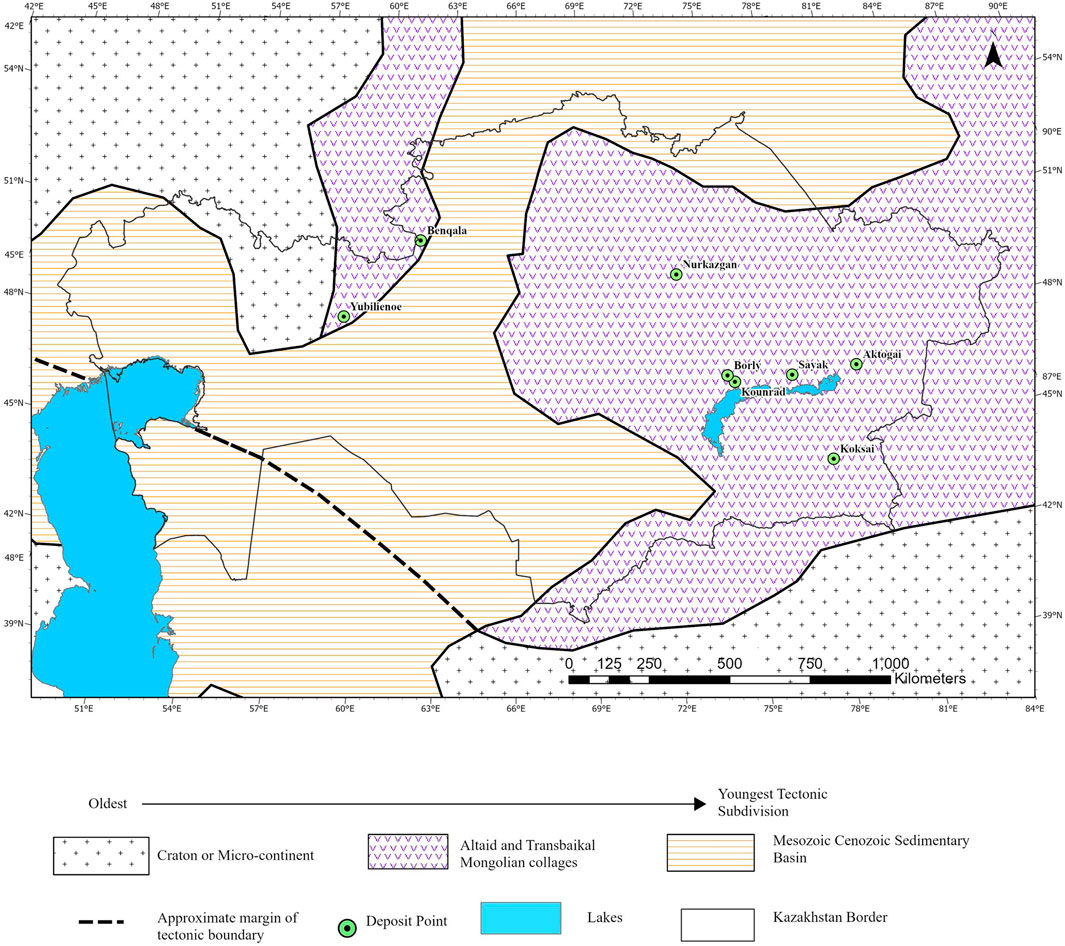
Figure 1. Tectonic Subdivision map of Kazakhstan with study area of porphyry Cu deposits location point (modified from Seltmann and Porter, 2005).
2.1 Bozshakol deposit
The Bozshakol deposit is in the Pavlodar region, Ekibastuz district of Kazakhstan. According to Mutschler et al. (2000), the deposit contains a resource exceeding 1 gigatonne (Gt), with an average grade of 0.67% Cu and 0.05 g/t gold. Proven reserves are estimated at 176.2 million tonnes, with an average grade of 0.72% Cu, 0.014% molybdenum, and 0.28 g/t gold. This deposit was formed approximately 481 million years ago, within the oceanic part of the Kipchak magmatic arc (Kudryavtsev, 1996).
2.2 Nurkazgan deposit
The Nurkazgan deposit is in the Karaganda region, Temirtau district of Kazakhstan. It was formed between the late Silurian and early Devonian period (approximately 410 Ma). It is part of Devonian period Kazakh-Mongol magmatic arc. The deposit contains 65 tonnes of Au and 1.5 million tonnes of Cu, with an average Cu grade of 1.2% and Au grade ranging from 0.4 to 1 g/t (Seltmann et al., 2004). The deposit lies within granodiorite and monzonite porphyries of the Turkulamsky uplift, which intruded host rocks of late Silurian and Devonian (Seltmann et al., 2004).
2.3 Yubileinoe deposit
The Yubileinoe deposit is in the Aqtobe region, Mugalzhar region of Kazakhstan. The deposit is situated within the Urals, in the proximity of the Mugodzhar deep regional fault, which runs north-southwest. It was formed approximately 380 Ma (million years ago) in the Urals-Zharma magmatic arc. Yubileinoe is a medium-sized, Au-bearing ore porphyry deposit containing low- grade Cu ore (Seltmann et al., 2004).
2.4 Aktogai deposit
The Aktogai deposit is in the Abbay region, in the district of Ayagoz of Kazakhstan. According to Zvezdov et al. (1993) and Seltmann et al. (2004), the deposit is related to granodiorite stock with porphyritic texture, which is further intersected by the elongated stock of mineralised granodiorite and plagiogranite porphyries. The orebody is characterized by an elliptical annular shape at its surface.
2.5 Kounrad deposit
The Kounrad deposit is in the Karaganda region, Balkhash city in Kazakhstan. It was formed during the Upper Paleozoic period in the Kazakh-Mongol magmatic arc. According to Zvezdov et al. (1993) and Mutschler et al. (2000), the estimation of Kounrad deposit contained over 800 million tons of ore prior to the commencement of mining, with an average Cu grade of 0.62% and sporadic concentrations of Au that reach up to 0.76 g/t. As of 1996, the remaining reserves, primarily composed of hypogene mineralization, were reported to comprise 220 Mt of ore, with grades of 0.35% Cu and 0.1 g/t Au (Seltmann et al., 2004).
2.6 Koksai deposit
The Koksai deposit is in the Jetisu region, Kerbulak district of Kazakhstan. According to Seltmann et al. (2004) the deposit contains an estimated 320 Mt of ore, with an average Cu grade of 0.52% and Au content of 0.12 g/t. This deposit lies within a porphyry laccolith which intrudes Lower to Middle Carboniferous dacitic and rhyolitic lavas and unconformably overlies Silurian basement rocks (Seltmann et al., 2004).
2.7 Borly deposit
The Borly deposit is in the Karaganda region, Aktogay district of Kazakhstan. According to Seltmann et al. (2004), the deposit is hosted within a Carboniferous intrusive body, which is a part of Kyzylzhalsky pluton. The deposit contains estimated average grades of 0.03 g/t Au and 0.34% Cu (Seltmann et al., 2004).
2.8 Sayak deposit
The Sayak deposit is in Karaganda region, Balkhash district of Kazakhstan. It is a part of the upper Paleozoic Kazakh-Mongol magmatic arc and lies in the geological zone called Balkhash- Ili. This geological zone also encompasses the significant Kounrad and Aktogai Group porphyry Cu-Au deposits (Bespaev et al., 2004). The deposit is medium-sized containing Cu and Au. It is hosted within Middle Carboniferous rocks and is associated with granodiorite intrusions (330 Ma) (Seltmann et al., 2004).
2.9 Benqala deposit
The Benqala Deposit is in the Aktobe region, Ayteke Bi district of Kazakhstan. The deposit is estimated to contain approximately 30 tonnes of Au with an average grade of 0.3 g/t, with roughly 100 million tons of ore. The Cu grade is estimated on average 0.42%, while the copper grade in the oxide zone is 0.55% (Seltmann et al., 2004).
3 Materials and methods
The research paper focuses on a comprehensive GIS analysis of the nine most potential regions of porphyry Cu deposits in Kazakhstan. A buffer zone of 5 km around each deposit point was created to analyse geological and geophysical characteristics within these area zones. The objective is to define patterns and spatial associations of these deposits in the GIS environment, which results in developing the geospatial criteria.
Mapping mineral prospectivity has been done using different methodologies, from traditional knowledge-driven approaches to advanced data-driven algorithms. To address specific limitations observed in previous approaches, both methodologies are used in this study. Previous knowledge-driven methods, such as the weight of evidence (WoE) approach and fuzzy logic, rely on using expert judgment to integrate multiple geospatial datasets, whereas this research systematically determine GC using regional-scale datasets, which minimizes subjective bias inherent in knowledge-driven methods. Furthermore, a GIS-based Venn diagram analysis makes the integration process transparent and reproducible. In contrast to machine learning models, the GIS-based methodology used in this study avoids overgeneralization by directly linking geospatial criteria to known mineralization processes. This ensures that the identified prospective areas are geologically significant and localized. The study utilizes a deterministic approach through Venn diagram analysis, emphasizing the intersections of GC instead of probabilities. This reduces the complexity of the modeling process while maintaining relevance geoscientific concepts. The Venn diagram approach ensures that only zones satisfying all criteria (e.g., favorable gravity and magnetic anomalies, high fault density) are identified, providing a straightforward and interpretable output.
3.1 Data collection
Lithological and age information for the buffer zones have been digitised from the Russian Geological Research Institute (VSEGIE) maps at a scale of 1:500,000. The location of the deposits, the fault layer, and the regional geophysical (i) Anomalous magnetic Field thematic map layer – 5 M scale (ii) Gravimetric thematic map layer – 2.5 M scale have been derived from the Center for Russian and Central EurAsian Mineral Studies (CERCAMS) database (Seltmann et al., 2005).
The datasets were compared and associated geospatially using GIS analysis, which relied on the available geological and geophysical data. The methodology workflow is divided into various steps as follows:
The workflow for determining geospatial criteria and creating a prospective area map for porphyry Cu deposits in Kazakhstan involves two primary input datasets that are categorised into geology (lithology, age, tectonics) and geophysics (gravity and magnetic data) (Figure 2). These datasets are integrated into a GIS platform, where geospatial criteria are developed for each layer and analysed using Venn analysis to identify regions that follow GC. The process results in the creation of a porphyry Cu Prospective Area map, which highlights potential areas for porphyry copper deposits in Kazakhstan based on the detailed analysis of geological and geophysical data.
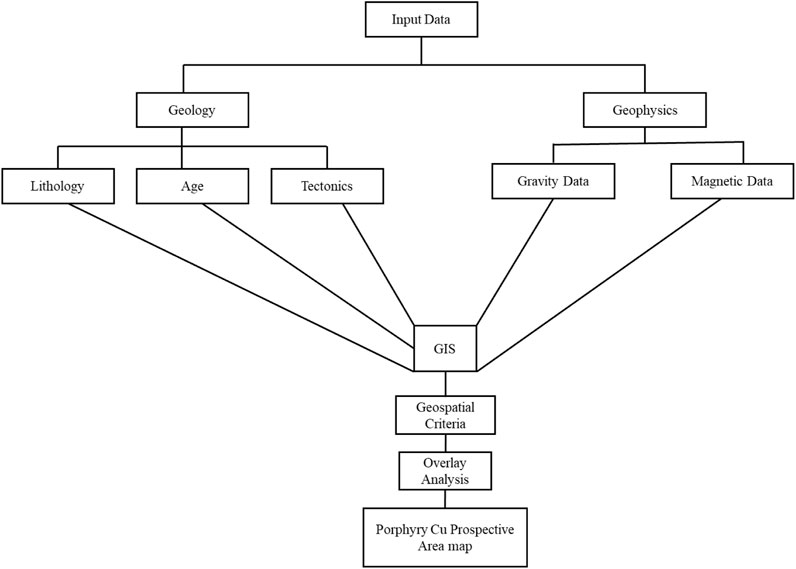
Figure 2. Research Methodology workflow schematic illustration.
To analyze a diverse range of spatial datasets, the GIS-based workflow used in this study utilizes overlay and Venn diagram analyses. Overlay analysis pinpoints zones that satisfy multiple geospatial criteria simultaneously, while the Venn diagram analysis can be used to prioritize prospective areas by showing the intersections of key datasets. These techniques improve the quality and accuracy of the prospectivity map by ensuring that only regions with overlapping geospatial parameters are selected. However, the methodology assumes equal weight for all input layers, which may oversimplify geological processes. Despite these limitations, the GIS methodology provides a framework that is both efficient and interpretable for mapping mineral prospectivity at the regional scale.
The prospect area map uses three data layers at different scales for regional scale analysis of the country (Table 1). These include the gravity layer, magnetic layer, and Fault layer. The gravity layer is a vector layer of the gravimetric field at a scale of 2.5 M. The ranges in mGal unit are < −450, −450, −425, −400, −375, −350, −325, −300, −275, −250, −225, −200, −175, −150, −125, −100, −75, −50, −25, 0, +25, +50, +75, +100, +125, > +125. The magnetic layer is the vector layer of an magnetic field (anomalous) at a scale of 5 M. The ranges of value in nT unit are < −500, −500, −300, −100, 0, +100, +300, +500, +1,000, > +1,000. Fault Density (FD) is calculated using the total length of faults within the buffer zone divided by the total area of the buffer zone using the formula:
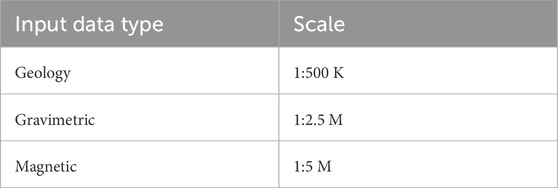
Table 1. Showing scale for each dataset used in the study.
Lb = Length of fault within the buffer Zone.
Ab = Total area of Buffer Zone.
Total area of buffer Zone = π * (5 km)2 = 78.54 km2.
An overlay Venn diagram analysis of three different spatial datasets—Gravity Anomaly Zone (G), Magnetic Anomaly Zone (M) and Fault Density (F)—specific to porphyry Cu deposits was performed using the intersection tool in GIS:
A= (G∩M)∩F.
A is the prospect area zone (Red), where all three dataset values intersect (see Figure 3).
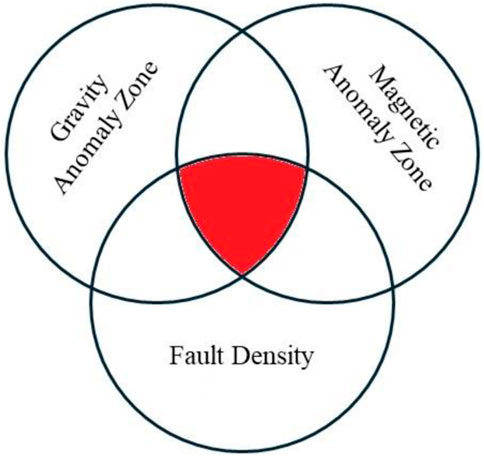
Figure 3. Schematic Illustration of overlay analysis Venn Diagram based on Geospatial Criteria.
The study is confined to the regional-scale analysis, as indicated in Table 1. It identifies only large-scale patterns and relationships. In this respect, the results and spatial criteria can be relevant at small scales, while the models may not pick the scale details. This limitation, however, highlights the need for the district and deposit scale studies to modify Geospatial criteria for deposit scale.
3.2 Geospatial criteria
The Geospatial Criteria (GC) were developed based on four key relationship types (See Figure 4)
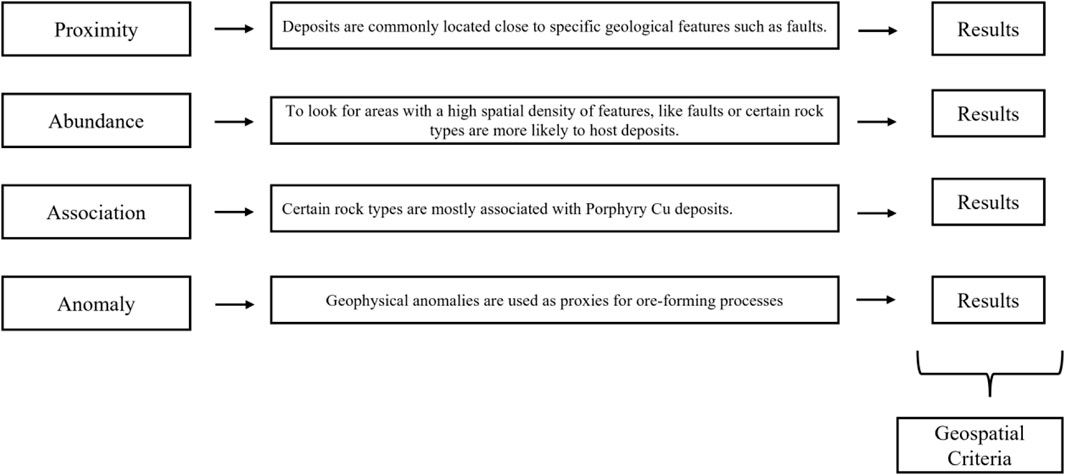
Figure 4. Creation of Geospatial Criteria methodology.
4 Results
4.1 Geospatial criteria for porphyry Cu deposits
This research has analysed the GC indicative of Porphyry Cu deposits. These criteria have been derived from the lithology, age, gravity, and magnetic properties of known deposits in Kazakhstan (Figure 5).
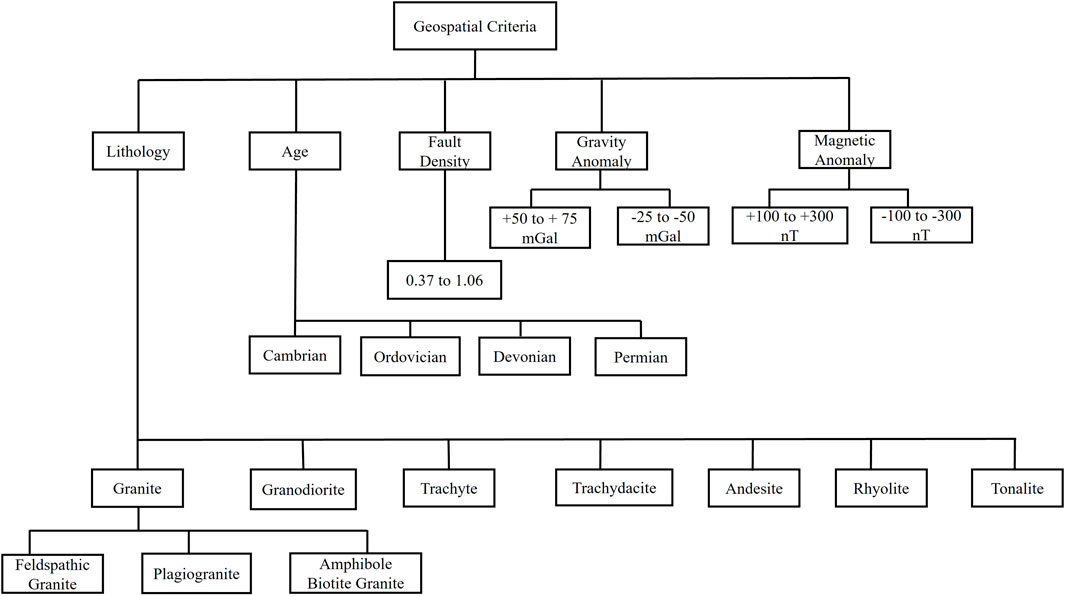
Figure 5. Geospatial Criteria for Porphyry Cu deposits in Kazakhstan.
4.2 Geological characteristics
The lithologies associated with Porphyry Cu deposits in Kazakhstan mainly include felsic to intermediate intrusive rocks and volcanic rocks (Table 2). Typical lithologies identified are felsic intrusive rocks such as granite, granodiorite, quartz diorite, tonalite, and plagiogranite; intermediate to mafic intrusive rocks, such as diorite, gabbro diorite; and volcanic rocks, such as trachybasalt, trachyte, trachydacite, andesite, basalt, rhyolite, quartz porphyrites (Figure 6). The geographic distribution pattern of such rock types could be considered a critical geospatial criteria for porphyry Cu deposits in Kazakhstan.
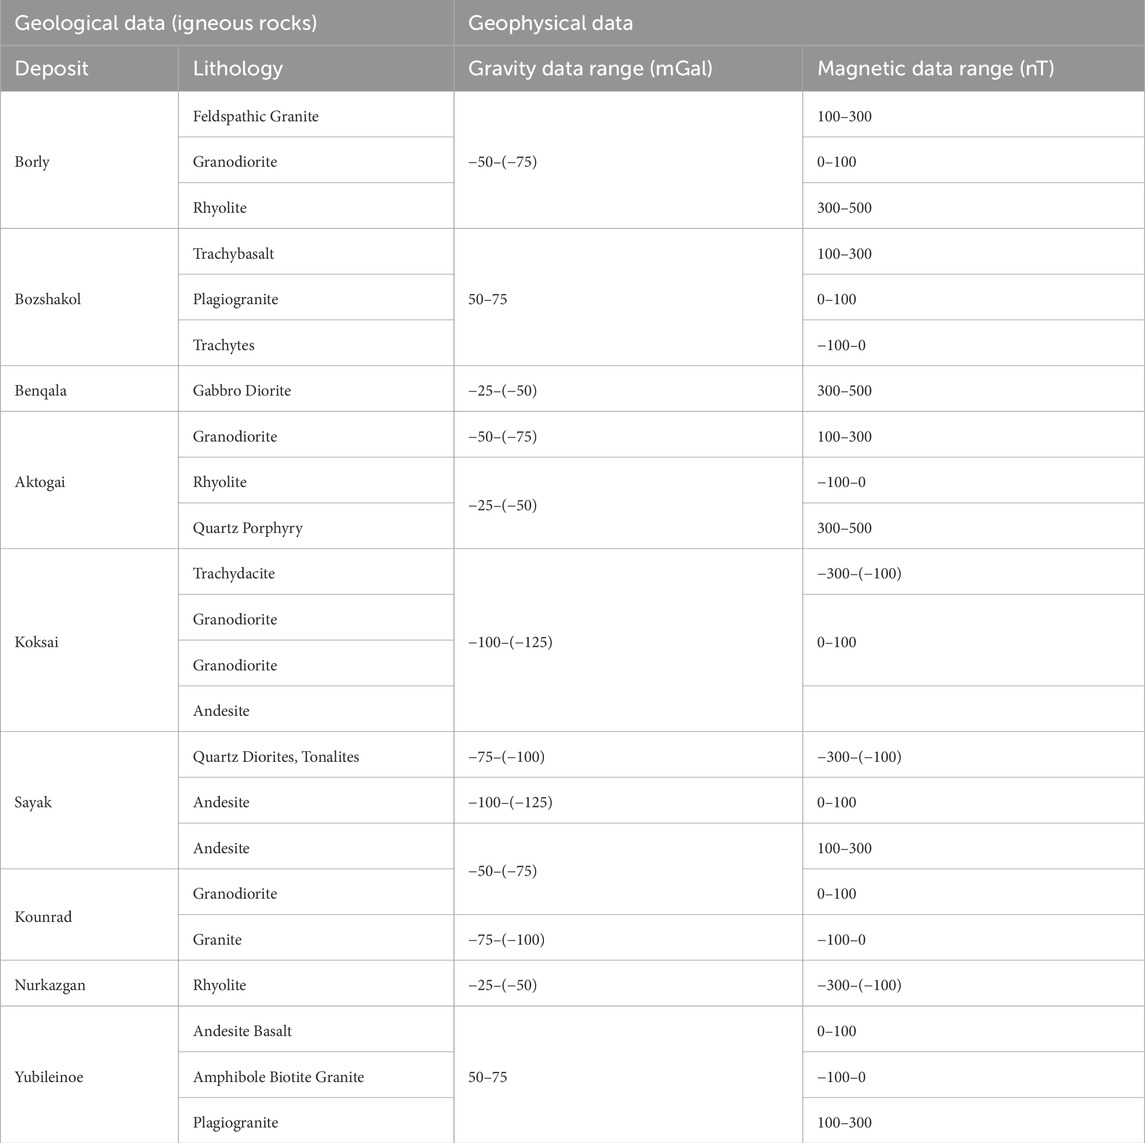
Table 2. Geospatial attributes of porphyry Cu deposits of Kazakhstan.
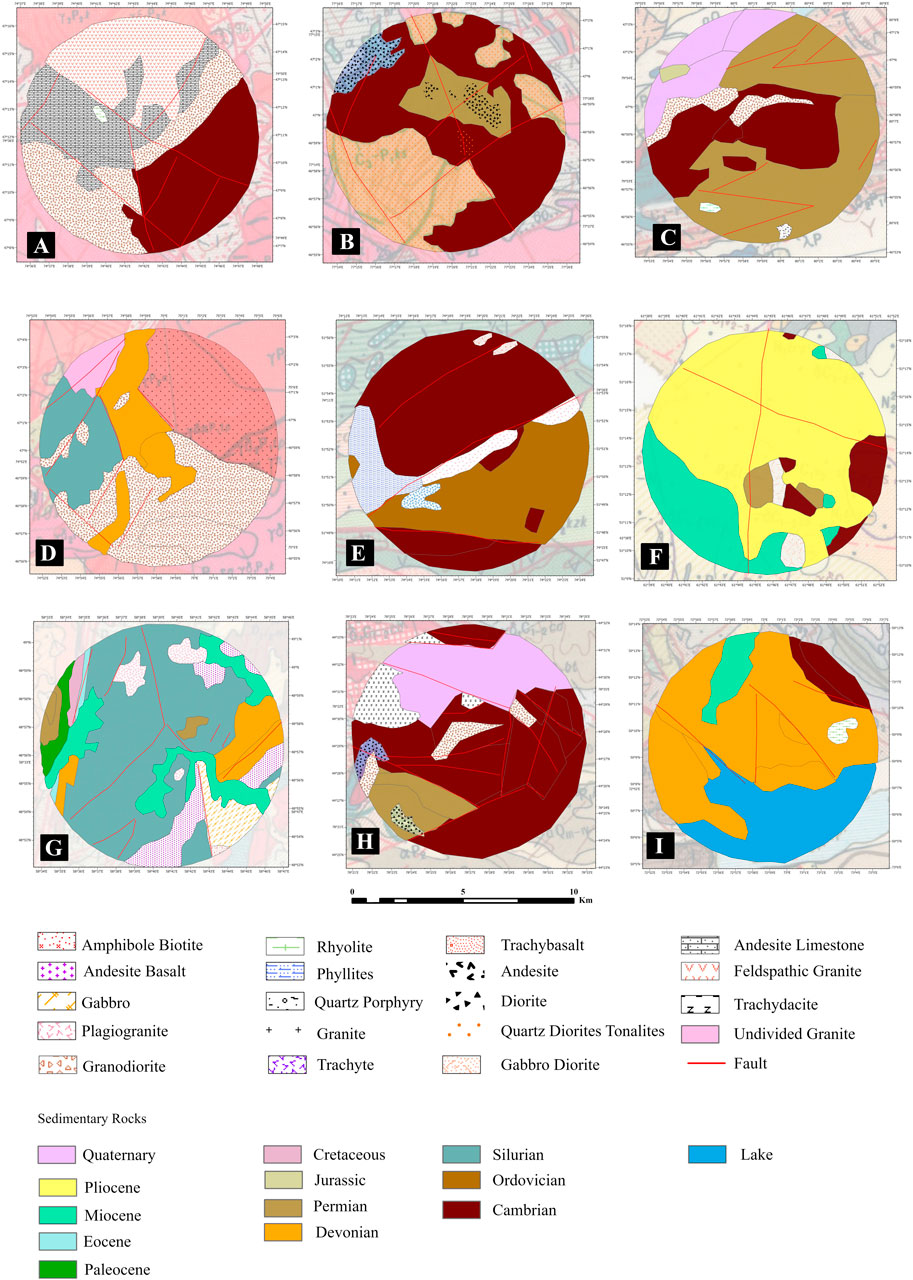
Figure 6. Geological map of 9 Porphyry Cu deposits (5 km Buffer Zone) of Kazakhstan. (A) = Borly, (B) = Sayak, (C) = Aktogai, (D) = Kounrad, (E) = Bozshakol, (F) = Benqala, (G) = Yubileinoe, (H) = Koksai, (I) = Nurkazgan.
The age of deposits spans several geological periods, with a significant concentration in the Permian, Cambrian, Devonian, and Ordovician periods. This suggests that these periods are critical for forming Porphyry Cu deposits in the study area. Figure 7 illustrates the Fault Density for each Porphyry Cu deposit buffer zone in Kazakhstan. The highest fault density is observed at Koksai, which suggests it has a more extensive fault network within the buffer zone than the other sites.
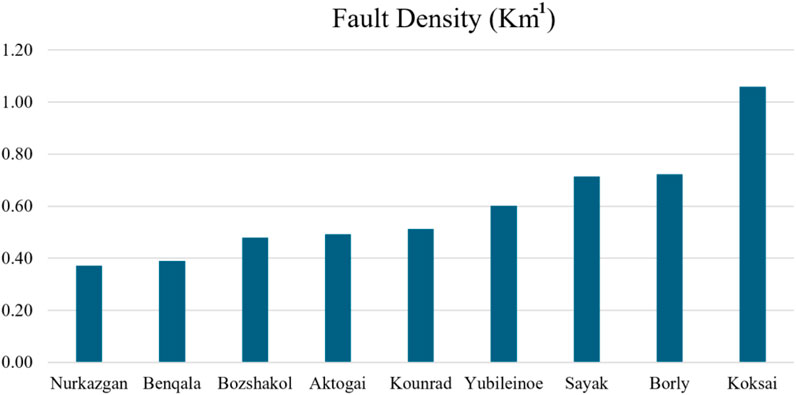
Figure 7. Showing Fault Density for each deposit.
4.3 Geophysical characteristics
Analyzing the geophysical signatures of known porphyry Cu deposits within the region was used to determine the threshold Geophysical values.
4.3.1 Gravity anomalies
The buffer zone’s gravity data show that porphyry Cu deposits are associated with positive and negative gravity anomalies (Figure 8). The ranges include a positive anomaly of +50 to +75 mGal and a negative anomaly of −25 to −50 mGal, with more negative values up to −100 mGal in some cases.
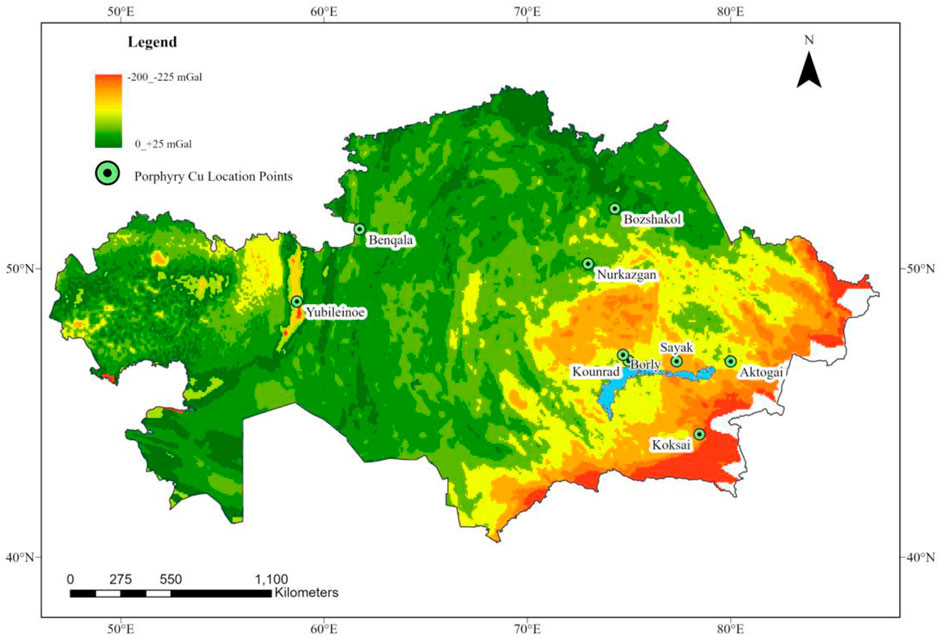
Figure 8. Thematic Gravimetric map of Kazakhstan with porphyry Cu deposit’s location points.
4.3.2 Magnetic anomalies
The magnetic signature of porphyry copper deposits can provide valuable insights into their geological context and the processes that led to their formation. The ranges include Positive Anomalies +100 to +300 nT and negative Anomalies −300 to −100 nT (Figure 9).
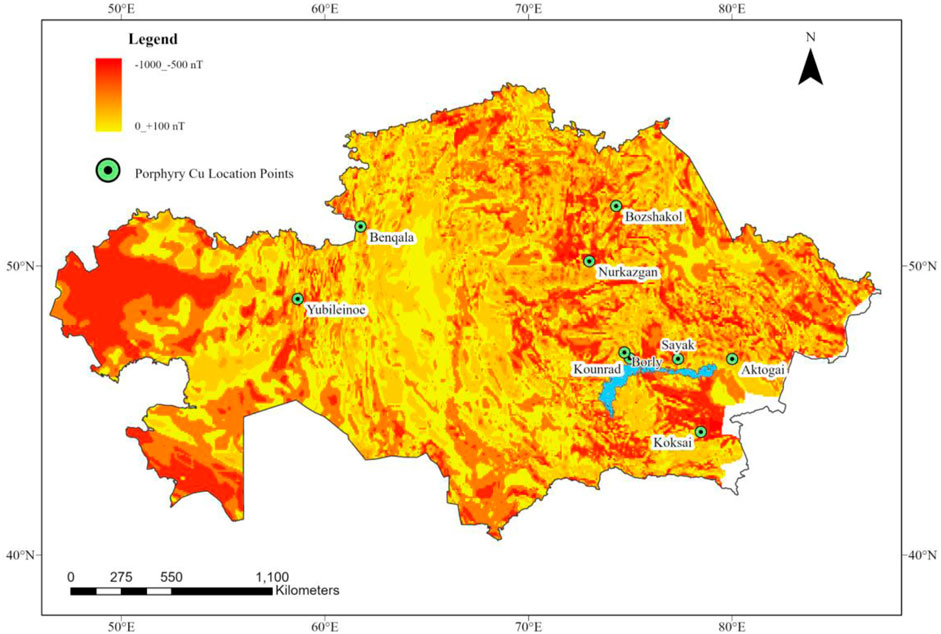
Figure 9. Thematic Magnetic map of Kazakhstan with porphyry Cu deposit’s location points.
4.3.2.1 Geophysical data limitations
The resolution needed for identifying subtle anomalies associated with deeply buried mineral deposits may not be available from the regional-scale geophysical data used in this study. Smaller-scale geological features that are critical for deposit-scale targeting may be overlooked by gravity and magnetic datasets at 2.5 M or 5 M scales. To address this limitation, future work should include high-resolution geophysical surveys. Non-mineralized geological structures, such as large mafic intrusions, fault zones, or sedimentary basins, can produce gravity and magnetic anomalies that resemble the signatures of mineralized intrusions. These interferences can be minimised by incorporating additional datasets, such as lithological maps, geochemical surveys, or alteration patterns, to differentiate between mineralized and non-mineralized anomalies.
The GC was applied as an input to generate a composite prospectivity map (Figure 10). The map highlights areas that meet multiple criteria. Multiple criteria include biased (geological data) and unbiased data (geophysical data). Three key GC-gravity anomalies, magnetic anomalies and Fault Density were integrated into the GIS framework to generate the prospective area map (Figure 10). A Venn diagram technique was employed to overlay the categorised datasets. Zones that met all three criteria were recognized as high-potential areas, while those that do not meet the criteria were not highlighted. The derived map was compared against the locations of nine known porphyry Cu deposits in Kazakhstan. All deposits were found either within or near the high-potential zones, which validates the map’s accuracy qualitatively.
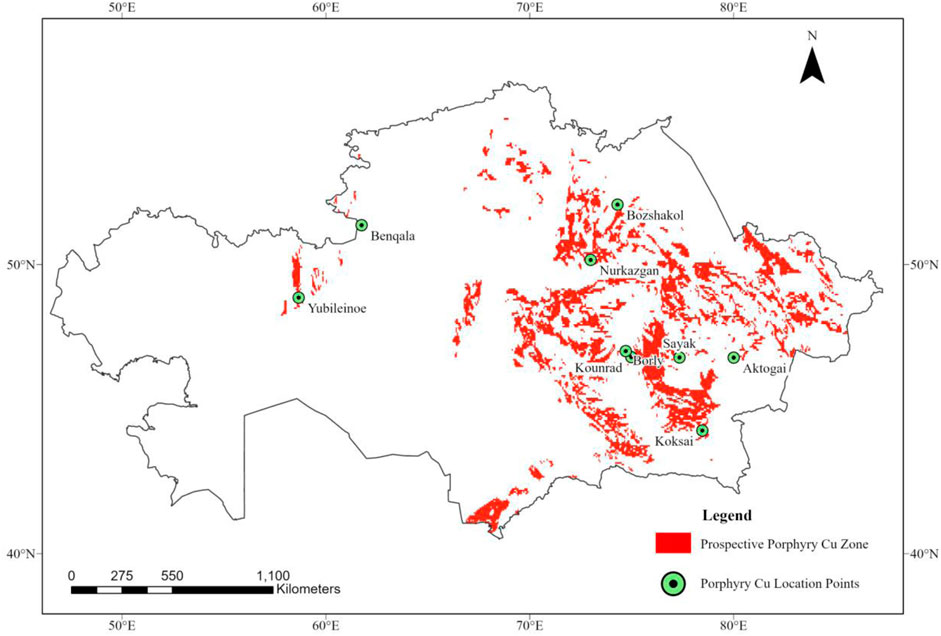
Figure 10. Prospective area map of Porphyry Cu Deposits in Kazakhstan.
5 Discussion
Predicting high-potential areas for mineral deposits through mineral prospectivity mapping uses various algorithms and methods. These algorithms analyse various geospatial datasets to delineate the zones of high-potential mineralisation. The knowledge-driven algorithms include the weight of evidence (WoE) and fuzzy logic. The former method uses a statistical approach which combines the evidence layer and assigned weight based on the absence and presence of mineral deposits in known areas, while the latter method uses fuzzy set theory to handle uncertainty in the data. In this method, different geological layers are assigned degrees of membership (values between 0 and 1) indicating the favourability for mineralisation (Yeh, 1999). Other data-driven algorithms for mineral prospectivity mapping include Random Forest (RF) and Support Vector Machine. However, despite the decades of development of these algorithms, they have yet to be widely used for targeting in mineral exploration. As explained by Hronsky and Kreuzer (2019), these algorithms have two main criticisms. Firstly, they are not valuable for generating new targets in unknown areas; they only generate targets of known deposits. Secondly, they produce a relatively large target area, but the exploration industry requires a focused target area at the deposit scale. The training of these algorithms is heavily reliant on large datasets, and the data must be consistent, well-structured and high resolution which is not always the case for unexplored remote regions and can be biased by imbalanced data. Also, there has been no widely accepted standards for applying these algorithms in mineral prospectivity which reduces industry standards in their reliability. The lack of interpretability of these algorithms is significant challenge to geologists, who require explanation to guide exploration Hronsky and Kreuzer (2019). However, these limitations can be mitigated through simple Venn diagram analysis in GIS. In this process, GC is first defined based on available geospatial data specific to the deposit. Then, intersecting areas that satisfy the GC are visually identified. The outcome is straightforward, understandable, and transparent, enabling geologists to easily comprehend relationships between spatial layers as contrast to advanced algorithms having nonlinear hidden relationship in the data.
There are two main types of data that can be fed into prospectivity mapping; Hronsky and Kreuzer (2019) classify the data into two groups because of their inherent characteristics: biased and unbiased. For instance, regional geophysical data, which is uniformly sampled, is classified as bias-free data, whereas geological data (biased) is more likely to be influenced by an expert’s knowledge of geology. Thus, the objectives of the research paper are to identify the GC or geospatial input parameter from both types of data that would improve the prospectivity mapping algorithm. To reduce the influence of bias, unbiased datasets were utilized to verify the outputs generated from biased datasets. As an example, areas with gravity anomalies that coincide with potential geological features were selected as the input parameter. The reliability of the results was further ensured by comparing them with known deposit locations. Despite these efforts, inherent biases in geological mapping remain a limitation, highlighting the need for higher-resolution datasets in future studies. The mineralisation associated with porphyry Cu deposits is mainly associated with intrusive igneous rocks like granodiorite or quartz monzonite (Mao et al., 2021), and these rocks are primarily present within the buffer zone of porphyry Cu deposits in Kazakhstan. Even though it is not uniformly sampled data, it can provide substantial information for efficiently mapping minerals’ prospectivity when integrated with the regional gravity and magnetic data. Gravity data have been revealed to be a valuable means to prospect porphyry Cu deposits since they can outline the limits of mineralised intrusions and define possible target zones (Marques et al., 2022). A positive anomaly of +50 to +75 mGal and a strong negative anomaly of −25 to −50 mGal indicate areas with dense and potentially mineralised rocks and highly altered rocks, respectively. The study of the magnetic characteristics of the buffer zone shows that most of the porphyry Cu deposits occur in areas with both positive and negative magnetic anomaly values. This suggests that there is magnetite- rich mineralization and magnetite destruction due to hydrothermal alterations in these zones.
The employed simple Venn diagram Analysis in GIS does not account for uncertainty as this method is deterministic with results fully dependent on predefined criteria. However, its simplicity allows expert to manually refine criteria based on geological reasoning.
Furthermore, this study acknowledges the limitations of relying solely on regional-scale data for prospectivity mapping, which, while effective for identifying broad zones of interest, may lack the precision required for targeting specific deposits. Despite these challenges, the study provides a transparent and adaptable framework suitable for regions with limited access to high-resolution data, delivering a practical, cost-effective solution for sustainable mineral exploration in similar geological settings worldwide.
6 Conclusion
This study focuses on determining geospatial criteria (GC) as input parameters for mineral prospectivity mapping at the regional scale, specifically targeting porphyry copper deposits in Kazakhstan. By systematically compiling and integrating tectonic, lithological, geochronological, gravity, and magnetic datasets into a GIS environment, the study identifies spatial attributes associated with highly prospective porphyry copper deposits. The integration of knowledge-driven and data-driven approaches demonstrates the effectiveness of GIS in developing geospatial criteria for regional-scale prospectivity mapping. The resultant prospective area map shows target areas for porphyry copper deposits, providing a valuable tool to guide future exploration in Kazakhstan. A new framework for identifying high-potential areas in a geographically significant region that is still underexplored is provided by this research. The findings are an important basis for mineral exploration in Kazakhstan, allowing for better understanding of the spatial characteristics of porphyry copper deposits.
This study also highlights several areas that require further research. The limitations of regional-scale datasets, such as uniformity of data scales, there is need for high-resolution, deposit-scale data to refine geospatial criteria. In order to enhance prospectivity mapping accuracy and reliability, it is crucial to incorporate advanced exploration datasets, such as detailed lithological, geochemical, and geophysical surveys, in future work.
Additionally, it is suggested to use an Exploration Information System (EIS) to make dynamic updates to geospatial criteria as new datasets become available. This would improve adaptability, allow for continuous refinement of prospective area maps, and improve the methodology for long-term exploration planning. Moreover, sensitivity analysis can be conducted with high-resolution datasets to assess the relative importance of input factors and decrease uncertainties in the model.
The GIS-based approach employed in this study to map prospects for porphyry copper deposits can be applied to other mineral-rich regions around the globe, including the Andes, North American Cordillera, and Southeast Asia. The extensive porphyry copper deposits in these regions, like Kazakhstan, make it important to integrate geological (e.g., lithology, tectonics) and geophysical (e.g., gravity and magnetic anomalies) data for exploration. The adaptability of this method lies in its ability to modify geospatial criteria to the unique geological context of different regions. The methodology enhances exploration efficiency by accurately identifying high-potential zones through knowledge-driven and data-driven techniques, which reduces exploration costs and risks. As high-grade ore deposits become scarcer, the mining industry is shifting towards lower-grade but economically viable deposits, making this increasingly important globally.
Data availability statement
The original contributions presented in the study are included in the article/supplementary material, further inquiries can be directed to the corresponding authors. The source GIS data cannot be shared publicly because they are owned by a third party: These commercial data are available from the Centre for Russian and Central EurAsian Mineral Studies (CERCAMS) (r.seltmann@nhm.ac.uk).
Author contributions
ZS: Conceptualization, Data curation, Formal Analysis, Investigation, Methodology, Resources, Software, Validation, Visualization, Writing–original draft, Writing–review and editing. EB: Conceptualization, Data curation, Funding acquisition, Project administration, Supervision, Validation, Writing–review and editing. JN: Funding acquisition, Project administration, Writing–review and editing. RS: Data curation, Resources, Validation, Writing–review and editing. ZR: Data curation, Formal analysis, Project administration, Investigation, Writing–original draft, Writing–review and editing.
Funding
The author(s) declare that financial support was received for the research, authorship, and/or publication of this article. This research was supported by Nazarbayev University through the Faculty Development Competitive Research Grants Program (FDCRGP) (AI and Data Science) for the period 2024–2026, under the Funder Project Reference: 201223FD2607, Collaborative Research Program (CRP) for 2024–2026, under the Funder Project Reference: 211123CRP1606 and Faculty Development Competitive Research Grants Program for the period 2025-2027, under Funder Project Reference: 040225FD4735.
Acknowledgments
The authors highly appreciate the Centre for Russian and Central EurAsian Mineral Studies (CERCAMS) for allowing access to GIS data on mineral deposits of Kazakhstan, and Nazarbayev University for Faculty Development Competitive Research Grant (FDCRGP) (AI and Data Science) for the period 2024–2026, under the Funder Project Reference: 201223FD2607, and Collaborative Research Program for 2024–2026, under the Funder Project Reference: 211123CRP1606.
Conflict of interest
Author ZR was employed by Anglo Rem CA Exploration Mining Ltd.
The remaining authors declare that the research was conducted in the absence of any commercial or financial relationships that could be construed as a potential conflict of interest.
Publisher’s note
All claims expressed in this article are solely those of the authors and do not necessarily represent those of their affiliated organizations, or those of the publisher, the editors and the reviewers. Any product that may be evaluated in this article, or claim that may be made by its manufacturer, is not guaranteed or endorsed by the publisher.
References
Agterberg, F. P. (1992). Combining indicator patterns in weights of evidence modeling for resource evaluation. Nonrenewable Resour. 1 (1), 39–50. doi:10.1007/BF01782111
An, P., and Moon, W. M. (2013). Application of fuzzy set theory for integration of geological, geophysical and remote sensing data. Can. J. Explor. Geophys. 27 (1), 1–11.
Berger, B. R., Mars, J. L., Denning, P., Phillips, J. D., Hammarstrom, J. M., Zientek, M. L., et al. (2010). Scientific investigations report. Reston, VA: U.S. Geological Survey.
K. A. Bespaev, S.Z. Daukeev, B. S. Uzhkenov, L. A. Miroshnichenko, A. K. Mazurov, and M. A. Sayduakasov (2004). Atlas of mineral deposit models of the Republic of Kazakhstan. Committee of geology and subsoil protection of the ministry of energy and mineral resources of the republic of Kazakhstan; K.I. Satpaev Institute of Geological Sciences (Almaty, Kazakhstan: K.I. Satpaev Institute of Geological Sciences), 141.
Bonham-Carter, G. F. (1994). Geographic information systems for geoscientists – modelling with GIS. Computer methods in the geosciences 13. Oxford: Pergamon, 398.
Cunningham, C. G., Singer, D. A., Zappettini, E. O., Waldo, V. S., Celada, C. M., Quispe, J., et al. (2007). A preliminary quantitative mineral resource assessment of undiscovered porphyry copper resources in the Andes Mountains of South America. SEG Newsl. 71, 1–13. doi:10.5382/segnews.2007-71.fea
Dadykin, B. C., Dadykina, O. V., and Nikitina, A. O. (2021). Methods of assessing the mineral potential in the geographic information analytical system. IOP Conf. Ser. Mater. Sci. Eng. 1079 (6), 062059. doi:10.1088/1757-899X/1079/6/062059
Grupe, F. H. (1990). Geographic information systems: an emerging component of decision support. J. Inf. Syst. Manag. 7 (3), 74–78. doi:10.1080/07399019008968360
Harris, J. R., Grunsky, E., Behnia, P., and Corrigan, D. (2015). Data- and knowledge-driven mineral prospectivity maps for Canada's North. Ore Geol. Rev. 71, 788–803. doi:10.1016/j.oregeorev.2015.01.004
Hronsky, J. M. A., and Kreuzer, O. P. (2019). Applying spatial prospectivity mapping to exploration targeting: fundamental practical issues and suggested solutions for the future. Ore Geol. Rev. 107, 647–653. doi:10.1016/j.oregeorev.2019.03.016
Joly, A., Porwal, A., McCuaig, T. C., Chudasama, B., Dentith, M. C., and Aitken, A. R. A. (2015). Mineral systems approach applied to GIS-based 2D-prospectivity modelling of geological regions: insights from Western Australia. Ore Geol. Rev. 71, 673–702. doi:10.1016/j.oregeorev.2015.06.007
Knox-Robinson, C. M., and Wyborn, L. A. I. (1997). Towards a holistic exploration strategy: using geographic information systems as a tool to enhance exploration. Aust. J. earth Sci. 44 (4), 453–463. doi:10.1080/08120099708728326
Kreuzer, O. P., Yousefi, M., and Nykänen, V. (2020). Introduction to the special issue on spatial modelling and analysis of ore-forming processes in mineral exploration targeting. Ore Geol. Rev. 119, 103391. doi:10.1016/j.oregeorev.2020.103391
Kudryavtsev, Y. K. (1996). “The Cu-Mo deposits of Central Kazakhstan,” in Granite Related Ore Deposits of Central Kazakhstan and Adjacent Areas; INTAS-93-1783 Project. Editors S. Shatov, L. Kremenetsky, Popov, and Ermolov (St. Petersburg: GLAGOL Publishing House), 119–144.
Maleki, M., and Emery, X. (2020). Geostatistics in the presence of geological boundaries: exploratory tools for contact analysis. Ore Geol. Rev. 120, 103397. doi:10.1016/j.oregeorev.2020.103397
Mao, J., Zheng, W., Xie, G., Lehmann, B., and Goldfarb, R. (2021). Recognition of a Middle–Late Jurassic arc-related porphyry copper belt along the southeast China coast: geological characteristics and metallogenic implications. Geology 49 (5), 592–596. doi:10.1130/G48615.1
Marques, F., Dias, P., Carvalho, J., Represas, P., Spicer, B., Araújo, V., et al. (2022). 3D constrained gravity inversion and TEM, seismic reflection and drill-hole analysis for new target generation in the Neves–Corvo VMS mine region, Iberian pyrite belt. Nat. Resour. Res. 31 (5), 2321–2346. doi:10.1007/s11053-022-10081-4
Mutschler, F. E., Ludington, S., and Bookstrom, A. A. (2000). Giant porphyry-related metal camps of the world - a database. U.S. Geological Survey Open-File Report 99-556. Version 1.0.
Nikitin, N. O., Revin, I., Hvatov, A., Vychuzhanin, P., and Kalyuzhnaya, A. V. (2022). Hybrid and automated machine learning approaches for oil fields development: the case study of Volve field, North Sea. Comput. and Geosciences 161, 105061. doi:10.1016/j.cageo.2022.105061
Porwal, A., and Carranza, E. J. M. (2015). Introduction to the Special Issue: GIS-based mineral potential modelling and geological data analyses for mineral exploration. Ore Geol. Rev. 71, 477–483. doi:10.1016/j.oregeorev.2015.04.017
Rad, A. R. J., and Busch, W. (2011). Porphyry copper mineral prospectivity mapping using interval valued fuzzy sets topsis method in Central Iran. J. Geogr. Inf. Syst. 03 (04), 312–317. doi:10.4236/jgis.2011.34028
Saaty, T. L. (1980). Some comments on the analytic Hierarchy process. J. Operational Res. Soc. 41 (11), 1073–1076. doi:10.2307/2582904
Seltmann, R., and Porter, T. M. (2005). The porphyry Cu-Au/Mo deposits of Central Eurasia: 1.Tectonic, geologic and metallogenic setting and significant deposits (issue 2). Linden Park, Australia: PGC Publishing.
Seltmann, R., Shatov, V., Guriev, G., Yakubchuk, A., and Dolgopolova, A. (2005). “GIS package on mineral deposits database and thematic maps of Central Eurasia,” in Mineral deposit research: meeting the global challenge. Editors J. Mao, and F. P. Bierlein (Springer Berlin Heidelberg), 1331–1334.
R. Seltmann, V. Shatov, and A. Yakubchuk (2004). Mineral deposits database and thematic maps of Kazakhstan and central Asia, scale 1:1 500 000, ArcGIS 10.1 package and explanatory notes: Centre for Russian and Central Eurasian Mineral Studies (CERCAMS) (London: Natural History Museum), 120.
Singer, D. A. (1995). World class base and precious metal deposits; a quantitative analysis. Econ. Geol. 90 (1), 88–104.
Singer, D. A., Berger, V. I., and Moring, B. C. (2002). Porphyry copper deposits of the world: database, maps, and preliminary analysis (No. 2002-268). Menlo Park: US Geological Survey.
Singh, A., Dash, D., Kumar, R., and Sarkar, N. K. (2022). Multi-thematic geoscience data integration for identification of mineral potential areas in parts of central Indian precambrian craton. J. Geol. Soc. India 98 (10), 1466–1474. doi:10.1007/s12594-022-2194-8
Woodhouse, S., Lovett, A., Dolman, P., and Fuller, R. (2000). Using a GIS to select priority areas for conservation. Comput. Environ. Urban Syst. 24 (2), 79–93. doi:10.1016/S0198-9715(99)00046-0
Yakubchuk, A., Degtyarev, K., Maslennikov, V., Wurst, A., Stekhin, A., and Lobanov, K. (2012). “Tectonomagmatic settings, architecture, and metallogeny of the central Asian copper province,” in Geology and genesis of major copper deposits and districts of the world (Littleton, CO: Society of Economic Geologists Inc., Special Publication).
Yeh, I.-C. (1999). Modeling chaotic two-dimensional mapping with fuzzy-neuron networks. Fuzzy Sets Syst. 105 (3), 421–427. doi:10.1016/S0165-0114(97)00263-7
Yousefi, M., Kreuzer, O. P., Nykänen, V., and Hronsky, J. M. A. (2019). Exploration information systems – a proposal for the future use of GIS in mineral exploration targeting. Ore Geol. Rev. 111, 103005. doi:10.1016/j.oregeorev.2019.103005
Yousefi, M., and Nykänen, V. (2017). Introduction to the special issue: GIS-based mineral potential targeting. J. Afr. Earth Sci. 128, 1–4. doi:10.1016/j.jafrearsci.2017.02.023
Keywords: geospatial criteria, porphyry Cu deposits, geographic information system, exploration, Kazakhstan
Citation: Shah Z, Bayramov E, Neafie J, Seltmann R and Rahnama Z (2025) Determination of geospatial criteria and prediction of potential areas for porphyry copper deposits in Kazakhstan. Front. Earth Sci. 13:1489969. doi: 10.3389/feart.2025.1489969
Received: 02 September 2024; Accepted: 03 February 2025;
Published: 05 March 2025.
Edited by:
Phaedon Kyriakidis, Cyprus University of Technology, CyprusReviewed by:
Venkatramanan Senapathi, National College, Tiruchirappalli, IndiaWei Xi, University of Chinese Academy of Sciences, China
Akshay Kumar, Indian Institute of Technology Bombay, India
Copyright © 2025 Shah, Bayramov, Neafie, Seltmann and Rahnama. This is an open-access article distributed under the terms of the Creative Commons Attribution License (CC BY). The use, distribution or reproduction in other forums is permitted, provided the original author(s) and the copyright owner(s) are credited and that the original publication in this journal is cited, in accordance with accepted academic practice. No use, distribution or reproduction is permitted which does not comply with these terms.
*Correspondence: Zahid Shah, zahid.shah@nu.edu.kz; Emil Bayramov, emil.bayramov@nu.edu.kz