- 1School of Mining and Geosciences, Nazarbayev University, Astana, Kazakhstan
- 2Institute of Geodesy and Geoinformation Science, Technical University of Berlin, Berlin, Germany
- 3Laboratory of Space and Geoinformation Technologies, Institute of Ionosphere, Almaty, Kazakhstan
- 4Faculty of Mechanics and Mathematics, Al-Farabi Kazakh National University, Almaty, Kazakhstan
- 5Department of Surveying and Geodesy, Satbayev University, Almaty, Kazakhstan
- 6School of Science and Humanities, Nazarbayev University, Astana, Kazakhstan
- 7School of Agricultural and Food Sciences, ADA University, Baku, Azerbaijan
The research goal of these studies was to monitor ground deformations for Almaty city during 2017–2023 and determine the spatial relationships with faults and tectonic plate boundaries. The small baseline subset interferometric synthetic aperture radar (SBAS-InSAR) was deployed for the interferometric measurements of ground deformations using Sentinel-1 radar satellite images. Distinct deformation patterns were observed from both sides of the tectonic plate boundary, indicating a standard faulting process. Identical deformation trends were observed from south to north, forming three transition zones from subsidence to uplift and subsidence again. The spatial relationship between faults and ground deformations was also observed in the transition zone with a densely built-up area subject to gradual surface declination with potential risks to infrastructure. Five incidents of building and bridge deformations with subsiding cumulative trends were observed in the same location. Most subsiding areas were in Zone 1, with maximum annual subsidence velocity and cumulative displacement of − 57 mm/y and – 399, respectively. In contrast, most uplifting areas were primarily in Zone 2, with maximum yearly uplift velocity and cumulative displacement of 40 mm/y and 254 mm, respectively, and mixed deformation patterns in Zone 3. These vertical movements in Almaty verify active tectonic plate activity that should be integrated into city risk assessment plans.
1 Introduction
The earthquakes in the Turkish region of Kahramanmarash in 2023 and two recent Almaty earthquakes in 2024 created a severe panic about the safety of Almaty city (hereafter referred to as Almaty) (Wang et al., 2023; Kobayashi et al., 2023; Gkougkoustamos et al., 2023; Reuters, 2024; Eurasianet, 2024; Hubbard and Bradley, 2024). These seismic events became lessons for Kazakhstan and a reminder of the need for continuous monitoring in Almaty and more sophisticated urban planning and permissions for construction activities in compliance with the standards for seismically active areas. Even though GPS stations and vibration motion sensors are primarily prioritized as monitoring tools in Almaty, they do not provide the capacity to observe actual, detailed, and broad-scale ground deformations to determine and analyze what is going on with the surface deformations of Almaty (Fabris et al., 2022). This creates complications for sophisticated urban planning and decision-making regarding safety when providing construction permits and required engineering standards. Besides, historical maps of active tectonic faults left by the Soviet Union do not offer any detailed and dynamic information about what is going on with the surface changes and possible activation of tectonic faults.
For Almaty, the studies on ground deformations using interferometric measurements are limited. The last research on Almaty’s ground deformation was performed using PS-InSAR interferometric measurements for ENVISAT ASAR images (Zhantayev et al., 2014). This research indicated ongoing ground deformation with the subsidence velocity reaching −10.85 mm/y and uplift velocity reaching 4.7 mm/y during 2003–2006. Another study primarily focused on the probabilistic general seismic zoning maps of the territory of Kazakhstan and the large-scale PSHA (probabilistic hazard assessment) maps of Almaty based on the large amount of available geological, geophysical, and tectonic data (Silacheva et al., 2018). The studies of (Silacheva et al., 2020) focused on mapping peak ground accelerations (PGA) for practical use in construction calculations, probabilistic maps of seismic microzonation, maps of soil categories by seismic properties, and geotechnical zoning (Amey et al., 2021). mapped geomorphic expressions of faults from satellite DEMs and ran earthquake scenarios for Almaty (Grützner et al., 2017). studied the tectonic geomorphology of the range-front fault using field observations, differential GPS measurements of fault scarps, historical and recent satellite imagery, meter-scale topography derived from stereo satellite images, and decimeter-scale elevation models from unmanned aerial vehicle (UAV) surveys (Tikhomirov et al., 2001). monitored deformation processes of Almaty prognostic test ground using tiltmeters and extensometers (Torizin et al., 2009). developed the composite historical catalog from different catalogs for mapping seismicity rates, the subsurface geometry of prominent fault zones to better estimate seismic sources, and a 3D seismotectonic model consisting of different tectonic units. Most studies were performed using ground-based seismological and geotechnical techniques but could be improved by promoting interferometric technologies to be part of complex seismic analyses for Kazakhstan. Interferometric measurements are intensively used in Kazakhstan’s petroleum and gas oil fields (Bayramov et al., 2022; Bayramov et al., 2024).
It is well known that a permanent scatterers interferometric synthetic aperture radar (PS-InSAR) method proposed by (Ferretti et al., 2001) and the SBAS-InSAR method introduced by (Berardino et al., 2002) have been widely used in urban studies with millimetric accuracy. The SBAS-InSAR technique overcomes the challenges related to the low coherence of some interferograms induced by single super-master images and does not require a high quantity of radar images with respect to PS-InSAR (Zhu et al., 2017).
PS-InSAR is unable to use as many interferograms as it could because for the processing it is using single-master interferometry. The accuracy of deformation monitoring is impacted by the inability to estimate the residual phase error in this manner (Liu et al., 2020; Goldstein, 1995; Hanssen and Feijt, 2001). In order to lessen the impacts of interferometric decorrelation, SBAS-InSAR, another multi-master time-series interferometric stacking method, employed redundant observations (Liu et al., 2020; Lanari et al., 2007; Usai, 2003). The SBAS-InSAR technique merged the various tiny baseline subsets using the decomposition method and chose interferograms with small spatial and temporal baselines that were significantly coherent (Liu et al., 2020; Gonnuru and Kumar, 2018; Shanker et al., 2011).
The objective of the present research was to perform interferometric measurements for Almaty during 2017–2023 to monitor ground deformations and to determine their spatial relationships with faults and tectonic plate boundaries. Although similar kinds of studies with interferometric measurements have been already conducted for other parts of the World (Ferretti et al., 2001; Berardino et al., 2002), our investigations based on elaborated SBAS-InSAR analyses provide new findings and innovations on (1) actual velocity of tectonic plate movement (2) ground-reflected activeness of seismic faults and (3) zoning based on deformation patterns for Almaty city in Kazakhstan. Detailed research goals of the present studies are as follows:
- Surface displacement measurements in Almaty City and its surroundings using SBAS-InSAR for the period of 2017–2023
- Validate the reliability of SBAS-InSAR measurements with time-series GPS measurements and occurred incidents like subsidence of building, bridges and landslides
- Determine spatial relationships of SBAS-InSAR measurements with faults and tectonic plate boundaries
- Develop a zoning map based on spatial ground deformation patterns
- Provide recommendations for short-term and long-term urban planning and decision-making
In comparison with a previous study by (Zhantayev et al., 2014) focused on PS-InSAR measurements for Almaty during 2003–2006, we considered applying the SBAS-InSAR technique because the primary interest is to detect the large-scale deformations of urban land and surrounding areas like mountains and the low-vegetated regions with low-coherence characteristics (Ferretti et al., 2001; Berardino et al., 2002).
This paper is organized as follows: for the introduction section, we introduced relevant studies for Almaty and presented the contribution of our studies as the novelty for Kazakhstan. In the materials and methods section, we introduced the satellite imagery sources, workflow for the SBAS-InSAR interferometric measurements, and geostatistical analyses for detecting ground deformation hotspots. In the discussions section, we described the results and limitations of the study and compared our findings with those of previous studies for Almaty. The conclusions section contains a summary of the present study.
2 Study area
Almaty is the former capital of Kazakhstan, with a population of over two million. It is a major commercial, financial, and cultural center and the country’s most populous and cosmopolitan city. Located in the mountainous area of southern Kazakhstan near the border with Kyrgyzstan in the foothills of the Trans-Ili Alatau with an elevation of 700–900 m, it is well-known that Almaty is at elevated risk of earthquakes due to its location in a zone of seismic activity. Almaty is situated in zones where the maximum magnitudes of expected earthquakes are from 6.0 to 8.3, at the junction of two large plates - the Eurasian and Indian. There are 27 active faults in the city located at a depth of up to 1,200 m (Figures 1A–C). In 1887, 1889, and 1911, devastating earthquakes hit the city, and nowadays, it is possible to feel weekly earthquakes, regularly reported in Kazakhstan news (Reuters, 2024; Eurasianet, 2024; Tengrunews, 2014). The dramatic expansion of Almaty increases the potential consequences, with an uncertain probability of their occurrence in high-magnitude earthquakes.
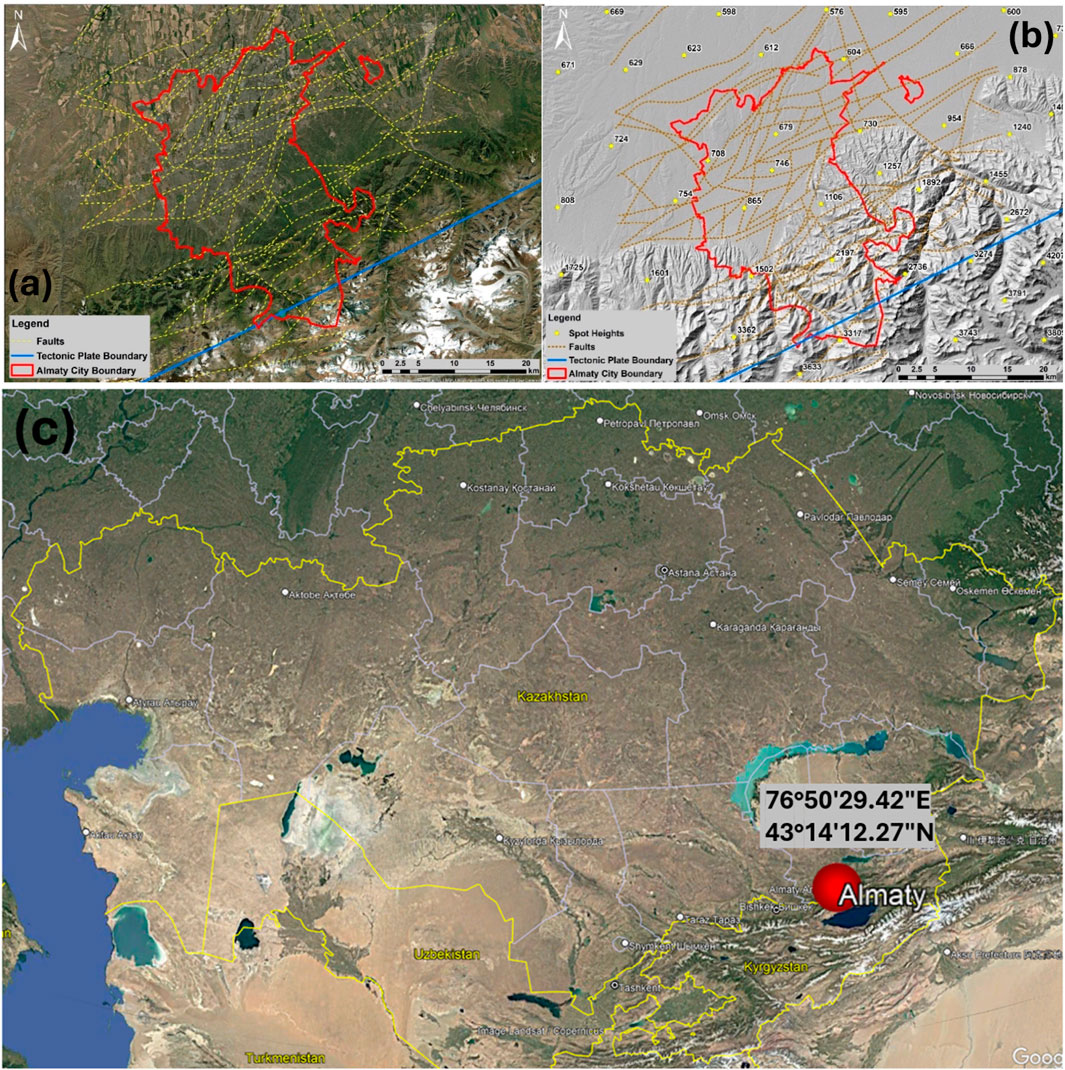
Figure 1. (A) Map of Almaty City with the representation of faults and tectonic plate boundary (B) with Terrain Hillshade (C) Overview map of Kazakhstan with the indication of Almaty City location.
3 Data processing
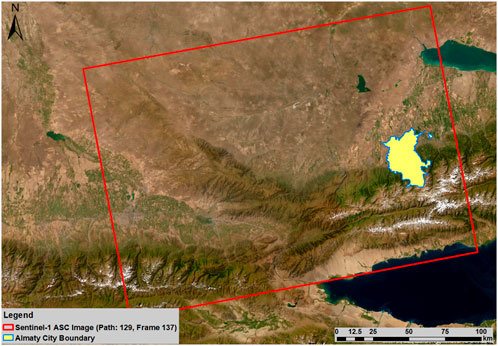
202 Sentinel-1 Ascending Track SAR images from the European Space Agency (ESA) were used for the present studies. SNT1 SAR images covered 7 years, from January 2017 to December 2023. SNT1 satellite mission is a medium resolution of 5 m by 20 m with a 250 km swath. SNT1 was available in VV and VH polarizations. HH and VV polarizations are adequate for interferometric applications considering higher coherence and scattering aspects (Imamoglu et al., 2019; Vaka et al., 2017; Ittycheria et al., 2018). Therefore, we used VV polarization for present studies. The characteristics of the Sentinel-1 SAR images used are presented in Table 1. The footprint of the SNT1 imagery is shown in Figure 2, which fully covers Almaty. The connection graph of the SNT1 images in Figures 3A, B indicates that all SAR images were well connected in time to perform interferometric processing from 2017 to 2023.

Table 1. Characteristics of SAR images used for the present research (Tapete and Cigna, 2019; Yang et al., 2019).
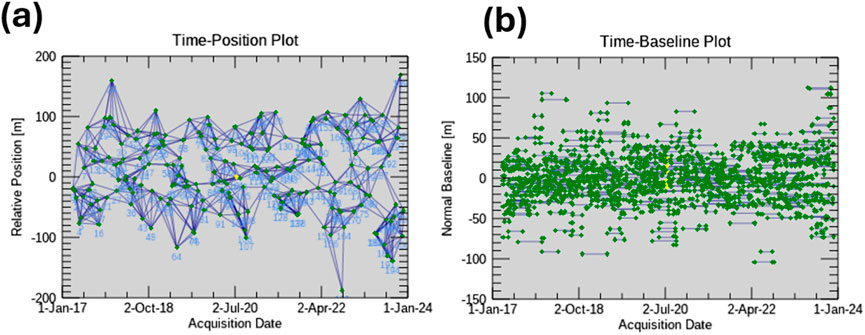
Figure 3. Connection graphs: (A) time-position plot for SBAS-InSAR; (B) time-baseline plot for SBAS-InSAR.
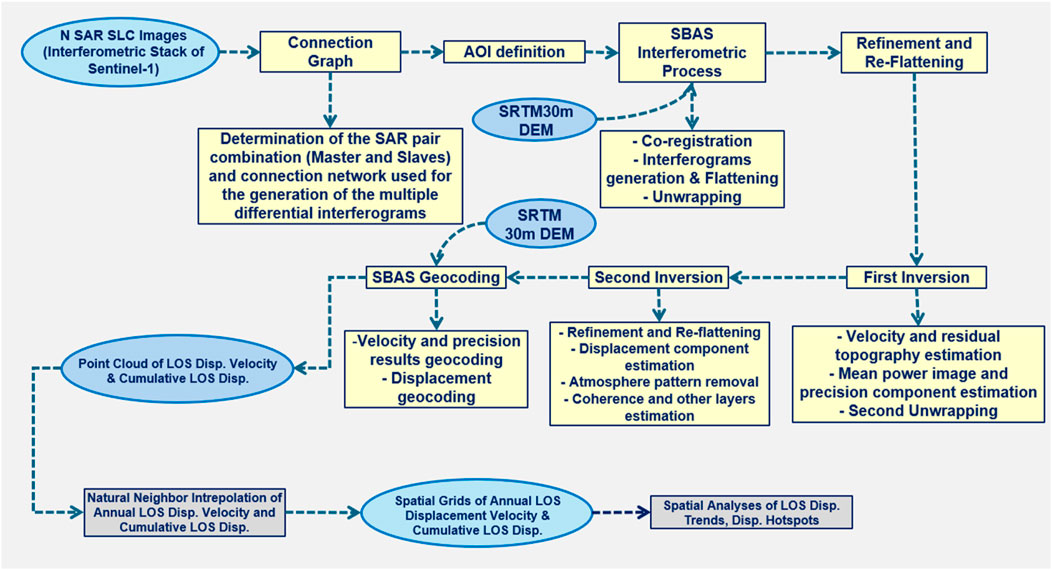
SNT1 SAR images were processed using the Small Baseline Subsets - Interferometric Synthetic Aperture SAR (SBAS-InSAR) technique with the workflow presented in Figure 4 (Berardino et al., 2002; Loesch and Sagan, 2018). The multi-temporal SBAS-InSAR technique is the most appropriate processing approach because it can detect the large-scale deformations of urban land and surrounding areas, like mountains and low-vegetated regions, with low-coherence characteristics. The primary goal of the present research was to detect general ground deformation patterns of Almaty and surrounding areas rather than focusing on the urban infrastructure. Therefore, the SBAS-InSAR technique was optimal for PS-InSAR (Ferretti et al., 2001; Berardino et al., 2002).
For the Connection Graph stage to reduce the geometrical, temporal decorrelation in further interferometric processing, a maximum temporal baseline of 180 days and a degree of redundancy of eight connections per scene were used. These allowed the generating of 816 interferograms for the ASC track of SNT1 images in the SBAS-InSAR Interferometric Process stage. The Shuttle Radar Topography Mission (SRTM) with a 30 m resolution was used for the topographic phase removal (Farr et al., 2007). Goldstein’s method filtered all the interferograms to reduce the signal noise. The Delauney 3D method unwrapped all phases with a coherence threshold of 0.25. In the Refinement and Re-flattening stage, unwrapped interferometric phases were refined and re-flattened using the polynomial method to estimate and remove the remaining phase constants and phase ramps based on the residual phase method. In the interferometric processing stage, to eliminate atmospheric artifacts we integrated GACOS tropospheric delay maps downloaded from the Generic Atmospheric Correction Online Service for InSAR (GACOS) relevant to the acquisition dates and time of SAR imagery.
Further, the First Inversion step allowed us to derive the residual height and the displacement velocity to flatten the complex interferograms by recalculating the phase unwrapping. The Second Inversion allowed filtering displacements with removed atmospheric phase components. SBAS Geocoding was performed to produce geo-referenced velocities and displacements in the satellite line-of-sight (LOS) direction.
The annual LOS velocities and cumulative displacements were interpolated using the Natural Neighbor interpolator to generate gridded surfaces without spatial gaps. The geostatistical interpolation contributed to a simplified interpretation and spatial analytics of ground deformation hotspots.
Validation of interferometric measurements was performed using cumulative displacement measurements from permanently functioning GPS network stations in Almaty.
4 Results
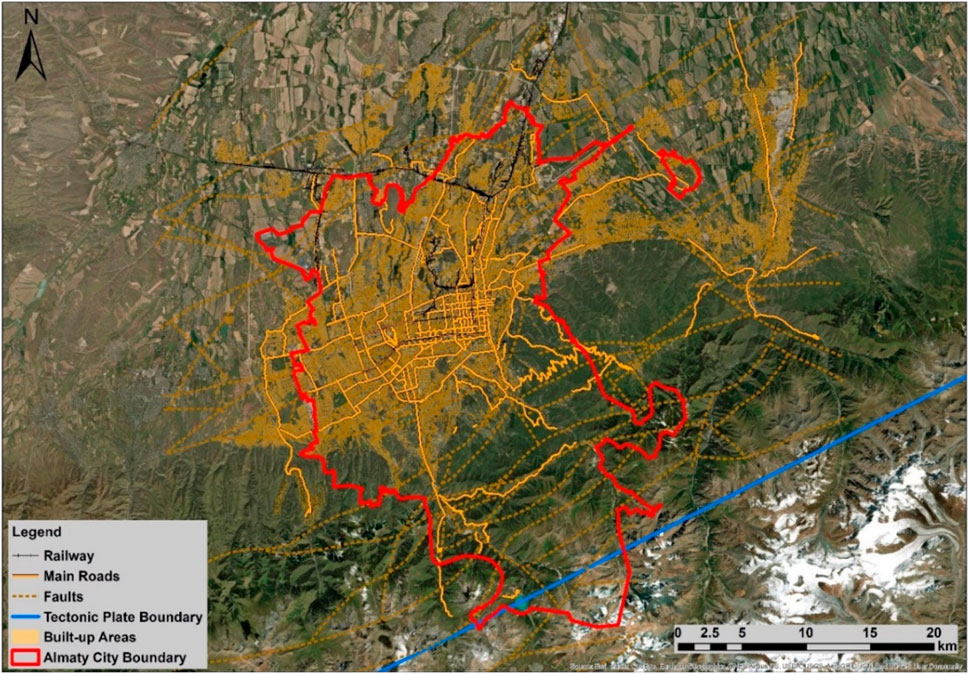
The kernel density of SBAS-InSAR measurements showed that the highest concentration of point cloud was in the built-up areas (Figures 5A, B). SBAS-InSAR measured 4,819,932 points, whereas 1,841,642 points were located within Almaty. The mountainous areas of Almaty had a lower density of interferometric measurements because of decorrelation noise and atmospheric phase artifacts. However, the count of point clouds was sufficient to observe spatial uplift patterns on the northern side and spatial subsidence patterns on the southern side of the tectonic plate boundary (Figures 6A, B). In some places, the annual uplift velocity reached 40 mm/y, and the yearly subsidence velocity reached – 57 mm/y (Figure 6A). The cumulative displacement reached – 399 mm and 254 mm for the most subsiding and uplifting hotspots, respectively (Figure 6B).
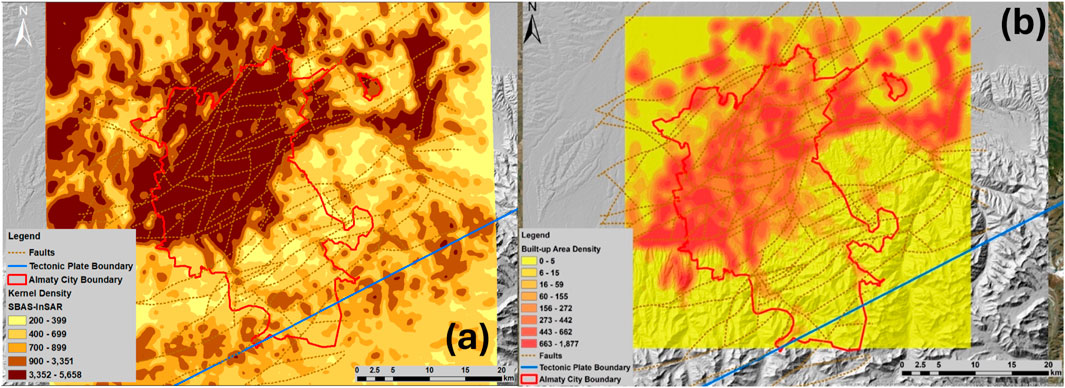
Figure 5. (A) Kernel Density of SBAS-InSAR measurements; (B) Built-up area density in Almaty and surroundings.
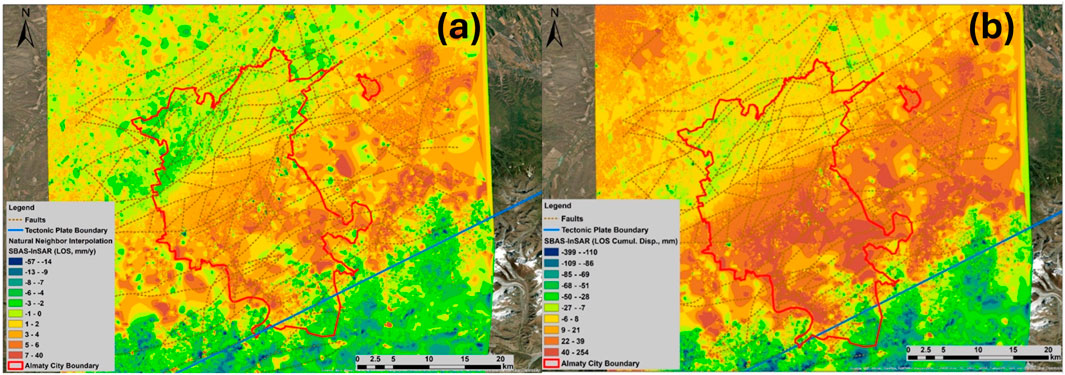
Figure 6. (A) Natural neighbor interpolation of SBAS-InSAR displacement velocity (LOS, mm/y); (B) Natural Neighbor Interpolation of SBAS-InSAR cumulative displacement (mm).
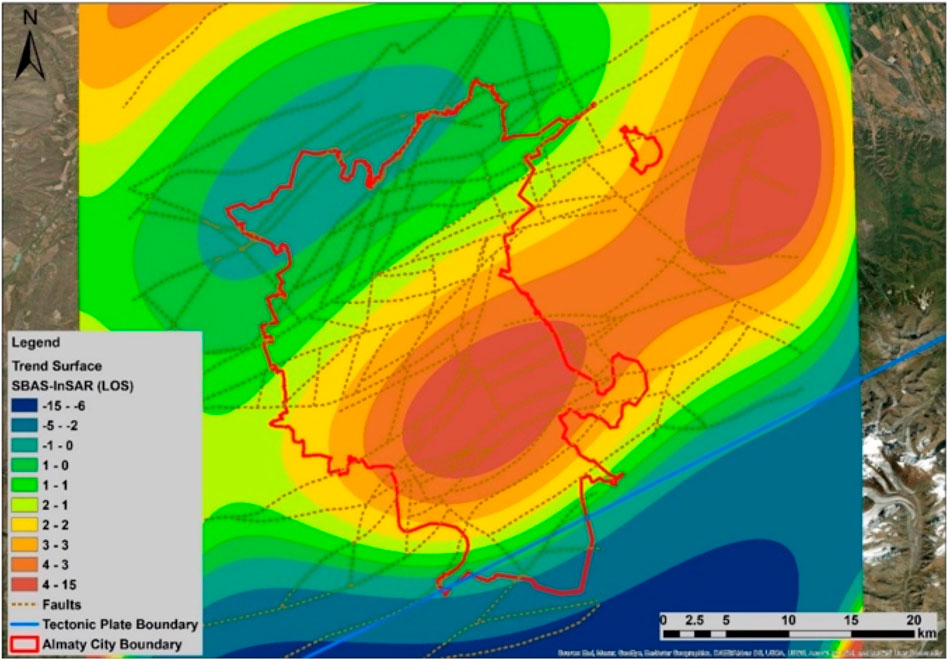
Based on the three-dimensional analyses of ground deformations in Figure 7, it was possible to observe distinct spatial patterns of ground deformations for three conditionally delineated zones along the tectonic plate boundary and faults. Identical deformation trends were observed from south to north, forming three transition zones from subsidence to uplift and subsidence again. Most subsiding regions were in Zone 1, whereas most uplifting areas were in Zone 2. In Zone 3, we could observe various patterns of subsidence and uplifts. These zones were conditionally delineated and presented in Figure 8. In addition, these three zones were also clearly observed in the geostatistical trend analyses shown in Figure 9. The distinct deformation patterns from both sides of the tectonic plate boundary indicated a standard faulting process (Figures 7–9). Strike-slip faulting could not be observed because we did not perform interferometric measurements of horizontal displacements using multiple satellite tracks. Spatial relations were not observed between all other faults and ground deformations.
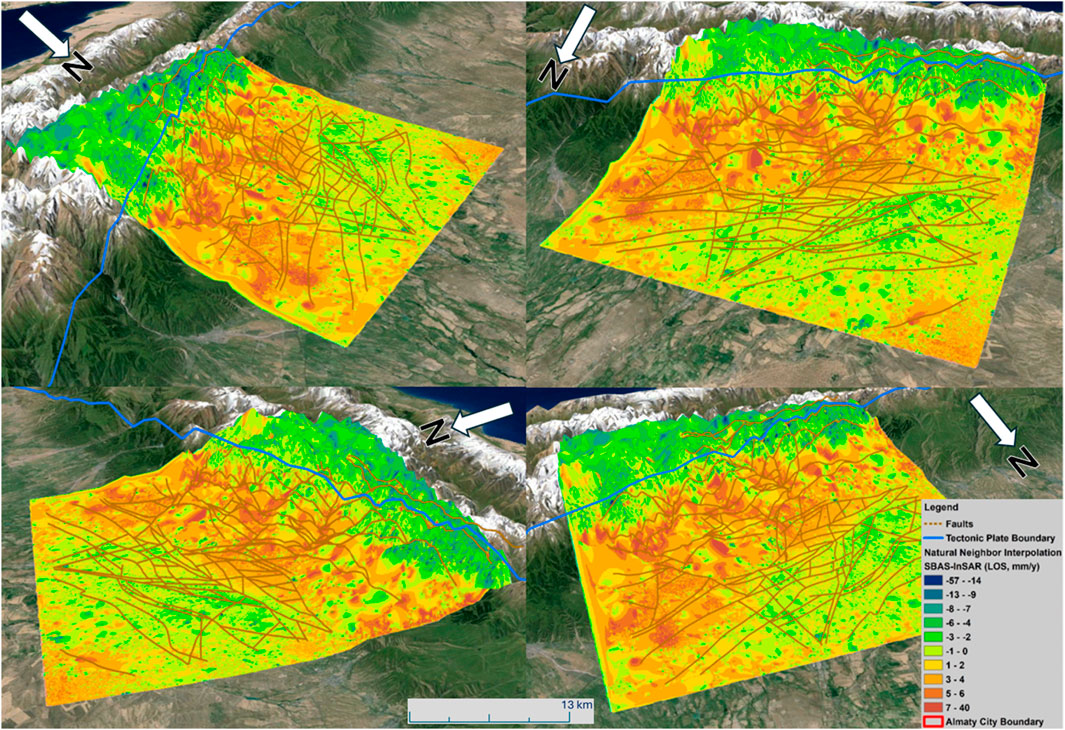
Figure 7. 3D perspective views of natural neighbor interpolation of SBAS-InSAR displacement velocity (LOS, mm/y).
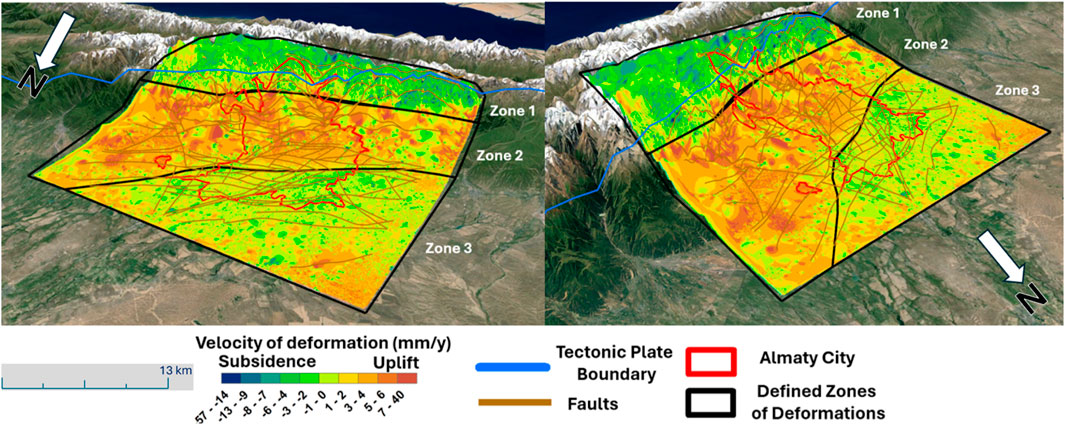
Figure 8. 3D perspective views of delineated zones of distinct uplift and subsidence spatial patterns.
The spatial relationship between faults and ground deformations in the transition from Zone 2 to Zone 3, a densely built-up area, can be observed in Figure 10. This area is subject to gradual surface declination and is a potential risk to infrastructure. Five incidents of building and bridge deformations were observed in the transition area from Zone 2 to Zone 3. They all showed subsidizing trends in cumulative displacements, whereas landslide incidents showed the transition from subsiding to uplifting trends. The maximal subsidence velocity was observed to be −57 mm/y, whereas the maximal uplift velocity was 40 mm/y for our study area. The maximal cumulative displacement was 399 mm and 254 mm for subsiding and uplifting areas, respectively.
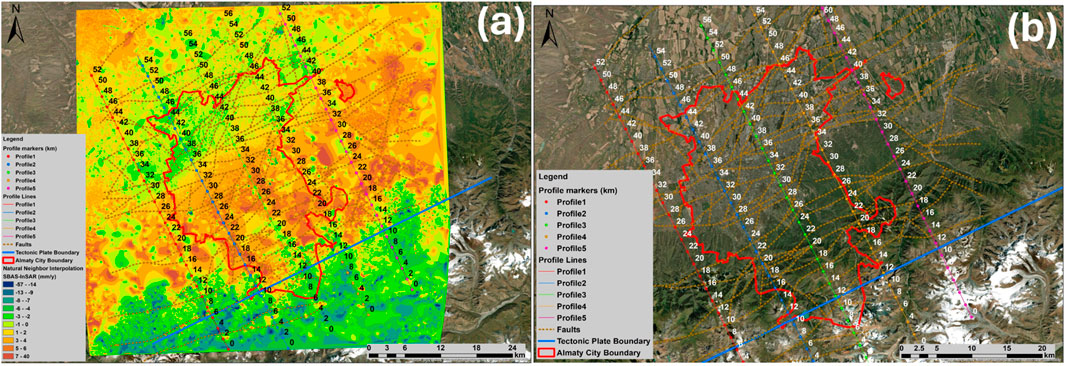
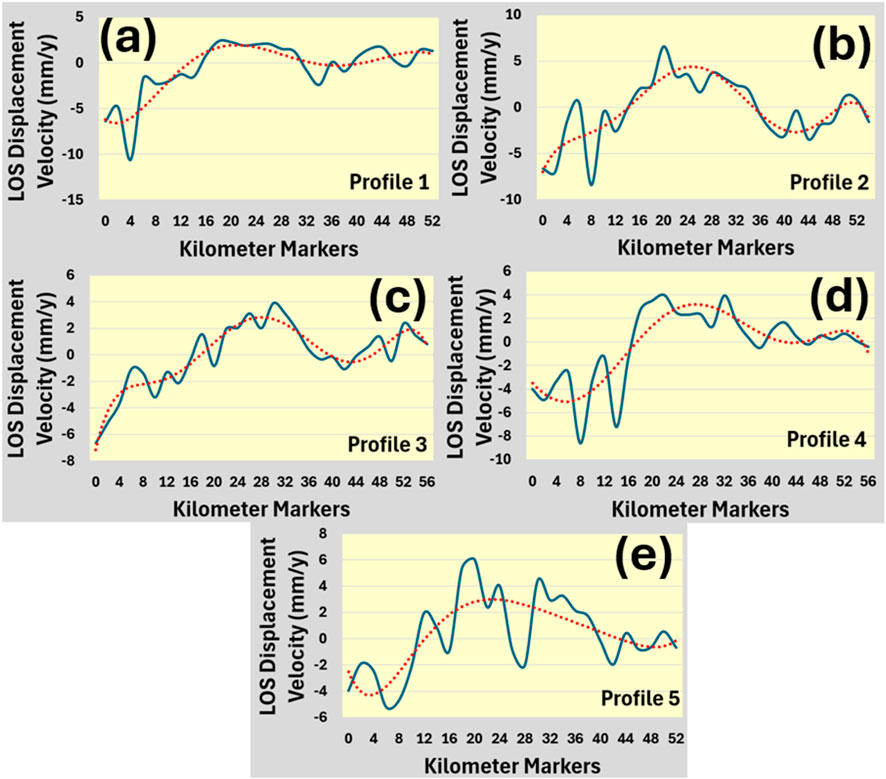
Five profiles of ground deformation in Figures 11A, B revealed identical trend lines in LOS displacement velocities presented in Figures 12A–E from south to north. For the known building and bridge deformations incidents, it was possible to observe the subsidence trends up to — 50 mm (Figures 13A, B). Produced ground deformations revealed initially subsidizing up to — 10 mm and further uplifting cumulative displacement trends up to 40 mm for the known sites of landslide incidents (Figures 13A, B).
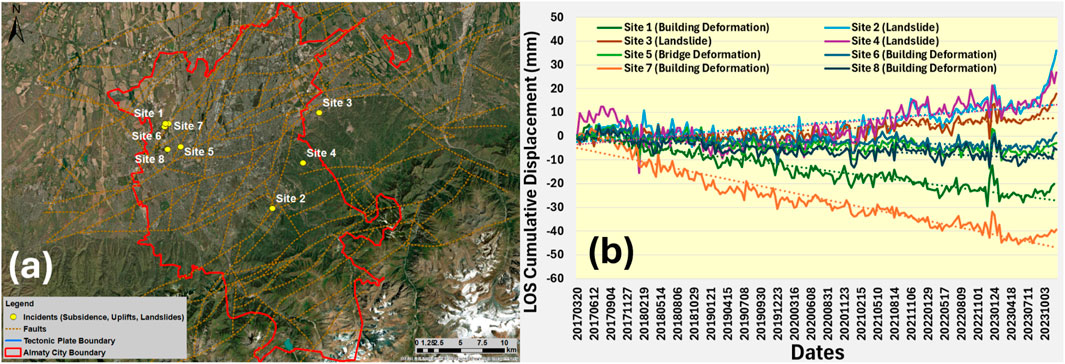
Figure 13. (A) Locations of incidents that occurred in Almaty. (B) Cumulative displacements for the location of occurred incidents.
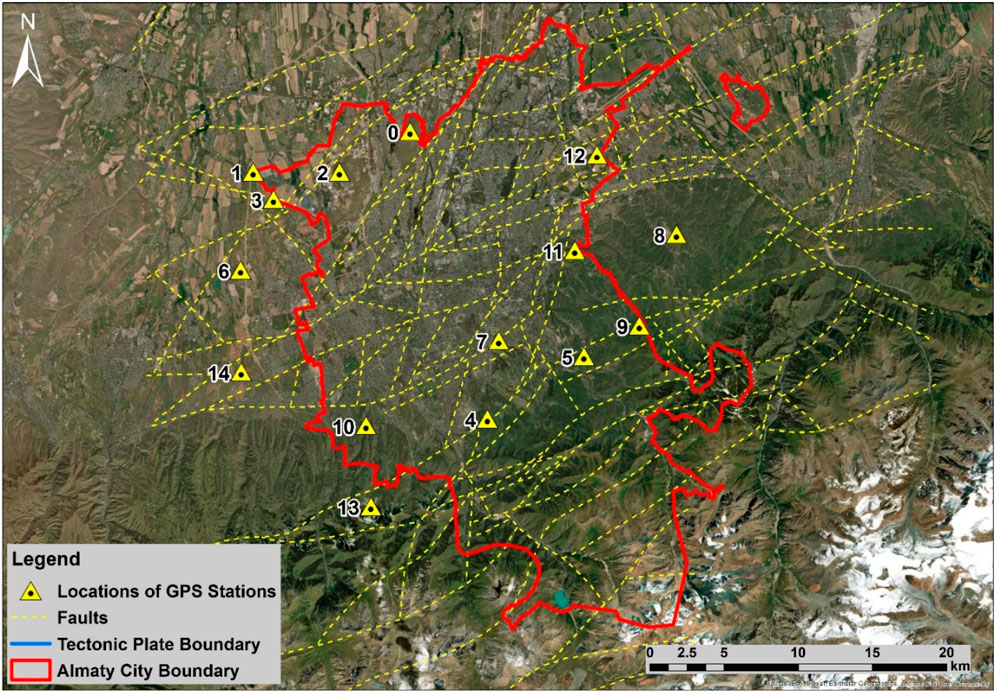
Validation of cumulative displacements measured by SBAS-InSAR and permanently functioning GPS stations 5 and 11 showed a good agreement with regression coefficients higher than 0.85 (Figure 14; Figures 15A, B). Even though interferometric measurements were performed in LOS, they showed a good correlation with GPS measurements. This allowed us to assume that differences between actual vertical displacements and LOS measurements were not significant (32). Moreover, it was possible to assume that the impact of horizontal displacements was not high in Almaty either.
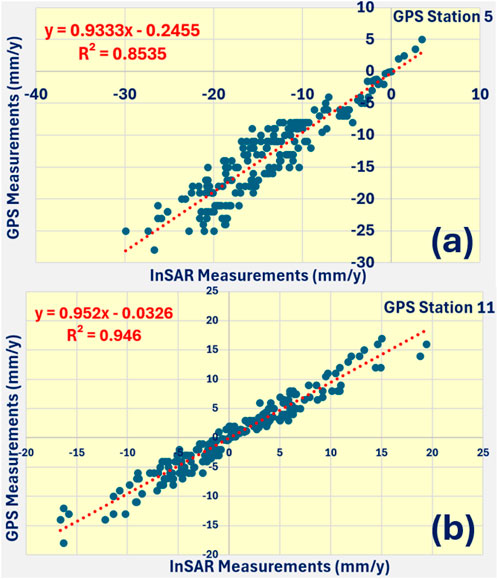
Figure 15. Regression analyses between InSAR and GPS measurements for (A) GPS station 5; (B) GPS station 11.
In the present studies, apart from general ground deformation patterns in Almaty, SBAS-InSAR also allowed to measure ground subsidence on the local detailed level. It was possible to observe in Figure 16 for two sample areas that SBAS-InSAR indicated detailed subsidence patterns with an annual LOS velocity of more than 50 mm located under constructed areas. This means that these areas are subject to potential in-situ inspections and investigations.
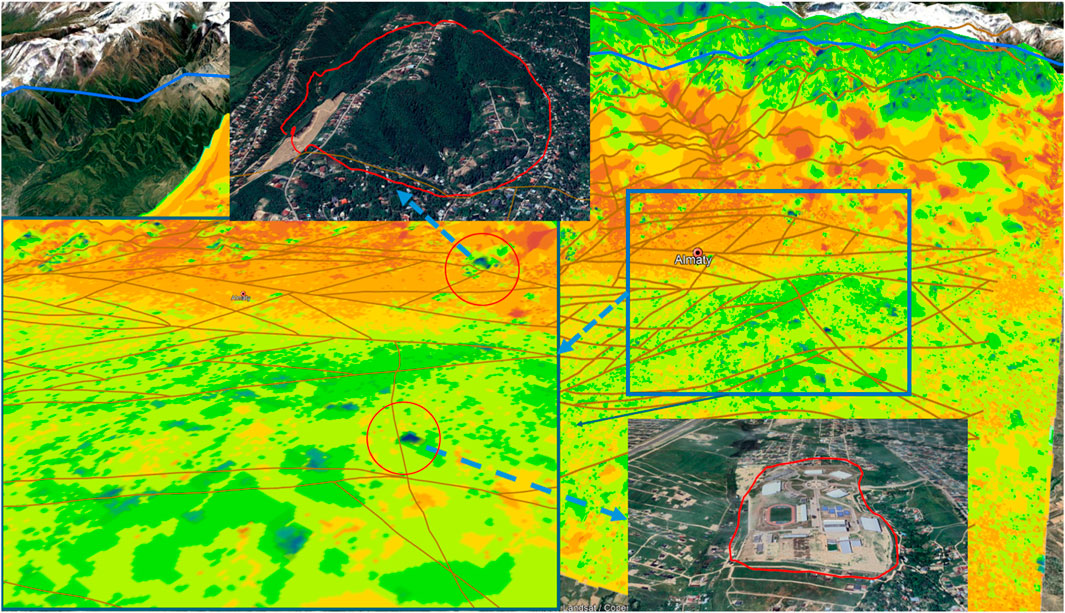
Figure 16. Cases of detected subsidence under constructed areas for potential inspections and investigations.
5 Discussions
The results of our studies revealed distinct spatial patterns of subsidence and uplift processes on each side of the tectonic plate (between Zone 1 and Zone 2) boundary, meaning the normal faulting process (Kentucky Geological Survey, 2024). The maximal subsidence velocity was observed to be −57 mm/y, whereas the maximal uplift was 40 mm/y. Distinct ground deformation patterns at Zone 2 and Zone 3 faults were observed, covered by densely built-up areas, and a gradual uplift to subsidence between these zones could cause a gradual surface declination, potentially damaging buildings and houses.
However, we could not observe a distinct spatial relationship between ground deformation patterns and other faults except for the fault located between Zone 2 and Zone 3. This allowed us to assume that either some of the faults were not subject to active movement processes or were subject to only subsurface movement processes which had not been reflected in surface deformations. This also allowed us to assume that either surface deformations might not be directly related to activation of faults and subject to subsurface investigations or some of the faults were not active (Zhong et al., 2010). Moreover, SBAS-InSAR detected many sparsely distributed subsidence and uplift patterns under built-up areas in Zone 3. This means that some infrastructure is under risks of subductions or uplifts.
Five profiles of ground deformation revealed identical spatial variation trends in LOS displacement velocities. Produced ground deformation revealed initially subsidizing up to – 10 mm and further uplifting cumulative displacement trends up– to 40 mm for the known sites of landslide incidents. It was possible to observe the subsidence trends up to – 50 mm for the known building and bridge deformations incidents.
In contrast with previous geodetic or seismological studies for Almaty, our research goal was to determine how Almaty deformed over many years using high-precision interferometric measurements. The ground deformation patterns and displacement velocities (2003–2006) by (Zhantayev et al., 2014) with limited Almaty coverage did not match our results (2017–2023) either in spatial patterns or in velocities. Our deformation velocities were higher, and we observed more spatial variations in the subsidence and uplift patterns and trends in Almaty. Moreover, we covered a larger area around Almaty to understand the broad scale of deformation processes. This either means that significant changes occurred in the ground deformations of Almaty or differences were caused by applied computational interferometry techniques or radar satellite images, which were low-resolution ENVISAT ASAR radar images in the studies by (Zhantayev et al., 2014).
The verification of SBAS-InSAR measurements based on the in-situ measurements from permanently functioning GPS network and occurred incidents clearly indicated the reliability of measurements with regression coefficients higher than 0.85 and expected patterns of subsidence for damaged buildings and uplift-subsidence patterns of landslides.
However, our studies also exhibited limitations primarily related to actual vertical and horizontal displacements. It is known that InSAR does not directly measure vertical and horizontal displacements. Still, their projection along the LOS direction and based on the decomposition of interferometric measurements from descending and ascending tracks makes it possible to achieve actual vertical and horizontal displacements (Khorrami et al., 2020; Makabayi et al., 2021). Based on the studies of (Bayramov et al., 2021), the differences between LOS and actual vertical deformation were in the range of 3–7 mm. This means that our LOS measurements were sufficient for the determination and quantification of overall deformation trends. This was well reflected in a good agreement of our interferometric measurements with in-situ GPS measurements of cumulative displacements. Besides, based on the high regression coefficient it is also possible to assume that Almaty was not subject to significant horizontal displacements.
The groundwater level increases in Almaty from south to north with a depth variation of 2–70 m. The lowest depth of groundwater was observed towards southern mountainous areas reaching the depth of more than 70 m. The groundwater level varies in the range of 2–18 m for Zone 3, 21–70 m for Zone 2 and more than 70 m for Zone 3 (JICA et al., 2009). Our results showed significant sparsely distributed subduction areas in Zone 3 which is characterized by the high level of groundwater. It is possible to assume that subduction processes in these Zones are controlled by three factors: groundwater level, man-made construction, agricultural activities, tectonics and possibly precipitation. Moreover, it is necessary to emphasize elevation decrease towards north with regular surface water runoff and accumulation in Zone 3. According to (KazTAG, 2021), there are 45 moraine and glacial lakes in Zone 1, of which 12 are especially dangerous. Kazakhstan’s government regularly conducts preventive works to empty the moraine lakes for stable surface runoff to mitigate the flooding risks caused by glacier ablation. Moreover, any earthquake may activate glacier movement toward the city with potential flooding. Almaty is always at risk of flooding because of melting glaciers and direct water flow toward the city (JICA et al., 2009). Annual precipitation rates are also considerable high in the range of 650–700 mm. April and May are the wettest months, during which about a third of the city’s annual precipitation is received. All the water runoff generated by precipitation and glacier melting flows towards zone 3 accelerating the subduction processes.
The mechanical composition of Almaty soil consists of medium loamy, light loamy, pebble, and gravel-pebble, gravelly, clay, clay loam, clay karst. Soil mechanical properties like permeability, stiffness, and strength become more susceptible from south to north in Almaty and its surrounding areas what makes Zone 3 more vulnerable to subduction processes (JICA et al., 2009).
Almaty has a humid continental climate with hot summers and cold winters, characterized by the influence of mountain-valley circulation. The annual average air temperature is equal to 10°C; the coldest month is January, with a temperature of −4.7°C, and the warmest month is July, with a temperature of 23.8°C. Decrease of temperature less than 0°C may also have a negative impact to ground deformation processes caused by frozen soil (Yu et al., 2023).
We performed our interferometric measurements in the satellite LOS direction because of limited computing power and three-month processing time per satellite track. However, to continue these research activities, we plan to integrate interferometric measurements from three more Sentinel-1 satellite tracks to achieve actual vertical and horizontal deformations. Besides, we need help finding detailed information on soil mechanics and groundwater depth maps. Accessibility of these data would contribute to the determination of spatial relationships and more sophisticated risk assessment. Comparison of PS-InSAR and SBAS-InSAR measurements will also be deployed in future studies along with the integration of high-resolution radar satellite missions. Investigating the dynamics of glacier changes and their impact on interferometric measurements is also imperative.
The recommendations from the present studies for short-term urban planning actions and decision making in Almaty are as follows: restriction of construction activities in the transition buffer from Zone 2 to Zone 3, ground inspections of sparsely distributed subduction and uplift zones under buildings and houses in terms of any existing damages in Zone 3. In long-term urban planning and decision making, it is critical to continue ground-based monitoring of any damaged infrastructure. The present research results will obviously attract urban planner and decision makers to perform similar detailed measurements for other seismically active cities in southern part of Kazakhstan with proximity to tectonic plate boundary.
It is crucial to stress that the methods and research framework used in this paper are generalizable and can be expanded to new locations for ground monitoring of other Kazakh cities. Even though the main objective of the current study was to comprehend general ground deformation patterns in Almaty and the adjacent areas, our findings also indicated comprehensive local level measurements for two case sites with possible subsidence that needed to be inspected and investigated by the urban planners, geologists, geohazard and geotechnical experts and decision makers for the preventive measures.
It is crucial to better understand the regional geologic structure and seismicity controlled by movement of two large plates - the Eurasian and Indian. Our studies allowed to more accurately measure annual displacement velocity of plate boundaries crossing Almaty. However, long range and long-term regional monitoring using the permanently functioning network of GPS stations is irreplaceable to understand regional movement processes and their velocities.
It is important to always have the short-term and long-term adaptation, mitigation and response plans to continue proper city planning and construction permissions, cessation of construction activities, prevent subduction processes under infrastructure or timely relocate people from critical areas with high velocity of ground motions. InSAR plays a crucial role for measurements, detection, monitoring, early warning and prioritization of these ground movement susceptible areas on the general and detailed territorial scales.
6 Conclusion
This study revealed distinct deformation patterns from both sides of the tectonic plate boundary, indicating a standard faulting process using interferometric measurements. Three conditionally delineated zones along the tectonic plate boundary and faults were observed. Subsiding areas were observed in Zone 1, uplifting areas were in Zone 2, and various patterns of subsidence and uplifts were apparent in Zone 3.
The previous studies of Almaty, primarily focused on ground-based seismic or optical satellite observations (Silacheva et al., 2020; Amey et al., 2021; Grützner et al., 2017), did not show any of our observed ground deformation patterns. Most of these valuable studies focused on a probabilistic approach to potentially risky areas based on earthquakes, ground measurements, optical space observations, etc. By updating the methods and providing a more extensive study area, this study could be integrated into detailed city risk assessment plans.
This approach is essential for Almaty, a constantly growing city with a population of more than 2.2 million people, where the continued build-up of the city’s residential and industrial complexes makes it even more sensitive to earthquakes. The study observed distinct ground deformation patterns at Zone 2 and Zone 3 faults, covered by densely built-up areas. The fault between these two zones could be considered as the most active one because we could not observe similar deformation patterns at other faults. It is important to emphasize that a gradual uplift to subsidence between these two zones could cause a gradual surface declination, potentially damaging buildings and houses. These deformation patterns could affect the performance of buildings and structures, and updated building codes that meet the needs of not only earthquake-resistant construction but also ground deformation patterns and displacement velocities. Based on our studies, this area needs permanent monitoring and maintenance of construction. Additionally, the applied interferometric measurements used for Almaty will be an essential approach for similar studies in other cities of Kazakhstan.
Data availability statement
The original contributions presented in the study are included in the article/supplementary material, further inquiries can be directed to the corresponding authors.
Author contributions
EB: Conceptualization, Data curation, Formal Analysis, Funding acquisition, Investigation, Methodology, Project administration, Resources, Software, Supervision, Validation, Visualization, Writing–original draft, Writing–review and editing. NS: Conceptualization, Data curation, Formal Analysis, Funding acquisition, Investigation, Methodology, Project administration, Resources, Software, Supervision, Validation, Visualization, Writing–original draft, Writing–review and editing. SN: Funding acquisition, Resources, Writing–review and editing. AY: Funding acquisition, Resources, Writing–review and editing. JN: Writing–review and editing, Funding acquisition. SA: Conceptualization, Data curation, Formal Analysis, Funding acquisition, Investigation, Methodology, Project administration, Resources, Software, Supervision, Validation, Visualization, Writing–original draft, Writing–review and editing.
Funding
The author(s) declare that financial support was received for the research, authorship, and/or publication of this article. This study was funded by the Ministry of Science and Higher Education of the Republic of Kazakhstan. Funder Project Reference of Institute of ionosphere: BR18574092 «Development of a multi-purpose aerospace monitoring system and services for an integrated situational information presentation about emergencies in transboundary regions of the RK and the RF». This research was implemented with the focus on the partial requirements of PhD Candidate - Nurmakhambet Sydyk’s doctoral dissertation on the “Geomechanical modelling of the earth’s crust in urban areas using satellite data” at Al-Farabi National University Faculty of Mechanics and Mathematics, Almaty, Kazakhstan. This study was funded by the Nazarbayev University through Faculty-development Competitive Research Grant (FDCRGP) (AI and Data Science) 2024–2026 - Funder Project Reference: 201223FD2607, Collaborative Research Program 2024–2026 - Funder Project Reference: 211123CRP1606. This research was implemented to focus on the partial requirements of EB’s Habilitation Research at TU Berlin, Germany.
Acknowledgments
The authors would like to acknowledge Ministry of Science and Higher Education of the Republic of Kazakhstan and Nazarbayev University. Funder Project References: BR18574092, 201223FD2607, 211123CRP1606. The authors also kindly acknowledge the European Space Agency (ESA) for making available the Sentinel-1 images in the framework of Copernicus Programme.
Conflict of interest
The authors declare that the research was conducted in the absence of any commercial or financial relationships that could be construed as a potential conflict of interest.
Generative AI statement
The author(s) declare that no Generative AI was used in the creation of this manuscript.
Publisher’s note
All claims expressed in this article are solely those of the authors and do not necessarily represent those of their affiliated organizations, or those of the publisher, the editors and the reviewers. Any product that may be evaluated in this article, or claim that may be made by its manufacturer, is not guaranteed or endorsed by the publisher.
References
Amey, R. M. J., Elliott, J. R., Hussain, E., Walker, R., Pagani, M., Silva, V., et al. (2021). Significant seismic risk potential from buried faults beneath Almaty city, Kazakhstan, revealed from high-resolution satellite DEMs. Earth Space Sci. 8, e2021EA001664. doi:10.1029/2021EA001664
Bayramov, E., Buchroithner, M., Kada, M., and Zhuniskenov, Y. (2021). Quantitative assessment of vertical and horizontal deformations derived by 3D and 2D decompositions of InSAR line-of-sight measurements to supplement industry surveillance programs in the tengiz oilfield (Kazakhstan). Remote Sens. 13, 2579. doi:10.3390/rs13132579
Bayramov, E., Tessari, G., Aliyeva, S., Duisenbiev, A., and Kada, M. (2024). Optimization of targeted differential interferometric measurements for wellpads detected by mask region-based convolutional neural network in the tengiz oilfield of the caspian sea coast. Coast. Remote Sens. 16 (3), 579. doi:10.3390/rs16030579
Bayramov, E., Tessari, G., and Kada, M. (2022). Quantifying two-dimensional surface displacements using high-resolution cosmo-SkyMed, TerraSAR-X and medium-resolution sentinel-1 SAR interferometry: case study for the tengiz oilfield. Sensors 22 (17), 6416. doi:10.3390/s22176416
Berardino, P., Fornaro, G., Lanari, R., and Sansosti, E. (2002). A new algorithm for surface deformation monitoring based on small baseline differential SAR interferograms. IEEE Trans. Geosci. Remote Sens. 40 (11), 2375–2383. doi:10.1109/tgrs.2002.803792
Eurasianet (2024). Kazakhstan: strong earthquake plunges Almaty into panic. Available at: https://eurasianet.org/kazakhstan-strong-earthquake-plunges-almaty-into-panic (Accessed March 04, 2024).
Fabris, M., Battaglia, M., Chen, X., Menin, A., Monego, M., and Floris, M. (2022). An integrated InSAR and GNSS approach to monitor land subsidence in the Po river delta (Italy). Remote Sens. 14, 5578. doi:10.3390/rs14215578
Farr, T. G., Rosen, P. A., Caro, E., Crippen, R., Duren, R., Hensley, S., et al. (2007). The shuttle radar topography mission. Rev. Geophys 45 (2), RG2004. doi:10.1029/2005rg000183
Ferretti, A., Prati, C., and Rocca, F. (2001). Permanent scatterers in SAR interferometry. IEEE Trans. Geosci. Remote Sens. 39, 8–20. doi:10.1109/36.898661
Gkougkoustamos, I., Krassakis, P., Kalogeropoulou, G., and Parcharidis, I. (2023). Correlation of ground deformation induced by the 6 february 2023 M7.8 and M7.5 earthquakes in Turkey inferred by sentinel-2 and critical exposure in gaziantep and kahramanmaraş cities. GeoHazards 4, 267–285. doi:10.3390/geohazards4030015
Goldstein, R. M. (1995). Atmospheric limitations to repeat-track radar interferometry. Geophys. Res. Lett. 22, 2517–2520. doi:10.1029/95GL02475
Gonnuru, P., and Kumar, S. (2018). PsInSAR based land subsidence estimation of Burgan oil field using TerraSAR-X data. Remote Sens. Appl. Soc. Environ. 9, 17–25. doi:10.1016/j.rsase.2017.11.003
Grützner, C., Walker, R. T., Abdrakhmatov, K. E., Mukambaev, A., Elliott, A. J., and Elliott, J. R. (2017). Active tectonics around almaty and along the zailisky Alatau rangefront. Tectonics 36, 2192–2226. doi:10.1002/2017TC004657
Hanssen, R., and Feijt, A. (2001). A first quantitative evaluation of atmospheric effects on SAR interferometry, Fringe 96_Workshop on ERS SAR Interferometry. Switzerland: ESA, 277–282.
Hubbard, J., and Bradley, K. (2024). M5.3 earthquake shakes Almaty, Kazakhstan. Earthq. Insights. doi:10.62481/093af40e
Imamoglu, M., Kahraman, F., Çakir, Z., and Sanli, F. B. (2019). Ground deformation analysis of bolvadin (W. Turkey) by means of multi-temporal InSAR techniques and sentinel-1 data. Remote Sens. 11, 1069. doi:10.3390/rs11091069
Ittycheria, N., Vaka, D. S., and Rao, Y. S. (2018). Time series analysis of surface deformation of Bengaluru city using Sentinel-1 images. Remote Sens. Spatial Inf. Sci. IV-5, 473–477. doi:10.5194/isprs-annals-IV-5-473-2018
JICA, OYO International Corp., Nippon Koei Co., Ltd., and Aero Asahi Corp (2009). The study on earthquake disaster risk management for Almaty city in the Republic of Kazakhstan. Available at: https://openjicareport.jica.go.jp/216/216/216_154_11961786.html.
KazTAG (2021). Eight moraine lakes are most dangerous in Almaty in 2021. Available at: https://kaztag.kz/en/news/eight-moraine-lakes-are-most-dangerous-in-almaty-in-2021 (Accessed March 04, 2024).
Kentucky Geological Survey (2024). Faults (tectonic). Available at: https://www.uky.edu/KGS/coal/coal-mining-geology-fault.php (Accessed March 04, 2024).
Khorrami, M., Abrishami, S., Maghsoudi, Y., Alizadeh, B., and Perissin, D. (2020). Extreme subsidence in a populated city (mashhad) detected by PSInSAR considering groundwater withdrawal and geotechnical properties. Sci. Rep. 10, 111357. doi:10.1038/s41598-020-67989-1
Kobayashi, T., Munekane, H., Kuwahara, M., and Furui, H. (2023). Insights on the 2023 Kahramanmaraş Earthquake, Turkey, from InSAR: fault locations, rupture styles and induced deformation. Geophys. J. Int. 236, 1068–1088. doi:10.1093/gji/ggad464
Lanari, R., Casu, F., Manzo, M., Zeni, G., Berardino, P., Manunta, M., et al. (2007). An overview of the small Baseline subset algorithm: a DInSAR technique for surface deformation analysis. Pure Appl. Geophys. 164 (4), 637–661. doi:10.1007/s00024-007-0192-9
Liu, L., Yu, J., Chen, B., and Wang, Y. (2020). Urban subsidence monitoring by SBAS-InSAR technique with multi-platform SAR images: a case study of Beijing Plain, China. Eur. J. Remote Sens. 53 (Suppl. 1), 141–153. doi:10.1080/22797254.2020.1728582
Loesch, E., and Sagan, V. (2018). SBAS analysis of induced ground surface deformation from wastewater injection in east central Oklahoma, USA. Remote Sens. 10, 283. doi:10.3390/rs10020283
Makabayi, B., Musinguzi, M., and Otukei, J. (2021). Estimation of ground vertical displacement in landslide prone areas using PS-InSAR. A case study of bududa, Uganda. Int. J. Geosciences 12, 347–380. doi:10.4236/ijg.2021.124019
Reuters (2024). Earthquake shakes Kazakhstan's biggest city. Available at: https://www.reuters.com/world/asia-pacific/earthquake-shakes-kazakhstans-biggest-city-2024-03-04/ (Accessed March 04, 2024).
Shanker, P., Casu, F., Zebker, H. A., and Lanari, R. (2011). Comparison of persistent scatterers and small baseline time-series InSAR results: a case study of the San Francisco Bay area. Geoscience and Remote Sens. Lett. IEEE 8 (4), 592–596. doi:10.1109/LGRS.2010.2095829
Silacheva, N. V., Kulbayeva, U. K., and Kravchenko, N. A. (2018). Probabilistic seismic hazard assessment of Kazakhstan and Almaty city in peak ground accelerations. Geodesy Geodyn. 9, 131–141. doi:10.1016/j.geog.2017.11.002
Silacheva, N. V., Kulbayeva, U. K., and Kravchenko, N. A. (2020). On the realization of seismic microzonation of Almaty (Kazakhstan) in ground accelerations based on the “continual” approach. Geodesy Geodyn. 11 (1), 56–63. doi:10.1016/j.geog.2019.07.006
Tapete, D., and Cigna, F. (2019). COSMO-SkyMed SAR for detection and monitoring of archaeological and cultural heritage sites. Remote Sens. 2019 (11), 1326. doi:10.3390/rs11111326
Tengrunews (2014). Devastating earthquake in Kazakhstan both distant and imminent: cambridge Professor. Available at: https://en.tengrinews.kz/science/devastating-earthquake-in-kazakhstan-both-distant-and-255918/#:∼:text=Almaty%20city%20was%20destroyed%20by,but%20was%20rebuilt%20every%20time (Accessed March 04, 2024).
Tikhomirov, A. V., Smirnov, A. L., Pil'guk, O. D., and Bakulina, M. P. (2001). Monitoring of deformation processes on the Almaty prognostic test ground by tiltmeters and extensometers. Proc. Conf. Int. Workshop Geodyn. Tien Shan 42, 1659–1666.
Torizin, J., Jentzsch, G., Malischewsky, P., Kley, J., Abakanov, N., and Kurskeev, A. (2009). Rating of seismicity and reconstruction of the fault geometries in northern Tien Shan within the project “Seismic Hazard Assessment for Almaty”. J. Geodyn. 48, 269–278. doi:10.1016/j.jog.2009.09.030
Usai, S. (2003). A least squares database approach for SAR interferometric data. IEEE Trans. Geoscience Remote Sens. 41, 753–760. doi:10.1109/TGRS.2003.810675
Vaka, D. S., Sharma, S., and Rao, Y. S. (2017). “Comparison of HH and VV polarizations for deformation estimation using persistent scatterer interferometry,” in 38th asian conference on remote sensing - space applications: touching human lives, ACRS 2017 (New Delhi: AARS).
Wang, X., Feng, G., He, L., An, Q., Xiong, Z., Lu, H., et al. (2023). Evaluating urban building damage of 2023 kahramanmaras, Turkey earthquake sequence using SAR change detection. Sensors 23, 6342. doi:10.3390/s23146342
Yang, Y.-J., Hwang, C., Hung, W.-C., Fuhrmann, T., Chen, Y.-A., and Wei, S.-H. (2019). Surface deformation from sentinel-1A InSAR: relation to seasonal groundwater extraction and rainfall in central taiwan. Remote Sens. 11, 2817. doi:10.3390/rs11232817
Yu, W., Jiang, M., and Cheng, X. (2023). Integrating MODIS LST and Sentinel-1 InSAR to monitor frozen soil deformation in the Qumalai-Zhiduo area, Qinghai-Tibet Plateau. Int. J. Digital Earth 16 (1), 1923–1943. doi:10.1080/17538947.2023.2218116
Zhantayev, Z., Kurmanov, B., Bibosynov, A., Fremd, A., and Ivanchukova, A. (2014). Persistent scatterers interferometry technique for urban subsidence monitoring in Kazakhstan republic. Procedia Technol. 16, 583–587. doi:10.1016/j.protcy.2014.10.006
Zhong, L., Zhang, J., Zhang, Y., and Dzurisin, D. (2010). Monitoring and characterizing natural hazards with satellite InSAR imagery. Ann. GIS 16 (1), 55–66. doi:10.1080/19475681003700914
Keywords: GIS, remote sensing, radar, SBAS-InSAR, fault, tectonic plate
Citation: Bayramov E, Sydyk N, Nurakynov S, Yelisseyeva A, Neafie J and Aliyeva S (2024) Quantitative assessment of urban surface deformation risks from tectonic and seismic activities using multitemporal microwave satellite remote sensing: a case study of Almaty city and its surroundings in Kazakhstan. Front. Built Environ. 10:1502403. doi: 10.3389/fbuil.2024.1502403
Received: 26 September 2024; Accepted: 26 November 2024;
Published: 16 December 2024.
Edited by:
Wei Lang, Sun Yat-sen University, ChinaReviewed by:
Shiqi Chen, Sun Yat-sen University, ChinaRou Liang, Sun Yat-sen University, China
Wu Likun, Sun Yat-sen University, China
Copyright © 2024 Bayramov, Sydyk, Nurakynov, Yelisseyeva, Neafie and Aliyeva. This is an open-access article distributed under the terms of the Creative Commons Attribution License (CC BY). The use, distribution or reproduction in other forums is permitted, provided the original author(s) and the copyright owner(s) are credited and that the original publication in this journal is cited, in accordance with accepted academic practice. No use, distribution or reproduction is permitted which does not comply with these terms.
*Correspondence: Emil Bayramov, ZW1pbC5iYXlyYW1vdkBudS5lZHUua3o=; Nurmakhambet Sydyk, bnVybWFraGFtYmV0LnN5ZHlrQGlvbm9zLmt6
 Emil Bayramov
 Nurmakhambet Sydyk
 Serik Nurakynov3,5
 Saida Aliyeva