 Yujing Huang
95% of researchers rate our articles as excellent or good
Learn more about the work of our research integrity team to safeguard the quality of each article we publish.
Find out more
ORIGINAL RESEARCH article
Front. Earth Sci. , 26 July 2022
Sec. Atmospheric Science
Volume 10 - 2022 | https://doi.org/10.3389/feart.2022.965005
This article is part of the Research Topic Extreme Climate Events: Variability, Mechanisms, and Numerical Simulations View all 17 articles
The plateau vortex is one of the dominant weather systems that modulate summer rainfall in northwestern China, a typical arid/semi-arid area worldwide. Two heavy rainfall cases in the summer of 2012 and 2013, accompanying the northeastward movement of plateau vortexes, are selected here. The role of plateau vortexes in these two cases is explored by diagnosing their moist potential vorticity, helicity, and convective clouds characteristics, using numerous data (ERA-Interim reanalysis, multi-sourced precipitation data, FY-2E satellite images). The plateau vortexes enhanced convective instability in the rainfall area by entraining upper-level dry and cold air, manifested as salient vertical gradients of moist potential vorticity and steep pseudo-equivalent potential temperature isolines. The rainfall occurred eastward relative to the vortex movement track and intensified on the left of cloud black body temperature (TBB) with larger gradients at the middle to late stages of the vortex life span. The generation of moisture helicity is dictated by the water vapor transportation, with the negative value concentrated in the water vapor-rich areas. Notably, the two cases differ in tracks, life spans, water vapor sources, and precipitation amounts, which may be attributed to large-scale circulation background, vertical vortex structure, and moisture condition.
Northwestern China is one of the world’s typical arid/semi-arid climate regions. Climatologically (54-year) annual precipitation is 299 mm, of which summer rainfall accounts for the majority of this (Huang et al., 2016; Shang et al., 2018). In arid and mountainous northwestern China, heavy rainfall has a double-edged effect here, benefiting agriculture against drought, reservoir storage, and power generation while it is also a potential reason to lead to secondary disasters such as floods and mudslides. Rainstorms in northwestern China are less frequent and less intense than those in eastern China. Due to poor rainproof facilities in arid regions, even less intense rainfall can sometimes cause severe damage, not to mention heavy rainfall. For instance, in the summer of 2012, Subei County in Gansu Province was hit by an extreme precipitation event, where torrential flooding annihilated the road and farmland (Xinhua News Agency, 2012). In July 2013, Shaanxi province suffered a record-breaking extreme rainstorm, affecting 460,000 people in 387 townships and causing economic losses of 542 million CNY (China News Service, 2013). These two heavy precipitation events, which attracted much attention and caused severe disasters, were both related to the plateau vortex.
Plateau vortex is an α mesoscale cyclone generated on the Tibetan Plateau (the plateau for short) in summer-half years. Evident at the 500-hPa isobaric surface, the plateau vortex is one of the dominant precipitation-related weather systems in the summertime on the plateau. The plateau vortex is active at its genesis source and mainly regulates precipitation in the central and western plateau. Under favorable synoptic conditions, some plateau vortexes can move out of the plateau and cause widespread heavy rainfall (Li, 2013; Curio et al., 2019) downstream. According to the moving tracks (Wang, 1987; Lin, 2015), plateau vortexes can be separated into three categories: eastward plateau vortex (EPV), northeastward plateau vortex (NEPV), and southeastward plateau vortex (SEPV), which affect different areas downstream of the plateau (Yu et al., 2014; Li et al., 2020b; Sun et al., 2022).
Several previous studies have documented that the plateau vortex is crucial in the formation of heavy rainfall, especially in eastern China. The upper-level divergences in westerly and lower-level convergences in vortex have been argued to favor the development of EPV, with the former acting as a vital role in the genesis of vortex-induced precipitation (Liu and Fu, 1986; Li et al., 2019; Li et al., 2020b). Yang et al. (2017) reported that the positive vorticity advection in front of the EPV was one of the triggering mechanisms of rainstorms. Water vapor conditions are also essential for EPV. Yu (2002) pointed out that the water vapor vortex in the middle-to-upper troposphere is indicative of EPV, for their development and movement are in line with that of EPV. The role of EPV in precipitation has been widely investigated (Huang and Li, 2007; Huang and Li, 2009; Huang et al., 2010). After diagnosing the circulation of three EPVs moving processes, they found that the variations of physical quantities such as helicity, moist potential vortex, and non-geotropic Q vector are consistent with the variation of EPV precipitation, which may provide the predictable source for precipitation.
The previous studies deepen our understanding of the role of the eastward-moving plateau vortex, i.e., EPV in the precipitation of eastern China. For rainfall occurring in northwestern China, the role of the northeastward-moving plateau vortex, i.e., NEPV may be more critical. A NEPV event can cause > 100 mm of precipitation in one single day over Northwestern China, making a great contribution to the inherently low annual total precipitation amount in this arid region (Shang et al., 2018). However, the research on the effect of NEPV on precipitation in Northwestern China remains notably absent. Compared to EPV, NEPV has a more northerly moving track and a shorter life span. Even constrained by the limited water vapor supplements, the NEPV can also cause heavy precipitation. Furthermore, NEPV is observed to weaken when it moves off the Plateau (Sun et al., 2022). So how does the NEPV affect precipitation in its weakening period? The mechanism of its influence on precipitation deserves further study.
Therefore, two typical cases of heavy summer precipitation associated with NEPV in 2012 and 2013 are selected here to explore the physical mechanisms of NEPV-induced precipitation, by diagnosing the quantities including moist potential vorticity, helicity, and mesoscale cloud cluster characteristics in the two cases, based on multi-source datasets. This work aims to deepen the cognition of the NEPV to provide information for the plateau vortex-induced precipitation forecast, and highlight the role of the Tibetan Plateau in the weather and climate of China. This paper is organized as follows. Section 2 presents the data and methods used in this work. Section 3 describes the precipitation profile and the movement of NEPV, and then the precipitation intensity caused by the NEPV was statistically analyzed. Section 4 investigates the heavy precipitation feature of NEPV, including precipitation conditions and physical quantities. A summary and discussion are provided in Section 5.
The Yearbook of Low Vortex Shear Lines over the Tibetan Plateau compiled by the Institute of Plateau Meteorology, China meteorological administration, 2012 (CMA), Chengdu (Li et al., 2013), is consulted here for NEPV case selection. These are the four standards that we use to pick up typical cases: 1. NEPV that moving off plateau, 2.24-h accumulate precipitation more than 50 mm, 3. Life span longer than 48 h, 4. Having close source area. Therefore, we selected the two cases with heavy precipitation induced by NEPV under different sensible heating over the plateau, one on June 3–5 in 2012 (referred to as Case 2012) and the other on July 19–22 in 2013 (referred to as Case 2013) among all the recorded NEPVs. ERA-Interim reanalysis dataset (6-h time interval, 2.5o × 2.5o latitude-longitude grid) is used to depict environmental circulations and calculate physical quantities (e.g., moist potential vorticity, helicity), for its better performance in vortex tracks identification than other reanalysis datasets according to Lin et al. (2020). The rainfall area during the NEPV movement is captured using CMORPH integrated hourly precipitation amount data with a 0.1° × 0.1° latitude-longitude grid (Joyce et al., 2004), while the specific precipitation amount generated is determined by the daily and hourly precipitation amount observed in automatic weather stations provided by the National Meteorological Information Center of CMA. Hourly Black Body Temperature (TBB) data retrieved from the FY-2E geostationary satellite (Yang et al., 2015) is used to further analyze the cloud top brightness temperature associated with precipitation intensity.
Moist potential vorticity (MPV) and helicity, are useful physical quantities in diagnosing rainfall cases, especially those related to severe convective weather such as mid-latitude torrential rain (Gao et al., 2007; Onderlinde and Nolan, 2014; Luhunga and Djolov, 2017). The studies on plateau vortex-induced precipitation have mainly focused on EPV (Huang and Li, 2007; Huang and Li, 2009; Huang et al., 2010). Reflecting the combined characteristic of air-water vapor, thermal and dynamic simultaneously (Bennetts and Hoskins, 1979; Marquet, 2014), MPV in the p-coordinate system is expressed as (Wu et al., 1995):
Where g is the gravitational acceleration,
Helicity is commonly applied to describe the degree of rotation along the direction of motion for rotating fluids, and the rotational properties of weather systems are comprehensively depicted (Moffat, 1969; Lilly, 1986; Wu and Tan, 1989). Given a large number of definitions of helicity and the fact that the effect of water vapor on helicity is discussed in this study, the formula of moisture helicity is adopted (Lei et al., 2006):
Where q is the specific humidity,
Figure 1 shows the NEPV moving tracks (black dotted curves) and total precipitation amount (shaded) in the two cases. In Case 2012, the plateau vortex bred in Ali, Tibet, then moved northeastward and died out in western Inner Mongolia (Figure 1A). During its movement, precipitation mainly occurred on 5 June 2012, with the rainfall center in Hexi Corridor. The vortex of Case2013 was also generated in Ali, Tibet, but disappeared in the northeast of Loess Plateau (Figure 1B). As the two vortexes moved out of the plateau, the Loess Plateau region experienced heavy precipitation, with the rainfall area to the southeast of the vortex tracks.
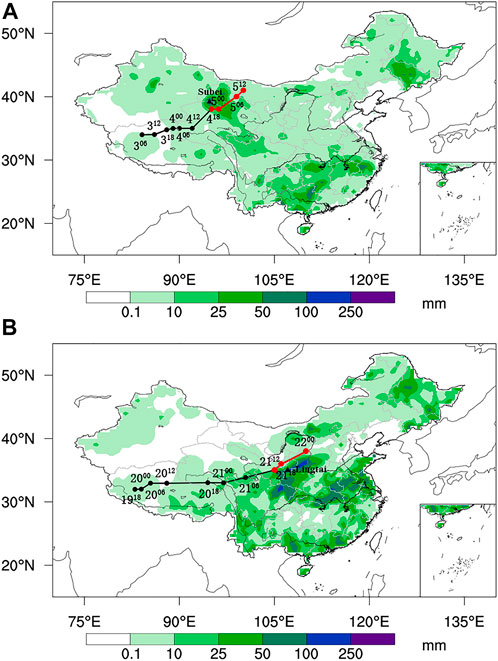
FIGURE 1. Moving tracks (black dots, moving-out in red dots) and accumulated daily precipitation (shaded) in 3–5 June 2012 (A) and 19–21 July 2013 (B) (marked as vortex position corresponding to date in the superscript and time in the subscript, ▲: precipitation maximum station) based on ERA-Interim reanalysis datasets and CMORPH.
To better distinguish the effects of different phases in NEPV movements on precipitation, the vortex movements are subdivided into plateau stages and moving-out plateau stages according to their tracks and influences on precipitation. Figure 2 shows the variations of relative vorticity (curves) and 6-h accumulative precipitation (bars), averaged over a 2° × 2° range centered at the vortex center at 6-h intervals. Prominent relative vorticity was observed at the plateau stage in the two cases under the heating in the Ali. Constrained by water vapors supplement, less precipitation was generated in both the cases. However, as the vortex moved off the plateau, vortex-induced precipitation at the northeastern edge of the plateau as well as downstream areas were detectable. Heavy rainfall at the moving-out plateau stage began at 18:00 on the 4th, and ended at 12:00 on the 5th in Case 2012 (Figure 2A), while it was 12:00 on the 21st to 00:00 on 22nd in Case 2013 (Figure 2B), suggesting a substantial influence of NEPV on precipitation in the middle-to-late life span.
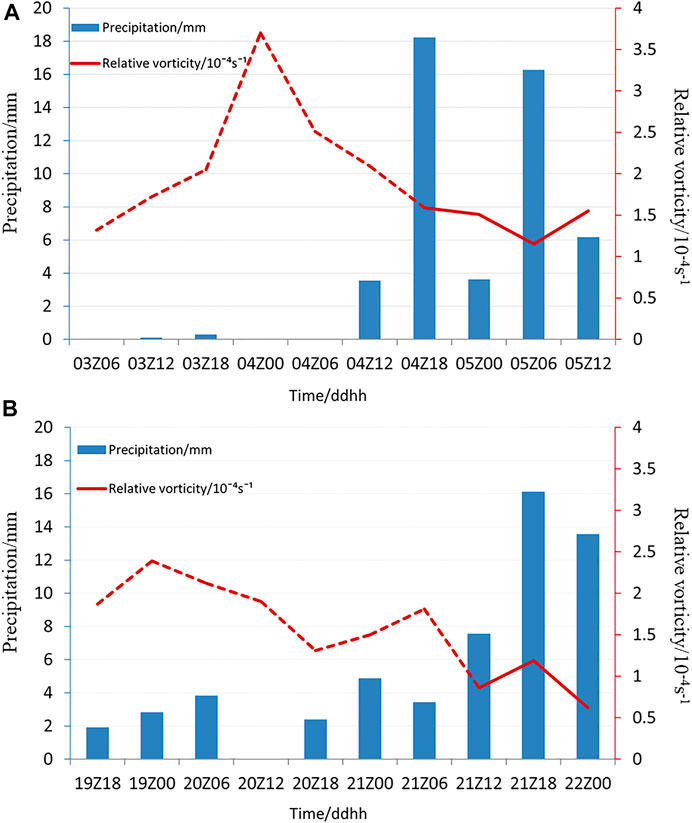
FIGURE 2. The relative vorticity of vortex center (curves, plateau stages in dashed lines and moving-out plateau stages in solid lines, unit: 10–4·s-1) and the variation of 6-h accumulated precipitation (bars, unit: mm) at 6-h intervals in the range of 2° × 2°centered at the vortex center in Case 2012 (A) and Case 2013 (B)
The intensity of NEPV-induced precipitation in Northwestern China was graded into four levels following the CMA’s criteria (2012). The numbers of stations at each level in two cases are listed in Table 1. The precipitation amount at most stations in Case2012 was at moderate to heavy levels, while only two stations (Subei and Yumenzhen) were at rainstorm level. On 21 July 2013, the daily rainfall of Lingtai station reached 184.6 mm, exceeding its historical extreme. In Case 2013, the vortex moved eastward, producing a narrower and longer rainfall area than Case 2012. The rainstorm located at the southeast quadrant relative to the NEPV center. In the following, the synoptic-scale circulation environments are examined to further detail the case differences.
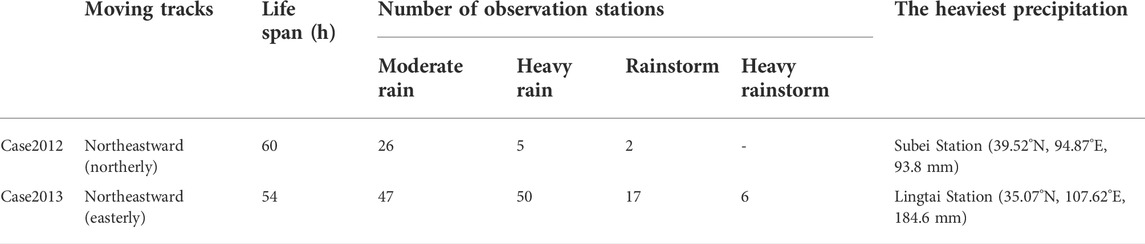
TABLE 1. Overview of precipitation (graded into four levels following the CMA’s criteria) and moving tracks of plateau vortex in Case2012 and Case2013.
Sun et al. (2022) figured that the plateau vortex movement is mainly influenced by the westerly wind at 200 hPa and the ridge in the east of plateau at 500 hPa. The former mainly affect the plateau vortex movement at plateau stage, and the latter at moving-out plateau stage. Typically, the cyclonic circulation of NEPV is found to be most pronounced in the middle troposphere (500 hPa) (Sun et al., 2022). As for our study, the NEPV movement in plateau stage was mainly easterly in both cases, the northeasterly movement was mainly occurred when moving out plateau. Therefore, in this section, we investigated the impacts of 500 hPa-ridge on the NEPV movement. Figure 3 illustrated the 500-hPa large-scale environmental circulation at intermediate moments during the different stages in the two cases. Specifically, at the plateau stage in Case 2012 (06:00 on 3rd --18:00 on 4th, Figure 3A), a meridional structure of “two troughs and one ridge” was observed in middle-high latitudes of Eurasia, with a closed depression center in the central part of the Tibetan Plateau, and a deep cold trough stable along the northeast of Lake Baikal to the east coast China. Suppressed by the strong cold air from the north, the plateau vortex mainly moved eastward at the plateau stage. Subsequently, the large northern vortex weakened and moved eastward by about 10° longitudes at the moving-out plateau stage (18:00 on 4th -- noon on 5th, Figure 3B). Guided by the southwesterly on the east edge of the plateau, the vortex moved towards the northeast. On the contrary, the environmental circulation in Case2013 is more zonal, causing the vortex to move eastward easily in response to the guiding airflow. Particularly, the stronger southerly in front of the trough at the moving-out stage (noon on 21st -- 00:00 on 22nd, Figure 3C) than that at the plateau stage (18:00 on 19th -- noon on 21st, Figure 3D) made an apparent northward movement of the vortex. The result regarding the effects of 500 hPa trough on NEPV is consistent with the statistical analysis by Sun et al. (2022). The horizontal distribution of the environmental fields for the two cases is discussed in this section. The following section will focus on the changes in the vertical structure of NEPV.

FIGURE 3. Geopotential height (black isolines; Unit: dagpm), temperature (red isolines; Unit: °C) and strong wind area (shaded, wind speed ≥12 m/s) on 500 hPa at intermediate moments of plateau stage (A,C) and moving-out plateau stage (B,D) (A) 00:00 4 June 2012, (B) 06:00 5 June 2012, (C) 12:00 20 July 2013, (D) 18:00 21 July 2013, V denotes the position of the vortex at the corresponding time) in Case 2012 (A,B) and Case 2013 (C,D) (The brown solid line is Tibetan plateau boundary).
To obtain the vertical structure of NEPV during its movement, a composited analysis of the vertical profile of relative vorticity, divergence, and vertical velocity in the middle and upper troposphere at the two stages was performed (Figure 4). We found that the early-stage plateau vortex moved slowly and intensified in its birth-source area, reaching its strongest intensity over its life span (not shown) in the two cases. Notably, the two NEPVs have commonalities in the strongest centered relative vorticity maintained at 500 hPa (solid), convergent flow below 450 hPa (hollow), and upward motion from 500 hPa to the top troposphere (cross). As the vortex moved to the northeast, the vorticity maximum decreased with the weakened convergence in the middle troposphere. Subsequently, abundant water vapor led to widespread heavy precipitation downstream as showed in Figure 1.
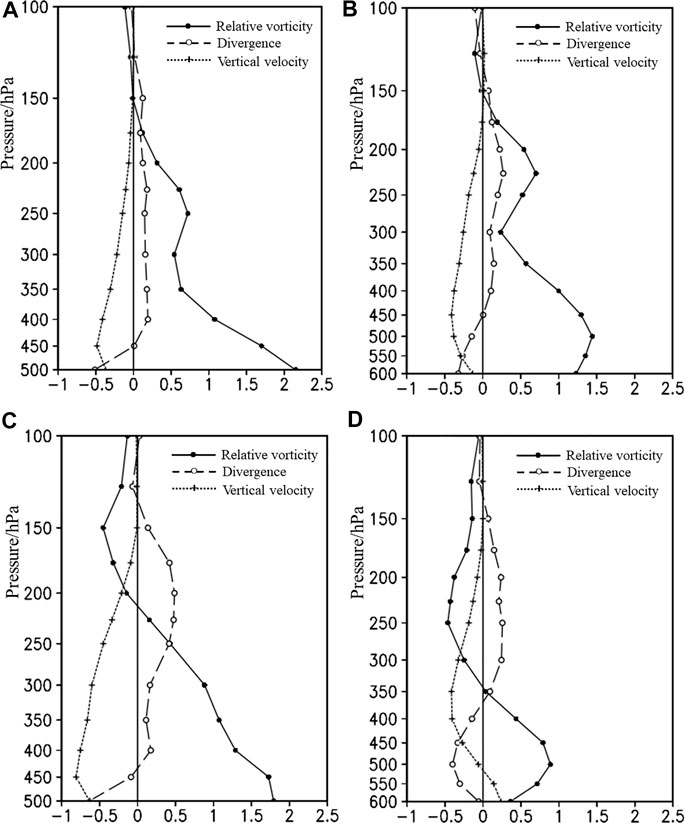
FIGURE 4. The vertical distribution of relative vorticity (solid, Unit: 10–4 s−1), divergence (hollow, Unit: 10–4 s−1) of vortex center and vertical velocity (cross, Unit: Pa·s−1) at plateau stage and moving-out plateau stage in Case 2012 (A,B) and Case 2013 (C,D).
Also, the two NEPVs diverge in their triggering of rainfall. In Case 2012, a deeper cyclonic circulation with two positive vorticity maxima was found in the vertical stratification (Figures 4A,B), which favors vortex maintenance, in line with the observed NEPV lifetime (Figure 1). In Case 2013, the positive (negative) vorticity was accompanied by convergence (divergence) in the lower (upper) level (Figure 4C), resulting in a robust upper-level pumping and lower-level water vapor accumulation at the moving-off plateau stage (Figure 4D). Therefore, more severe precipitation occurred in Case2013 than in Case2012 in Figure 2. In addition, a salient upper-level divergence appeared at the plateau stage in Case2013 that rapidly allowed vortex intensity and vertical extension height to reach their maximum within 6 h (not shown), which may be attributed to the plateau heating effect (Zhou et al., 2022). It can be concluded that the consistent circulation from middle to upper levels is favorable for the vortex to live longer. The coupling structure of low-level convergence with positive vorticity and upper-level divergence with negative vorticity, combined with a robust pumping effect, enhanced the convergence of middle-to-lower water vapor in the rainstorm area. As a result, the precipitation continues to accumulate in the vortex-weakening period.
To confirm the dynamical effects of NEPV on heavy precipitation, the time-height evolution of relative vorticity and vertical velocity above 800 hPa at the rainstorm center in the two cases is given in Figure 5. Before the onset of heavy precipitation, the entire troposphere at the rainstorm center was controlled by the negative vorticity (dashed contours). The downdraft in the middle-to-lower troposphere inhibited the moisture convergence in the rainfall area. With the northeastward movement of the vortex, positive vorticity (solid contours) appeared in the mid-troposphere and was accompanied by upward motion (shaded in red). The strongest updraft at the rainstorm center appeared about 6-h earlier than the relative vorticity reaching its maximum in both cases, indicating that the wind modification precedes the vorticity. The vertical motion signal in Case2012 is a better predictor of precipitation (Figure 5A). With the appearance of the maximum updraft, the mid-level vorticity began to transform from negative to positive. Influenced by the descent plateau topography, the favorable precipitation conditions (positive vorticity and upward motion) tended to shift downward with time. In Case 2013 (Figure 5B), the positive vorticity (solid contours) signal of the vortex appeared 12-h earlier than the time vortex passes through the rainstorm center (black vertical line). When the vortex approached the rainstorm center, the updraft (shaded in red) was rapidly enhanced. In a word, the plateau vortex provides a favorable dynamic environment for a rainstorm.
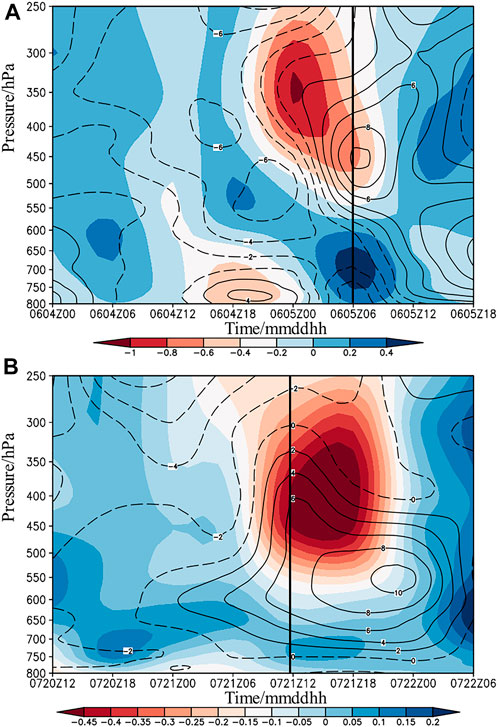
FIGURE 5. Time-height profile of relative vorticity (positive vorticity: solid contours; negative vorticity: dashed contours, Unit: 10–5 s−1) and vertical velocity (shaded, Unit: Pa·s−1) of the rainstorm center (A) (100°E, 40°N) in Case 2012; (B) (106°E, 35°N) in Case 2013) (the vertical line is the time when vortex passes through rainstorm center).
Knowing that the weakened cyclonic circulation as the NEPV moved out of the plateau, we hypothesize that the water vapor condition plays a crucial role in heavy precipitation. Flows associated with the Indian monsoon and the South China Sea monsoon create the main water vapor transport channel to northwestern China in summer (Wang et al., 2018). As the vortex circulation on the plateau is strongest at 500 hPa, we use the water vapor flux at 500 hPa when the vortex moves through to depict the convergence of the water vapor transports (Figure 6).

FIGURE 6. The water vapor flux divergence (shaded; Unit: 10–6 g cm−2·hPa−1 s−1) and water vapor flux (vectors; Unit: g·cm−1 hPa−1 s−1) on 500 hPa at 06: 00 5 June 2012 (A) and at 12: 00 21 July 2013 (B) (the thick arrows denote water vapor transport path, V denotes the position of the vortex at the corresponding time).
The maximum values of water vapor flux divergence in the two rainstorm areas were both 2.5 × 10⁻⁶ g cm−2·hPa−1·s−1. The water vapor convergence center in Case2012 was located on the northeast side of the vortex (Figure 6A, shaded). In Figure 3A, the ridgeline of West Pacific Subtropical High (WPSH) was positioned south of 20°N in Case 2012. Blocked by the terrain of the Loess Plateau in the way, it is difficult for water vapor to be transported from the Bay of Bengal to northwestern China. Therefore, in the absence of strong external supplements of water vapor for the rainfall area, the vortex convergence can only lead to local water vapor accumulation with a shorter duration and less amount of precipitation. Nevertheless, the ridgeline of WPSH was northward in Case 2013 (Figure 3B). The vortex caused a large amount of water vapor to gather around the rainfall area (Figure 6B, shaded). One of them was the water vapor from the Bay of Bengal, which flowed around the southern boundary of the plateau and crossed the Hengduan Mountains. These external water vapors joined the water vapor conveyor belt around the WPSH, climbed along the south side of the Loess Plateau, and converged near the vortex. Therefore, the rainfall area in Case2013 was southward shifted to the convergence area and presented a banded distribution along the plateau. In addition, it can also be found that water vapor convergence appears in the southeast of the vortex in Case2012 and the southwest of the vortex in Case 2013, and the convergence even was stronger than that of the NEPV falling area. However, in the absence of the dynamic lifting conditions of the vortex, there was no significant precipitation in these regions. In fact, not only the water vapor supply, the other factors which cause heavier rainstorm in Case2013 will be discussed later.
To investigate the convective stability in the rainstorm center brought by the NEPV, the longitude-height profile of MPV1 and
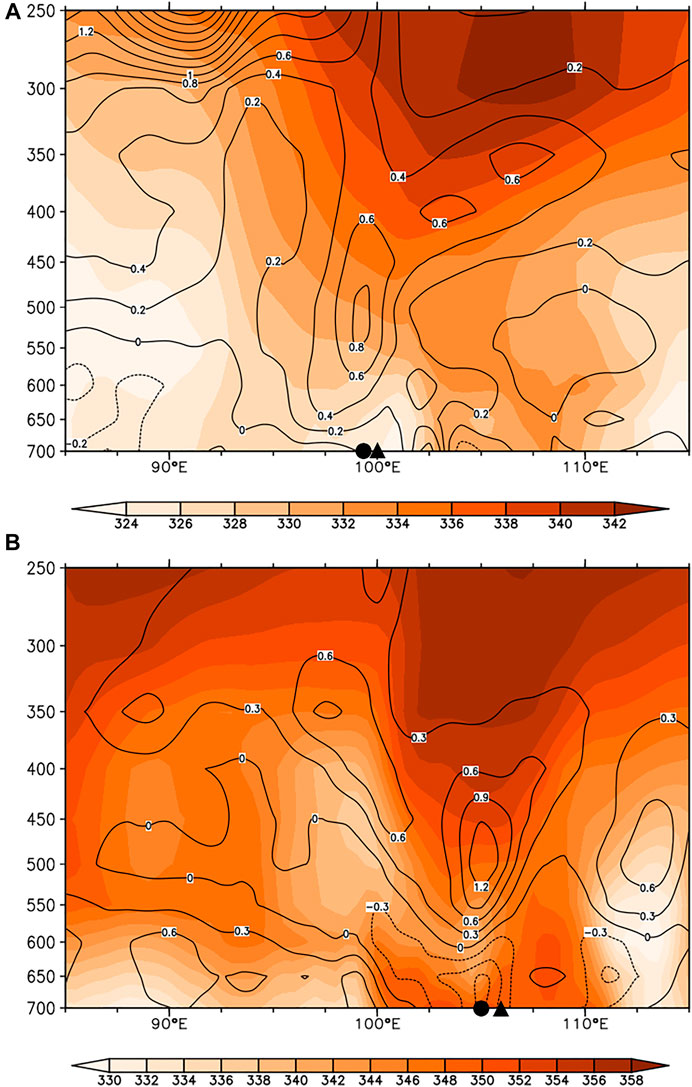
FIGURE 7. The longitude - height profile of MPV1 (positive value: solid isoline; negative value: dashed isoline, Unit: PVU) and
The NEPV led to the entrain of dry and cold air from the upper layer to the rainfall area, manifesting as a salient vertical gradient of MPV and a steep iso-
Moisture helicity measures both the vortex energy and the water vapor conditions. The area with negative moisture helicity is reported to correspond well to the rainfall area in EPV cases (Huang et al., 2011). For our NEPV cases, the negative moisture helicity in Case2012 was mainly in the junction of Gansu Province and Inner Mongolia, along the plateau edge, covering the rainfall area (Figure 8A). Strong updraft driven by low-level convergence and abundant water vapor encouraged the occurrence and development of heavy precipitation. Although the Loess Plateau also has covered by negative moisture helicity, there was no significant precipitation in the lack of vortex dynamic effect. For Case 2013, the negative moisture helicity in southern Gansu to the central Shaanxi presented a northwest-southwest distribution (Figure 8B). The less energy transportation outward and abundant moisture in this region benefited the precipitation generation. The negative moisture helicity center was slightly northward than the rainstorm center.
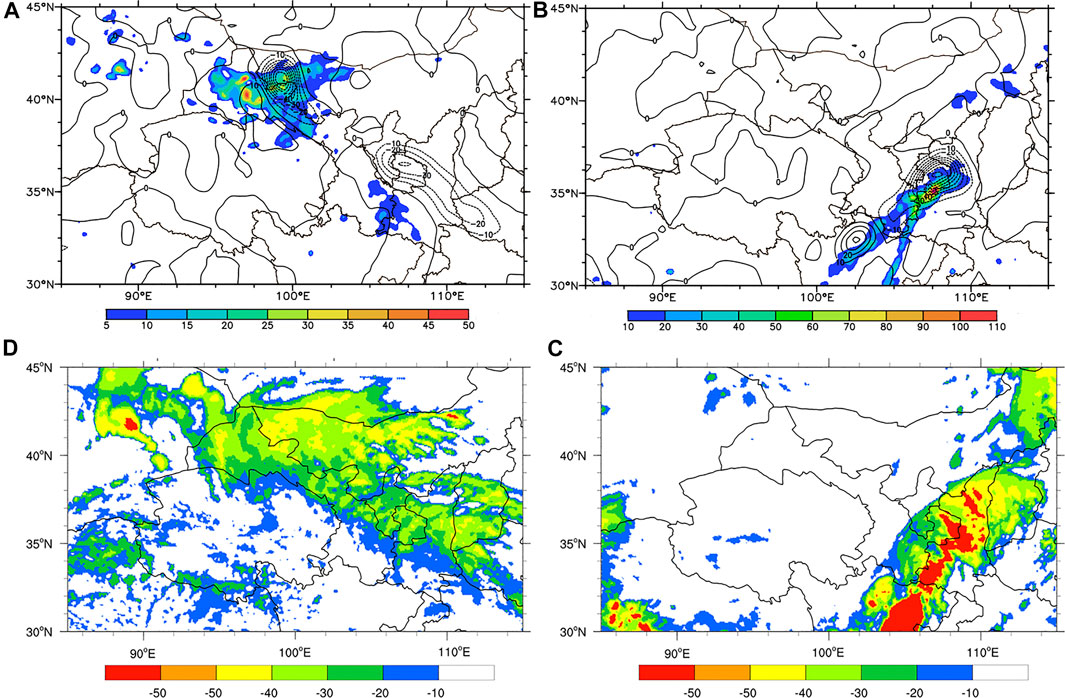
FIGURE 8. The moisture helicity (Unit: 10–11 m s−3) on 500 hPa and 6-h accumulated precipitation (Unit: mm) (A,B), black-body temperature (TBB) by FY-2E satellite (C,D) at 06: 00 5 June 2012 in Case 2012 (A,C) and at 12: 00 21 July 2013 in Case 2013 (B,D).
The TBB on cloud top obtained by the FY-2E satellite is depicted to investigate convective cloud cluster characteristics around the vortex. The mesoscale convective cloud cluster mainly appeared over the area including northern Gansu, western Inner Mongolia, Ningxia, central Shaanxi, and southern Shanxi Provinces at 06:00 on 5 June 2012, covering an area of 800–1,000 km (Figure 8C). The convection associated with the vortex is to the north of 37°N. The region with TBB below—30°C presented an inverted triangle shape. The convective cloud belt was generally near the vortex trough at 500 hPa, with its outline highly aligned with the 562 dagpm isoline in Figure 3B and its shape similar to the 6-h accumulated rainfall area. The heavy precipitation clouds and rainfall areas with TBB below -40°C were to the northwest of the inverted triangle. At the same time, a convective cloud also appeared on the southeast of the vortex cloud cluster, which was far away from the vortex circulation and did not produce effective precipitation. A northeast-southwest oriented convective cloud cluster in Case2013 appeared from the north of Sichuan to the south of Shanxi, presenting a northeast-southwest oriented distribution (Figure 8D). It is necessary to pointed out that the largest cloud cluster in central Shaanxi was mainly affected by vortex, while the strongest cloud cluster in Sichuan was mainly affected by topography uplift of Hengduan Mountains, which was hardly affected by the vortex. The lower TBB indicated the higher cloud top height and deeper vertical movement. The TBB is significantly lower than that of Case 2012, which can be as low as below −50°C in Case 2013. Thus, a more favorable dynamic condition with lower TBB in Case2013 generated a larger rainstorm area with stronger rainfall intensity than Case 2012.
The distribution of moisture helicity reflects the concentration of energy and water vapor in NEPV. Consistent with the evolution of rainfall area, the evolution of the negative moisture helicity region is affected by water vapor transportation. In both cases, the rainfall areas of the NEPV were to the left of TBB with a large gradient. The lower the TBB reflected by the satellite images, the better the dynamic conditions that trigger precipitation. Therefore, the strong rainfall always appeared near the large gradient area on the left of TBB.
Two typical cases of heavy precipitation induced by NEPV are selected here to analyze their moving track, precipitation characteristics and physical mechanism in detail, using multi-source data (automatic station observation, ERA-interim reanalysis and satellite images). A comparative analysis of heavy precipitation by using physical quantities such as MPV and helicity is conducted (Table 2). The main conclusions are as follows:
1) In terms of precipitation conditions, the plateau vortex led to the invasion of dry and cold air from the upper layer to the rainfall area, which resulted in a strong vertical gradient of MPV and steep iso-
2) In terms of water vapor sources, the water vapor transportation was blocked by plateau topography in Case 2012, leading to less precipitation. In Case 2013, the low-level water vapor climbed up to the plateau and converged in the vortex center. The interaction of lower-level water vapor and the upper-level dry and cold air produced heavier precipitation. Affected by the water vapor transport path, the negative moisture helicity appeared in water vapor-rich regions, such as the edge of the plateau and outside of the subtropical high. The NEPV-induced precipitation occurred after the vortex moved out of the plateau.
3) In terms of vortex structure, there were two positive vorticity maxima in the vertical structure of the vortex in Case 2012, and the consistent circulation from middle to upper levels is conducive to the vortex maintenance. The coupling structure of vorticity and divergence in lower and upper levels, combined with the strong pumping effect enhanced the convergence of middle and low-level water vapor in the rainstorm area.
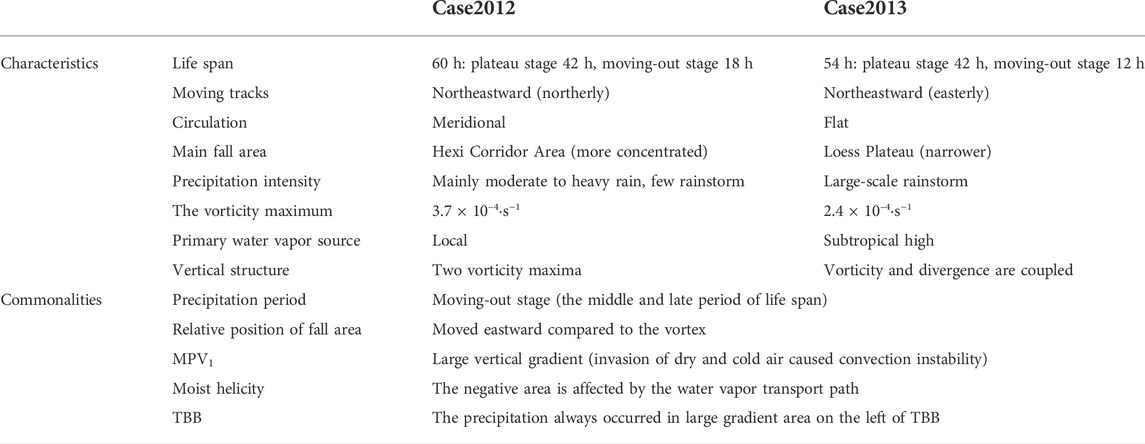
TABLE 2. Comparisons of two heavy precipitation cases (Case2012 and Case 2013) induced by northeastward plateau vortices (NEPV).
This work conducted a study on NEPV and precipitation it causes in two cases. It is found that the precipitation induced by NEPV is crucial to northwestern China, and the water vapor supply and vortex structure play important roles in the precipitation process. However, the cause analysis of the difference between the two NEPVs is not addressed, including the thermal factors in the development of the two vortexes and precipitation. At the same time, the data completeness on Tibetan plateau remains inadequate, although there are several kinds of reanalysis data, it is unknown whether other data can reproduce the results of this paper, and it is necessary for further analysis using additional research methods, such as radar data analysis and numerical model. In addition, the total amount of such NEPV is relatively small, and some results may lack of representativeness. Moreover, some vortex develop strongly but do not move out of the plateau, whether these plateau vortices can induce precipitation in the downstream through wave propagation mechanism is also a topic worthy of future study. Therefore, the conclusions of this study deserve further confirmation by more cases and more diagnostic analysis.
Publicly available datasets were analyzed in this study. This data can be found here: https://apps.ecmwf.int/datasets/data/interim-full-daily/levtype=sfc/ https://satellite.nsmc.org.cn/portalsite/default.aspx http://data.cma.cn/data/detail/dataCode/SEVP_CLI_CHN_MERGE_CMP_PRE_HOUR_GRID_0.10.html.
YH conducted the work, analyzed the result data, and drafted the manuscript. XM and YM made contributions to the design of the work and revised the manuscript. XM made contributions in guidance and discussion of the work and helped in editing the content. YQ helped in analyzing the data and revised the manuscript.
This research was sponsored by the National Natural Science Foundation of China (Grant No. 42030611 and 42165005) and National Key R&D Program of China (Grant No. 2018YFC1505705).
The authors declare that the research was conducted in the absence of any commercial or financial relationships that could be construed as a potential conflict of interest.
All claims expressed in this article are solely those of the authors and do not necessarily represent those of their affiliated organizations, or those of the publisher, the editors and the reviewers. Any product that may be evaluated in this article, or claim that may be made by its manufacturer, is not guaranteed or endorsed by the publisher.
Bennetts, D. A., and Hoskins, B. J. (1979). Conditional symmetric instability - a possible explanation for frontal rainbands. Q. J. R. Meteorol. Soc. 105, 945–962. doi:10.1002/qj.49710544615
China meteorological administration (2012). Grade of precipitation GB/T28592-2012. Beijing: Standards Press of china.
China News Service (2013). Heavy rains and floods in Shaanxi have affected more than 450,000 people and killed nine. Available at: https://www.chinanews.com.cn/gn/2013/07-23/5073171.shtml (Accessed July 23, 2013).
Curio, J., Schiemann, R., Hodges, K. I., and Turner, A. G. (2019). Climatology of Tibetan Plateau vortices in reanalysis data and a high-resolution global climate model. J. Clim. 32 (6), 1933–1950. doi:10.1175/JCLI-D-18-0021.1
Gao, S., Li, X., Tao, W., Shie, C., and Lang, S. (2007). Convective and moist vorticity vectors associated with tropical oceanic convection: A three-dimensional cloud-resolving model simulation. J. Geophys. Res. 112 (D1), D01105. doi:10.1029/2006JD007179
Huang, C., and Li, G. (2007). Synoptic and dynamic diagnostic analysis for a case of plateau vortex moving east. J. Meteorol. Res. 27 (12), 36–43. doi:10.3969/j.issn.1009-0827.2007.z1.006
Huang, C., and Li, G. (2009). A case study of plateau vortex moving east ward with heavy rainfalls based on helicity and non-geostrophic wet Q-vector. Plateau Meteor 28 (02), 319–326. doi:10.1016/j.snb.2013.12.103
Huang, C., Gu, Q., and Li, G. (2010). Mechanism analysis of plateau vortex moving east trigger rainstorm in Sichuan basin. Plateau Meteor 29 (04), 832–839.
Huang, C., Li, G., Niu, J., Luo, L., and Zhang, W. (2011). Moist helicity analysis of a heavy rainstorm in Sichuan basin induced by plateau vortex moving eastward. Plateau Meteor 30 (6), 1427–1434.
Huang, J., Ji, M., Xie, Y., Wang, S., He, Y., Ran, J., et al. (2016). Global semi-arid climate change over last 60 years. Clim. Dyn. 46 (3-4), 1131–1150. doi:10.1007/s00382-015-2636-8
Joyce, R. J., Janowiak, J. E., Arkin, P. A., and Xie, P. P. (2004). CMORPH: A method that produces global precipitation estimates from passive microwave and infrared data at high spatial and temporal resolution. J. Hydrometeorol. 5 (3), 487–503. doi:10.1175/1525-7541(2004)005<0487:CAMTPG>2.0.CO;2
Lei, Z., Ren, J., Ma, J., and Zhou, H. (2006). A case analysis of vortex-merging process in a jianghuai river valley Meiyu rainstorm. Trans. Atmos. Sci. 29 (03), 358–363. doi:10.1016/S1003-6326(06)60040-X
Li, Y., Yu, S., and Peng, J. (2013). Yearbook of low vortex shear lines over the Tibetan Plateau. Sichuan Province, Chengdu: Institute of Plateau Meteorology, CMA.
Li, L., Zhang, R., Wen, M., and Duan, J. (2019). Development and eastward movement mechanisms of the Tibetan Plateau vortices moving off the Tibetan Plateau. Clim. Dyn. 52 (7-8), 4849–4859. doi:10.1007/s00382-018-4420-z
Li, L., Zhang, R., Wu, P., Wen, M., and Duan, J. (2020b). Roles of Tibetan Plateau vortices in the heavy rainfall over southwestern China in early July 2018. Atmos. Res. 245, 105059. doi:10.1016/j.atmosres.2020.105059
Li, G. (2013). Advances in Tibetan plateau vortex and southwest vortex research and related scientific problems. Desert Oasis Meteor 7 (03), 1–6. doi:10.3969/j.issn.1002-0799.2013.03.001
Lilly, D. K. (1986). The structure, energetics and propagation of rotating convective storms. Part II: Helicity and storm stabilization. J. Atmos. Sci. 43 (2), 126–140. doi:10.1175/1520-0469(1986)043<0126:tseapo>2.0.co;2
Lin, Z., Guo, W., Jia, L., Yao, X., and Zhou, Z. (2020). Climatology of Tibetan Plateau vortices derived from multiple reanalysis datasets. Clim. Dyn. 55 (7), 2237–2252. doi:10.1007/s00382-020-05380-6
Lin, Z. (2015). Analysis of Tibetan Plateau vortex activities using ERA-Interim data for the period 1979–2013. J. Meteorol. Res. 29, 720–734. doi:10.1007/s13351-015-4273-x
Liu, F., and Fu, M. (1986). Research of eastward Tibetan plateau vortex. Plateau Meteorol. (02), 125–134.
Luhunga, P. M., and Djolov, G. (2017). Evaluation of the use of moist potential vorticity and moist potential vorticity vector in describing annual cycles of rainfall over different regions in Tanzania. Front. Earth Sci. 5, 7. doi:10.3389/feart.2017.00007
Marquet, P. (2014). On the definition of a moist-air potential vorticity. Q. J. R. Meteorol. Soc. 140, 917–929. doi:10.1002/qj.2182
Moffat, H. K. (1969). The degree of knottedness of tangled vortex lines. J. Fluid Mech. 35, 117–129. doi:10.1017/S0022112069000991
Onderlinde, M. J., and Nolan, D. S. (2014). Environmental helicity and its effects on development and intensification of tropical cyclones. J. Atmos. Sci. 71 (11), 4308–4320. doi:10.1175/JAS-D-14-0085.1
Shang, S., Lian, L., Ma, T., Zhuang, K., and Han, T. (2018). Spatiotemporal variation of temperature and precipitation in northwest China in recent 54 years. Arid Zone Res. 35 (01), 68–76. doi:10.13866/j.azr.2018.01.09
Sun, F., Zhou, S., Wang, M., Ma, S., Zhou, S., and Huang, Y. (2022). Activity characteristics of the northeast-moving Tibetan plateau vortices in early summer. Meteor Mon. 48 (3), 324–333. doi:10.7519/j.issn.1000-0526.2021.112501
Wang, K., Sun, M., and Gong, N. (2018). Spatial and temporal distribution and transportation of the water vapor in northwestern China. Arid. Land Geogr. 41 (02), 290–297. doi:10.13826/j.cnki.cn65-1103/x.2018.02.009
Wang, B. (1987). The development mechanism for Tibetan Plateau warm vortices. J. Atmos. Sci. 44 (20), 2978–2994. doi:10.1175/1520-0469(1987)044<2978:TDMFTP>2.0.CO;2
Wu, R., and Tan, Z. (1989). Conservative laws on generalized vorticity and potential vorticity and its applications. Acta Meteor Sin. (04), 436–442. doi:10.11676/qxxb1989.058
Wu, G., Cai, Y., and Tang, X. (1995). Moist potential vorticity and slantwise vorticity development. Acta Meteor Sin. 053 (004), 387–405. doi:10.11676/qxxb1995.04
Xinhua News Agency (2012). Heavy rain hit Subei, Gansu province. Available at: http://www.gov.cn/govweb/jrzg/2012-06/05/content_2153837.htm (Accessed June 5, 2012).
Yang, X., Fei, J., Huang, X., Cheng, X., Carvalho, L. M. V., He, H., et al. (2015). Characteristics of mesoscale convective systems over China and its vicinity using geostationary satellite FY2. J. Clim. 28 (12), 4890–4907. doi:10.1175/JCLI-D-14-00491.1
Yang, K., Lu, P., and Zhuang, L. (2017). Analyses of heavy rainstorm in warm sector under the influence of the low- pressure system of Qinghai-Xizang plateau. J. Trop. Meteor. 33 (03), 415–425. doi:10.16032/j.issn.1004-4965.2017.03.012
Yu, S., Gao, W., Peng, J., and Xiao, Y. (2014). Observational facts of sustained departure Plateau Vortexes. J. Meteorol. Res. 28 (2), 296–307. doi:10.1007/s13351-014-3023-9
Yu, S. (2002). Water vapor images during the eastward movement of the plateau vortex. Plateau Meteor (02), 199–204. doi:10.3321/j.issn:1000-0534.2002.02.013
Zheng, C., Liu, X., Fang, T., and Zhou, M. (2019). An analysis of trigger and enhance mechanisms of two typical Meiyu-front heavy rains in mid-west Zhejiang province. Meteor. Sci. Technol. 47 (03), 469–475. doi:10.19517/j.1671-6345.20180330
Keywords: plateau vortex moving northeastward, heavy precipitation, diagnostic analysis, moist potential vorticity, helicity
Citation: Huang Y, Ma X, Ma Y and Qing Y (2022) Heavy precipitation events in northwestern China induced by northeastward plateau vortex: Two cases comparison. Front. Earth Sci. 10:965005. doi: 10.3389/feart.2022.965005
Received: 09 June 2022; Accepted: 07 July 2022;
Published: 26 July 2022.
Edited by:
Stephen Outten, Nansen Environmental and Remote Sensing Center (NERSC), NorwayReviewed by:
Zhiqiang Lin, Chengdu University of Information Technology, ChinaCopyright © 2022 Huang, Ma, Ma and Qing. This is an open-access article distributed under the terms of the Creative Commons Attribution License (CC BY). The use, distribution or reproduction in other forums is permitted, provided the original author(s) and the copyright owner(s) are credited and that the original publication in this journal is cited, in accordance with accepted academic practice. No use, distribution or reproduction is permitted which does not comply with these terms.
*Correspondence: Xulin Ma, xulinma@nuist.edu.cn; Yue Ma, mayue630@126.com
Disclaimer: All claims expressed in this article are solely those of the authors and do not necessarily represent those of their affiliated organizations, or those of the publisher, the editors and the reviewers. Any product that may be evaluated in this article or claim that may be made by its manufacturer is not guaranteed or endorsed by the publisher.
Research integrity at Frontiers
Learn more about the work of our research integrity team to safeguard the quality of each article we publish.