- Key Laboratory of Meteorological Disaster, Ministry of Education (KLME)/Collaborative Innovation Center on Forecast and Evaluation of Meteorological Disasters (CIC-FEMD)/Joint International Research Laboratory of Climate and Environment Change (ILCEC), Nanjing University of Information Science and Technology, Nanjing, China
Meiyu is a typical rainy season during the East Asian Summer Monsoon whose early or late onset is closely related to an abnormal amount of rainfall. Based on the ERA-interim daily reanalysis data from 1979 to 2019 and the Meiyu index dataset provided by the CMA (the China Meteorological Administration), the characteristics of the intraseasonal oscillation (ISO) in different latitudes during the Jiangnan Meiyu onset period were examined. During the Meiyu onset period, the analysis of 500 hPa geopotential height shows that the key regions of circulation anomaly include the Ural Mountains in mid-high latitudes and the Northwest Pacific in low latitudes. Moreover, the geopotential height anomaly of the two regions shows significant quasi-biweekly scale (10–30 days) characteristics. The diagnosis of quasi-biweekly geopotential tendency shows that height variation in the mid-high latitude key region mainly depends on the influence of temperature advection, while the variation in the low-latitude key region relies on vorticity advection. Over the mid-high latitudes, the height anomaly of the Ural Mountains gradually increases before the day of Meiyu onset, and the contribution of quasi-biweekly oscillation (QBWO) to the total anomaly is approximately 55.9%. The fluctuations from Europe and the Aleutians spread toward the key region, and the abnormal warm advection lies over the key region, contributing to formation of the Ural-blocking pattern. Meanwhile, in the key region located over the Western Pacific, the contribution of the quasi-biweekly component reaches 51.2%. The oscillations over the Western Pacific propagate southwestward along the East Asian coast, while fluctuations over the East Asian continent migrate southward. Throughout this period, the negative vorticity advection occupies the key region, which is conducive to both the positive geopotential height variation and maintenance of the Western Pacific Subtropical High. Thus, the migration of QBWO in different latitudes could be an extended-range signal of the Jiangnan Meiyu prediction.
1 Introduction
Meiyu, known as Baiu in Japan and Chang-ma in South Korea, refers to continuous rainy weather in June and July in the middle and lower reaches of the Yangtze River in China, central and southern Japan, and southern South Korea. During the Meiyu period, continuous high temperature and humidity enhance the occurrence of extreme weather events, such as heavy rainfall, causing massive loss to life and property. Additionally, the study of the Meiyu period is an important component of short-term climate prediction in various countries. Therefore, to ensure disaster prevention and mitigation strategies, it is urgent to conduct further research on the evolutionary characteristics of Meiyu and improve forecasting capabilities for the Meiyu season (Ninomiya and Muraki, 1986; Lee, 1989; Oh et al., 1997; Kawamura and Murakami, 1998; Krishnan and Sugi, 2001).
Due to inconsistency of the definition of the Meiyu onset, previous conclusions have often lacked consistency and comparability. Early efforts have often used indicators of the circulation situation (Yu, 1980; Zhou, 1980), precipitation process (Fu, 1981; Zhang and Zheng, 1981), or both (Chen and Qian, 2004; Xu, 2007; Liang et al., 2010; Liu et al., 2014) to determine the onset of Meiyu. Under different standards for the same observed fact, they have always led to inconsistent conclusions about the variability of atmospheric circulation, evolution of precipitation, and mutual feedback between weather systems. This confusion was not resolved until 2017 when the China National Climate Centre proposed the “New Monitoring Indices”, which combines scientific zoning methods and detailed monitoring indicators.
Furthermore, multiple weather systems at different scales and their complex interactions in summer could be another challenge for Meiyu analyses. Major components of the East Asian Summer Monsoon (EASM) include the western Pacific subtropical high (WPSH), South Asian high (SAH), upper-level East Asian westerly jetstream, typhoons, and low-level southwesterly jets. All these components may affect EASM rainfall patterns and the evolution of Meiyu to varying degrees (Tao and Cheng, 1987; Ninomiya and Shibagaki, 2007; Sampe and Xie, 2010; Zhu et al., 2017; Liu et al., 2019; Ding et al., 2020). The location, dominant period, and intensity of the WPSH at low latitudes play an important role in setting the stage for the Meiyu season, providing plenty of water vapor for Meiyu precipitation (Tao et al., 1958; Wang, 1992; Huang and Tang, 1995; Yang et al., 2004; Mao and Wu, 2005; Liu et al., 2013b; Liu et al., 2013a). The formations of SAH and the East Asian subtropical westerly jet are considered to be the precursor signals of the Meiyu onset (Zhao et al., 2018). At mid-high latitudes, many studies have indicated that the variability of Meiyu circulation is closely related to the blocking pattern formation over the Urals, southward propagation of Rossby waves, cold southward airflow, and so on (Tao and Cheng, 1987; Wang, 1992; Chan et al., 2002; Wang and Gaoqiao, 2005).
As a part of the evolution of the EASM, the Meiyu onset implies that atmospheric circulation enters a short-term stable state. Numerous studies have pointed out that ISOs demonstrate great influence on the onset, maintenance, and extinction of the EASM and Meiyu (Chen et al., 2001; Wu and Wang, 2001; Li et al., 2003; Ju et al., 2005). The climatological intraseasonal oscillation (CISO) of the EASM is embodied in the oscillation characteristics of convection and wind fields at different time scales. The first mode of EASM CISO in the circulation shows that the jointly enhanced Mongolian cyclone, the western North Pacific subtropical high, and SAH correspond to a rainfall anomaly with strong Meiyu fronts over East Asia (Wang and Wu, 1997; Lian et al., 2016; Song et al., 2016). It has been found that Meiyu systems have typical ISO characteristics. For example, owing to the heat source of the Qinghai–Tibet Plateau and the southward transmission of low-frequency wave trains from Eurasia, the SAH has the characteristics of a 10–20-day oscillation, similar to the subtropical westerly jet. The aforementioned two factors have an important impact on precipitation in eastern China during Jianghuai Meiyu (Wang et al., 2016; Wang and Ge, 2016; Yang and Li, 2016; Amemiya and Sato, 2018; Ge, 2018). Meanwhile, as an important part of low-frequency waves at mid-high latitudes, the blocking high during the Meiyu period also has the characteristics of quasi-biweekly oscillation because of the atmospheric nonlinear interaction (Li et al., 2003). Moreover, the WPSH has both quasi-biweekly and 30–60-day oscillation characteristics (Su et al., 2017; Yang and Li, 2020). Some research studies have reported that remarkable ISO characteristics exist for meridional winds and water vapor transport in the lower troposphere (Zuo et al., 2009).
Previous study has been devoted to revealing the ISO feature and interactions between system members during the Meiyu season. However, few studies have been carried out on the mechanism of how ISO affects atmospheric circulation during the Meiyu onset. In addition, since the Jiangnan area defined in the new Meiyu monitoring indices is located at the southernmost end of the traditional Meiyu monitoring area, the determination of the Meiyu onset date in the Jiangnan area can provide advanced warning and indicative significance for the entire river basin during the Meiyu period. Consequently, this study aims to analyze the ISO characteristics at different latitudes during the Meiyu onset period (specified by the new indices) over the Jiangnan area to provide a theoretical reference for Meiyu forecasting. The rest of the study is organized as follows. Section 2 describes the data and methods used in this study. Section 3 illustrates the ISOs at different latitudes during the Jiangnan Meiyu onset. The main conclusions are summarized in Section 4, while the disscussion part is displayed in the last section.
2 Data and methods
2.1 Data
Based on the “Meiyu Monitoring Indices” released by the China Meteorological Administration (CMA) in 2017 (Standardization administration, 2017), the variations in atmospheric circulation during the Meiyu onset period over the Jiangnan area were analyzed. The distribution of Meiyu monitoring stations is shown in Figure 1, which includes 277 CMA stations. According to the climatic characteristics, the Meiyu monitoring area is divided from south to north into the Jiangnan area (red), the middle and lower reaches of the Yangtze River (blue), and the Jianghuai area (yellow). As the southernmost monitoring region, the Jiangnan area tends to witness the earliest onset of the Meiyu period. Therefore, the study of this region can help predict the onset of the whole Meiyu region. In addition, the updated climatic dataset of the Meiyu season (including the onset/retreat date, intensity, and precipitation) was obtained from the National Climate Center (NCC) of China (https://www.ncc-cma.net). Since it contains the common influences of multiple factors, such as precipitation, air temperature, and circulation, the new indices can more accurately reflect the activity characteristics of Meiyu. For instance, the indices stipulate that the regional average daily temperature should be equal to or greater than 22°C during the Meiyu onset period over the Jiangnan area. Additionally, the ridge line of WPSH at 500 hPa should remain between 18°N and 25°N. Therefore, we also used the geopotential height data of ERA-interim (resolution: 1° × 1°) daily reanalysis (Dee et al., 2011) provided by the ECMWF (the European Centre for Medium-Range Weather Forecasts).
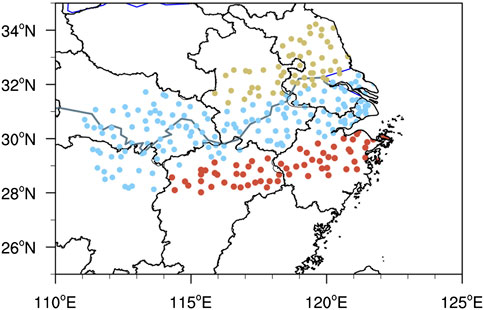
FIGURE 1. Distribution of CMA stations over the Meiyu region (red dots: Jiangnan area; blue dots: middle and lower reaches of the Yangtze River; yellow dots: Jianghuai area).
2.2 Methodology
In this study, power spectrum analysis was carried out to obtain the dominant period of the geopotential height anomaly during the Meiyu onset over the Jiangnan area. Furthermore, for multiscale quantitative analysis, the geopotential height anomaly was decomposed into four terms as follows (Hsu and Li, 2011; Yao et al., 2019):
where
Considering that a circulation field is an important object of Meiyu monitoring, we focused on the evolution and intraseasonal oscillation characteristics of the center and intensity of systems at 500 hPa altitude. In this study, the geopotential height anomaly (the differences between the preset day and its climatic state) was calculated to carry out quantitative analysis. In addition, the geopotential tendency equation (Lau and Holopainen 1984; Fang and Yang 2016; Ren et al., 2021) was used to examine the key physical processes, which can be simply written as follows:
where (
3 Results
3.1 Climatic characteristics of the Meiyu onset period over the Jiangnan area
We first sorted out the time series of the Meiyu periods over the Jiangnan area from 1979 to 2019, as shown in Figure 2A. The values plotted on the vertical ordinate are the duration of the Meiyu periods and the climatic Meiyu onset date. The results reveal that the onset dates are mainly concentrated from May to June and show obvious interannual and interdecadal variabilities. The earliest Meiyu onset date is on the 25th of May 1995, 15 days earlier than the climatological mean (8th of June). In contrast, in 2005, the Meiyu onset occurred on the 11th of July, 32 days later than normal.
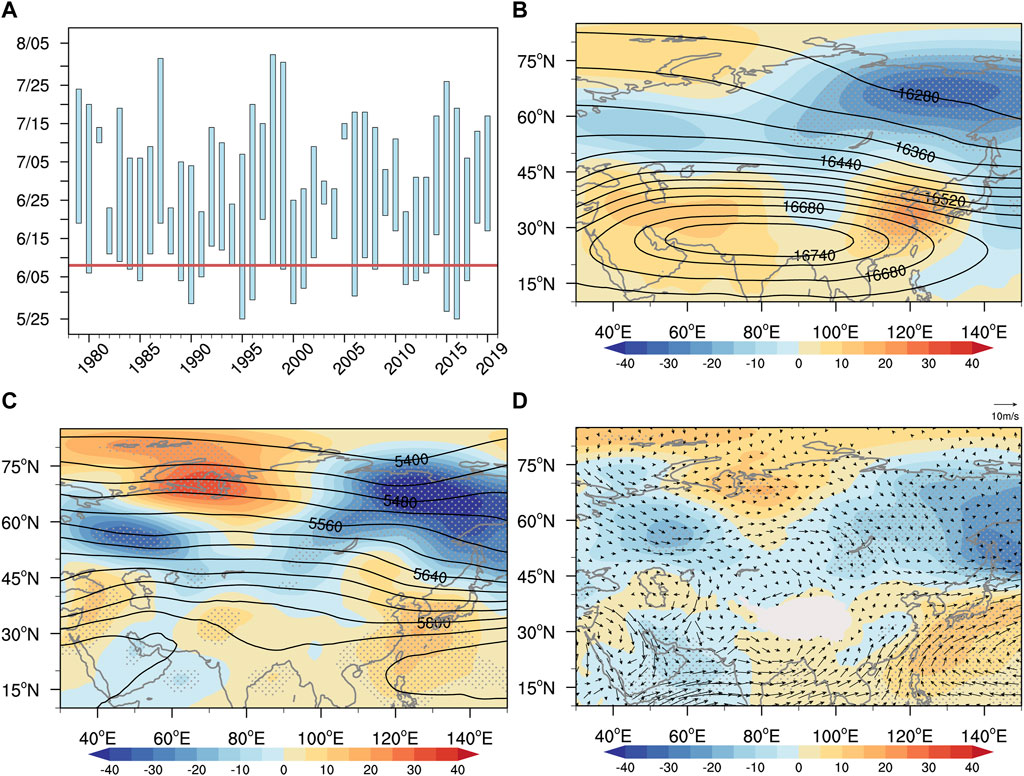
FIGURE 2. (A) Meiyu periods (blue bars) over the Jiangnan area and the climatic Meiyu onset day (red line) during 1979–2019. Geopotential height (contours, unit: gpm) and its anomaly (shading, unit: gpm) at 100 hPa (B) and 500 hPa (C) on the Meiyu onset day. Wind (vector, unit: m/s) and geopotential height anomaly (shading, unit: gpm) at 850 hPa (D) on the Meiyu onset day (dots are the areas with statistical significance exceeding the 95% level).
On the Meiyu onset day, the climatic circulation and geopotential height anomaly at 100, 500, and 850 hPa are shown in Figures 2B–D. In the upper troposphere (Figure 2B), the latitudinal range of the South Asian high (SAH) extends from Africa eastward to the western Pacific, and the meridional range extends from the tropics to the mid-latitude westerly region, with the center located over the Tibetan Plateau. The Jianghuai area is controlled by a significant high anomaly, contributing to the eastward extension of the SAH. In the mid-troposphere (Figure 2C), it can be clearly seen at mid-high latitudes that the positive anomaly is mainly located over the Urals, while the negative centers dominate most of Europe and eastern Russia. The distribution of the anomalies not only contributes to the establishment of the blocking situation during the Meiyu onset period but also enhances the southward flow with cold and dry air. At lower latitudes, the western Pacific subtropical high (WPSH) is located in the South China Sea (SCS), with its ridge line remaining at approximately 20°N, while the ridge point extends to the west of 120°E. At the same time, the geopotential height from the Bay of Bengal to most of the Northwest Pacific shows a significant positive anomaly, with its center located to the northwest of the WPSH. The maintenance of the anomaly promotes the northwestward movement of the WPSH, thus providing abundant moisture to the Jiangnan area. The southward airflow in front of the Urals and the northward transportation of water vapor near the WPSH provide favorable conditions for the onset and maintenance of Meiyu over the Jiangnan area.
In the lower troposphere at 850 hPa (Figure 2D), parts of the Western Pacific at lower latitudes are similarly controlled by significant high-pressure anomalies, and pronounced low-pressure anomalies are situated in the mid-high latitudes east of Lake Baikal. The strong southwesterly winds at the periphery of the anomalous high pressure confront the northwesterly winds at the back of the low pressure in the Jiangnan region, contributing to a favorable background of warm moisture for Meiyu precipitation. In addition, the distribution of the height anomalies from the upper to lower troposphere is relatively consistent in Figure 2. As a result, we chose 500 hPa as a representation for further analysis.
3.2 The intraseasonal oscillation characteristics of atmospheric circulation at mid-high latitudes
As a member of the East Asia Summer Monsoon (Zhang et al., 2018), the atmospheric circulation at mid-high latitudes exhibits an obvious transformation process before Meiyu onset. Therefore, to reveal the ISO characteristics at mid-high latitudes, the geopotential height differences between the onset day and the 15-day lead, 10-day lead, and 5-day lead are provided in Figures 3A–C. Apparently, during the 15-day lead and 10-day lead, the geopotential height gradually increases over most regions at mid-high latitudes. However, only the Ural Mountains area keeps growing until the 5-day lead. We accordingly selected the persistently significant area of difference (indicated by the black dashed frame: 60°N-70°N, 60°E-85°E) as the key region of the mid-high latitudes.

FIGURE 3. Differences of geopotential height between the onset day and the lead 15 d (A), the lead 10 d (B), the lead 5 d (C) (black box: the mid-high-latitude key region (60°N-70°N, 60°E-85°E); unit: gpm; dots are the areas with statistical significance exceeding the 95% level).
The power spectrum of the key region average geopotential height anomaly from May to July from 1979 to 2019 (Figure 4A) was analyzed to obtain the dominant periods of the atmospheric circulation variation over the Jiangnan area. The results show that the average height anomaly has remarkably high-frequency oscillations with periods of 10–30 days, while the rest of the periods (<10 days and 30–90 days) are also significant. By calculating the variation contributions of the perturbations at different scales, we found that the quasi-biweekly disturbances dominate most in the Meiyu periods. The variance contribution of the quasi-biweekly scale component is 50.4% (Figure 4B); this value is larger than that of the synoptic scale component (<10 days), intraseasonal (30–90 days) component, and background component. Then, to confirm the dominant period during the Meiyu onset period, the geopotential height anomaly of the key region was differentiated into four terms based on Eq. 1 for further analyses.
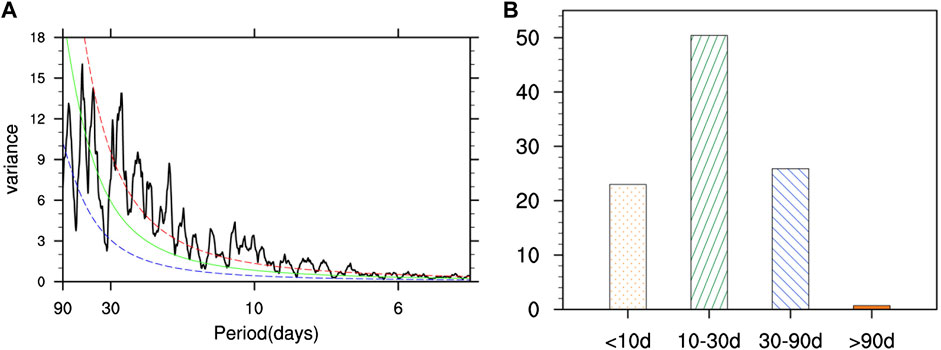
FIGURE 4. (A) Power spectrum analysis of geopotential height anomaly over the mid-high-latitude key region during May to July (unit: W2 m−4). The green dashed line is the red noise spectrum, and the red (blue) dashed line indicates values above the 95% (5%) confidence level. (B) Variation contributions of the perturbations at different time scales (unit: %).
Figure 5 shows the evolution of the geopotential height anomaly at different time scales over the mid-high latitude key region. The regional average anomaly changes from negative to positive at the 6-day lead and continues to increase until it reaches a peak at the 2-day lead. This proves that enhancement of the positive anomaly of the key region with the Urals Mountains as the center is conducive to establishment of the blocking situation at mid-high latitudes. In addition, a quantitative diagnosis of the contribution of each component variation in the geopotential height anomaly 2 days ahead of Meiyu onset is provided in Table 1. The quasi-biweekly scale is the most important component of the oscillations, contributing approximately 55.9% of the total anomalies, indicating that the characteristics of the geopotential height anomaly variation in the key region are closely related to the quasi-biweekly (10–30 days) oscillations (QBWOs).
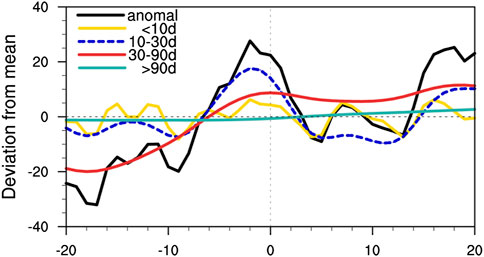
FIGURE 5. Variations of geopotential height anomaly over the mid-high-latitude key region at different time scales during Jiangnan Meiyu onset (unit: gpm; black, geopotential height anomaly; yellow, synoptic scale; blue, quasi-biweekly scale; red, intraseasonal scale; green, >90 d scale).
The propagation and evolution of the geopotential QBWO and its tendency were further analyzed (Figure 6). At the 10-day lead (Figure 6A), Eastern Europe is controlled by weak anomalous high pressure along with an obvious center of the positive tendency field. Meanwhile, the positive anomaly over Aleutian is relatively strong and extensive, and the tendency center is located west of the anomalous high. During the 10-day lead to 4-day lead (Figures 6A–D), the anomalous high over Europe gradually strengthens and is accompanied by a northeastward movement of the center. The high-pressure center over the Aleutian Islands continues to move westward. Then, these two centers merge at the 2-day lead (Figure 6E) and continue to increase southward. Eventually, the key region near the Urals Mountains, which was originally controlled by the abnormal low pressure, shifts to an anomalous high (Figure 6F). The propagation, evolution, and merging of two quasi-biweekly disturbances is an essential factor for the anomalous variation in geopotential height in the key region, and it is also one of the precursor signals of the Jiangnan Meiyu onset at mid-high latitudes.
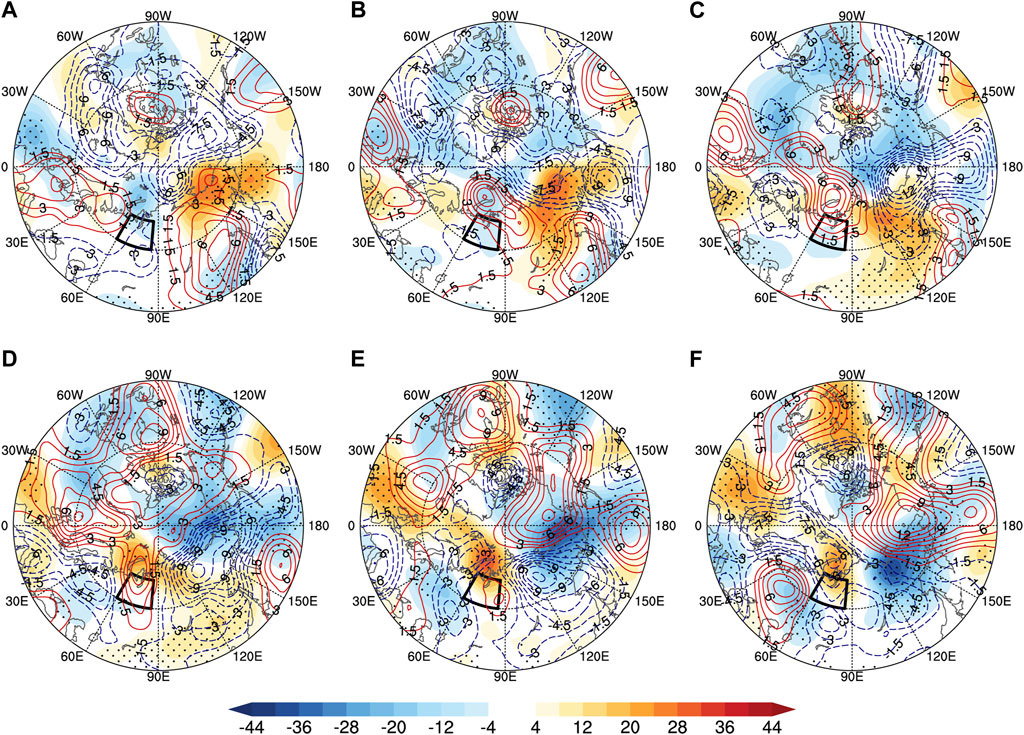
FIGURE 6. Quasi-biweekly-scale geopotential height anomaly (shading) and its tendency (contour) from day -10 to day 0 during the Meiyu onset period (A–F) (unit: gpm; black box: the mid-high latitude key region; the latitude of the outermost line is 40°N; dots are the areas with statistical significance exceeding the 95% level).
Subsequently, to investigate the key physical process during the quasi-biweekly geopotential height variations in the mid-high latitude key region during the Jiangnan Meiyu onset, we calculated each term of the geopotential tendency equation by the given Eq. 2. It is obvious from Table 2 that the fourth component in the equation is −1.28, contributing most to the positive variation in the key region geopotential height. The quasi-biweekly geostrophic vorticity advection and relative vorticity advection are only 0.014 and −0.41, respectively, which indicates that the positive variation in the geopotential height in the key region mainly depends on the influence of quasi-biweekly temperature advection. The spatial distribution of the abnormal temperature advection is shown in Figure 7. In the mid-high latitudes, the regions over Europe and east of Lake Baikal are mainly controlled by anomalous cold advection, while the area to the north of Lake Balkhash shows significant warm advection anomalies. Over the key region, the quasi-biweekly warm advection anomaly promotes the increase in geopotential height in the key region before the Jiangnan Meiyu onset, which in turn encourages the establishment and maintenance of a blocking pattern in the Ural Mountains.

TABLE 2. Quasi-biweekly components of geopotential tendency equation over the mid-high latitude key region (unit: 10−10 s−2).
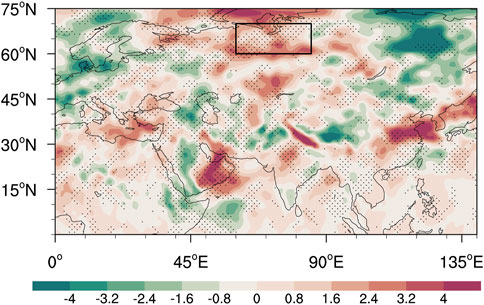
FIGURE 7. Quasi-biweekly temperature advection during the Meiyu onset period (unit: 10−5K s−1; dots are the areas with statistical significance exceeding the 95% level).
3.3 The intraseasonal oscillation characteristics of atmospheric circulation at low latitudes
Intraseasonal oscillations of low-latitude atmospheric circulation play an important role in Meiyu onset (Li et al., 2015; Li and Zhou, 2015). The Meiyu rain belts often appear on the western and northern sides of the 588 dagpm isoline of the WPSH, and the precipitation amount is closely related to the distribution, migration, and variation in the WPSH (Qian and Guan, 2020). Therefore, we examined the ISO characteristics of the region closely related to the variation in the WPSH in this section. Figure 8 shows the distributions of the 588 dagpm isolines of the WPSH from the 15-day lead to the onset day, with an interval of 5 days. The composite analysis indicates that the WPSH gradually strengthens and extends westward before the Meiyu onset, finally expanding to the South China Sea. Consequently, the red box zone (15°N-23°N; 118°E-127°E) in Figure 8 is selected to be the key region at low latitudes.
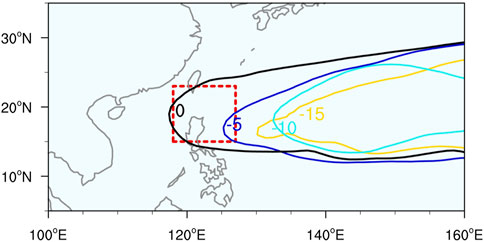
FIGURE 8. Distributions of 588 dagpm isograms from lead 15 d to the onset day (red box: the low-latitude key region (15°N-23°N,118°E-127°E); unit: dagpm; black counter, onset day; purple counter, lead 5 d; blue counter, lead 10 d; yellow counter, lead 15 d).
Similar to the analysis method in the mid-high latitudes, we also analyzed the power spectrum of the geopotential height anomaly in the key region in the low latitudes. As indicated in Figure 9A, the red noise test shows that the cycle from 10 to 30 days is dominant, while the power spectrum peak at the synoptic scale (<10 days) partially passes the test. The quasi-biweekly disturbances contribute most to the low-latitude key region geopotential height anomalies, which is up to 47.9% (Figure 9B). Similar to the mid-latitude key region, this value is also larger than that of the other components. However, to explore the dominant period during the onset period, a more elaborate diagnosis still needs to be conducted.
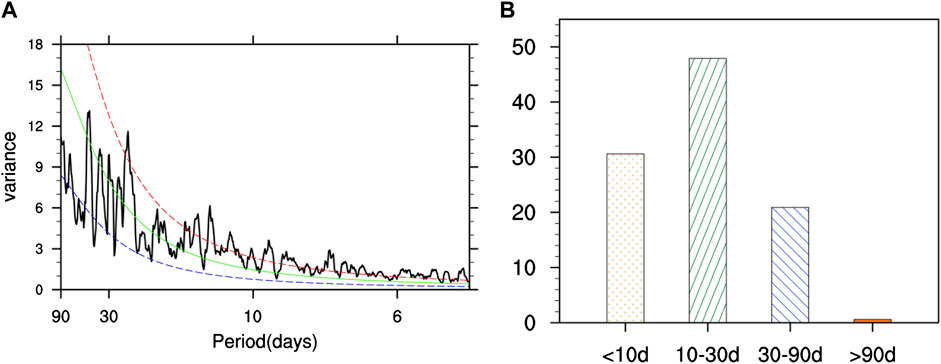
FIGURE 9. Same as Figure 4. (A) the power spectrum analysis and (B) variation contributions over the low-latitude key region.
Based on the scale separation method, the height anomaly in the key region of lower latitudes was examined. The anomaly remains constant in the negative phase until the 2-day lead (Figure 10), which suppresses the westward and northward extension of the WPSH. Then, with the increase in the 10–30-day anomaly, the geopotential height turns from a negative anomaly to a positive anomaly, promoting the intensification and westward extension of WPSH and transporting abundant water vapor to the Jiangnan area. During this process, the component of the 10–30-day scale contributes the most, reaching 51.2% of the total anomalies (Table 3). This indicates that during the Jiangnan Meiyu onset, the anomalous geopotential height variation in the low-latitude key region is mainly influenced by quasi-biweekly (10–30 days) scale oscillations.
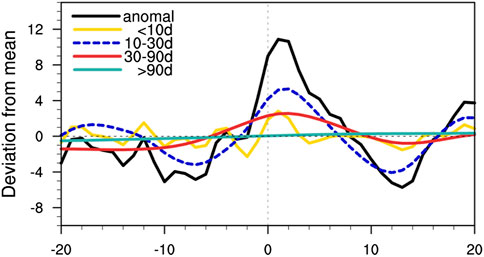
FIGURE 10. Same as Figure 5, but for the low-latitude key region.
To explore the source and propagation path of the low-latitude quasi-biweekly signal before the Meiyu onset, we analyzed the evolution of potential height anomalies and their tendency at the 10–30-day scale. At the 10-day lead (Figure 11A), most of the Asian continent is controlled by the abnormally low pressure in the zonal distribution. The two low-pressure centers are located in northern India and over northeastern China. Subsequently, an abnormally high-pressure center develops in the northeastern part of Balkhash Lake to separate the originally continuous low-pressure zone and weakens it continuously from the 10-day lead to the 2-day lead (Figures 11A–E). Meanwhile, the abnormal depression originating over northeastern China moves eastward into the sea and then propagates southwestward to take control of the key region. Moreover, at the 10-day lead (Figure 11A), over the eastern Japan Sea, there is a northeast-trending abnormal high-pressure zone, which weakens and splits at the 8-day lead (Figure 11B). Then, the anomalous center spreads southward along the east coast of Asia and gradually strengthens. At 2 days, leading to the onset day (Figures 11E,F), the disturbance from the western Pacific moves southward and meets the abnormally high pressure southeast of the continent. In this process, the positive geopotential tendency field controls Northeast Asia, with the center propagating southwestward. Eventually, the key region’s potential height anomaly changes from a negative phase to a positive phase. Accordingly, the positive geopotential tendency takes control of the key region, which provides a conducive condition for the westward extension and maintenance of the WPSH in the precursor stage in regard to the Meiyu onset.
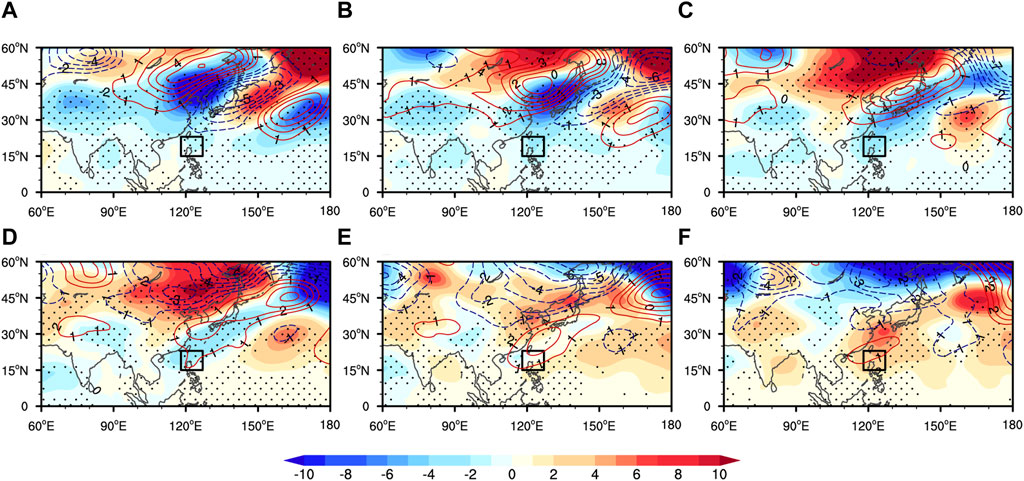
FIGURE 11. The quasi-biweekly-scale geopotential height anomaly (shading) and its tendency (contour) from day -10 to day 0 during the Meiyu onset period (A-F) (unit: gpm; black box: the low latitude key region; dots are the areas with statistical significance exceeding the 95% level).
Similarly, we analyzed the key physical process during the variation in the geopotential height in the low-latitude key region, and the results are presented in Table 4. By calculation of each component of Eq. 2, it is known that the most contributing term is the quasi-biweekly relative vorticity advection, which is approximately −0.135 during the Meiyu onset period. The other terms of the equation are −0.006 and −0.019, which indicates that the positive anomaly of the geopotential height in the key region at low latitudes relies mostly on the relative vorticity advection. Figure 12 presents a detailed analysis of the spatial distribution of the quasi-biweekly relative vorticity advection during the Meiyu onset. The results show that quasi-biweekly positive vorticity advection dominates most of the low-latitude sea surface. Significant negative anomalies lie along the southeastern coast of China, as well as the region east of Taiwan. Apparently, the significant quasi-biweekly negative vorticity advection in the key region favors the increasing potential height and induces the westward extension and northward shift of the Northwest Pacific Subtropical High.

TABLE 4. Quasi-biweekly components of geopotential tendency equation over the low-latitude key region (unit: 10−10 s−2).
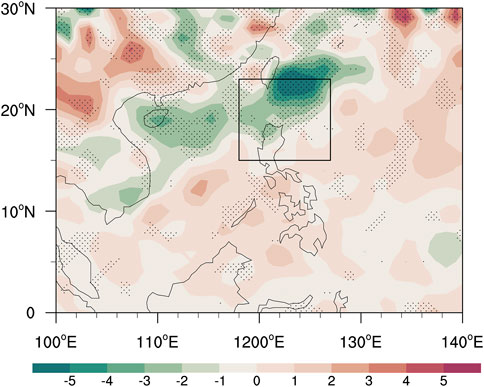
FIGURE 12. Quasi-biweekly relative vorticity during the Meiyu onset period (unit: 10−6 s−1; dots are the areas with statistical significance exceeding the 95% level).
4 Summary
Based on regional division and the Meiyu dataset defined by the Meiyu monitoring indicators, this study investigates the intraseasonal oscillation characteristics of the atmospheric circulation evolution during the Jiangnan Meiyu onset period from 1979 to 2019. The results reveal that there are significant interannual differences in the Meiyu onset in the Jiangnan area. On the onset day, the abnormal high over the Urals along with the anomalous low over Europe and eastern Russia promotes the formation of the blocking pattern in the mid-high latitudes. The positive height located to the northwest of the WPSH contributes to the advancing westward and northward shift of the WPSH at lower latitudes. As a result, abundant warm moisture accompanied by the peripheral flow of the WPSH meets with the cold air supplied by the blocking high, which provides favorable conditions for the occurrence and maintenance of precipitation during Jiangnan Meiyu periods.
During the Meiyu onset, intraseasonal oscillation characteristics of both mid-high latitudes and lower latitudes are studied by examining the filtered geopotential height anomaly. The results of the power spectrum analysis and the variation contributions of the perturbations at different time scales show that the circulation at different latitudes has significant quasi-biweekly scale (10–30 days) characteristics. The diagnostic analysis shows that the contribution of the quasi-biweekly scale oscillations accounts for 55.9% of the total height anomalies at mid-high latitudes and 51.2% at lower latitudes.
At mid-high latitudes, the abnormal high over the Aleutian Sea propagates westward, while the positive anomaly originating from Eastern Europe gradually enhances and spreads to the northeast. Then, the two positive anomalies merge, continuously strengthen, and expand southward to take control of the key region in the Urals Mountains. The propagation, evolution, and merging of two quasi-biweekly disturbances facilitates the establishment of a mid-high-latitude blocking situation by influencing the height of geopotential anomalies in the key region, thus favoring the southward invasion of cold air at high latitudes. Subsequently, the diagnostic results of the quasi-biweekly scale geopotential tendency in this process show that the contribution of the temperature advection term is comparatively larger. During the onset period, the mid-high key region is mainly controlled by quasi-biweekly warm advection, while Europe and the region east of Lake Baikal are dominated by significant cold advection. Obviously, with such abnormal background circulation, the Ural Mountains blocking situation is more likely to be established and maintained.
In addition, the quasi-biweekly oscillations of the atmospheric circulation in the low-latitude key region are mainly influenced by the southward propagating 10–30 day-scale anomalous high over the Asian continent and the mid-latitude Pacific. During the Meiyu onset, the anomalous high over the mid-latitude Pacific intensifies and propagates southward along the east coast of Asia, while the positive anomalous center over the Asian continent travels eastward and expands southward, and the two finally merge over the key region. These two southward quasi-biweekly scale signals not only enhance the key region’s geopotential height anomalies but also promote the westward extension of the WPSH. The warm and humid flow along the high ridge and the cold air transported from high latitudes standoff in the Jiangnan area, forming a favorable atmospheric circulation situation for Meiyu precipitation. Similarly, by diagnosing the quasi-biweekly geopotential height tendency in the low-latitude key region, it is found that the impact of relative vorticity advection is more significant. From the spatial distribution of the abnormal advection, the negative advection anomaly over the key region promotes the positive variation of geopotential height, which in turn influences the evolution of the position intensity of the western Pacific predominantly before Jiangnan Meiyu onset.
5 Discussion
This study mainly determined the characteristics of intraseasonal oscillations at different latitudes during the Jiangnan Meiyu onset under the new indices. It is worth highlighting that most studies have suggested that the north-transmitted ISOs at low latitudes are the main influencing factors on the position and intensity variations of the WPSH as well as the summer precipitation in China (Zhou and Johnny, 2005; Hsu et al., 2016; Su, et al., 2017). In this study, we found that the south-transmitted quasi-biweekly oscillation signals over the mid-latitude Pacific and Asian continents are also closely related to the westward extension of the WPSH during Jiangnan Meiyu onset. A schematic diagram of the propagation of the oscillations is highlighted in Figure 13.
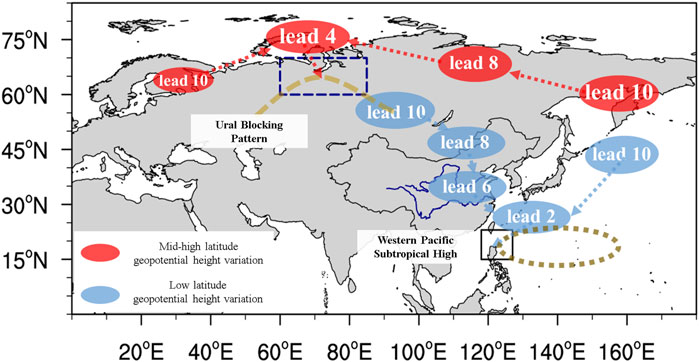
FIGURE 13. Schematic diagram of the evolution of atmospheric quasi-biweekly oscillations during Jiangnan Meiyu onset.
However, there are still some shortcomings that need to be studied in detail. For example, the Jiangnan Meiyu onset dates show a large interannual difference, but the relationship between the Meiyu onset date and the intensity and location of ISOs is still unclear. As indicated in Section 3.2, the origins of the quasi-biweekly disturbances with significant effects on the mid-high latitude key region are over Europe and the Aleutians. However, the annual analysis of individual cases shows that for some years, the geopotential height variation of the key region is mainly determined by the eastward disturbances over Europe, for example, in 1998 (Figure 14). At the 10-day lead (Figure 14A), the positive disturbance center lies in Europe, along with an obvious center of the positive tendency field in the northeastern area of Europe. However, over the Aleutians, the abnormal high is accompanied by a negative tendency field, which leads to a decrease in ISO intensity. Then, from the 8-day lead to the 0-day lead (Figures 14B–F), the positive anomaly over Europe continuously migrates eastward to the key region and then strengthens southward.
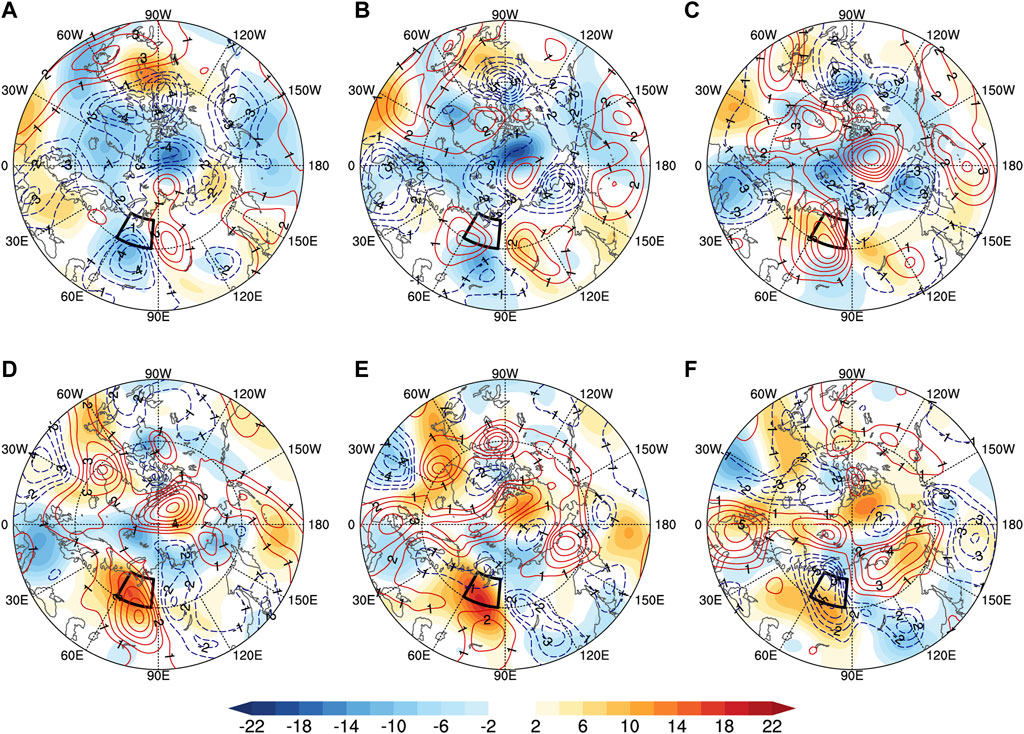
FIGURE 14. Quasi-biweekly-scale geopotential height anomaly (shading) and its tendency (contour) from day -10 to day 0 during the Meiyu onset period in 1998 (A–F) (unit: gpm; black box: the mid-high-latitude key region; the latitude of the outermost line is 40°N).
In contrast, for several years, the key region’s geopotential height is dominated by westward-moving disturbances over the Aleutian area, such as in 2011 (Figure 15). At the 10-day lead (Figure 15A), both Europe and the Aleutian area are controlled by abnormal high centers. The positive tendency field is located in the westward region of both centers. Then, during the days before onset (Figures 15B–F), the anomalous high over the Aleutian Sea exhibits westward shift characteristics and eventually impacts the key region’s geopotential height variation. In addition, the evolution of quasi-biweekly disturbances associated with the low-latitude key region also shows similar characteristics to that of mid-high latitudes. The examination of the causes of such interannual differences could be the focus of our future research study.
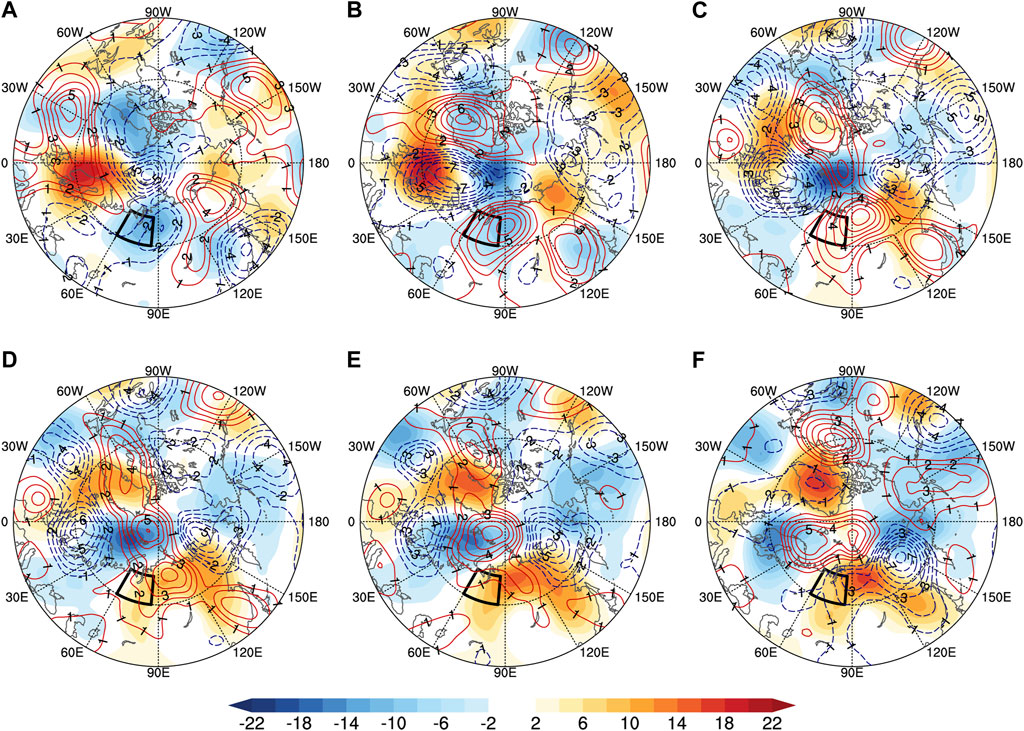
FIGURE 15. Quasi-biweekly-scale geopotential height anomaly (shading) and its tendency (contour) from day -10 to day 0 during the Meiyu onset period in 2011 (A–F) (unit: gpm; black box: the mid-high-latitude key region; the latitude of the outermost line is 40°N).
Data availability statement
The original contributions presented in the study are included in the article/Supplementary Material; further inquiries can be directed to the corresponding author.
Author contributions
SY and TS conceived the idea, conducted the data analysis, and prepared the figures. TS and QH discussed the results and wrote the manuscript.
Funding
This research was funded by the Key Program of the National Natural Science Foundation of China (41930969-3) and the National Natural Science Foundation of China (42088101).
Conflict of interest
The authors declare that the research was conducted in the absence of any commercial or financial relationships that could be construed as a potential conflict of interest.
Publisher’s note
All claims expressed in this article are solely those of the authors and do not necessarily represent those of their affiliated organizations, or those of the publisher, the editors, and the reviewers. Any product that may be evaluated in this article, or claim that may be made by its manufacturer, is not guaranteed or endorsed by the publisher.
References
Amemiya, A., and Sato, K. (2018). A two-dimensional dynamical model for the subseasonal variability of the Asian monsoon anticyclone. J. Atmos. Sci. 75, 3597–3612. doi:10.1175/JAS-D-17-0208.1
Chan, J., Wang, Y., and Xu, X. (2002). Dynamic and thermodynamic characteristics associated with the onset of the 1998 South China Sea summer monsoon. J. Meteorological Soc. Jpn. 78, 367–380. doi:10.2151/jmsj1965.78.4_367
Chen, L., Zhu, C., Wang, W., and Zhang, P. (2001). Analysis of the characteristics of 30-60day low-frequency oscillation over Asia during 1998 SCSMEX. Adv. Atmos. Sci. 18, 623–638. doi:10.1007/s00376-001-0050-0
Chen, Y., and Qian, Y. (2004). Climatic characteristics of 116-year Mei-yu rainfall in the middle-lower reaches of Changjiang River. J. Nanjing Inst. Meteor. 01, 65–72. (in Chinese). doi:10.13878/j.cnki.dqkxxb.2004.01.009
Dee, D., Uppala, S., Simmons, A., Berrisford, P., Poli, P., Kobayashi, S., et al. (2011). The ERA-interim reanalysis: Configuration and performance of the data assimilation system. Q. J. R. Meteorol. Soc. 137, 553–597. doi:10.1002/qj.828
Ding, Y., Liang, P., Liu, Y., and Zhang, Y. (2020). Multiscale variability of meiyu and its prediction: A new review. J. Geophys. Res. Atmos. 125 (7), 31496. doi:10.1029/2019JD031496
Fang, J., and Yang, X. (2016). Structure and dynamics of decadal anomalies in the wintertime midlatitude North Pacific ocean–atmosphere system. Clim. Dyn. 47, 1989–2007. doi:10.1007/s00382-015-2946-x
Fu, Y. (1981). On the division of Meiyu period. Meteor. Mon. 05, 19–20. (in Chinese). doi:10.7519/j.issn.1000-0526.1981.5.006
Ge, J. (2018). Distinct features of subseasonal zonal oscillation of South Asian High and its influence on precipitation over China during early and late summers. Ph. D. dissertation. Nanjing, China: Dept. of Physics, Nanjing University, 101pp.
Hsu, B., Lee, J., and Ha, K. (2016). Influence of boreal summer intraseasonal oscillation on rainfall extremes in southern China. Int. J. Climatol. 36 (3), 1403–1412. doi:10.1002/joc.4433
Hsu, P., Li, T., and Tsou, C. H. (2011). Interactions between boreal summer intraseasonal oscillations and synoptic-scale disturbances over the western north pacific. Part I: Energetics diagnosis*. J. Clim. 24, 927–941. doi:10.1175/2010JCLI3833.1
Huang, S., and Tang, M. (1995). The early summer flood periods of southern China and the summer monsoon circulation of East Asia. J. Trop. Meteor. 03, 203–213. (in Chinese). doi:10.16032/j.issn.1004-4965.1995.03.002
Ju, J., Qian, C., and Cao, J. (2005). The intraseasonal oscillation of east Asian summer monsoon. Chin. J. Atmos. Sci. 29, 187–194. (in Chinese). doi:10.3878/j.issn.1006-9895.2005.02.0
Kawamura, R., and Murakami, T. (1998). Baiu near Japan and its relation to summer monsoons over Southeast Asia and the Western North Pacific. J. Meteorological Soc. Jpn. 76, 619–639. doi:10.2151/jmsj1965.76.4_619
Krishnan, R., and Sugi, M. (2001). Baiu rainfall variability and associated monsoon teleconnections. J. Meteorological Soc. Jpn. 79, 851–860. doi:10.2151/jmsj.79.851
Lau, N., and Holopainen, E. (1984). Transient eddy forcing of the time-mean flow as identified by geopotential tendencies. J. Atmos. Sci. 41, 313–328. doi:10.1175/1520-0469(1984)041<0313:TEFOTT>2.0.CO;2
Lee, D. (1989). An observational study of the Northern Hemisphere summertime circulation associated with the wet summer and the dry summer in Korea. Lkartidningen 25, 205–220. doi:10.1007/978-3-642-03885-3_4
Li, C., and Zhou, W. (2015). Multiscale control of summertime persistent heavy precipitation events over South China in association with synoptic, intraseasonal, and low-frequency background. Clim. Dyn. 45, 1043–1057. doi:10.1007/s00382-014-2347-6
Li, C., Long, Z., and Mu, M. (2003). Atmospheric intraseasonal oscillation and its important effect. Chin. J. Atmos. Sci. 27, 518–535. (in Chinese). doi:10.3878/j.issn.1006-9895.2003.04.07
Li, J., Mao, J., and Wu, G. (2015). A case study of the impact of boreal summer intraseasonal oscillations on Yangtze rainfall. Clim. Dyn. 44, 2683–2702. doi:10.1007/s00382-014-2425-9
Lian, Y., Shen, B., Li, S., Liu, G., and Yang, Xu. (2016). Mechanisms for the formation of Northeast China cold vortex and its activities and impacts: An overview. J. Meteorol. Res. 30, 881–896. doi:10.1007/s13351-016-6003-4
Liang, P., Ding, Y., He, J., Chen, B., and Lei, X. (2010). A Study of determination index of regional Meiyu over the Yangze-Huaihe basin. Chin. J. Atmos. Sci. 34, 418–428. (in Chinese). doi:10.3724/SP.J.1037.2010.00186
Liu, M., Han, G., Zhang, B., and Jin, X. (2013a). Influence of subtropical high's variation period and structure on plum rain onset. Sci. Meteor. Sin. 33, 430–435. (in Chinese). doi:10.3969/2012jms.0166
Liu, Y., Hong, J., Liu, C., and Zhang, P. (2013b). Meiyu flooding of Huaihe River valley and anomaly of seasonal variation of subtropical anticyclone over the Western Pacific. Chin. J. Atmos. Sci. 37, 439–450. (in Chinese). doi:10.3878/j.issn.1006-9895.2012
Liu, M., Han, G., Zhang, B., Hu, L., and Sun, H. (2014). Variation features of meteorological factors about onset of Jianghuai Meiyu and its forecasting focus. Sci. Meteor. Sin. 34, 222–228. (in Chinese). doi:10.3969/2013jms.0002
Liu, Y., Liang, P., and Sun, Y. (2019). The asian summer monsoon: Characteristics, variability, teleconnections and projection. Amsterdam: Elsevier, 237.
Mao, J., and Wu, G. (2005). Intraseasonal variability in the Yangtze-Huaihe River rainfall and subtropical high during the 1991 meiyu period. Acta Meteor. Sin. 05, 762–770. (in Chinese). doi:10.3321/j.issn:0577-6619.2005.05.020
Ninomiya, K., and Muraki, H. (1986). Large-scale circulations over East Asia during Baiu period of 1979. J. Meteorological Soc. Jpn. 64, 409–429. doi:10.2151/jmsj1965.64.3_409
Ninomiya, K., and Shibagaki, Y. (2007). Multi-scale features of the Meiyu-Baiu front and associated precipitation systems. J. Meteorological Soc. Jpn. 85B, 103–122. doi:10.2151/jmsj.85B.103
Oh, T., Kwon, W., and Ryoo, S. (1997). Review of the researches on Changma and future observational study(KORMEX). Adv. Atmos. Sci. 14, 207–222. doi:10.1007/s00376-997-0020-2
Qian, D., and Guan, Z. (2020). Principal modes of the western pacific subtropical high anomaly and their possible impacts on precipitation in east Asia during meiyu season. Sci. Meteor. Sin. 40, 649–660. (in Chinese). doi:10.3969/2020jms.0078
Ren, Q., Jiang, X., Zhang, Y., Li, Z., and Yang, S. (2021). Effects of suppressed transient eddies by the Tibetan plateau on the east asian summer monsoon. J. Clim. 34, 8481–8501. doi:10.1175/jcli-d-20-0646.1
Sampe, T., and Xie, S. (2010). Large-scale dynamics of the Meiyu-Baiu rainband: Environmental forcing by the westerly jet. J. Clim. 23, 113–134. doi:10.1175/2009JCLI3128.1
Song, Z., Zhu, C., Su, J., and Liu, B. (2016). Coupling modes of climatological intraseasonal oscillation in the East Asian Summer monsoon. J. Clim. 29, 6363–6382. doi:10.1175/JCLI-D-15-0794.1
Standardization administration (2017). Meiyu monitoring indices. Beijing: China Standard Publishing House. GB/T 33671-2017Data Availability Statement.
Su, T., Xue, F., Chen, Y., and Dong, X. (2017). A mechanism study for the intraseasonal oscillation impact on the two northward jumps of the Western Pacific subtropical high. Chin. J. Atmos. Sci. 41, 437–460. (in Chinese). doi:10.3878/j.issn.1006-9895.1609.16125
Tao, S., and Cheng, L. (1987). A review of recent research on the East Asian summer monsoon in China. London: Oxford University Press.
Tao, S., Zhao, Y., and Chen, X. (1958). The relationship between MAY-YU in far east and the behavior of circulation over Asia. Acta Meteorol. Sin. 02, 119–134. (in Chinese). doi:10.11676/qxxb1958.014
Wang, B., and Xu, X. (1997). Northern Hemisphere summer monsoon singularities and climatological intraseasonal oscillation. J. Clim. 10, 1071–1085. doi:10.1175/1520-0442(1997)010<1071:NHSMSA>2.0.CO;2
Wang, L., and Ge, J. (2016). Relationship between low-frequency oscillations of atmospheric heat source over the Tibetan Plateau and longitudinal oscillations of the South Asia high in the summer. Chin. J. Atmos. Sci. 40, 853–863. (in Chinese). doi:10.3878/j.issn.1006-9895.1509.15164
Wang, W., Sun, C., Cai, X., and Xu, J. (2016). Relationship between South Asia high low frequency oscillation and the drought and flood in the middle and lower reaches of the Yangtze River. Adv. Earth Sci. 31, 529–541. (in Chinese). doi:10.11867/j.issn.1001-8166.2016.05.0529
Wang, Y. (1992). Effects of blocking anticyclones in Eurasia in the rainy season (Meiyu/Baiu season). J. Meteorological Soc. Jpn. 70, 929–1165. doi:10.2151/jmsj1965.70.5_929
Wang, Y., and Gaoqiao, Q. (2005). Decadal climate variability of rainfall around the middle and lower reaches of Yangtze River and atmospheric circulation. J. Trop. Meteor. 04, 351–358. (in Chinese). doi:10.16032/j.issn.1004-4965.2005.04.002
Wu, R., and Wang, B. (2001). Multi-stage onset of the summer monsoon over the western North pacific. Clim. Dyn. 17, 277–289. doi:10.1007/s003820000118
Xu, Q. (2007). Recent strong decadal change of Meiyu in 121 years. Adv. water Sci. 03, 327–335. (in Chinese). doi:10.3321/j.issn:1001-6791.2007.03.003
Yang, S., and Li, T. (2016). Zonal shift of the South Asian High on the subseasonal time-scale and its relation to the summer rainfall anomaly in China. Q. J. R. Meteorol. Soc. 142, 2324–2335. doi:10.1002/qj.2826
Yang, S., and Li, T. (2020). Cause for quasi-biweekly oscillation of zonal location of Western Pacific subtropical high during boreal summer. Atmos. Res. 245, 105079. doi:10.1016/j.atmosres.2020.105079
Yang, Y., Xu, L., and Gong, Z. (2004). A diagnostic analysis of moist potential vorticity for typhoon heavy rain in Shandong province. Meteor. Mon. 04, 20–25. (in Chinese). doi:10.1117/12.528072
Yao, S., Tong, Q., Li, T., and Gong, K. (2019). The 10-30-day oscillation of winter rainfall in southern China and its relationship with circulation patterns in different latitudes. Int. J. Climatol. 40 (1), 3268–3280. doi:10.1002/joc.6396
Yu, D. (1980). Regional rainy season and single station rainy period. Meteor. Mon. 10, 12–13. (in Chinese). doi:10.7519/j.issn.1000-0526.1980.10.005
Zhang, Y., and Zheng, Y. (1981). Meiyu season and Meiyu period. Meteor. Mon. 04, 19. (in Chinese). doi:10.7519/j.issn.1000-0526.1981.4.010
Zhang, Z., Sun, X., and Yang, X. (2018). Understanding the interdecadal variability of east Asian summer monsoon precipitation: Joint influence of three oceanic signals. J. Clim. 31, 5485–5506. doi:10.1175/JCLI-D-17-0657.1
Zhao, J., Chen, L., and Xiong, K. (2018). Climate characteristics and influential systems of Meiyu to the south of Yangze River based on the new monitoring rules. Acta Meteor. Sin. 76, 680–698. (in Chinese). doi:10.11676/qxxb2018.025
Zhou, W., and Johnny, C. (2005). Intraseasonal oscillations and the South China Sea summer monsoon onset. Int. J. Climatol. 25, 1585–1609. doi:10.1002/joc.1209
Zhou, Z. (1980). Delineation of the rainy season should be based on the seasonal adjustment of the circulation. Meteor. Mon. 09, 14–15. (in Chinese). doi:10.7519/j.issn.1000-0526.1980.9.006
Zhu, Z., Zhong, Z., and Ha, Y. (2017). Relationship between typhoon cyclone during Meiyu period over the northwest pacific and Jianghuai meiyu. Sci. Meteor. Sin. 37, 522–528. (in Chinese). doi:10.3969/2016jms.0060
Keywords: Jiangnan Meiyu, quasi-biweekly oscillation, geopotential height, different latitudes, power spectrum analysis (PSA)
Citation: Sun T, Yao S and Huang Q (2022) The atmospheric quasi-biweekly oscillation during the Jiangnan Meiyu onset period. Front. Earth Sci. 10:986830. doi: 10.3389/feart.2022.986830
Received: 05 July 2022; Accepted: 15 August 2022;
Published: 09 September 2022.
Edited by:
Stephen Outten, Nansen Environmental and Remote Sensing Center (NERSC), NorwayReviewed by:
Yaocun Zhang, Nanjing University, ChinaYong Zhao, Chengdu University of Information Technology, China
Xueyuan Kuang, Nanjing University, China
Copyright © 2022 Sun, Yao and Huang. This is an open-access article distributed under the terms of the Creative Commons Attribution License (CC BY). The use, distribution or reproduction in other forums is permitted, provided the original author(s) and the copyright owner(s) are credited and that the original publication in this journal is cited, in accordance with accepted academic practice. No use, distribution or reproduction is permitted which does not comply with these terms.
*Correspondence: Suxiang Yao, eWFvc3hAbnVpc3QuZWR1LmNu
 Tianle Sun
 Suxiang Yao
 Qian Huang
