- 1Collaborative Innovation Center on Forecast and Evaluation of Meteorological Disasters/Key Laboratory of Meteorological Disaster, Ministry of Education/Joint International Research Laboratory of Climate and Environment Change, Nanjing University of Information Science and Technology, Nanjing, China
- 2School of Atmospheric Sciences, Nanjing University of Information Science and Technology, Nanjing, China
- 3School of Environmental Science and Engineering, Nanjing University of Information Science and Technology, Nanjing, China
Change of ecosystem productivity and its response to climate extremes in the context of global warming are of great interest and particular concern for ecosystem management and adaptation. Using the simulations with and without the CO2 fertilization effect from the Yale Interactive Biosphere (YIBs) model driven by seven CMIP5 climate models, this article investigates the future change in the gross primary productivity (GPP) of the Northern Asian ecosystem as well as the impacts from extreme heat events under the RCP2.6 and RCP8.5 scenarios, respectively. The results show an overall increase of GPP in Northern Asia during the growing season (May-September) under both scenarios, in which the CO2 fertilization effect plays a dominant role. The increases in GPP under RCP8.5 are larger than that under RCP2.6, and the greatest projected increases occur in western Siberia and Northeast China. The extreme heat events are also projected to increase generally and their influences on the Northern Asian ecosystem GPP exhibit spatiotemporal heterogeneity. Under the RCP2.6 scenario, the positive and adverse effects from the extreme heat events coexist in Northern Asia during the middle of the 21st century. During the end of the 21st century, the areas dominated by positive effects are expected to expand particularly in Northeast China and central-western Siberia. For the RCP8.5 scenario, the facilitation effects of the extreme heat events are widely distributed in Northern Asia during the middle of the 21st century, which tends to decline in both intensity and extent during the end of the 21st century. The case is similar after the CO2 fertilization effect is excluded.
Introduction
Terrestrial ecosystem is an important component of global carbon cycle. It can absorb and fix a large amount of CO2 through photosynthesis, thus reducing atmospheric CO2 concentration and playing an important role in climate change (IPCC, 2013). On the other hand, the terrestrial ecosystem is also highly sensitive to climate change (Walther et al., 2002; Ni, 2011; Piao et al., 2013; Wang et al., 2014). As revealed by observational evidence and modeling findings, global climate warming has exerted profound impacts on the terrestrial ecosystem (IPCC, 2014). In response to future warming caused by continued emissions of greenhouse gases, an increasing tendency toward the end of the 21st century in the gross primary productivity (GPP), a critical indicator of the terrestrial carbon cycle, is projected (Yu et al., 2014; Zhu et al., 2018; Schlund et al., 2020).
Appropriate warming of the temperature can better satisfy the thermal demand of vegetation, thereby improving the leaf photosynthetic efficiency and consequently increasing the ecosystem productivity. However, high temperatures beyond the plant tolerance threshold can increase plant respiration and inhibit photosynthesis (Salvucci and Crafts-Brandner, 2004). Some studies have shown that temperature extremes may decrease the plant productivity and change the carbon cycle of the ecosystem through affecting plant physiological processes (Meehl et al., 2000; Smith et al., 2009; Frank et al., 2015; Piao et al., 2019; Peng et al., 2022). For example, the heat wave event occurring in western Russia in 2010 led to a significant decrease in local ecosystem productivity (Bastos et al., 2014). The extreme heat events promoting plant growth at middle and high latitudes has also been reported. Based on the data from the European Carbon Flux Observatory network, Delpierre et al. (2010) indicated that the extreme warm spring in 2007 caused an increase in ecosystem photosynthesis and respiration, with the increase in photosynthesis larger than that in respiration. As a consequence, the carbon uptake was enhanced. These studies suggest that the effects of extreme heat events on the ecosystem may promote or inhibit productivity, depending on the location, duration and intensity of extreme events, and vegetation type, etc.
Northern Asia, especially Siberia, is a region with rich vegetation and diverse ecosystem. It is famous particularly for a widespread of taiga. The GPP change in this region is crucial to the Asian and even global carbon cycle. Meanwhile, Northern Asia is also one of the regions that are most sensitive to climate extremes (Xu et al., 2017; Zhou et al., 2020; IPCC, 2021). Accompanied with future warming, significant changes in frequency, intensity and duration of temperature extremes are anticipated in this region (IPCC, 2021). However, the impact of future changes in temperature extremes on the ecosystem remains an open issue. Exploring this issue can deepen our understanding of terrestrial carbon sequestration and ecological risks to climate extremes. It is also demanded for ecosystem management and adaptation.
In this study, we use the simulations of the Yale Interactive Biosphere (YIBs) model which are driven by multiple CMIP5 models under the low and high emission scenarios, i. e, RCP2.6 and RCP8.5 (Taylor et al., 2012), to project the GPP change in Northern Asia. The impacts of extreme heat events on the Northern Asian GPP during the middle and end of the 21st century under the two scenarios are also quantified, with the aim to provide scientific support for ecosystem management and adaptation.
Model, data, and methods
Data, model, and simulations
The YIBs model (Yue et al., 2020) with a spatial resolution of 1° × 1° is applied for the simulations of ecosystem productivity. This model dynamically produces the leaf area index and tree height in terms of carbon assimilation and allocation. The hourly leaf photosynthesis is calculated by the scheme of Farquhar et al. (1980), and different responses of sunlit and shading leaves to diffuse and direct light (Spitters, 1986) are taken into account. Carbon absorbed by plants is firstly used to maintain life activities and then distributed among leaves, stems, and roots to support plant growth (Clark et al., 2011). Soil respiration is calculated by the carbon transition among 12 soil carbon pools (Schaefer et al., 2008). There are nine plant functional types (PFTs) considered in the model, including evergreen broadleaf forest (EBF), evergreen needleleaf forest (ENF), deciduous broadleaf forest (DBF), tundra, shrubland, C3/C4 grass, and C3/C4 crop.
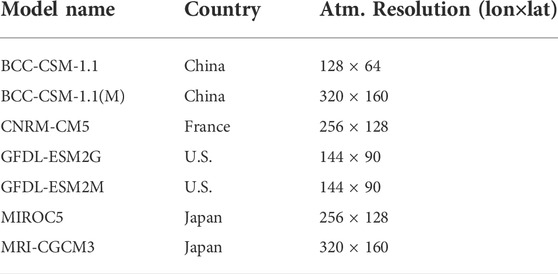
The simulations of the YIBs are driven by the daily meteorological fields under the historical simulation (1986–2005) as well as the RCP2.6 and RCP8.5 scenarios (2006–2100) of seven CMIP5 climate models (Table 1). The meteorological variables include surface temperature, precipitation, specific humidity, surface downward shortwave radiation, surface pressure and surface wind speed. The domain for the YIBs simulations focuses on the Northern Asian region (60°-140°E, 40°-60°N). The RCP2.6 (RCP8.5) scenario is a low (high) emission pathway with the radiative forcing peaking at 2.6 (8.5) W m−2 by 2,100 (Taylor et al., 2012). The seven models chosen not only provide all available daily meteorological data that are needed to drive the YIBs, but also yield a warming of temperature close to 1.5°C (relative to the pre-industrial era) under the RCP2.6 scenario, which meets the long-term warming target pursued by the Paris Agreement.
To exclude the effect of CO2 fertilization, two groups of experiments are conducted, i.e., total factor simulation (ALL) and meteorological element simulation (MET). The sole difference between the two groups of experiments is that the ALL simulation allows the year-to-year variation of CO2 concentrations in line with the CMIP5 simulations, while the CO2 concentration in the MET simulation after 2000 is fixed at the level of 2000. More information about the YIBs model and experiments can refer to the study of Yue et al. (2020).
The satellite retrieval NIRv-based GPP data at a resolution of 0.05° × 0.05° (Wang et al., 2021) are used as the observation to assess the YIBs performance. To facilitate the comparison, the data are interpolated to the same 1° × 1° resolution as the YIBs model.
Methods
In this study, the period 1986–2005 is taken as the reference period and the periods 2041–2060 and 2081–2100 are referred to as the middle of the 21st century (the mid-century) and the end of the 21st century (the end-century), respectively. The ensemble is calculated as the arithmetic mean with the same weight.
As the growing season for plants in the Northern Hemisphere is confined to the period from May to September, the present and future extreme heat events at each grid of Northern Asia are identified during these 5 months by the 95% percentile threshold method (Zhai and Pan, 2003) on the daily scale. Specifically, the threshold of extreme heat events at one grid for a certain calendar day is calculated as the 95th percentile of daily temperature from May to September of the reference period, with the given day centered on a 31-days slide window. When the daily temperature exceeds the corresponding threshold for three consecutive days, one extreme heat event is considered to occur.
The anomalies of GPP associated with extreme heat events (abbreviated as EHE-GPP) relative to the climate mean state are composited to represent the impact of extreme heat events on the ecosystem. The GPP anomalies are calculated separately on each date of the growing season to exclude the influence of seasonal variations of GPP. The statistical significance is assessed by the Student’s t-test.
Performance of the YIBs model
The performance of the YIBs model in the simulation of GPP over Northern Asia is evaluated through the comparison with the observation. Figures 1A–C show the spatial distributions of the ensemble simulated and the observed GPP as well as their difference in Northern Asia over the course of 1986–2005, respectively. In general, the ensemble simulated climatological distribution of GPP bears a resemblance to the counterpart shown in the observation, although the GPP values are somewhat overestimated in parts of Siberia and Northeast China and underestimated in the remaining regions. For the region west of 110°E, large GPP values are mainly located in the north flank of 50°N, particularly in the vast area of Siberia. Due to the widespread distribution of Gobi and desert south of 50°N, only the Altai Mountains and the Tianshan Mountains show large GPP values. To the east of 110°E, large values of GPP are more widely distributed with the largest values situated in Northeast China. The spatial correlation coefficient between the ensemble simulation and the observation is 0.75, higher above the 99.9% significance level. In addition, the observed GPP shows an upward trend, which can be generally captured by the ensemble simulation (Figure 1D). The temporal correlation coefficient between the ensemble simulation and the observation is 0.53, also higher above the 99.9% significance level. Overall, the evaluation suggests that the YIBs model performs well in capturing the climatological distribution and trend of GPP in Northern Asia.
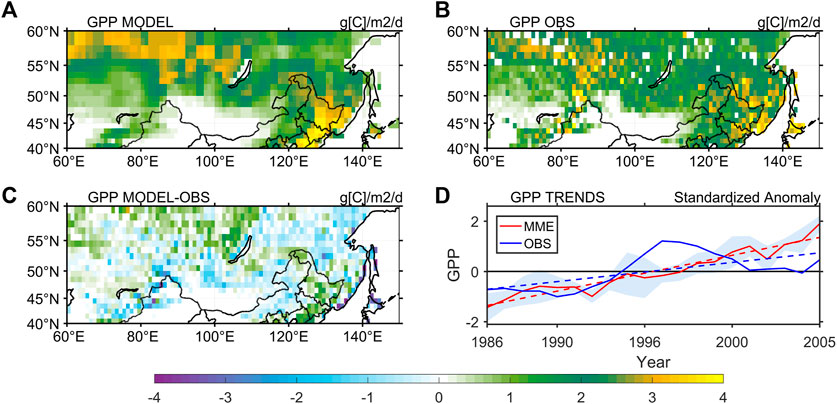
FIGURE 1. Spatial distributions of (A) ensemble simulated and (B) observed GPP (gCm−2d−1) as well as (C) their difference (simulation-observation) in Northern Asia during the period of 1986–2005. (D) Time series of the normalized GPP (smoothed with a 5-years window) from the ensemble simulation (red line) and observation (blue line). The time series are smoothed with a 5-years running mean filter. The shading indicates the spread of the individual CMIP5 simulations.
Result
Projected changes in GPP
The spatial distributions of the ensemble projected changes in GPP during the mid-century and the end-century under the RCP2.6 and RCP8.5 scenarios in the ALL simulations are displayed in Figure 2. Under the low emission scenario (RCP2.6), relative to the reference period, an increase in GPP is projected for both the mid-century and the end-century, and the increasing amplitudes show little change from the mid-century to the end century (Figures 2A,B). In comparison, the GPP is projected to increase continuously from the mid-century to the end century under the high emission scenario (RCP8.5) (Figures 2C,D). The projected greatest increases under the two scenarios both occur in western Siberia and Northeast China, with the increasing magnitudes much larger under the RCP8.5 scenario than under the RCP2.6 scenario. Regionally averaged in Northern Asia, compared to the reference period, the GPP during the mid-century and the end-century under the RCP2.6 scenario is projected to increase by 0.49 gCm−2d−1 and 0.56 gCm−2d−1, respectively. The projected increases under the RCP8.5 scenario are 1.16 gCm−2d−1 in the mid-century and further to 2.57 gCm−2d−1 in the end-century, much higher than the counterpart under the low emission scenario. Figure 3 presents the ensemble projected GPP changes from the MET simulations, in which the influence of CO2 change on the ecosystem is eliminated; only the meteorological elements vary with time following the RCP path. It is found that the projections in the MET simulations differ from that shown in the ALL simulations. Although the increases of GPP still appear in most of Northern Asia in warmer scenarios, the magnitudes of increases are much weaker than that of the ALL simulation in which the effect of CO2 is taken into consideration. Moreover, slight decreases in GPP are even projected in some areas of the upper reaches of the Ob River and Northeast China. On the regional average, the projected GPP in the mid-century and the end-century increases around 0.11 gCm-2d-1 under the RCP2.6 scenario, and that under the RCP8.5 scenario increases by 0.15 gCm-2d-1 and 0.26 gCm-2d-1, respectively.
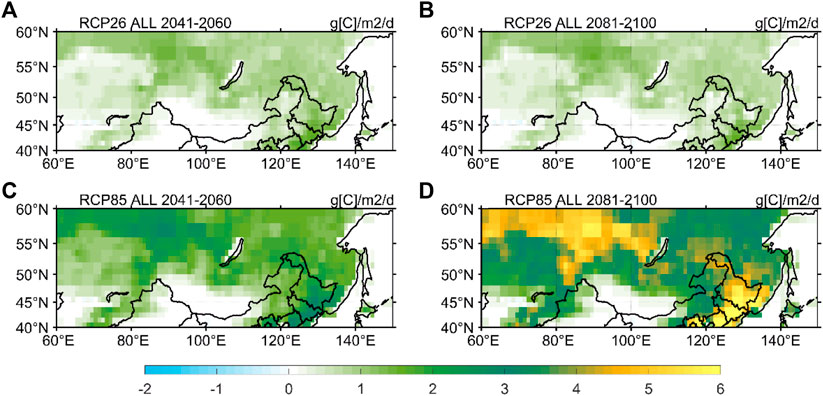
FIGURE 2. Ensemble projected anomalies in GPP (gCm−2d−1) during (A,C) the mid-century and (B,D) the end-century relative to the reference period 1986–2005 under (A,B) RCP2.6 and (C,D) RCP8.5 in the ALL simulations.
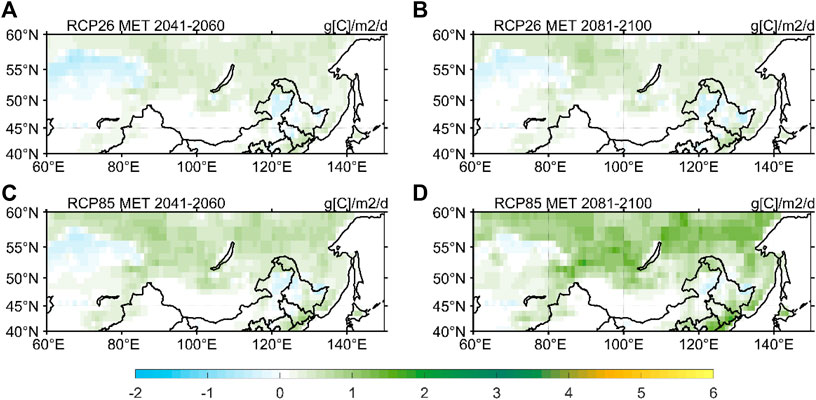
FIGURE 3. Ensemble projected anomalies in GPP (gCm−2d−1) during (A,C) the mid-century and (B,D) the end-century relative to the reference period 1986–2005 under (A,B) RCP2.6 and (C,D) RCP8.5 in the MET simulations.
In summary, the above findings illustrate that the Northern Asian ecosystem GPP positively responds to the future warmer scenarios, with larger increases under the high emission scenario (RCP8.5) than that under the low emission scenario (RCP2.6). The enhancement of CO2 fertilization effect in the future plays a dominant role in the projected increase in GPP. When excluding the CO2 fertilization effect, the future climate warming also shows a positive contribution, likely due to that the increase of ambient temperature can better meet the thermal demand of plant growth and improve the photosynthetic efficiency of vegetation.
Projected impacts of extreme heat events on GPP
Figure 4 shows the spatial distributions of the ensemble projected changes in extreme heat events during the mid-century and the end-century relative to the reference period under the RCP2.6 and RCP8.5 scenarios from the ALL simulations. As global climate continues to warm in the future, an increase in the frequency of extreme heat events is anticipated in Northern Asia, with larger increase under the high emission scenario than under the low emission scenario, which is consistent with the previous studies (IPCC, 2013; 2021). For the RCP2.6 scenario (Figures 4A,B), the projected increases are comparable between the mid-century and the end-century. A slight decrease in the frequency of extreme heat events is seen around Lake Baikal. For the RCP8.5 scenario (Figures 4C,D), the increases of extreme heat events are projected to strengthen from the mid-century to the end-century. During the mid-century, the magnitudes of increases are in general 3–9 times per year with the exceedance of 12 times per year in some coastal areas. During the end-century, the projected extreme heat events increase more significantly in the south than in the north. The north region show an increase of more than 12 times per year, while the increase in the south region is above 30 times per year.
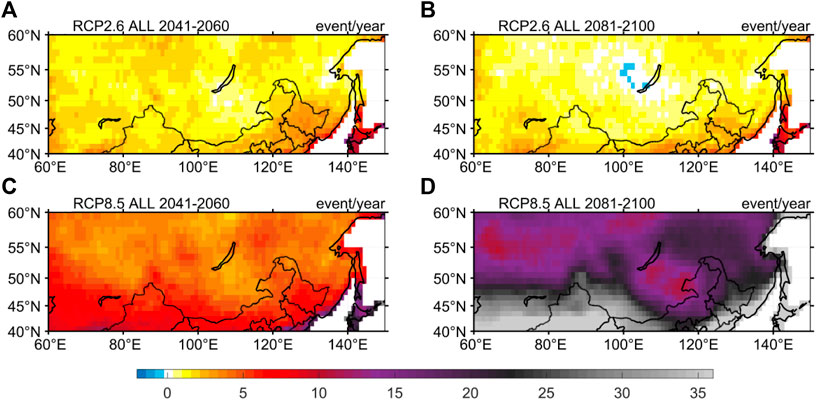
FIGURE 4. Ensemble projected anomalies in extreme heat events (times/year) during (A,C) the mid-century and (B,D) the end-century relative to the reference period 1986–2005 under (A,B) RCP2.6 and (C,D) RCP8.5 in the ALL simulations.
Future increases in extreme heat events are expected to exert effects on the GPP in Northern Asia. Figure 5 shows the percentage anomalies of EHE-GPP relative to the climatological state in the mid-century and the end-century as projected from the ALL simulation. Under the RCP2.6 scenario, in the mid-century (Figure 5A), negative anomalies can be noticed in a majority of Northern Asia, indicating a general adverse effect on the local GPP from the extreme heat events. In contrast, the northwest-southeast oriented belt region from around Lake Baikal to Heilongjiang Province of Northeast China shows an increase of above 3% in GPP as a response to the occurrence of extreme heat events, indicating a significant facilitation effect from the extreme heat events. In the end-century (Figure 5B), the areas dominated by negative EHE-GPP anomalies tend to shrink. Instead, the regions covered by positive EHE-GPP anomalies expand particularly in Northeast China and central-western Siberia. This result hints at a relatively strengthening (weakening) of the facilitation (inhibition) effect on the ecosystem productivity from the extreme heat events in the end-century compared to the mid-century under the low emission scenario. For the RCP8.5 scenario, the extreme heat events contribute to the increase of GPP in most regions (Figures 5C,D). Contrary to the case under the RCP2.6 scenario, the percentage increases in EHE-GPP during the mid-century are much more salient than that during the end-century in both intensity and extent. It suggests that the facilitation effect from the extreme heat events on the ecosystem productivity tends to decline from the mid-century to the end-century under the high emission scenario. During the end-century, the large positive anomalies of EHE-GPP are concentrated in the belt region near 50°N and the coastal zone of Russian Far East.
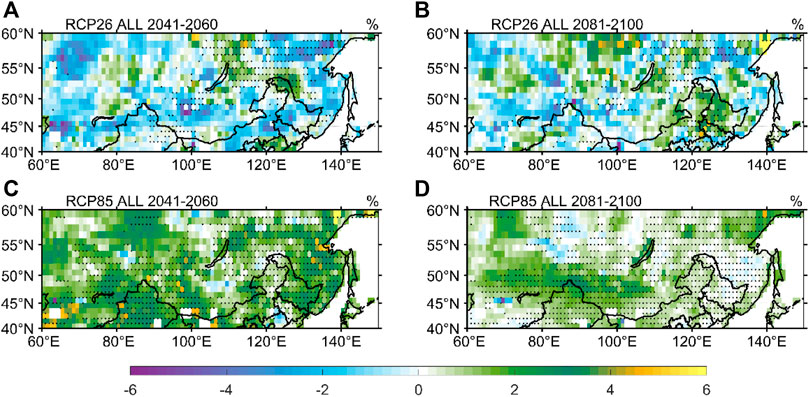
FIGURE 5. Ensemble projected percentage anomalies (%) of EHE-GPP relative to the climatological state during (A,C) the mid-century and (B,D) the end-century under (A,B) RCP2.6 and RCP8.5 (C,D) from the ALL simulations. Regions with six out of seven models exceeding the 95% significance level are dotted.
The spatial characteristics of the effect of extreme heat events on the GPP in Northern Asia from the MET simulations are similar to that of the ALL simulations, but with a reduction in intensity particularly under the RCP8.5 scenario (Figure 6). For instance, the magnitudes of increases in EHE-GPP forced by the MET simulations are about half (one fifth) of that in the ALL simulations during the mid-century (the end-century) under the RCP8.5 scenario. Therefore, although the presence of CO2 can promote the ecosystem productivity and improve the GPP level on the whole, it will not change the impact of extreme heat events on the ecosystem.
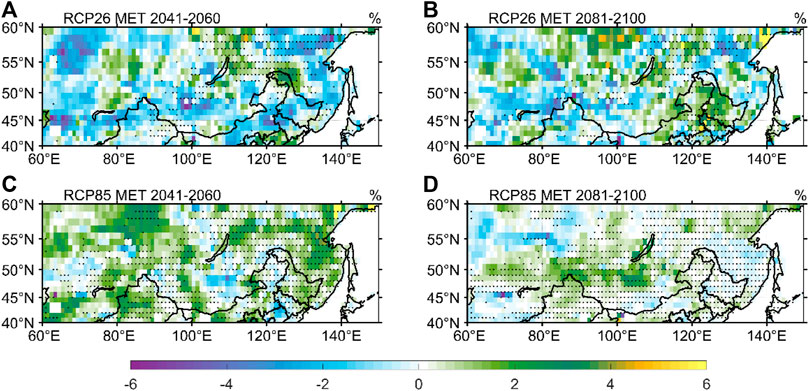
FIGURE 6. Ensemble projected percentage anomalies (%) of EHE-GPP relative to the climatological state during (A,C) the mid-century and (B,D) the end-century under (A,B) RCP2.6 and RCP8.5 (C,D) from the MET simulations. Regions with six out of seven models exceeding the 95% significance level are dotted.
It should be worth noting that the effects of extreme heat events on the ecosystem are spatially heterogeneous around the world, since the needs of temperature for the growth of ecosystem are not the same in different regions. For example, the projected increases of temperature tend to promote the vegetation growth in the high latitudes of the Northern Hemisphere (Yu et al., 2014; Jeong, 2020). However, in the tropics, future temperature increases will inhabit the vegetation growth and hence weaken the GPP (Park et al., 2015).
Given that the ENF and tundra are widely distributed in Northern Asia (Zhang et al., 2015), we also calculate the GPP anomalies of these two vegetation types under the influence of extreme heat events. It is found that the spatial patterns under the RCP2.6 and RCP8.5 scenarios in the All and MET simulations are similar to Figures 5, 6, respectively, and the relative changes of the tundra GPP affected by the extreme heat events are generally larger than that for the ENF (Figure not shown). The spatial correlations of the EHE-GPP anomalies in ENF and tundra with that of the whole vegetation from the ALL and MET simulations exceed 0.50 (significant at the 99.9% level) for both the mid-century and the end-century under each scenario (Table 2), indicating that the GPP changes of the ENF and tundra influenced by the extreme heat events are consistent with that for the whole vegetation. As the ENF is the dominant vegetation type and the most important GPP provider in Northern Asia (Pan et al., 2011), its GPP change affected by the extreme heat events will largely determine the influence of extreme heat events on the whole ecosystem productivity in Northern Asia. Although the tundra is also extensive in Northern Asia, its GPP change shows less contribution to the change of total GPP, due to small proportion of tundra GPP to the whole Northern Asian ecosystem GPP.

TABLE 2. Spatial correlation coefficients of the total ecosystem GPP anomalies with the ENF/tundra GPP anomalies under the influence of extreme heat events.
Conclusion
Based on the YIBs model simulations driven by 7 CMIP5 models under the low-emission (RCP2.6) and high-emission (RCP8.5) scenarios respectively with the CO2 effect included and excluded, this study projects the changes of GPP in Northern Asia during the middle and the end of the 21st century. The impacts of future changes in extreme heat events on the Northern Asian ecosystem productivity are further examined. The main findings are summarized as follows:
1) The GPP during the growing season is projected to increase in Northern Asia, accompanied with larger increases under RCP8.5 than under RCP2.6. The greatest increases are projected in western Siberia and Northeast China. In addition, the projected increases are enhanced from the mid-century to the end-century under the RCP8.5 scenario, whereas under the RCP2.6 scenario they are comparable between the middle and the end of the 21st century. The enhancement of CO2 fertilization effect plays a dominant role in the projected increase of GPP. After removing the influence of CO2 effect, the projected increase of GPP in Northern Asia becomes weaker.
2) The impacts of future increases in the extreme heat events on the Northern Asian GPP show spatiotemporal heterogeneity. Under the RCP2.6 scenario, during the mid-century, the adverse effect of extreme heat events exists in most of the region except the northwest-southeast oriented belt region from around Lake Baikal to Heilongjiang Province where the positive effect from the extreme heat events is projected. The positive effect tends to expand in the end-century particularly in Northeast China and central-western Siberia. Under the RCP8.5 scenario, the positive effect from the extreme heat events is projected to dominate most regions in the mid-century and to shrink in the end-century. Although the CO2 fertilization effect can amplify the facilitation effect from the warming, it will not alter the spatial regime of the impact of extreme heat events on the GPP.
3) The spatial distributions of the impacts on the evergreen needleleaf forest and tundra from the extreme heat events under each scenario with and without the effect of CO2 fertilization approximate that for the whole ecosystem in Northern Asia. In addition, larger relative changes are projected for the tundra GPP than for the evergreen needleleaf forest GPP that are affected by the extreme heat events.
Note that this study aims at the projected impacts of extreme heat events on the GPP in Northern Asia. The physical processes for their impacts on the GPP are not addressed. Naturally, the processes of extreme heat events affecting the ecosystem are complicated, which includes a variety of physicochemical processes and a number of elements that are mutually positively and negatively interacted (Allen and Breshears, 1998; Peng et al., 2009; Allen et al., 2010). Further in-depth investigations are needed in the future work to explore detailed physical processes for different behaviors of the impacts of extreme heat events on the Northern Asian ecosystem GPP under different scenarios.
Data availability statement
The original contributions presented in the study are included in the article, further inquiries can be directed to the corresponding author.
Author contributions
BZ and XY designed and supervised the research; MY performed data analysis and drafted the manuscript; BZ prepared the final manuscript with the contribution from all co-authors.
Funding
This research was jointly supported by the National Natural Science Foundation of China (41991285) and the National Key Research and Development Program of China (2017YFA0605004).
Conflict of interest
The authors declare that the research was conducted in the absence of any commercial or financial relationships that could be construed as a potential conflict of interest.
Publisher’s note
All claims expressed in this article are solely those of the authors and do not necessarily represent those of their affiliated organizations, or those of the publisher, the editors and the reviewers. Any product that may be evaluated in this article, or claim that may be made by its manufacturer, is not guaranteed or endorsed by the publisher.
Acknowledgments
We acknowledge the World Climate Research Program’s Working Group on Coupled Modeling and thank the climate modeling groups for producing and sharing their model outputs.
References
Allen, C. D., and Breshears, D. D. (1998). Drought-induced shift of a forest-woodland ecotone: Rapid landscape response to climate variation. Proc. Natl. Acad. Sci. U. S. A. 95, 14839–14842. doi:10.1073/pnas.95.25.14839
Allen, C. D., Macalady, A. K., Chenchouni, H., Bachelet, D., Mcdowell, N., Vennetier, M., et al. (2010). A global overview of drought and heat-induced tree mortality reveals emerging climate change risks for forests. For. Ecol. Manag. 259, 660–684. doi:10.1016/j.foreco.2009.09.001
Bastos, A., Gouveia, C. M., Trigo, R. M., and Running, S. W. (2014). Analysing the spatio-temporal impacts of the 2003 and 2010 extreme heatwaves on plant productivity in europe. Biogeosciences 11, 3421–3435. doi:10.5194/bg-11-3421-2014
Clark, D. B., Mercado, L. M., Sitch, S., Jones, C. D., Gedney, N., Best, M. J., et al. (2011). The joint UK land environment simulator (JULES), model description–Part 2: Carbon fluxes and vegetation dynamics. Geosci. Model Dev. 4, 701–722. doi:10.5194/gmd-4-701-2011
Delpierre, N., Soudani, K., François, C., Köstner, B., DufrÊne, E., Nikinmaa, E., et al. (2010). Exceptional carbon uptake in European forests during the warm spring of 2007: A data–model analysis. Glob. Chang. Biol. 15 (6), 1455–1474. doi:10.1111/j.1365-2486.2008.01835.x
Farquhar, G. D., Caemmerer, S. V., and Berry, J. A. (1980). A biochemical model of photosynthetic CO2 assimilation in leaves of C3 species. Planta 149, 78–90. doi:10.1007/BF00386231
Frank, D., Reichstein, M., Bahn, M., Thonicke, K., Frank, D., Mahecha, M., et al. (2015). Effects of climate extremes on the terrestrial carbon cycle: Concepts, processes and potential future impacts. Glob. Chang. Biol. 21, 2861–2880. doi:10.1111/gcb.12916
IPCC (2013). Climate change 2013: The physical science basis. Contribution of working group I to the fifth assessment report of the intergovernmental panel on climate change. Cambridge, UK and New York: Cambridge University Press.
IPCC (2014). Climate change 2014: Synthesis report. Cambridge, UK and New York: Cambridge University Press.
IPCC (2021). Climate change 2021: The physical science basis. Contribution of working group I to the sixth assessment report of the intergovernmental panel on climate change. Cambridge, UK and New York: Cambridge University Press.
Jeong, S. (2020). Autumn greening in A warming climate. Nat. Clim. Chang. 10, 712–713. doi:10.1038/s41558-020-0852-7
Meehl, G. A., Karl, T., Easterling, D. R., Changnon, S., Pielke, R., Changnon, D., et al. (2000). An introduction to trends in extreme weather and climate events: Observations, socioeconomic impacts, terrestrial ecological impacts, and model projections. Bull. Amer. Meteor. Soc. 108, 46–51.
Ni, J. (2011). Impacts of climate change on Chinese ecosystems: Key vulnerable regions and potential thresholds. Reg. Environ. Change 11, 49–64. doi:10.1007/s10113-010-0170-0
Pan, Y., Birdsey, R. A., Fang, J., Houghton, R., Kauppi, P. E., Kurz, W. A., et al. (2011). A large and persistent carbon sink in the world's forests. Science 333, 988–993. doi:10.1126/science.1201609
Park, H., Jeong, S., Ho, C., Kim, J., Brown, M. E., Schaepman, M. E., et al. (2015). Nonlinear response of vegetation green-up to local temperature variations in temperate and boreal forests in the northern Hemisphere. Remote Sens. Environ. 165, 100–108. doi:10.1016/j.rse.2015.04.030
Peng, C., Zhou, X., Zhao, S., Wang, X., Zhu, B., Piao, S., et al. (2009). Quantifying the response of forest carbon balance to future climate change in northeastern China: Model validation and prediction. Glob. Planet. Change 66, 179–194. doi:10.1016/j.gloplacha.2008.12.001
Peng, X. B., Yu, M., and Chen, H. S. (2022). Projected changes in terrestrial vegetation and carbon fluxes under 1.5°C and 2.0°C global warming. Atmos. (Basel). 13, 42. doi:10.3390/atmos13010042
Piao, S., Sitch, S., Ciais, P., Friedlingstein, P., Peylin, P., Wang, X., et al. (2013). Evaluation of terrestrial carbon cycle models for their response to climate variability and to CO2 trends. Glob. Chang. Biol. 19, 2117–2132. doi:10.1111/gcb.12187
Piao, S., Zhang, X., Chen, A., Liu, Q., Wu, X., Wang, X., et al. (2019). The impacts of climate extremes on the terrestrial carbon cycle: A review. Sci. China Earth Sci. 49, 1551–1563. doi:10.1007/s11430-018-9363-5
Salvucci, M. E., and Crafts-Brandner, S. J. (2004). Inhibition of photosynthesis by heat stress: The activation state of rubisco as A limiting factor in photosynthesis. Physiol. Plant. 120, 179–186. doi:10.1111/j.0031-9317.2004.0173.x
Schaefer, K., Collatz, G. J., Tans, P., Denning, A. S., Baker, I., Berry, J., et al. (2008). Combined simple biosphere/carnegie-ames-stanford approach terrestrial carbon cycle model. J. Geophys. Res. 113, G03034. doi:10.1029/2007JG000603
Schlund, M., Eyring, V., Camps-Valls, G., Friedlingstein, P., Gentine, P., Reichstein, M., et al. (2020). Constraining uncertainty in projected gross primary production with machine learning. J. Geophys. Res. Biogeosci. 125, e2019JG005619. doi:10.1029/2019JG005619
Smith, M., Knapp, A. K., and Collins, S. L. (2009). A framework for assessing ecosystem dynamics in response to chronic resource alterations induced by global change. Ecology 90, 3279–3289. doi:10.1890/08-1815.1
Spitters, C. (1986). Separating the diffuse and direct component of global radiation and its implications for modeling canopy photosynthesis Part II. Calculation of canopy photosynthesis. Agric. For. Meteorol. 38, 231–242. doi:10.1016/0168-1923(86)90061-4
Taylor, K. E., Stouffer, B. J., and Meehl, G. A. (2012). An overview of CMIP5 and the experiment design. Bull. Am. Meteorol. Soc. 93, 485–498. doi:10.1175/BAMS-D-11-00094.1
Walther, G. R., Post, E., Convey, P., Menzel, A., Parmesan, C., Beebee, T., et al. (2002). Ecological responses to recent climate change. Nature 416, 389–395. doi:10.1038/416389a
Wang, S., Zhang, Y., Ju, W., Qiu, B., and Zhang, Z. (2021). Tracking the seasonal and inter-annual variations of global gross primary production during last four decades using satellite near-infrared reflectance data. Sci. Total Environ. 755, 142569. doi:10.1016/j.scitotenv.2020.142569
Wang, X., Piao, S., Ciais, P., Friedlingstein, P., Myneni, R. B., Cox, P., et al. (2014). A two-fold increase of carbon cycle sensitivity to tropical temperature variations. Nature 506, 212–215. doi:10.1038/nature12915
Xu, Y., Zhou, B., Wu, J., Han, Z., Zhang, Y., Wu, J., et al. (2017). Asian climate change under 1.5-4°C warming targets. Adv. Clim. Change Res. 8, 99–107. doi:10.1016/j.accre.2017.05.004
Yu, M., Wang, G. L., Parr, D., and Ahmed, K. F. (2014). Future changes of the terrestrial ecosystem based on A dynamic vegetation model driven with RCP8.5 climate projections from 19 GCMs. Clim. Change 127, 257–271. doi:10.1007/s10584-014-1249-2
Yue, X., Liao, H., Wang, H., Zhang, T., Unger, N., Sitch, S., et al. (2020). Pathway dependence of ecosystem responses in China to 1.5°C global warming. Atmos. Chem. Phys. 20, 2353–2366. doi:10.5194/ACP-20-2353-2020
Zhai, P., and Pan, X. (2003). Change in extreme temperature and precipitation over northern China during the second half of the 20th century. Acta Geogr. Sin. 58, 1–10. doi:10.11821/xb20037s001
Zhang, Y., Chen, J., Chen, L., Li, R., Zhang, W., Lu, N., et al. (2015). Characteristics of land cover change in siberia based on globe land 30, 2000-2010. Prog. Geogr. 34 (10), 1324–1333. doi:10.18306/dlkxjz.2015.10.013
Zhou, B., Xu, Y., Han, Z., Shi, Y., Wu, J., and Li, R. (2020). CMIP5 projected changes in mean and extreme climate in the belt and road region. Trans. Atmos. Sci. 43 (1), 255–264. doi:10.13878/j.cnki.dqkxxb.20191125009
Keywords: extreme heat events, YIBs model, ecosystem GPP, northern asia, projection
Citation: Yan M, Yue X, Zhou B, Sun X and Xin N (2022) Projected changes of ecosystem productivity and their responses to extreme heat events in northern asia. Front. Earth Sci. 10:970296. doi: 10.3389/feart.2022.970296
Received: 15 June 2022; Accepted: 04 July 2022;
Published: 22 July 2022.
Edited by:
Shangfeng Chen, Institute of Atmospheric Physics (CAS), ChinaReviewed by:
Anning Huang, Nanjing University, ChinaHuopo Chen, Institute of Atmospheric Physics (CAS), China
Copyright © 2022 Yan, Yue, Zhou, Sun and Xin. This is an open-access article distributed under the terms of the Creative Commons Attribution License (CC BY). The use, distribution or reproduction in other forums is permitted, provided the original author(s) and the copyright owner(s) are credited and that the original publication in this journal is cited, in accordance with accepted academic practice. No use, distribution or reproduction is permitted which does not comply with these terms.
*Correspondence: Botao Zhou, emhvdWJ0QG51aXN0LmVkdS5jbg==
 Minchu Yan
 Xu Yue
 Botao Zhou
 Xiaoling Sun
 Ning Xin