 Peilan Huang
 Jianjun Xu
 Mei Liang
- 1South China Sea Institute of Marine Meteorology, Guangdong Ocean University, Zhanjiang, China
- 2College of Ocean and Meteorology, Guangdong Ocean University, Zhanjiang, China
- 3CMA-GDOU Joint Laboratory for Marine Meteorology, Zhanjiang, China
- 4Key Laboratory of Climate, Resources and Environment in Continental Shelf and Deep Sea of Department of Education of Guangdong Province, Guangdong Ocean University, Zhanjiang, China
- 5Shenzhen Institute of Guangdong Ocean University, Shenzhen, China
A decadal variation in the frequency of tropical cyclones (TCs) that reached their lifetime maximum intensity (LMI) in the South China Sea (SCS; 5°N-25°N, 107°E-121°E) from 1978 to 2020 was identified. TCs that generated and reached LMI in the SCS were named “local TCs,” while those that generated in the western North Pacific (WNP) and reached LMI in the SCS were named “migratory TCs.” A seesaw phenomenon in the frequencies of these two types of TCs was found before and after 1997. From 1978 to 1996, TC frequency was generally lower in local TCs but higher in migratory TCs. The opposite was true from 1997 to 2020. The main factors responsible for this “seesaw” phenomenon include changes in the genesis positions of TCs and the interdecadal variation of large-scale environmental flow patterns. From 1997 to 2020, during which the large-scale steering flow was favorable for local TCs, the monsoon trough over the WNP withdrew westward along with the warm pool and the subtropical high strengthened westward. Meanwhile, the sea surface temperature (SST) gradient between the equator and mid-latitudes decreased and the north wind weakened near 120°E. Easterly winds were strengthened in the equatorial region, which led to an abnormal anticyclone and the divergence of water vapor in the WNP. In contrast, the SST of the SCS, an internal sea, increased significantly. Under local atmosphere-ocean interaction, abnormal cyclonic circulation appeared in the SCS, which led to intensified convergence and intensified wet convection. Changes in the environmental fields in the WNP and SCS are the main reasons for the seesaw phenomenon observed in these two types of TCs.
1 Introduction
The South China Sea (SCS), located south of mainland China, lies in the western part of the Pacific Ocean. It is one of the locations where tropical cyclones (TCs) form (Chen, 1990) and is influenced by westward-shifting TCs generated in the western North Pacific (WNP). Approximately 67% of rapid intensification of TCs occurred in the SCS, which is much higher than that in the East China Sea (23%) and Yellow Sea (10%) (Liu and Rong, 1995; Yan, 1996; Lin et al., 2006). TCs in the SCS have caused severe damage to South China and Vietnam owing to their rapid intensification, variable paths, and complex rainstorm patterns (Chen et al., 2004; Zhang et al., 2009; Duan et al., 2014; Wen et al., 2019; Tran-Quang et al., 2020). There are obvious differences in climate characteristics of the SCS and WNP basins (Zhang, 2003). The WNP basin is vast and less influenced by the surrounding land and the upper ocean warm water is deeper than the SCS (Lin et al., 2008), leading to a higher upper ocean heat content (Goni and Trinanes, 2003; Lin et al., 2009). As a powerful large-scale circulation background factor for TCs genesis, the spatial scale and intensity of the monsoon troughs are often stronger in the WNP than in the SCS (Harr and Elsberry, 1995; Mao and Wu, 2010). A large difference exists between TCs over the SCS and the WNP. Approximately 76% of TCs over the WNP develop into typhoons or super typhoons, while TCs over the SCS which annual average number of typhoons or super typhoons accounted for 28.6% of the total number of TCs are much weaker (Yuan et al., 2007; Feng et al., 2013; Hao and Mao, 2015). Therefore, it is important to study the different characteristics of TCs between the SCS and WNP in a changing climate.
Previous studies on TC activity in the SCS and WNP have mainly focused on decadal timescales. Three suppressed TC frequency periods (1951–1960, 1973–1985, and 1995–2018) and two enhanced TC frequency periods (1961–1972 and 1986–1994) were found in the WNP (Yumoto and Matsuura, 2001; Liu and Chan, 2013). However, two inactive periods (1979–1993 and 2003–2010) and two active periods (1965–74 and 1995–2004) were identified in the SCS. These activities in the SCS might be due to changes in the surface sea temperature (SST) gradient between the Indian Ocean and the WNP and the intensity of the East Asian jet stream (Wang et al., 2012; Li and Zhou, 2014). Another study showed that the birthplace of TCs and vertical moisture advection dominated the interdecadal variation in TCs intensity over the SCS (Zheng and Wang, 2022). Previous studies have also found that the TC frequency across oceans appeared to show “seesaw” variability, which means the inverse phase change. Wang et al. (2022) identified a decadal variation in TCs genesis between the WNP and North Atlantic (NA) with a seesaw variability, which is proposed to be related to the contact teleconnection of the subtropical east-west triggered by the Atlantic Decadal Oscillation and causes the opposite changes of the environmental fields in the WNP and NA. A seesaw phenomenon was also observed in TC activities in North America and the Northeast Pacific (Elsner et al., 1999), caused by opposite changes in the large-scale conditions of these basins shaped by the El Nino-Southern Oscillation (ENSO), Atlantic Multidecadal Oscillation (AMO), and Atlantic Meridional Modes (Frank and Young, 2007; Wang and Lee, 2009; Patricola et al., 2017). Wang et al. (2020) proposed that opposite large-scale conditions in the NA and North Pacific are associated with reverse standing wave activity (tropical upper tropospheric trough) in both oceans. However, few studies have focused on the interdecadal comparison of TCs between the SCS and WNP. It is also unknown whether the frequencies of TCs in the WNP and SCS show a seesaw phenomenon.
Many studies have investigated the activities of TCs lifetime maximum intensity (LMI). The annual average LMI latitude of TCs above the tropical storm intensity increased significantly from 1960 to 2016 (Liu and Chan, 2019). They also found that a significant interdecadal variation was observed in strong TCs (category 4–5), that is, TCs LMI latitudes were higher in 1960–1969 and 1991–2011, but lower in 1970–1990 and 2012–2016. Song et al. (2018) studied standard deviation of LMI and found that the occurrence frequency of the strongest and weakest TCs around the world during 1999–2016 was greater than that during 1981–1998. Lu and Tang (2021) used a machine learning method to study the distribution of the LMI, which revealed that the circulation of high LMI is that lower latitude is embedded in the continuous band with high vorticity in the lower troposphere, and the circulation in the upper and lower troposphere is more dense. Recent studies have mainly focused on the characteristics of LMI in global regions or oceans, but few studies have focused on local small continental seas, such as the SCS.
The remainder of the paper is structured as follows: Section 2 presents the data and methods. Section 3 studies the decadal variation of the two types of TCs is studied and discusses the possible factors causing these changes. Finally, Section 4 presents the discussion and conclusions.
2 Data and methods
2.1 Data
Monthly average atmospheric circulation reanalysis data were provided by the US Center for Environmental Prediction (Kalnay et al., 1996), covering the period 1978–2020 with a horizontal resolution of 2.5° latitude × 2.5° longitude and nine layers from 1000 to 200 hPa in the vertical direction, including vertical velocity, potential height, specific humidity, and wind. Because of our TCs research range in the WNP and SCS, we used the International Best Track Archive for Climate Stewardship (IBTrACS) Version 04 data (Knapp et al., 2010), including the TC records from Joint Typhoon Warning Center (JTWC), Shanghai Typhoon Institute of China Meteorological Administration (CMA), and Hong Kong Observatory (HKO), etc. Monthly mean SST data covering 1978–2020 were obtained from the Hadley Center (Rayner et al., 2006), with a horizontal resolution of 1.0° latitude × 1.0° longitude.
2.2 Methods
One of the previous research metrics for TC is LMI, and LMI of TCs has been recommended as a steady indicator to study TCs, because its geographical location is comparatively insensitive to data uncertainties (Kossin et al., 2014, 2016; Moon et al., 2015, Moon et al., 2016; Zhan and Wang 2017; Song et al., 2018; Wang and Wu 2019; Zhao et al., 2022). This study follows the previous definition of LMI, in which TCs.
Reach maximum wind speed in their lifetime (Kossin et al., 2014, 2016; Song et al., 2018; Zhao et al., 2022). To better study the characteristics of TC LMI in the SCS (5°N-25°N, 107°E-121°E), we selected TCs that passed over the SCS and reached the maximum wind speeds in their lifetime.
The first point at which the intensity was ≥25 knots was defined as the TC genesis position. Two types of TCs enter the SCS: one is generated locally and the other is generated from the WNP and moves into the SCS. However, the intensity and genesis frequency of these two types of TCs differ (Chen, 1990; Yuan et al., 2007). To better reveal the decadal variations of these two types TCs, TCs that reach LMI in the SCS were divided into two groups: those that generated and reached LMI in the SCS were “local TCs” and those that generated in the WNP and reached LMI in the SCS were “migratory TCs.” The large-scale circulation fields, thermal and dynamic characteristics (Emanuel and Nolan, 2004) that reveal the causes of TC frequency seesaw, were respectively composited by the two types of TCs. The statistical test method used in this study was student’s t-test.
3 Results
3.1 A seesaw relationship
A total of 303 TCs reached the LMI in the SCS from 1978 to 2020, of which 173 were local TCs (accounting for 57.1% of total TCs reached the LMI in the SCS) and 130 were migratory TCs (accounting for 42.9% of total TCs reached the LMI in the SCS). As with all typhoons, the generation of local and migratory TCs is influenced by Coriolis forces (Gray, 1979), resulting in the location of TC generation being mainly concentrated north of 5°N. The local TCs generation positions were evenly distributed in the interior of the SCS. Note that most of the migratory TCs generated west of 140°E of the WNP (Figure 1). However, because TCs generation positions was not the focus of this study, no further investigation will be conducted. As shown in Figure 1, the prevailing tracks of local TCs prevailing tracks were variable, mainly consisting of northwest and northeast, while the majority of migratory TCs were westward into the SCS. Local TCs reached LMI mainly on the western and northern of the SCS while the locations where migratory TCs reached LMI were more evenly distributed. The reason why migratory TCs reached LMI were more evenly distributed was not the focus of this study.
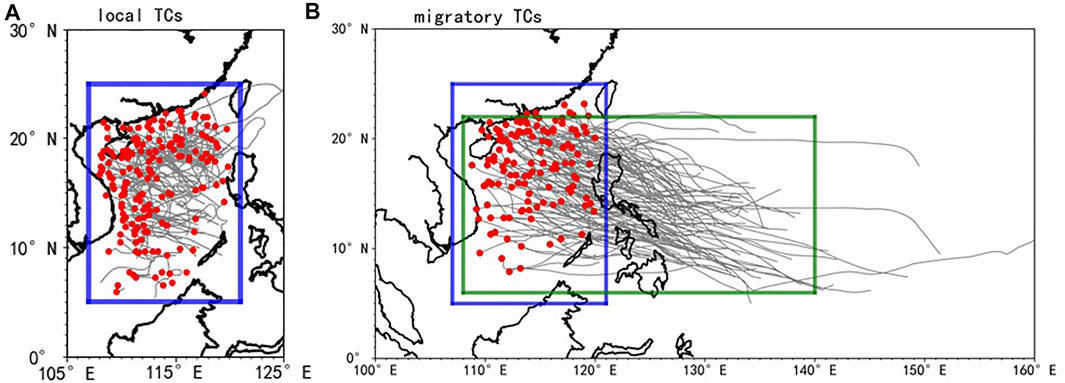
FIGURE 1. TCs Locations that reached their LMI (red dots) and the tracks from TCs genesis positions to their LMI location (gray lines) during 1978–2020 for (A) local TCs that generated and reached LMI in the SCS and (B) migratory TCs that generated in the WNP and reached LMI in the SCS. The blue boxes indicate the SCS region. Green box indicates the SCS and the WNP region. TCs data is from best-track dataset of JTWC during 1978–2020.
From 1978 to 2020, the average frequency of local TCs (4.02 per year) was greater than that of migratory TCs (3.02 per year). The interdecadal variation of these two TC groups showed a seesaw phenomenon around 1997 (Figure 2). That is, the average frequency of local TCs increased significantly from 3.21 from 1978 to 1996 to 4.67 from 1997 to 2020 (p<0.05). In contrast, the average frequency of migratory TCs was 3.47 from 1978 to 1996 and decreased to 2.67 (p<0.1) from 1997 to 2020. Several datasets were used for verification to ensure the reliability of these observed seesaw phenomena. Standardized TC frequencies of the CMA, JTWC, and HKO that reached the LMI in the SCS were compared (Figure 3). The interannual variations and linear trends of different institutions were the similar from 1978 to 2020. To facilitate the analysis, JTWC data were adopted for further analysis.
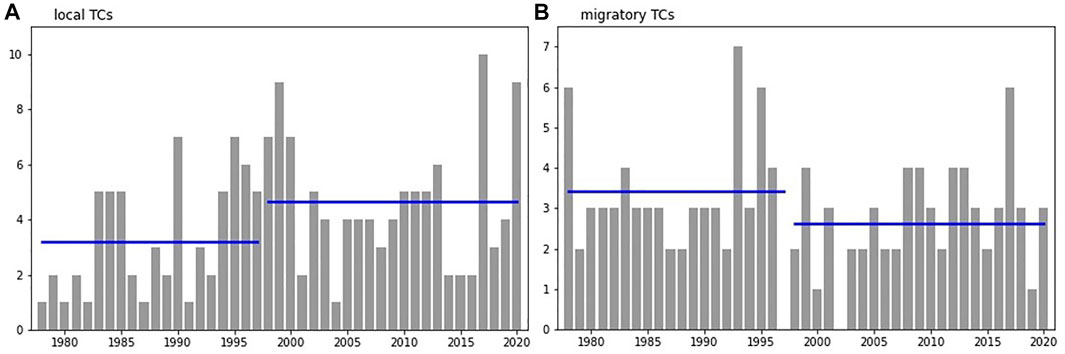
FIGURE 2. Annual frequency of (A) local TCs and (B) migratory TCs reaching LMI in the SCS region. The blue lines denote 1978–1996 and 1997–2020 average of the TCs frequency. TCs data is from best-track dataset of JTWC during 1978–2020.
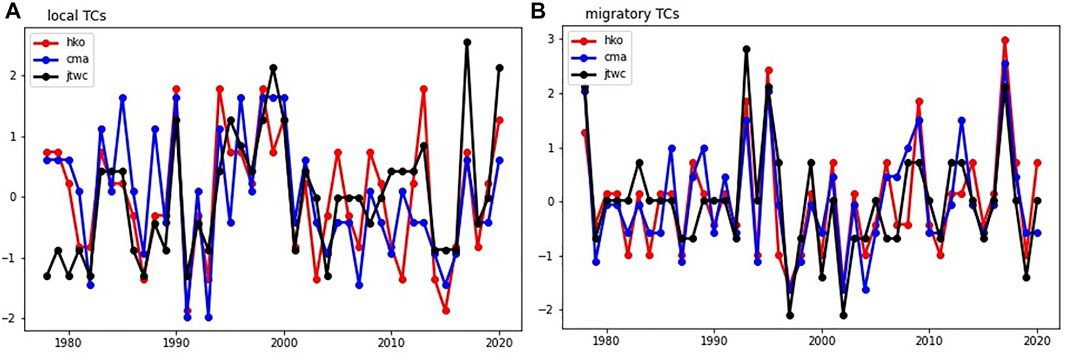
FIGURE 3. Annual standardized frequency of (A) local TCs and (B) migratory TCs that reaching LMI using different best-track dataset from the HKO, CMA, JTWC during 1978–2020.
Wang (2013) showed the seasonal variation characteristics of TCs genesis in the SCS using the genesis potential index (GPI) (Emanuel and Nolan, 2004), finding that the number of TCs in the SCS increases after May and peaks in August and September. Wang et al. (2007) found that, from 1948 to 2003, 157 TCs generated north of 12°N from May–September (southwest monsoon period), while 65 TCs generated south of 18°N from October–December (northeast monsoon period). According to our statistics, 303 TCs reached LMI in the SCS from 1978 to 2020, with 265 reaching LMI from June–November, accounting for 87.5% of the total. In addition, TC genesis was mainly concentrated from June–November, which is consistent with the conclusions of previous studies that TCs generally form in boreal summer and autumn in the SCS (Zhang et al., 2009; Wang, 2013).
Since TCs that reached the LMI in the SCS generally originated from June–November, the TC genesis circulation characteristics from June–November can represent most TCs. Therefore, to discuss the possible reasons for the seesaw relationship between these two groups of TCs frequencies around 1997, the changes in atmospheric circulation and the ocean environment in the SCS and WNP from June–November were analyzed synthetically.
3.2 Large-scale circulation variations responsible for TC frequency changes
TC activity in the WNP is closely related to the location of the monsoon trough (Wu et al., 2012). When the monsoon trough retreated westward, fewer TCs were formed in the southeastern part of the WNP; that is, TCs were more likely to occur in the northwest. To analyze the changes in the monsoon trough in June–November from 1978 to 1996 and 1997–2020, the average streamline distributions at 850 hPa during these two periods are shown in Figure 4. From 1978 to 1996, the SCS was dominated by cyclonic circulation and the WNP was occupied by a monsoon trough extending from the SCS to the east of 140°E with a northwest-southeast trend (Figure 4A). At the same time, the positions where local TCs and migratory TCs reached LMI were mainly located in the west of the SCS. At the same time, these locations were relatively concentrated in the north of 10°N and the locations of migratory TCs were generally westward into the SCS. From 1997 to 2020, the cyclonic circulation over the SCS was strengthened and the monsoon trough in the WNP was weakened and retreated westward to the west of 140°E (Figure 4B). Under the evolution of these large-scale circulation variations, more local TCs appeared in the SCS and the LMI locations were more scattered. Note also that the genesis and LMI locations of migratory TCs were more westward with a more dispersed track.
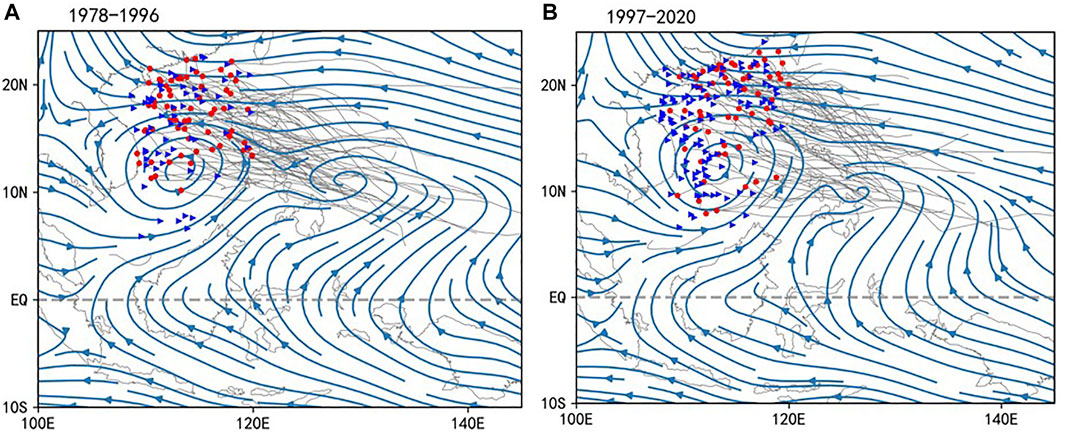
FIGURE 4. The streamline at 850-hPa and location of the LMI of local TCs (red dots) and migratory TCs (blue dots) for June–November during (A) 1978–1996 and (B) 1997–2020. The gray lines are TCs track from the genesis position to their LMI location.
From 1978 to 1996, the monsoon trough lied east-south over the WNP, local TCs reached LMI in the west of the SCS, and migratory TCs reached LMI east. Migratory TCs had a basically northwest path and were more concentrated north of 10°N (Figure 4A). From 1997 to 2020, the monsoon trough in the SCS was strengthened and the monsoon trough in the WNP was weakened. In other words, the monsoon trough retracted, which led to the westward TCs generation point, increasing the TCs generated in the SCS and decreasing the TCs generated in the WNP (Figure 4B). The SCS was favorable for the formation and strengthening of TCs while the WNP was unfavorable for the early development of TCs. The paths of migratory TCs were also northwestern but were relatively scattered and located north of 7°N. There was little difference between the two types of TCs in terms of the location where they reached LMI.
The western Pacific subtropical high (WPSH) is one of the main factors affecting TC genesis position and path (Wang et al., 2017). Since the easterly wave located between the WPSH and equator is one of the main flow patterns affecting TC genesis, the intensity and north-south position of the WPSH may influence TCs genesis. The average geopotential heights at 500 hPa from June–November from 1978 to 1996 and 1997–2020 are shown in Figures 5A,B, respectively. From 1978 to 1996, the WPSH was located at approximately 20°N-25°N and 145°N-165°N with a rather small range, while it expanded westward and southward from 1997 to 2020. This may be one of the reasons that TCs genesis was more westward from 1997 to 2020. As a result, more TCs were likely to originate in the SCS and less in the WNP from 1997 to 2020 (Figure 4).
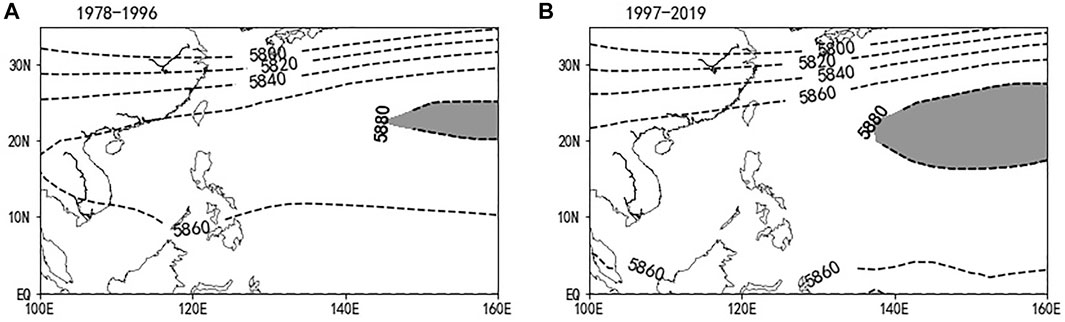
FIGURE 5. The 500-hPa geopotential height (unit: m) averaged for June–November during (A) 1978–1996 and (B) 1997–2020. The gray areas indicate the Western Pacific subtropical high region.
Chen and Huang (2006) studied the influence of the western Pacific warm pool thermal state on TCs over the WNP and indicated that there were fewer TCs in WNP and more TCs in SCS in warm years. Figures 6A,B show the distributions of the average SST from June–November from 1978 to 1996 and 1997–2020, respectively. Region of SST exceeding 28.5°C are conducive to TC genesis and development. From 1978 to 1996, the 28.5°C line was basically to the south of 10°N in the SCS and 18°N in the WNP (Figure 6A). From 1997 to 2020, the SST increased significantly, with the Region of 28.5°C SST expanding to 15°N in the SCS and the range of 29.5°C significantly from 5°N expanding to 10°N in the WNP (Figure 6B). As a result, it is expected that fewer TCs would be generated in the southeast quadrant of the WNP from 1997 to 2020, which is consistent with the results of Chen and Huang (2006).
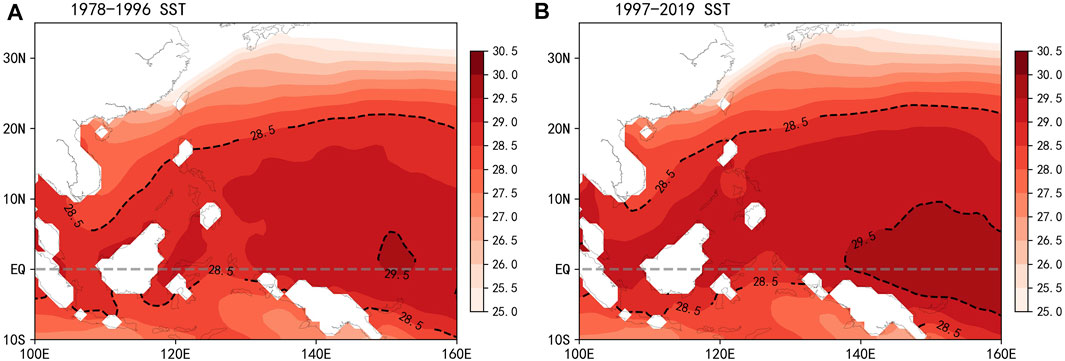
FIGURE 6. The sea surface temperature (shading, units: °C) and the 28.5°C and 29.5°C isothermal lines (black dashed lines) of the warm pool SST averaged for the June–November during (A) 1978–1996 and (B) 1997–2020.
The Walker circulation, a vast zonal overturning atmospheric circulation across the tropical Pacific Ocean, is named after Sir Gilbert Walker and is one of the most important components of the global climate system. The rising branch of the Walker circulation over the WNP affects TC genesis and intensification (Chan, 1985). Because the TC genesis positions and moving tracks were mainly concentrated between 10 and 25°N, to observe the changes in Walker circulation in these two periods, the zonal mean vertical velocity difference in the 10°N-25°N region between the two periods was determined (Figure 7). The walker circulation was found to be weaker from 1997 to 2020 and the Indian Ocean and WNP basins showed abnormal sinking at 100°E and between 150°E and 180°E, respectively. Meanwhile, the rising branch of the Walker circulation over the SCS and WNP was enhanced (110°E-150°E) because the two abnormal sinking branches forced the production of abnormal updrafts, which were conducive to TCs genesis over the SCS and western WNP. As a result, the genesis position of migratory TCs was mainly located to the west of 140°E, and few were found to the east of 140°E (Figure 4).
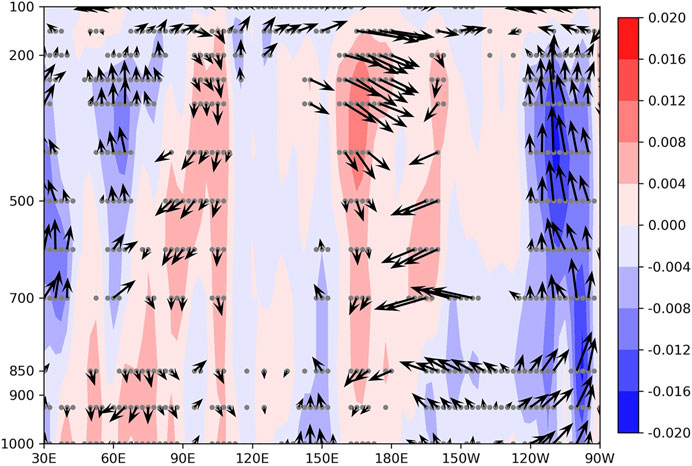
FIGURE 7. Composite anomalies of mean vertical velocities (shading, units: Pascal s−1) profile between 10°N and 25°N for the June–November over the Indo-Pacific Ocean. Arrows indicate zonal velocities (units: m s−1) and vertical velocities (units: 100 Pascal s−1). Indian Ocean region [60°E-100°E], Northwest Pacific Ocean region [121°E-160°E], South China Sea region [107°E-121°E]. The stippled areas indicate the values are statistically significant at the 90% confidence level.
3.3 Dynamic features
Previous studies have shown that, in contrast to TCs generation in the Atlantic Ocean, dynamic conditions play a much larger role than thermal conditions in influencing TC generation in the WNP (Fu et al., 2012). Figure 8 shows the difference between the wind field and contour field from 1978 to 1996 and 1997–2020. In the lower 850 hPa, the SCS was a low-pressure anomaly and the WNP was a high-pressure anomaly. There was abnormal easterly convergence at the equator and a southerly wind anomaly appeared near 120°E. From 1997 to 2020, the SST gradient of the equatorial region and TC-generating region of the Philippines decreased significantly, which may be the main reason for the south wind anomaly. There was a southwest wind anomaly and a cyclonic circulation anomaly in the lower troposphere in the SCS, which were favorable for convergence. The anticyclonic anomaly over the WNP was not conducive to the formation and development of TCs. At 200 hPa, there was abnormally high pressure over the SCS and a southwest anomaly of the equatorial flow over the SCS. At the same time, there was a convergence of the westerly winds over the WNP, a low-pressure anomaly over the central Pacific, and a cyclonic circulation anomaly. In terms of the wind field, the low-level cyclonic circulation anomaly in the SCS was favorable for the generation of TCs. The lower troposphere layer in the WNP had abnormal anticyclonic circulation, and the convergence of the high troposphere layer was not conducive to the formation of TCs, indicating that the formation of TCs was favorable to the west. The variation in the wind field during the two periods may explain the increasing frequency of local TCs and decreasing frequency of migratory TCs.
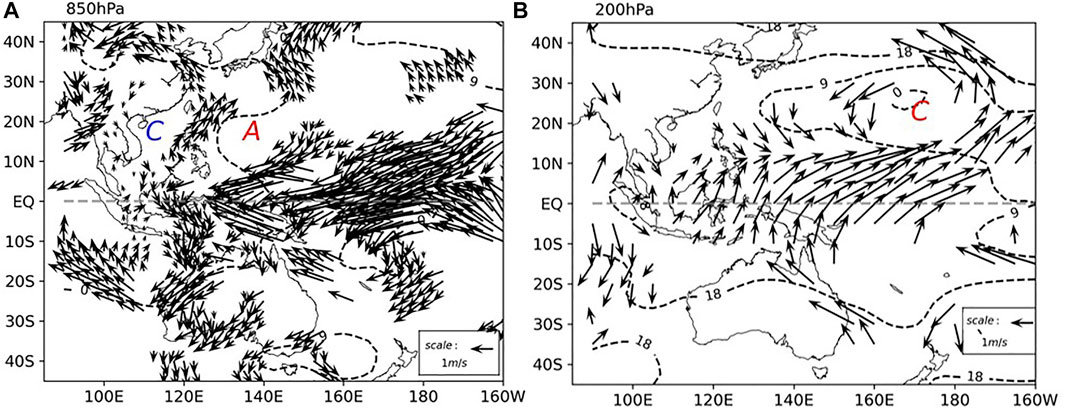
FIGURE 8. Composite anomalies of wind (vectors, units: m s−1) and geopotential height (black dotted line, unit: m) at (A) 850-hPa and (B) 200-hPa. The arrow areas indicate the values are statistically significant at the 90% confidence level. The letter A and C indicates for anticyclonic and cyclonic circulation, respectively.
From the perspective of dynamics, strong vertical wind shear is usually not conducive to the enhancement of TCs. Wei et al. (2018) found that westerly wind shear has a more significant impact on TCs than easterly wind shear. Figure 9A shows the difference in vertical wind shear between the two periods and a positive anomaly of significant vertical wind shear and westerly zonal wind shear in the generating area of TCs in the WNP, which was not conducive to the generation and development of TCs. However, the vertical wind shear of SCS region remains unchanged compared with the SCS, the WNP was more unfavorable to the generation and development of TCs, which led to a westward shift in the generation point of TCs, leading to an increase in the frequency of TCs generated in the SCS, while the frequency of TCs generated in the WNP decreased.
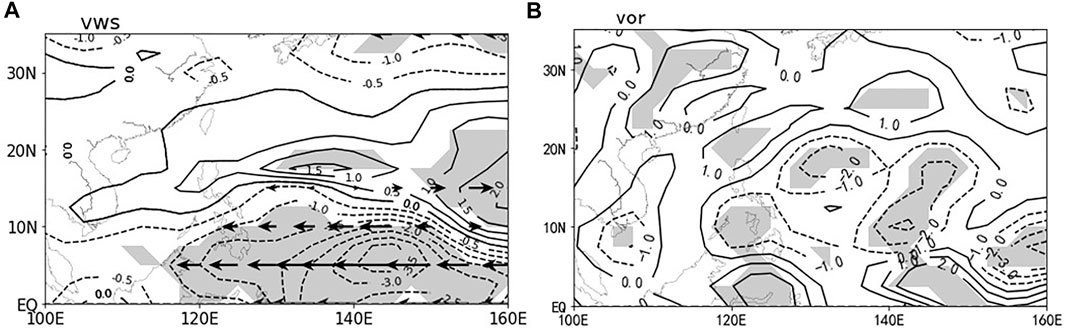
FIGURE 9. Composite anomalies of (A) vertical wind shear (vector, 200-hPa minus 850-hPa, unit: m s−1) and (B) relative vorticity (contour, unit: 106 m s−1) at 850-hPa. The vectors and shaded areas only indicate the values are statistically significant at the 90% confidence level.
Previous studies have shown that environmental vorticity distribution can affect the intensification of TCs (Rappin et al., 2011; Wu et al., 2020). The relative vorticity difference between the two periods was plotted to analyze the relative vorticity distribution of the environmental field (Figure 9B). Figure 9B shows insignificant positive vorticity anomalies in the SCS, while the relative vorticity in the WNP decreased and was partially significant; that is, the SCS was conducive to the generation and strengthening of TCs, whereas the WNP was unfavorable to the early development of TCs.
3.4 Thermodynamic features
From the perspective of thermodynamics, changes in SST, heat content of air-sea flux, and exchange coefficients significantly impact the intensification rate of TCs (Shen and Ginis, 2003; Gao and Chiu, 2010). According to Figure 6, SST increased from 1997 to 2020, increasing by 0.29°C in the WNP region, 0.32°C in the Indian Ocean region, and 0.41°C in the SCS region.
Ge et al. (2013) found that decreases in environmental humidity may inhibit the enhancement of TCs. From 1997 to 2020, the specific humidity increased in the SCS and WNP. The specific humidity increased more in the WNP (0.441) than in the SCS (0.316), indicating that specific humidity is not an important condition affecting TC generation.
Water vapor flux is a physical quantity that reflects water vapor transport and its value and direction can represent the size and source of water vapor transport in a region (Li et al., 2015; Li et al., 2018). Figure 10 shows the average divergence and difference in water vapor flux between 1000 and 500 hPa from June-November from 1978 to 1996 and 1997–2020. The TC generation area north of 10°N in the SCS region shows mid-low level moisture convergence and some areas pass the significance test, while the area east of 130°E in the WNP has mid-low level moisture divergence. The water vapor flux enters the SCS region from the WNP.
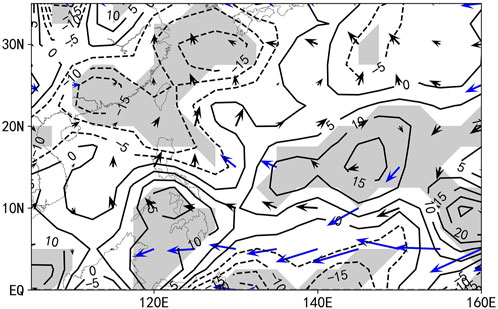
FIGURE 10. Composite anomalies of water vapor flux divergence (contour, unit: 10–5 kg m−2 s−1) and water vapor flux (vectors, unit: 102 kg m−1 s−1). The shaded areas and blue vectors indicate the values are statistically significant at the 90% confidence level.
3.5 Complex connections between various processes
Figure 11 combines the changes in large-scale circulation fields and dynamic and thermal conditions from 1978 to 1996 and 1997–2020. From 1997 to 2020, owing to the SST gradient between the equatorial regions and TCs, the area reduced and the near 120°E north wind was weakened. At the same time, the equator east wind was strengthened, warm water accumulation and SST of the WNP and SCS increased, and the western Pacific warm pool expanded. The monsoon trough trended westward and enhanced the monsoon trough in the SCS area, whereas the WNP monsoon trough was abated. The WPSH extended westward to the south and the overall area expanded. Because the SCS is an inland sea near the mainland, its SST rose more than those of the northwestern Pacific and Indian oceans. Through local air-sea interaction, the SCS forms low-level anomalous cyclonic circulation and low-level convergence. At the same time, the WNP region and Indian Ocean region Walker circulations were anomalous, forcing local updrafts in the maritime continent and SCS area and the SCS vorticity increased. The convergence of water vapor in the middle and lower layers, namely the increase in wet convection, formed an environment conducive to the generation of TCs. Because the equatorial east wind enhanced and the north wind weakened near 120°E, in the WNP region, anomalous anticyclonic circulation formed, local sinking airflow appeared, vertical wind shear increased, and atmospheric stability increased. The SST of the WNP increased and the specific humidity increased, but lower water vapor divergence and dynamic and thermal conditions were formed against the TCs generated by the environment.
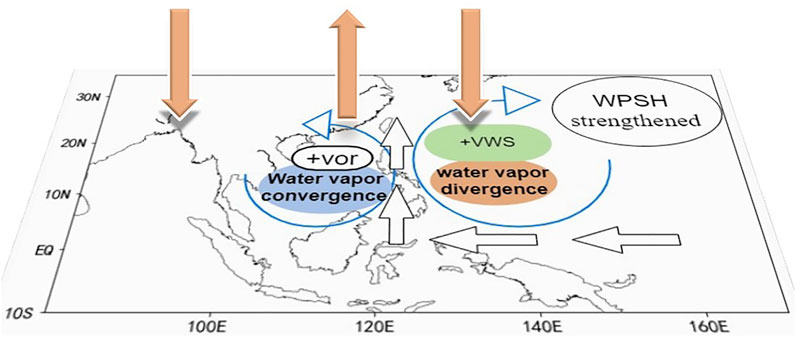
FIGURE 11. Physical mechanism diagram of interannual variation of TC frequency reaching LMI in the SCS. White arrows indicate wind, blue arrows circles indicate cyclonic circulation (or anticyclonic circulation), green area indicate positive vertical wind shear anomalies, and orange arrows indicate zonal circulation anomalies from 10°N to 25°N. The blue and orange areas indicate water vapor convergence and divergence areas. The white area indicates positive relative vorticity.
4 Conclusion and discussion
4.1 Conclusion
Previous studies on LMI were limited to the latitude and intensity of TCs reaching LMI in large regional oceans (Wang and Lee, 2009; Patricola et al., 2017; Wang et al., 2020). This study divided the frequency of TCs reaching the LMI in the SCS into local and migratory TCs according to the source of generation. There was a seesaw phenomenon in the frequency variation of the two types of TCs before and after 1997. That is, local TCs showed an increase in mutations after 1997, while migratory TCs showed a decrease.
From 1997 to 2020, the monsoon trough retreated westward, the warm pool strengthened, and the WPSH strengthened westward. Owing to the decrease in the SST gradient at the equator and mid-latitudes, the north wind weakened in the region near 120°E, while the east wind strengthened in the equatorial region, which led to an abnormal anticyclone in the WNP region. In the WNP, the abnormal anticyclone enhanced divergence, which led to the abnormal subsidence of zonal circulation, increased vertical wind shear, increased atmospheric stability, and water vapor divergence. However, the SCS is an internal sea adjacent to the mainland and experienced a more significant increase in SST than the WNP. Under the action of local sea and air, abnormal cyclonic circulation and convergence were enhanced, zonal circulation showed a weak abnormal rise, vorticity increased, and wet convection was enhanced. The change in the environmental field in the WNP and SCS was the main reason for the seesaw phenomenon in the two types of TCs.
4.2 Discussion
Different from previous studies on the seesaw of TCs in the two oceans, for example, Wang et al. (2022) study on the seesaw of TCs between the Atlantic Ocean and the WNP, which found that it was related to the Atlantic Decadal Oscillation while the seesaw of TCs activities in North America and the Northeast Pacific Ocean were caused by the ENSO, AMO, and Atlantic Meridional Modes (Frank and Young, 2007; Wang and Lee, 2009; Patricola et al., 2017), this paper only analyzed the reasons for the seesaw phenomenon in the variation trend of the frequency of the two types of TC around 1997 considering the influencing system and dynamic and water vapor conditions. Such an air-sea interaction may shed light on the projected suppressed TC genesis in the WNP but enhanced TC genesis in the SCS in global warming. In addition, whether the intensity of the two types of TC also showed a seesaw phenomenon from 1978 to 2020 and the reasons for this need to be further discussed.
Data availability statement
Publicly available datasets were analyzed in this study. This data can be found here: https://www.ncei.noaa.gov/products/international-best-track-archive?name=ib-v4-access; https://psl.noaa.gov/data/gridded/data.ncep.reanalysis.pressure.html; https://www.metoffice.gov.uk/hadobs/hadsst4/data/download.html.
Author contributions
PH was responsible for the conception, writing and drawing of the article. JX is responsible for the discussion, guidance, modification and project support of the article. ML is responsible for the discussion, guidance and revision of the article.
Funding
This study was jointly supported by State Key Program of National Natural Science of China (Grant No. 42130605) and Program for Scientific Research Start-up Funds of Guangdong Ocean University (Grant No. 060302032108).
Conflict of interest
The authors declare that the research was conducted in the absence of any commercial or financial relationships that could be construed as a potential conflict of interest.
Publisher’s note
All claims expressed in this article are solely those of the authors and do not necessarily represent those of their affiliated organizations, or those of the publisher, the editors and the reviewers. Any product that may be evaluated in this article, or claim that may be made by its manufacturer, is not guaranteed or endorsed by the publisher.
References
Chan, J.-C. (1985). Tropical cyclone activity in the northwest Pacific in relation to the El Niño/Southern Oscillation phenomenon. Mon. Weather Rev. 113 (4), 599–606. doi:10.1175/1520-0493(1985)113<0599:TCAITN>2.0.CO;2
Chen, G.-H., and Huang, R.-H. (2006). The effect of warm pool thermal states on tropical cyclone in West Northwest Pacific. J. Trop. Meteor 22 (6), 527–532. doi:10.1016/S1872-2032(06)60022-X
Chen, L. S., Luo, Z. X., and Li, Y. (2004). Research advances on tropical cyclone landfall process. J. Acta Meteorol. Sin. 62 (5), 541–549. doi:10.11676/qxxb2004.055
Chen, S.-R. (1990). Source regions of tropical storms over northwest Pacific Ocean. J. Meteorol. Mon. (in Chin. 16 (2), 23–26. doi:10.7519/j.issn.1000-0526.1990.2.004
Duan, Y.-H., Chen, L.-S., Liang, J.-Y., Wang, Y., Wu, L.-G., Cui, X.-P., et al. (2014). Research progress in the unusual variations of typhoons before and after landfalling. J. Acta Meteorol. Sin. 72 (5), 969–986. doi:10.11676/qxxb2014.085
Elsner, J. B., Elsner, G. J. B., and Kara, A. B. (1999). Hurricanes of the north atlantic: Climate and society. M. Oxford University Press on Demand.
Emanuel, K., and Nolan, D. S. (2004). Tropical cyclone activity and the global climate system. C. In 26th Conference on Hurricanes and Tropical Meteorolgy.
Feng, T., Huang, R.-H., andChen, G.-H., Wu, L., Huang, P., and Wang, L. (2013). Progress in recent climatological research on tropical cyclone activity over the western North Pacific. J. Chin. J. Atmos. Sci. 37 (2), 364–382. doi:10.3878/j.issn.1006-9895.2012.12307
Frank, W.-M., and Young, G.-S. (2007). The interannual variability of tropical cyclones. Mon. Weather Rev. 135, 3587–3598. doi:10.1175/mwr3435.1
Fu, B., Peng, M.-S., Li, T., and Stevens, D. E. (2012). Developing versus nondeveloping disturbances for tropical cyclone formation. Part II: Western North Pacific. Mon. Weather Rev. 140 (4), 1067–1080. doi:10.1175/2011MWR3618.1
Gao, S., and Chiu, L. S. (2010). Surface latent heat flux and rainfall associated with rapidly intensifying tropical cyclones over the western North Pacific. Int. J. Remote Sens. 31 (17-18), 4699–4710. doi:10.1080/01431161.2010.485149
Ge, X., Li, T., and Peng, M. (2013). Effects of vertical shears and midlevel dry air on tropical cyclone developments. J. Atmos. Sci. 70 (12), 3859–3875. doi:10.1175/JAS-D-13-066.1
Goni, G. J., and Trinanes, J. A. (2003). Ocean thermal structure monitoring could aid in the intensity forecast of tropical cyclones. Eos Trans. AGU. 84 (51), 573–578. doi:10.1029/2003EO510001
Gray, W. M. (1979). Hurricanes: Their formation, structure and likely role in the tropical circulation. J. Meteorology over Trop. oceans 155, 218.
Hao, S., and Mao, J.-Y. (2015). Differences of the seasonal variations of tropical cyclone activities over the South China Sea and the western North Pacific and the possible causes. J. Clim. Environ. Res. (in Chinese) 20 (4), 380–392. doi:10.3878/j.issn.1006—9585.2014.14063
Harr, P. A., and Elsberry, R. L. (1995). Large-scale circulation variability over the tropical western North Pacific. Part I: Spatial patterns and tropical cyclone characteristics. Mon. Weather Rev. 123 (5), 1225–1246. doi:10.1175/1520-0493(1995)123<1225:LSCVOT>2.0.CO;2
Kalnay, E., Kanamitsu, M., Kistler, R., Collins, W., Deaven, D., Gandin, L., et al. (1996). The NCEP/NCAR 40-year reanalysis project. Bull. Am. Meteorol. Soc. 77 (3), 437–471. doi:10.1175/1520-0477(1996)077<0437:TNYRP>2.0.CO;2
Knapp, K. R., Kruk, M. C., Levinson, D. H., Diamond, H. J., and Neumann, C. J. (2010). The international best track archive for climate stewardship (IBTrACS) unifying tropical cyclone data. Bull. Am. Meteorol. Soc. 91 (3), 363–376. doi:10.1175/2009BAMS2755.1
Li, B.-S., Fan, L.-L., Zou, T., and Song, Z.-Q. (2015). Analysis on water vapor transport of the "5.11" heavy rainfall process in shenzhen. J. Journal of Guangdong Ocean University 35 (3), 100–108. doi:10.3969/j.issn.1673-9159.2015.03.015
Li, Q.-H., Lu, H.-C., Zhong, W., Wang, W.-C., Guo, X.-L., and Yuan, M. (2018). Meso-scale transport characteristics and budget diagnoses of water vapor in binary typhoons. Acta Phys. Sin. 67 (3), 039201–039214. doi:10.7498/aps.67.20170455
Li, Richard.- C.-Y., and Zhou, W. (2014). Interdecadal change in South China Sea tropical cyclone frequency in association with zonal sea surface temperature gradient. J. Clim. 27 (14), 5468–5480. doi:10.1175/JCLI-D-13-00744.1
Lin, I.-I., Pun, I.-F., and Wu, C.-C. (2009). Upper-ocean thermal structure and the western North Pacific category 5 typhoons. Part II: Dependence on translation speed. Mon. Weather Rev. 137 (11), 3744–3757. doi:10.1175/2009MWR2713.1
Lin, I.-I., Wu, C.-C., Pun, I.-F., and Ko, D.-S. (2008). Upper-ocean thermal structure and the western North Pacific category 5 typhoons. Part I: Ocean features and the category 5 typhoons’ intensification. Mon. Weather Rev. 136 (9), 3288–3306. doi:10.1175/2008MWR2277.1
Lin, L.-X., Liang, Q.-Q., and Huang, Z. (2006). Analysis of circulation pattern of rapidly intensified offshore tropical cyclones of South China. J. Meteorological. doi:10.7519/j.issn.1000-0526.2006.2.003
Liu, C.-X., and Rong, G.-X. (1995). The climatic analysis of the relationship between the explosive development of typhoon and its environment flow field. J. Journal of Tropical Meteorology. CNKI:SUN:RDQX.0.1995-01-006.
Liu, K.-S., and Chan, J.-C.-L. (2013). Inactive period of Western North Pacific tropical cyclone activity in 1998-2011. J. Clim. 26, 2614–2630. doi:10.1175/JCLI-D-12-00053.1
Liu, K.-S., and Chan, J.-C. -L. (2019). Inter‐decadal variability of the location of maximum intensity of category 4–5 typhoons and its implication on landfall intensity in East Asia. Int. J. Climatol. 39 (4), 1839–1852. doi:10.1002/joc.5919
Lu, R., and Tang, X. (2021). Relationship between early-stage features and lifetime maximum intensity of tropical cyclones over the western North Pacific. Atmosphere (Basel). 12 (7), 815. doi:10.3390/atmos12070815
Mao, J.-Y., and Wu, G.-X. (2010). Intraseasonal modulation of tropical cyclogenesis in the western North pacific: A case study. Theor. Appl. Climatol. 100 (3), 397–411. doi:10.1007/s00704-009-0195-9
Moon, I. J., Kim, S. H., Klotzbach, P., and Chan, J.-C.-L. (2016). Reply to Comment on ‘Roles of interbasin frequency changes in the poleward shifts of maximum intensity location of tropical cyclones. Environ. Res. Lett. 11 (6), 068002. doi:10.1088/1748-9326/11/6/068002
Moon, I. J., Kim, S. H., Klotzbach, P., and Chan, J.-C. (2015). Roles of interbasin frequency changes in the poleward shifts of the maximum intensity location of tropical cyclones. Environ. Res. Lett. 10 (10), 104004. doi:10.1088/1748-9326/10/10/104004
Patricola, C. M., Saravanan, R., and Chang, P. (2017). A teleconnection between Atlantic sea surface temperature and eastern and central North Pacific tropical cyclones. Geophys. Res. Lett. 44 (2), 1167–1174. doi:10.1002/2016GL071965
Rappin, E.-D., Morgan, M.-C., and Tripoli, G.-J. (2011). The impact of outflow environment on tropical cyclone intensification and structure. J. Atmos. Sci. 68 (2), 177–194. doi:10.1175/2009JAS2970.1
Rayner, N. A., Brohan, P., Parker, D. E., Folland, C. K., Kennedy, J. J., Vanicek, M., et al. (2006). Improved analyses of changes and uncertainties in sea surface temperature measured in situ since the mid-nineteenth century: The HadSST2 dataset. J. Clim. 19 (3), 446–469. doi:10.1175/JCLI3637.1
Shen, W., and Ginis, I. (2003). Effects of surface heat flux‐induced sea surface temperature changes on tropical cyclone intensity. Geophys. Res. Lett. 30 (18). doi:10.1029/2003GL017878
Song, J., Klotzbach, P. J., Tang, J., and Wang, Y. (2018). The increasing variability of tropical cyclone lifetime maximum intensity. Sci. Rep. 8 (1), 16641–16647. doi:10.1038/s41598-018-35131-x
Tran-Quang, D., Pham-Thanh, H., Vu, T.-A., Kieu, C., and Tan, P.-V. (2020). Climatic shift of the tropical cyclone activity affecting Vietnam’s coastal region. J. Appl. Meteorol. Climatol. 59 (10), 1755–1768. doi:10.1175/JAMC-D-20-0021.1
Wang, C., and Lee, S. K. (2009). Co‐variability of tropical cyclones in the North Atlantic and the eastern North Pacific. Geophys. Res. Lett. 36 (24), L24702. doi:10.1029/2009GL041469
Wang, C., Wang, B., Wu, L., and Luo, J.- J. (2022). A seesaw variability in tropical cyclone genesis between the western North Pacific and the North Atlantic shaped by Atlantic Multidecadal variability. J. Clim. 35 (8), 2479–2489. doi:10.1175/JCLI-D-21-0529.1
Wang, G., Su, J., Ding, Y., and Chen, D. (2007). Tropical cyclone genesis over the south China sea. J. Mar. Syst. 68 (3-4), 318–326. doi:10.1016/j.jmarsys.2006.12.002
Wang, L. (2013). Climatology of tropical cyclone genesis over the South China Sea. C. The 17th Pacific Asian marginal Sea (PAMS) Meeting.
Wang, R., and Wu, L. (2019). Influence of track changes on the poleward shift of LMI location of western North Pacific tropical cyclones. J. Clim. 32 (23), 8437–8445. doi:10.1175/JCLI-D-18-0855.1
Wang, X., Zhou, W., Li, C.-Y., and Wang, D.-X. (2012). Effects of the East Asian summer monsoon on tropical cyclone genesis over the South China Sea on an interdecadal time scale. Adv. Atmos. Sci. 29 (2), 249–262. doi:10.1007/s00376-011-1080-x
Wang, Y.-X., Sun, Y., Liao, Q.-F., Zhong, Z., Hu, Y.-J., and Liu, K.-F. (2017). Impact of initial storm intensity and size on the simulation of tropical cyclone track and western Pacific subtropical high extent. J. Meteorol. Res. 31 (5), 946–954. doi:10.1007/s13351-017-7024-3
Wang, Z., Zhang, G., Dunkerton, T. J., and Jin, F.-F. (2020). Summertime stationary waves integrate tropical and extratropical impacts on tropical cyclone activity. Proc. Natl. Acad. Sci. U. S. A. 117 (37), 22720–22726. doi:10.1073/pnas.2010547117
Wei, N., Zhang, X.- H., Chen, L.- S., and Hu, H. (2018). Comparison of the effect of easterly and westerly vertical wind shear on tropical cyclone intensity change over the western North Pacific. Environ. Res. Lett. 13 (3), 034020. doi:10.1088/1748-9326/aaa496
Wen, G.-H., Huang, G., Huang, H.-J., Liu, C.-X., and Bi, X.-Y. (2019). Observed rainfall asymmetry of tropical cyclone in the process of making landfall in Guangdong, south China. Int. J. Climatol. 39 (7), 3379–3395. doi:10.1002/joc.6027
Wu, L., Wen, Z., Huang, R., and Wu, R. (2012). Possible linkage between the monsoon trough variability and the tropical cyclone activity over the western North Pacific. Mon. Weather Rev. 140 (1), 140–150. doi:10.1175/MWR-D-11-00078.1
Wu, Y., Chen, S., Li, W., Fang, R., and Liu, H. (2020). Relative vorticity is the major environmental factor controlling tropical cyclone intensification over the western North Pacific. Atmos. Res. 237, 104874. doi:10.1016/j.atmosres.2020.104874
Yan, J.-Y. (1996). Climatological characteristics of rapidly intensifying tropical cyclones over the offshore of China. J. Quarterly Journal of Applied Meteorology. CNKI:SUN:YYQX.0.1996-01-003.
Yuan, J.-N., Wang, D.-X., Liu, C.-X., Huang, J., and Huang, H.-J. (2007). The characteristic differences of tropical cyclones forming over the western North Pacific and the South China Sea. J. Acta Oceanologica Sinica (4), 29–43.
Yumoto, M., and Matsuura, T. (2001). Interdecadalvariability of tropical cyclone activity in the western North Pacific. Journal of the Meteorological Society of Japan. 79, 23–35. doi:10.2151/jmsj.79.23
Zhan, R., and Wang, Y. (2017). Weak tropical cyclones dominate the poleward migration of the annual mean location of lifetime maximum intensity of northwest Pacific tropical cyclones since 1980. J. Climate 30, 6873–6882. doi:10.1175/JCLI-D-17-0019.1
Zhang, Q., Wu, L.-G., and Liu, Q.-F. (2009). Tropical cyclone damages in China 1983–2006. Bull. Am. Meteorol. Soc. 90 (4), 489–496. doi:10.1175/2008BAMS2631.1
Zhang, Z. (2003). Study of south China sea typhoons between 1999 and 2002. Hong Kong: University of Science and Technology.
Zhao, H.-K., Zhao, K., Klotzbach, P. J., Wu, L.-G., and Wang, C.-Z. (2022). Interannual and interdecadal drivers of meridional migration of western North Pacific tropical cyclone lifetime maximum intensity location. J. Clim. 35 (9), 2709–2722. doi:10.1175/JCLI-D-21-0797.1
Keywords: tropical cyclones, lifetime maximum intensity, interdecadal variation, seesaw, South China Sea
Citation: Huang P, Xu J and Liang M (2022) Decadal variation in the frequency of tropical cyclones originating in the South China Sea and migrating from the western North Pacific. Front. Earth Sci. 10:980220. doi: 10.3389/feart.2022.980220
Received: 28 June 2022; Accepted: 05 August 2022;
Published: 30 August 2022.
Edited by:
Stephen Outten, Nansen Environmental and Remote Sensing Center (NERSC), NorwayReviewed by:
Qingyuan Liu, Chinese Academy of Meteorological Sciences, ChinaNannan Qin, Fudan University, China
Zhiqiang Lin, Chengdu University of Information Technology, China
Copyright © 2022 Huang, Xu and Liang. This is an open-access article distributed under the terms of the Creative Commons Attribution License (CC BY). The use, distribution or reproduction in other forums is permitted, provided the original author(s) and the copyright owner(s) are credited and that the original publication in this journal is cited, in accordance with accepted academic practice. No use, distribution or reproduction is permitted which does not comply with these terms.
*Correspondence: Jianjun Xu, anh1QGdkb3UuZWR1LmNu; Mei Liang, bGlhbmdtZWlAZ2RvdS5lZHUuY24=