 Zhengfang Dong
- 1Henan Provincial Research Center of Engineering on Intelligent, KaiFeng, China
- 2Institute of Geotechnical and Rail Transport Engineering, Henan University, Kaifeng, China
Improving the seismic resilience of urban underground structures is among the hot topics concerning disaster prevention and the mitigation engineering of underground structures; however, there is still a lack of research on the quantitative methods for the seismic resilience of underground structures. Based on the existing research results of seismic resilience in other fields and combined with the actual situation of subway stations, in this paper, a quantitative framework for the seismic resilience of subway stations was proposed. In this quantitative framework, the seismic resilience of subway stations was described from the functional and economic levels, respectively, with two indices. Also, a recovery model and an indirect economic loss calculation method for subway stations were proposed. Based on the proposed framework, the strategy and mechanism of improving seismic resilience were analyzed. Moreover, a finite element model was established to calculate and analyze the effects of the two strategies on enhancing the seismic resilience of subway stations by adding seismic mitigation measures before earthquakes and accelerating restoration after earthquakes. The results showed that the proposed framework is feasible, as both strategies showed to improve the seismic resilience of a subway station; however, the mechanisms are different. After the installation of seismic mitigation measures before an earthquake, the functional recovery capacity of the station increased by 22–30%, and the economic loss decreased by 43–75%. After the earthquake, by increasing the number of repair workers, the functional recovery capacity increased by 5–25%, and the economic losses decreased by 10–48%.
1 Introduction
With the continuous progress of urbanization, the problem of traffic jams has become increasingly serious, and developing underground transportation methods is one of the effective methods for solving this problem. Nowadays, subways have become the primary transportation system in large cities because of their advantages, such as being clean and fast. However, with the continuous development of subways, the probability of earthquake damage is increasing. Historical data has shown that underground structures are also at the risk of earthquake damage (Iida et al., 1996; Wang et al., 2001; Li 2008; Wang et al., 2009). In particular, in the 1995 Kobe earthquake, all the central columns of the Daikai station were destroyed, and the whole station collapsed. It took a year to rebuild the station, and the repair cost reached 10 billion yen. It can be seen that serious damages to underground structures can cause serious blows to local national life and economic development. Thus, ensuring that underground structures have enough resistance to earthquakes and that they can be quickly repaired after earthquake damages has become a new research problem, which needs to be solved so as to avoid any excessive indirect economic losses. In general, the concept of seismic resilience provides an answer to this problem.
The concept of seismic resilience originated from mechanics and has been introduced into various research fields. In 2003, Bruneau et al. (2003) proposed a conceptual framework for assessing community resilience after earthquakes, and they introduced the concept of resilience to the engineering seismic field for the first time. After many years of development, seismic resilience has become among the research hotspots in the engineering seismic field, and its concept has gradually formed a unified concept, namely the ability of structures to resist earthquake shocks and quickly recover from them.
According to existing studies, there are three quantitative methods for seismic resilience. The first one is a quantitative method based on “resilience curve”, where the area integral between a performance curve and coordinate axes is used to represent the seismic resilience of a research object. It was first proposed by Bruneau et al. (2003) and then optimized by (Cimellaro et al., 2006; Cimellaro et al., 2010). This method has been widely applied to seismic resilience research on various structures and systems, such as hospitals (Cimellaro and Piqué, 2016a; Li et al., 2020; Shang et al., 2020), bridges (Deco et al., 2013; Capacci et al., 2020; Huang and Huang, 2021), buildings (Anwar and Dong, 2020; Yu et al., 2021; Salado Castillo et al., 2022), road networks (Ishibashi et al., 2021; Liu et al., 2021), power distribution systems (Yuan et al., 2018), water distribution systems (Cimellaro et al., 2016b), and community structures (Fu et al., 2021). Although this method can describe the performance changes of a structure during repair periods through the performance curve, it is difficult to fit the performance curve. Also, this method cannot analyze the seismic resilience of complex systems from multiple perspectives.
The second method is a quantitative method based on “resilience index”, where the seismic resilience of a research object is represented by indices, such as the repair time or economic loss. Chang and Shinozuka (2004) provided an initial idea for this approach by taking the probability that the structural residual function and repair time both meet structural performance goals, such as the resilience index of a community. Other research works have also used this thought (Liu et al., 2017; Xue et al., 2021). Moreover, the current industry standards for seismic resilience evaluation, such as FEMA-P58 (FEMA, 2012), REDi (Almufti and Wilford, 2013), and Standard for the seismic resilience assessment of buildings (GB/T 38591-2020, 2020), all adopt this quantitative method. Although this method is easy to understand and operate, it cannot describe the performance changes of a research object during a repair process, which is very important for some structures.
The third method is a quantitative method based on the “index evaluation system,” and it evaluates the seismic resilience of a research object by listing relevant index elements on the basic components of the research object. Common index evaluation systems of resilience include DROP (Cutter et al., 2008), BRIC (Cutter et al., 2010), ARUP (Resilience Alliance, 2010), and CDRI (Mayunga, 2009). These methods can analyze the impact of each system’s components on system resilience from multiple angles and levels; however, they cannot reflect the performance changes of underground structures during a repair process.
Although there has been a lot of research on seismic resilience, there is not enough research on the resilience of underground structures (Yang et al., 2019). The existing studies on the seismic resilience of underground structures have mainly focused on improving the resistance of underground structures by improving their residual functions after earthquakes (Lu et al., 2021). For example, by using traditional seismic mitigation measures, such as bearings (Ma et al., 2018; Xu et al., 2020; Zheng Yue, 2020; Jia and Chen, 2021), the force transmission mechanism of a central column is changed, and the damage of the central column can be reduced. Also, new structural forms can be developed for central columns (Du et al., 2018; Chen and Zhou, 2019; Lu et al., 2020; Xu et al., 2021) to improve their ductile deformation capacity.
However, it is not enough to only focus on structural seismic mitigation. On the one hand, the effects of seismic mitigation measures on structural seismic resilience improvement still need to be analyzed and guided by scientific seismic resilience quantitative methods. On the other hand, underground structures still need an exact index to describe their recovery capacity and social impact after being hit by earthquakes (Lu et al., 2021).
Given the above, the research on the seismic resilience of underground stations is still not perfect. The existing research direction is single, and there is a lack of a resilience index and a corresponding quantitative framework for evaluating this index. We cannot assess the seismic resilience of subway stations or know the specific methods and effects of resilience improvement measures. Therefore, combined with the existing quantitative methods of seismic resilience, in this work, we studied the quantitative framework and worked on a strategy for the seismic resilience of underground structures.
2 A Quantitative Framework for the Seismic Resilience Assessment of Subway Stations
Subway plays an important role in urban transportation networks. Whether its performance is perfect or not has an important impact on the daily trips of city dwellers. Obviously, when a subway station is damaged, its performance can be time-varying during the repair process. Therefore, a resilience quantification method based on “resilience index” or “index evaluation system” cannot be suitable for quantifying the seismic resilience of subway stations, as it cannot simulate the time-varying performance of a structure during a post-earthquake repair process. However, a quantification method based on “resilience curve” can describe the performance changes of a structure during a repair period through a performance curve, and it can be applied to the resilience quantification of the underground stations that care about using functions.
Figure 1A and Eq. 1 demonstrate a typical quantitative framework (based on a performance curve) for seismic resilience assessments. As seen in Figure 1A, Bruneau et al. (2003) focuses on the functional loss amount during the repair period (RB), while Cimellaro et al. (2010) focuses on the functional recovery capacity after an earthquake (RC). Due to the different sizes of structures, it is reasonable to describe the seismic resilience of structures based on the amount of functional recovery per unit time.
where Q(t) is the performance function of a structure, TRE is the time required to repair the structure to its initial state, t0 is the time of the earthquake occurred, frec is the recovery function, and Qresidual is the structural residual performance after the earthquake.
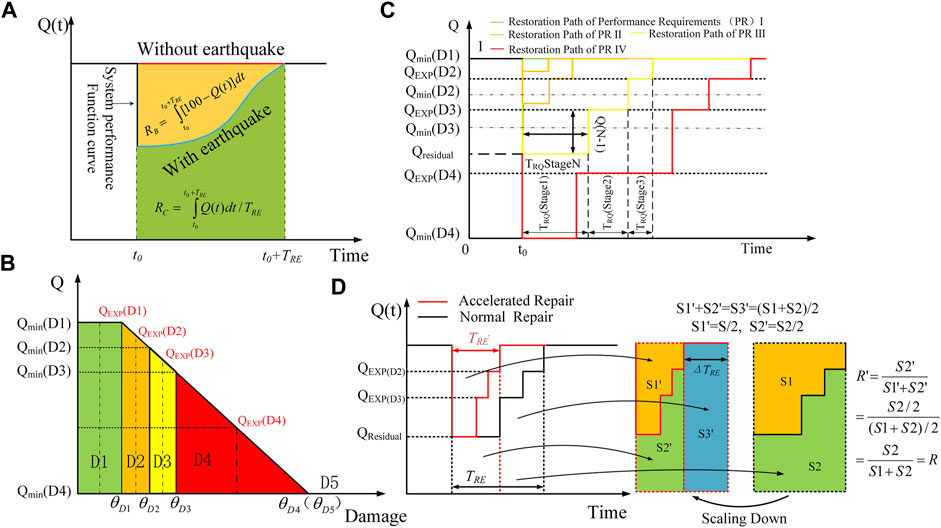
FIGURE 1. (A) A typical seismic resilience model; (B) definition of the repair target for each stage; (C) recovery profile for different performance requirements and (D) shortcomings of existing quantification method of the functional recovery index.
2.1 Seismic Resilience Indices
In this paper, seismic resilience is defined as the ability of a structure to withstand earthquake impacts and quickly recover to its original performance after an earthquake. By referring to Cimellaro’s typical framework for seismic resilience assessments (Cimellaro et al., 2010), the calculation of functional recovery index (R) can be divided into two parts: the calculation of the post-earthquake residual function and the construction of a recovery model. However, the functional recovery index (R) is an index that describes the structural-functional recovery capacity of a research object, and it cannot directly reflect economic losses. Therefore, an economic index (Etot) was used to describe the structural seismic resilience together with the functional recovery index. The seismic resilience of the structure is improved with the increase in the functional recovery index and the decrease in the economic index. The calculation of the economic index is shown in Eqs 3, 4.
where Edirect−loss and Eindirect−loss denote the direct and indirect economic losses, respectively, and Erepair−M and Erepair−H denote the material and labor costs, respectively. In this study, the economic losses resulting from human casualties were not calculated.
2.2 Functional Recovery Index of Subway Station Components
2.2.1 Residual Function Calculation
In this study, the bearing capacity of a subway station was taken as a performance index of the structure. The bearing capacity of the station comes from two vertical structural components: the central column and sidewall. Therefore, we evaluated the seismic damage degree of the station from the component level. In addition, the inter-layer displacement angle was selected as the damage indicator of the station, because the side walls and the central columns are displacement-sensitive components.
The code for Seismic Design of Urban Rail Transit Structures (GB50909-2014, 2014) divides the seismic performance requirements of underground structures into three grades and provides corresponding component performance grades under each performance requirement. However, this standard is not clear in describing the allowed damage state that occurs at various performance levels of the components. However, the description of the damage states of the structural components in Standard for seismic resilience assessment of buildings (GB/T 38591-2020, 2020) is basically consistent with the description of the component performance grade requirements in standard (GB50909-2014, 2014), and it can be used as a basis for the damage classification of subway station components. Therefore, based on the two codes, we provided the performance requirements of subway stations and the corresponding component damage classification (see also Table 1). And according to the inter-layer displacement angle limits of the underground rectangular structure under the condition of “no damage, repairable and not collapse” given by Dong et al. (2014) and factors such as repair difficulty, the suggested index limits of the subway station adopted in this paper are shown in Table 1.
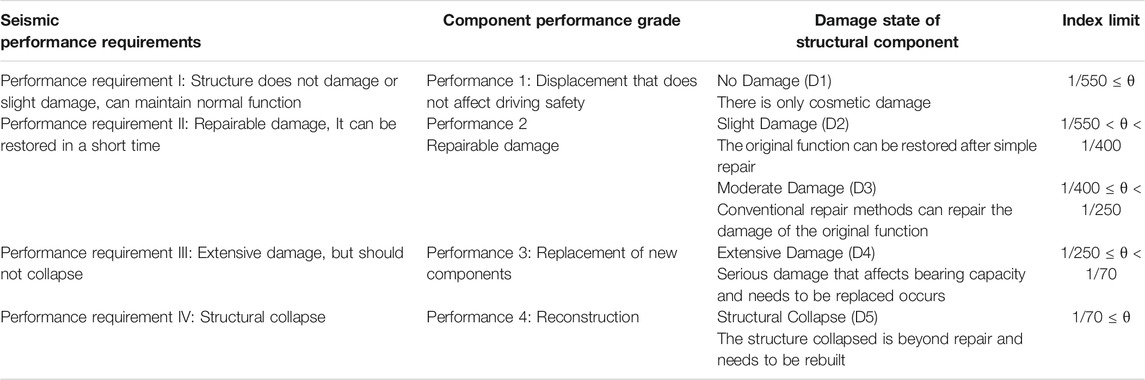
TABLE 1. Performance requirements, damage state and limits of the interlayer displacement angles of the station’s components.
The residual function of the station components after an earthquake is defined as the ratio of the maximum inter–layer displacement angle during the earthquake to the ultimate inter–layer displacement angle, which is calculated by Eq. 5 as follows.
where Qresidual is residual function of the type i components; θi is the maximum inter–layer displacement angle of the type i component during the earthquake, and θDj is the lower limit of the inter-layer displacement angle under the damage level j (In fact, the values of θD4 and θD5 are the same, as shown in Figure 1B). When θi is greater than or equal to θD5, the structure collapses, and its residual function is 0. Similarly, when θi is equal or lesser than θD1, the structure is not damaged, and its residual function is 1.
2.2.2 Recovery Model Construction
The recovery curve describes the real-time recovery process of a structure’s functions depending on its own recovery ability or with the help of external forces. It is also the basis of quantifying the functional recovery capacity of a component. To construct a function recovery model, it is necessary to have the recovery profile and shape parameters of the component under different damage levels.
2.2.2.1 Recovery Profile
The recovery profile is a profile curve that describes the performance change during a repair process, and it is related to the types of the components to be repaired, regional economic conditions, repair strategy, and seismic damage degree. Existing recovery profiles include linear type, trigonometric type (Chang and Shinozuka, 2004), exponential type (Kafali and Grigoriu, 2005), and stepwise type (Padgett and DesRoches, 2007). Compared with the first three, stepwise type conforms to the reality of a staged repair process and reflects the recovery strategy and means in the repair process. Consequently, stepwise type was selected in this paper.
In this paper, the same recovery profile was adopted for the central columns and sidewalls, which were only differentiated by shape parameters. In addition, the economic factors (referring to the regional economic conditions) can also be reflected by shape parameters.
The damage level of the component to be repaired directly controls its repair difficulty (Deco et al., 2013; Li et al., 2017). Therefore, according to the performance requirements of the station described in Table. 1, we extracted the recovery profile of the component at different damage levels, as shown in Figure 1C, where Qresidual was used to select the recovery curve, and the parameters TRQ(StageN) and Q(N−1) define the shape of the recovery profile. When the component damage level is D1 [Qresidual = Qmin(D1) = 1], there is no damage to the structural component that can affect the performance. Thus, the function of the component remains 1. When the damage level of the component is D5 [Qresidual ≤ Qmin(D4) = 0], the component is completely destroyed and the function of the component is 0. When the damage level of the component is D2–D4 [Qmin(D4) < Qresidual < Qmin(D1)], the component can be restored to its original performance by repair and replacement, respectively, and its function is not interrupted during the repair period. However, the repair process is different due to the difference in its damage level.
The performance of a damaged component is controlled by its damage level and is gradually improved through continuous repair. Consequently, a step-by-step repair strategy from high-level damage to no damage was adopted in this study. When a repair stage is completed, the manager should remove the functional limitations of the structure in a timely manner. For example, if the seismic damage level of the component is D4, the damage level should be reduced to D3 after the first repair stage is completed, and the structural function should be improved to the corresponding function level of D3.
QEXP(Dj) denotes the expected values of the residual functions of components under the damage level j. Also, it denotes the corresponding recovery target of each damage level. Also, Qmin(Dj) is the lower limit of the damage level j. TRQ(StageN) and Q(N−1) denote the repair time and recovery target required in recovery stage N, respectively, and their calculation method is shown in the next section.
2.2.2.2 Stage Recovery Target
When the component is repaired and the damage is reduced from Dj to Dj-1, its function should be increased from QEXP(Dj) to QEXP(Dj−1). However, it is difficult to determine the value of QEXP(Dj−1), as each damage level corresponds to a certain performance range, which should be discussed by experts based on the safety and social impact of the structure. In this paper, we suggest that the performance value corresponding to the median of the damage level j be selected as the expected residual function QEXP(Dj) of the component under this damage level, as shown in Figure 1B.
The functionality and repair targets of each repair stage under different damage levels are shown in Table. 2, where Q(N−1) is the functionality of the components during the repair stage N; Q(N) is the repair target of the repair stage N, achieved at the time instants when the repair stage j is finished, and serves as the functionality of the components during the repair stage N + 1.
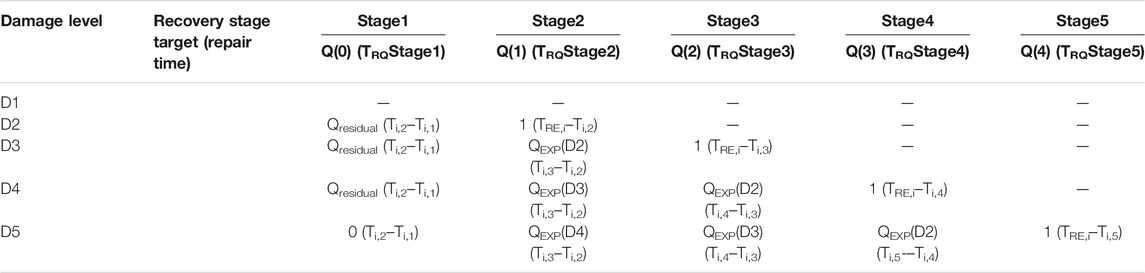
TABLE 2. The functionality, repair targets and repair time of each recovery stage under different damage levels.
2.2.2.3 Repair Time Calculation
There are two methods for calculating the repair time. The first method is to extract the repair experience from the past, and the second method is based on the repair time required by each component, which is also used in the existing resilience evaluation standard (FEMA, 2012; GB/T 38591-2020, 2020). Since there are only a few earthquake damage cases for underground structures, it is difficult to obtain relevant repair data from historical cases. Consequently, the second method was used to calculate the repair time of the component.
Since subway structures should be immediately repaired after earthquakes, in this paper, the repair time is defined as the time period between the earthquake and the completion of repair. To facilitate the calculations, we made the following assumptions.
Assumption 1The central columns and sidewalls can be repaired at the same time.
Assumption 2The damage level of same type of components is the same.
Assumption 3The repair workers are equally competent.The time instants and time interval of each repair stage are calculated by Eqs 6, 7, respectively.
Where N and Ti,N denote the numbering the repair stage and the time instants when the repair stage N of type i components are finished, respectively; N and j are integer; ti,j denote the repair times required by a single type i component under the damage level j and is related to the means of repair; ni is the number of type i components, and nwork is the number of repair workers; the normal meaning of TRE, i is the total repair time required for completion of type i component. In this paper, it is represented as the repair time standard, and the detailed explanation is given in Section 2.2.3. Therefore, the repair time required for each stage of different components under different damage levels is shown in Table 2. It should be noted that the damage of the components also need to be repaired when its damage level is D1, since such damage does not affect the structure’s function, this period of time is not counted as the repair time. Therefore, the components at damage level D1 has no repair target and repair time (Table 2).
2.2.3 Recovery Function and Calculation Method of the Functional Recovery Index
If the structural-functional recovery capacity of a component is calculated according to Eq. 1, the functional recovery index (R) cannot respond to the change in the repair time. As shown in Figure 1D, if the accelerated repair strategy (more repair workers or a faster repair method) is used to double the repair rate of each repair stage, the total repair time is halved. Consequently, when using the accelerated repair strategy, the functional limit time is halved, and the function loss amount in the repair process are half that of the normal repair strategy. Thus, the accelerated repair strategy is a better choice for both the owner and the public. However, the functional recovery index calculated according to Eq. 1 with the accelerated repair strategy is the same as that obtained with the normal repair strategy.
To make the functional recovery index respond to the change in the repair time, we provide a new calculation method. Firstly, a normal repair strategy (including the number of repair workers and the repair method) should be established as the standard, and the corresponding repair time was calculated as the repair time standard (TRE). Then the function recovery amount per unit time in the repair time standard is taken as the functional recovery index of the components. Thus, based on the content in Section 2.2.2, the corresponding recovery function is shown in Eq. 8. And the functional recovery index Ri of the components was calculated by Eq. 9.
Where j is the seismic damage level of the structure; Ri and TRE,i (repair time standard) denote the functional recovery index and the repair time of a type i component, respectively; Ti,0 equal to 0. However, the repair strategy is not one and only, as long as the repair time required by the actual using repair strategy is shorter than the repair time standard.
2.3 Economic Index of Subway Station Components
2.3.1 Direct Economic Loss Calculation
The economic loss caused by human casualties was not considered. Thus, direct economic loss was the repair cost of the structure, including the material and labor costs. The repair cost of the structure was calculated according to the concept of “loss ratio” (GB/T 18208.4-2011, 2011; FEMA, 2005), as shown in Eq. 10.
where βi,j denote the loss coefficient of the structural component type i under the seismic damage level j, and Ci denote the construction cost of the structural component type i. And Ci can be calculated according to industry standard.
2.3.2 Indirect Economic Loss Calculations
The indirect economic loss is the economic loss caused by the reduction of structure’s using function. A station is a gate for passengers to get in and out of a subway, and the reduction of its function directly affects the passenger flow of the subway. If analyzed from the view of the public, the indirect economic loss caused by the reduction of a subway station’s function is the time and fare costs passenger transfer. And from an owner’s point of view, the indirect economic loss is the income loss caused by the decrease in passenger traffic. Although the economic loss of passengers does not increase the economic loss of owners, this part of the economic loss should be added to the indirect economic loss in the form of social responsibility so as to restrain the owner from choosing a repair strategy with a long recovery time and a low repair cost.
Thus, the indirect economic loss of type i components can be calculated by Eqs 11–13 as follows.
where losspublic and lossowner denote the socioeconomic and owner losses, respectively; ATD is the daily passenger flow of the station under normal conditions; S is the fare per kilometer per person; ΔC and ΔT denote the fare cost and time cost per kilometer of one person, respectively (Transfer is by taxi); L is the average distance between the station and nearby stations.
2.4 Functional recovery index of a station.
Different components have different effects on structural performance. Consequently, the weight of each component with regard to the performance of a subway station should be considered when calculating seismic resilience of stations. The calculations of the functional recovery index and economic index of a subway station are shown in Eqs 14, 15.
where αi is the weight coefficient of the type i component, and n is the number of component types. A central column is vulnerable to damage because of its small crosssection, as it is the main factor affecting the performance of subway stations. Therefore, the recommended weight coefficients for the central column and sidewall in this study are 0.7 and 0.3, respectively.
According to the above, the flowchart of the seismic resilience assessment of subway stations is shown in Figure 2.
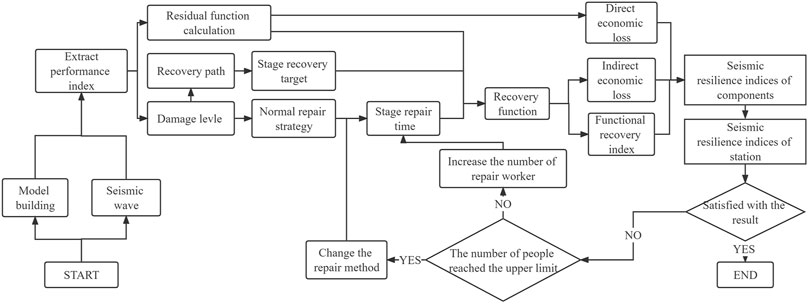
FIGURE 2. Flowchart of the seismic resilience assessment.
3 Seismic Resilience Improvement Strategy of Subway Stations
To improve the structural seismic resilience is to increase the proportion of the functional recovery quantity in a structural repair process. Seismic resilience of a subway station can be improved using two ways. The first way is to improve the residual function of a structure after an earthquake, which can be realized by improving the ability of the structure to resist earthquake loads by using seismic mitigation measures (before the earthquake). The second method is to improve the repair rate of the subway station. Under the condition that the residual functions of a structure are invariant, shortening the repair time can reduce the functional loss amount during a repair process (after the earthquake) and improve the seismic resilience of the station.
3.1 Improvement of Structural Resistance Resilience
There are two common seismic mitigation methods for subway stations. The first method is to use shock-absorbing bearings, such as friction pendulum bearings (FPB), which can be used on the central column to concentrate the horizontal deformation at the bearing, thus reducing the deformation of the central column. The second method is to use new structural forms for the central column, such as a split column, which can be adopted to improve the ductile deformability of the central column. In this study, FPB was selected as a seismic mitigation measure, and its effect on improving the seismic resilience of subway stations was quantified and analyzed using numerical simulations.
FPB is a type of seismic mitigation device that uses the friction sliding energy dissipation technology, as shown in Figure 3A. Under the action of an earthquake, the soil deformation causes the relative displacement of the roof and floor of the station. In this process, the slider can slide on the sliding concave surface (Figure 3B). The relative displacement is divided into two parts as it transfers from the roof to the central column, one part is the displacement of the slider in the support, the other part is the displacement of the central column. Therefore, compared with the original structure, the deformation of the central column with FPB is reduced. Moreover, the constant friction between a slider and a sliding concave surface can consume the seismic energy resulting from earthquakes, as shown in Figure 3B. The force analysis of the slider is illustrated in Figure 3C.
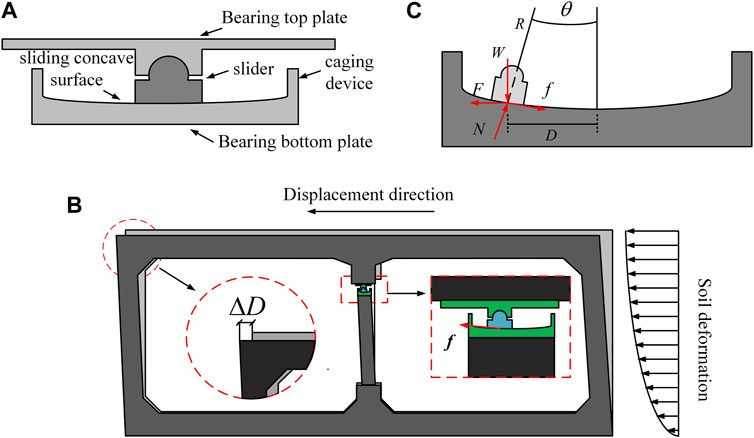
FIGURE 3. (A)Structural map of friction pendulum bearing; (B) working mechanism of friction pendulum bearing and (C) force analysis diagram of friction pendulum bearing in the case of an earthquake.
In Figure 3C, θ is the rotation angle of the slider relative to the vertical symmetry axis of the bearing bottom plate; D represents the horizontal displacement of the slider; W denotes the vertical bearing weight of the FPB, and its component in the normal direction of the sliding concave surface is Wcos(θ); R indicates the radius of the sliding concave surface radius; f is the sliding friction force of the slider; F stands for the horizontal shearing force transmitted by the structure.
Where, μ is the sliding friction coefficient of the slider, and when θ is very small, cosθ is approximately equal to 1. Assuming the value of F remains unchanged, it can be seen from Eq. 16 that when W and μ remain unchanged, the increase of sliding concave surface radius will lead to a longer slide distance for the slider to reach balance. Similarly, when μ increases and R remains constant, the slide distance to reach equilibrium decreases accordingly. In conclusion, the deformation of the central column closely correlates with the friction coefficient and the radius of the sliding concave surface.
3.2 Improvement of the structural recovery resilience.
In the case that the repair time standard (TRE) is constant, the shorter the repair time, the less the function loss amount in the restoration process and the higher the functional recovery index. This paper puts forward two schemes for enhancing resilience in subway stations after earthquakes.
1) Increasing the number of repair workers.
2) Using a repair method that is faster than normal repair methods.
In combination with Eqs 6, 7, it can be seen that when the number of repair workers increases, nwork increases, while TRQ(StageN) decreases. When using a faster repair method, higher repair costs may be incurred, and both ti,j and TRQ(StageN) decrease. In this case, we chose to increase the number of repair workers to enhance the seismic resilience of subway stations.
4 Case Study
4.1 Numerical Model
4.1.1 Engineering Background
To demonstrate the proposed seismic resilience assessment framework for subway stations and analyze the effectiveness of the seismic resilience improvement method, a three-dimensional numerical simulation was performed with the Daikai station as a prototype. The Daikai subway station is a single-layer, double-span, rectangular frame structure, and its crosssection is shown in Figure 4A. The thickness of the covering Earth of the station is 4.8 m, and the concrete grades C30 and C35 are used for the main structure and central columns of the station, respectively. In addition, the reinforcement ratios of the sidewall, top and bottom plates, and central column are 0.8, 1.0, and 0.6%, respectively. All the reinforcements adopt screwed reinforcements with a diameter of 32 mm. Figure 4B shows the detailed size of the FPB. The main physical and mechanical parameters of the soil in each layer of the site are listed in Figure 4C.
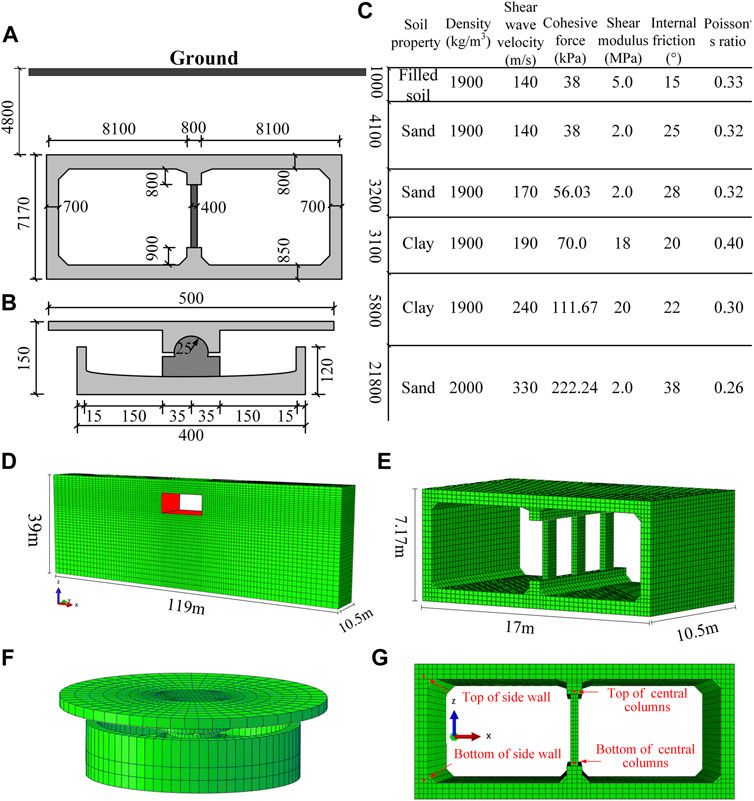
FIGURE 4. (A) Main dimensions of the cross section of the Daikai subway station; (B) main dimension of cross section of friction pendulum bearing; (C) main physical parameters of the soils; (D)Finite element model of soil; (E) finite element model of station; (F) finite element model of FPB and (G) schematic diagram of the value point.
4.1.2 Finite Element Model
To avoid the adverse impact of the boundary effect on the calculation results (Lou et al., 2000). In this paper, the width of the site model is set to 119 m (7 times the width of the station), the thickness is 39 m, and the longitudinal width is 10.5 m (longitudinal width of the triple-span station). The finite element model was established based on the ABAQUS software, as shown in Figures 4D–F. The soil, concrete structure, and FPB were meshed using C3D8R, and T3D2 was adopted for the mesh division of the reinforcement. The reinforcement was embedded in the concrete without considering the bond-slip between the reinforcement and concrete. The mesh size of the bearing plate ranges from 0.01 to 0.02 m, and the mesh size of the slider ranges from 0.005 to 0.008 m. The mesh size of the remaining part was selected according to the minimum wavelength of 1/10–1/8 (≤2 m), and the soil mesh around the structure was appropriately encrypted. The sidewalls and the top and bottom plates have an elastic modulus of 30 GPa, a density of 2,500 kg/m3, and a Poisson’s ratio of 0.2. The FPB is made of high-strength steel with a density of 7,850 kg/m3, an elastic modulus of 206 GPa, and a Poisson’s ratio of 0.3. In this study, we adopted Mohr–Coulomb as the nonlinear constitutive of the soil mass, and the constitutive model of the concrete material adopted a plastic damage constitutive model (Lubliner et al., 1989; Lee and Fenves, 1998). The linear elastic constitutive model was adopted for the bearing steel. Rayleigh damping was used to approximate the damping of both the concrete and soil materials.
The artificial boundary was a viscous-spring boundary, and the ground motion input was converted into a nodal force. In addition, the calculation methods of the spring stiffness, damping coefficient, and concentrated force of the node were calculated by the self-compiled MATLAB program (Liu and Li, 2005; Du and Zhao, 2006). In this paper, the initial stress extraction method was adopted to balance the in situ stress of the model, and the method reported by Zhuang et al. (2011) was employed to transform the static and dynamic boundaries. The surface-to-surface contact was adopted for the contacts between the soil and the station and between the slider and the bearing plate. Moreover, the normal contact was hard, the Coulomb friction law was used to simulate the tangential contact of the contact surface, the coefficient of friction between the soil and structure was 0.4 (Lu et al., 2018), and the coefficient of friction of the concrete was 0.6 (Chen et al., 2014).
4.1.3 Ground Motion Selection
In this study, the horizontal and vertical ground motions recorded by Kobe University were selected as input ground motions. The acceleration–time curve, displacement–time curve, and Fourier spectrum are shown in Figure 5, respectively.
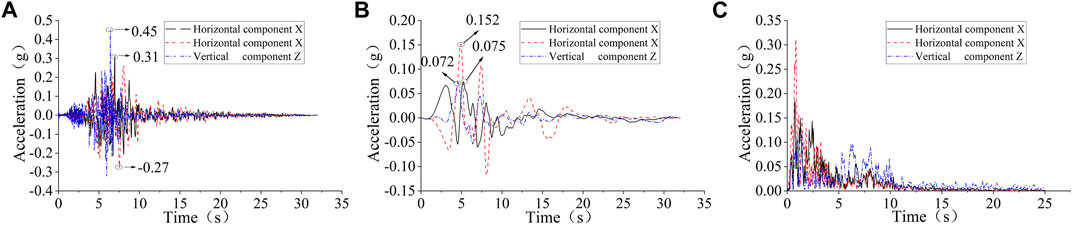
FIGURE 5. (A) Acceleration time history curve; (B) displacement time history curve and (C) Fourier spectrum.
4.1.4 Working Conditions
To analyze the influence of the different FPB parameters on the seismic resilience improvement effect, we set 17 working conditions (The original structure serves as a contrast) for the numerical simulation, as shown in Table 3. Also, four working conditions (18–21) were set to analyze the impact of increasing the number of repair workers on the seismic resilience of subway stations.
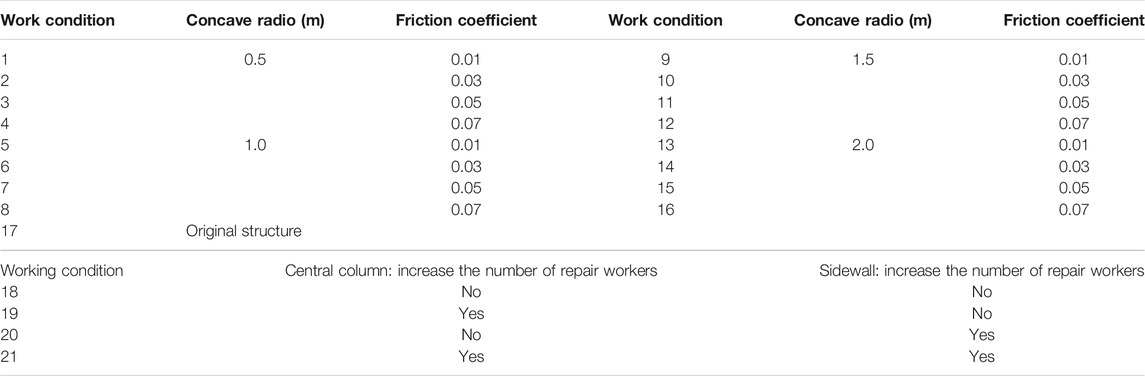
TABLE 3. Working condition.
4.2 Analysis of the Resilience Improvement Effect of Friction Pendulum Bearings
4.2.1 Residual Function
The residual functions of each component of the station in the case of an earthquake were calculated according to the proposed method in Section 2.2.1. The value points of the inter–layer displacement angles of the central column and sidewalls are shown in Figure 4G. The residual functions of the central columns and sidewalls in the case of an earthquake under each working condition are shown in Figures 6A,B, respectively.
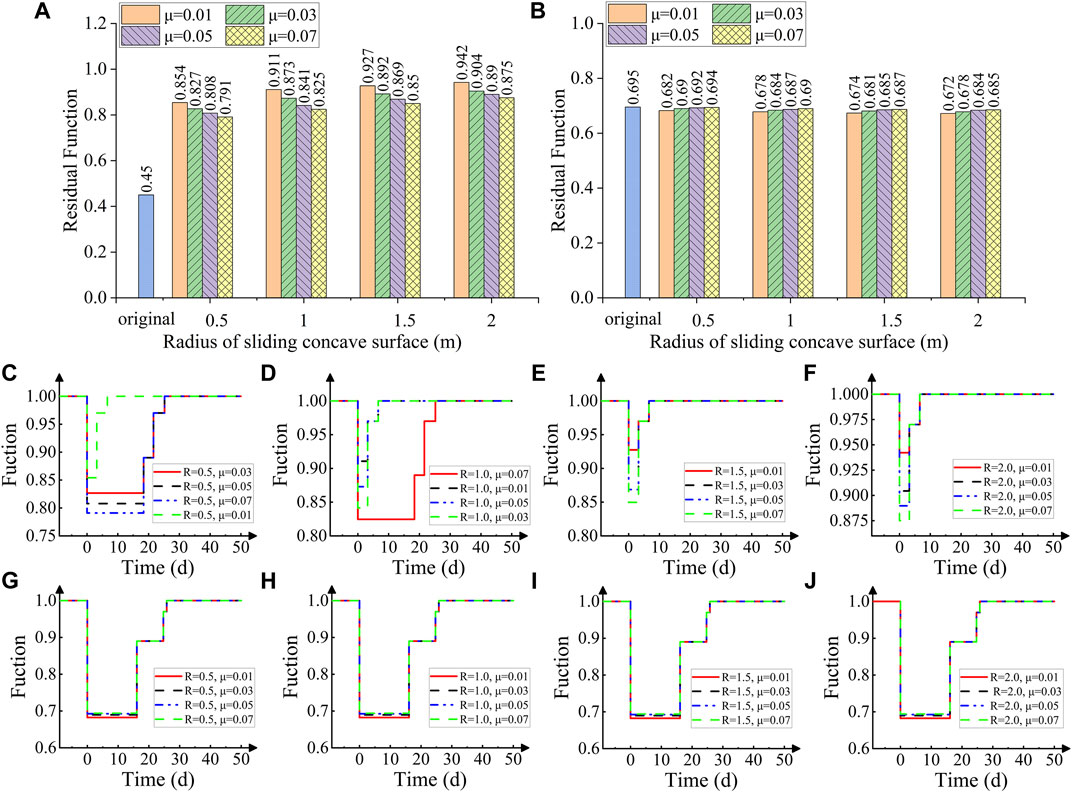
FIGURE 6. (A) Residual function of the central column; (B) residual function of the sidewalls under different working conditions; (C–F) recovery curves of the central column and (G–J) recovery curves of the sidewall under different working conditions.
As can be seen from Figures 6A,B, after the central column was equipped with FPB, its residual function increased by more than 80%, and the residual function of the sidewall slightly decreased by around 5%. The results show that the stations equipped with FPB can effectively improve the residual function of the station, which is consistent with the expected results.
4.2.2 Functional Recovery Index
4.2.2.1 Shape Parameters Calculation
The repair time and the number of repair workers used in the calculation in this section were considered to be as the normal repair strategy. Since it is difficult to obtain the repair time data of the central columns and sidewalls of the subway station, consequently, the repair time data of the reinforced concrete frame given in standard (GB/T 38591-2020, 2020) were used to in this case. And the repair data of the central column using the friction pendulum support is unknown and does not affect the research content in this section, the repair time data of the central column was configured with FPB is consistent with that of the original structure.
Based on the assumption in Section 2.2.2.3, we took one span of the structure as a research object, including a central column and a sidewall. In addition, the central column and sidewall were repaired by one person each, and the repairs were performed at the same time. According to the repair time data from standard (GB/T 38591-2020, 2020) and the calculation method given in Section 2.2.2, the repair time and repair target of each stage under different damage levels of the components were obtained (Table 4).
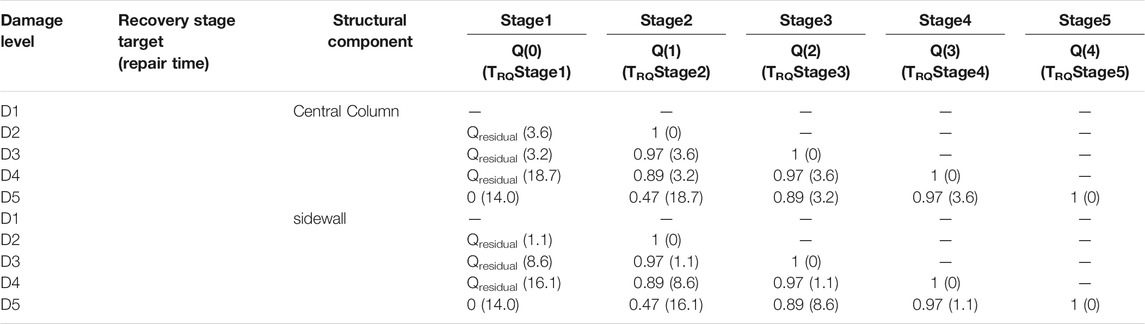
TABLE 4. Repair time of different components in each stage for different damage states (day).
4.2.2.2 Results and Analysis
According to the seismic resilience assessment framework proposed previously, the corresponding recovery curves of the central column (Figures 6C–F) and sidewall (Figures 6G–J) under different working conditions were calculated. Also, the functional recovery indices of the central column, sidewall, and station were calculated, as shown in Figures 7A–C.
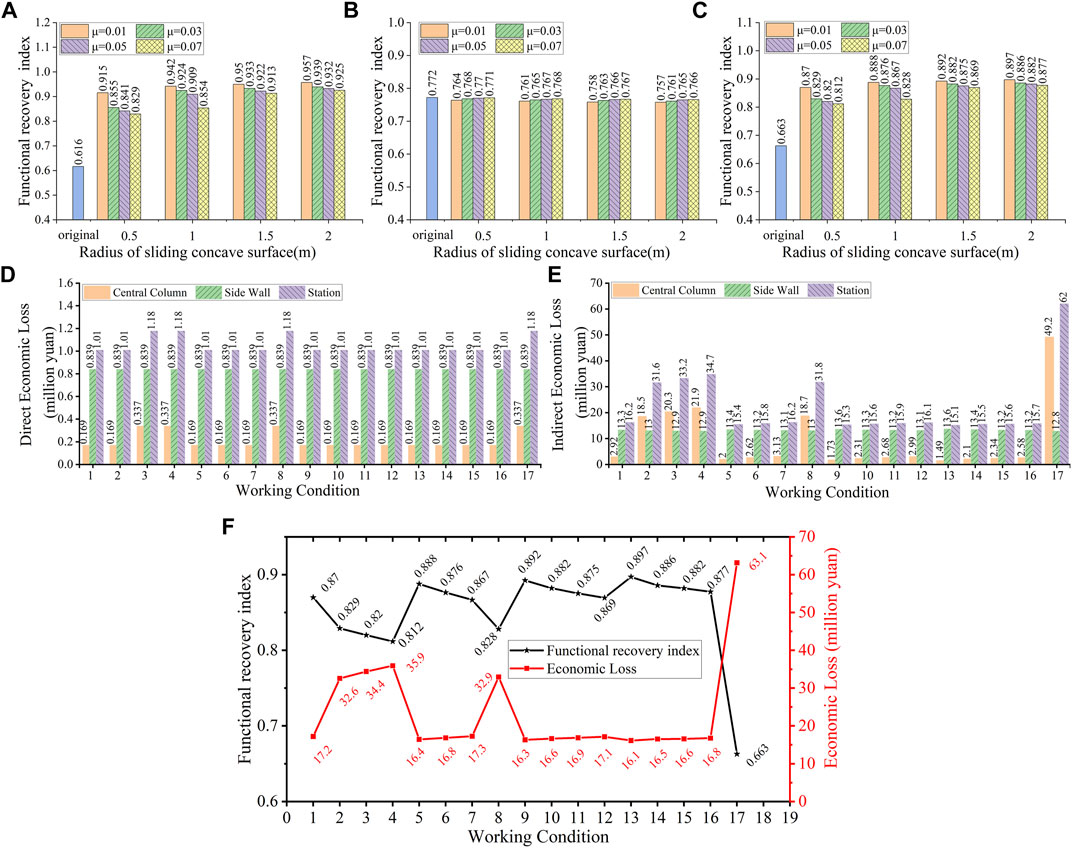
FIGURE 7. (A)Functional recovery indices of the central column; (B) functional recovery indices of the side wall; (C) functional recovery indices of the station (D) direct economic loss; (E) indirect economic loss and (F) functional recovery indices and economic loss under different working conditions.
Figure 7C shows that the functional recovery index of the station was significantly improved with an increase of more than 23% after the use of PFB. Also, the functional recovery index of the central column increased by more than 30% and by up to 50% (Figure 7A). However, the functional recovery index of the sidewall had no obvious changes (Figure 7B). In addition, the functional recovery index was positively correlated with the radius of the sliding concave surface and negatively correlated with the coefficient of friction.
The results show that the seismic resilience of the subway station can be effectively improved after the use of seismic mitigation measures (before earthquakes). Also, the more effective the seismic mitigation measures, the higher the seismic resilience of the structure. This is because the higher the residual function of the structure, the shorter the recovery time, consequently, the greater the structural-functional recovery capacity, the better the seismic resilience.
4.2.3 Economic Index
4.2.3.1 Economic Parameters Calculation
In this case, the loss coefficients βi,j of the subway station refer to the loss coefficients of frame structure components given in the standard (GB/T 38591-2020, 2020). Also, considering the cost of structural demolition, the structure loss ratio in D5 was set to 1.2, that is, the demolition cost is 20% of the construction cost, as shown in Table 5.
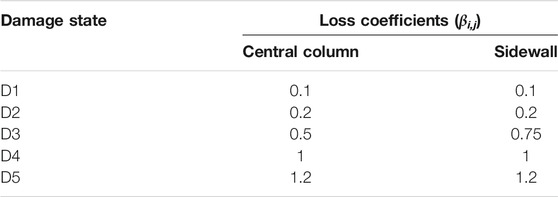
TABLE 5. Loss coefficients of the structural components.
In this study, the construction cost calculations for the central columns and sidewalls were simply divided into three parts: concrete, steel bar, and formwork support. Also, the construction costs of the sidewalls and central columns in this case were calculated by referring to the Urban rail Transit Engineering Budget Quota (GCG103-2008, 2008) based on the unit prices of local building materials. The costs of the central columns and sidewalls were calculated to be 3,373 yuan/piece and 8,390 yuan/piece, respectively.
This study case does not correspond to an actual station, and the data used in this section is from previous studies, where ATD is 500,000 person per day, L is 2 km, and S (yuan) and C (Taxi billing standards:yuan) were calculated from Eqs 17, 18, respectively. S is 3 yuan/person, and ΔC is 11 yuan/person. According to the data provided in reference (Gao and Wang, 2014), the time cost ΔT is 0.258 yuan/person*km.
4.2.3.2 Results and Analysis
Assuming that there are 100 central columns and 100 sidewalls in the station, the direct economic losses of the central columns and sidewalls in each working condition were calculated as shown in Figure 7D.
As seen from Figure 7D, the direct economic loss of the station was reduced by ∼14% under most working conditions. However, in the working conditions 3, 4, and 8, the direct economic loss of the station did not decrease, as the direct economic loss is only related to the post-earthquake damage level of the components and the number of components to be repaired. In the working conditions 3, 4, and 8, although the residual function of the central column was improved, the damage level did not decrease, thus, the repair cost did not decrease. With the use of FPB, the damage level of the sidewalls did not change, and the damage level of the central columns only decreased by one level, thus the reduction in the repair costs was limited. Overall, improving the seismic resistance of the structure cannot significantly reduce the repair costs.
Based on the calculation method provided in Section 2.3.2, the indirect economic loss of the station under different working conditions is shown in Figure 7E. Compared with the original structure, the indirect economic loss of the station greatly decreased after FPB was installed in the central column. Among them, the indirect economic loss of 76% of the maximum reduction, the minimum reduction of 47% (Figure 7E). This is because the indirect economic loss is not only related to the residual functions of the structure but also related to the repair time. The longer the repair time, the higher the function loss and the greater the indirect economic loss. After using FPB, the repair time of the central columns greatly decreased, so the indirect economic loss is significantly reduced.
The functional recovery index and economic loss of a station under each working condition are shown in Figure 7F. It can be seen that the economic loss is inversely proportional to the functional recovery index and that the law is consistent with the actual situation, which proves that the installation of seismic mitigation measures can improve the seismic resilience of subway stations.
4.2.4 Effect Analysis at Different Site Types
It is well known that the site of the Daikai station is of site type II. In the site type II, FPB can improve the seismic resilience of subway stations; nevertheless, it is not clear whether the same effect can be achieved in other site types. Therefore, according to the division of the site types in the code for Seismic Design of Urban Rail Transit Structures (GB50909-2014, 2014), in this paper, the optimal working conditions (13) were selected to establish the soil–structure interaction models of the site types I, III, and IV and then conduct a numerical simulation. The information of the site and model is presented in Table 6. Main physical parameters of the soils and dimensions of the finite model for different site classifications.
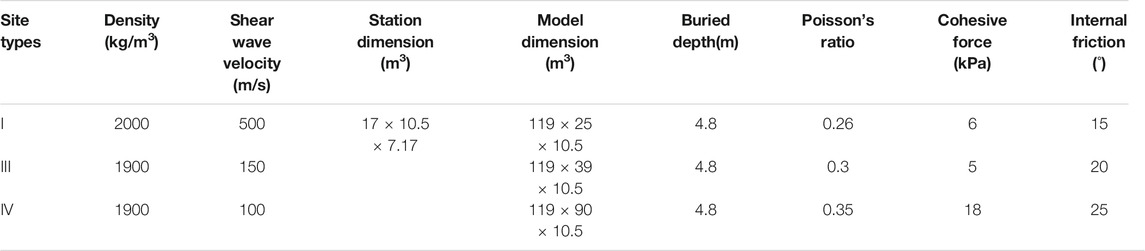
TABLE 6. The main physical parameters of the soils and the dimensions of the finite element model in different site types.
The recovery curves of the central column and sidewalls at different site types are shown in Figures 8A–C. As seen from Figures 8D,E, In the site type I, the structural damage is small, and the structure has good resilience. In the site types III and IV, the structure was seriously damaged, and the functional recovery index was low before FPB was added. After setting FPB, the functional recovery index was obviously improved. In the site types III, the functional recovery index of the stations increased by 63%, and the economic loss decreased by 76%. In the site type IV, the functional recovery index increased by 100%, and the economic loss decreased by 73%. Similarly, the results show that the conclusions deduced from the site type II still apply to the site types III and IV.
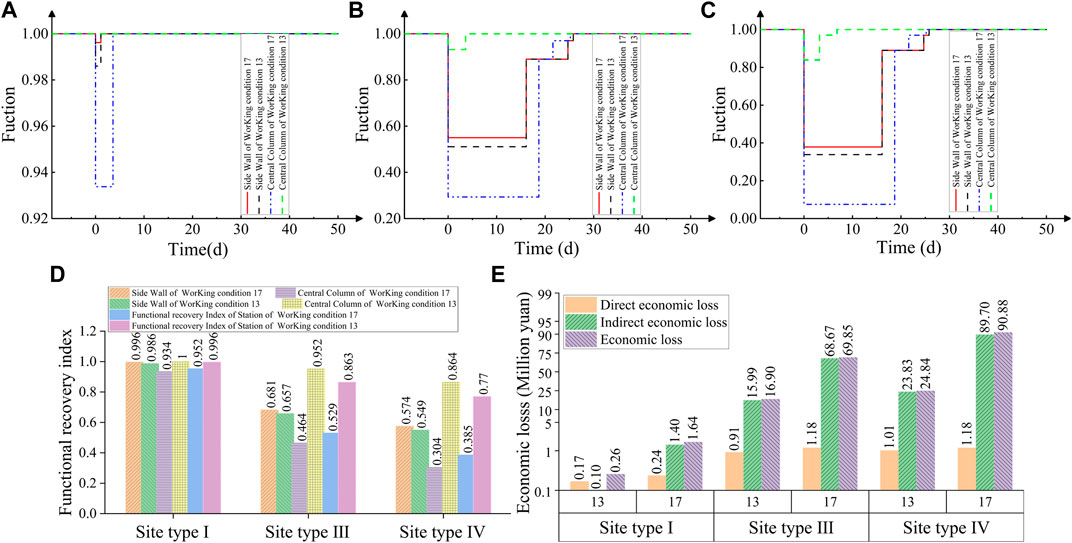
FIGURE 8. (A) Recovery curve in the site type I; (B) recovery curve in the site type III; (C) Recovery curve in the site type IV; (D) functional recovery index at site types I, III, and IV and (E) economic index at site types I, III, and IV.
4.3 Analysis of the Resilience Improvement Effect of Accelerated Repair
The working condition 18 was taken as a comparative object, and the normal repair strategy (same as above) was adopted. In the normal repair strategy, the number of repair workers for both the central columns and sidewalls is one person. In this section, the number of repair workers was increased by one, and the means of repair remained unchanged. The recovery curve and seismic resilience indices of the working conditions 18–21 are shown in Figure 9.
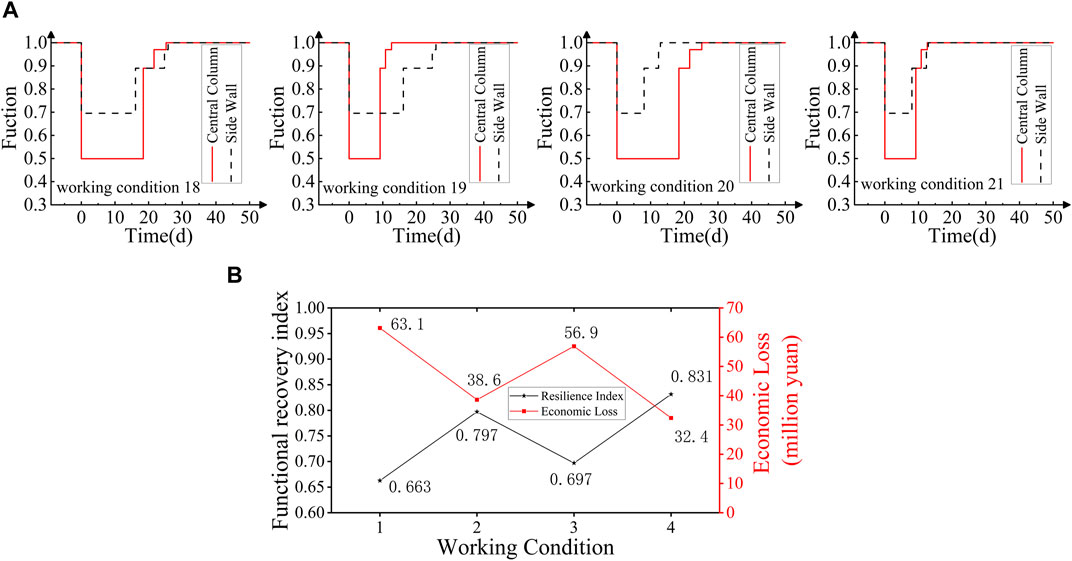
FIGURE 9. (A) Recovery curves of each working condition and (B) functional recovery index and economic index for different repair strategies.
It can be seen from Figure 9 that the seismic resilience of the station can be improved by increasing the number of repair workers for the central columns or the number of repair workers for the sidewalls. The functional recovery index of the station increased by 5–25%, and the economic loss decreased by 10–48% (Figure 9B). Obviously, as expected, with the increase in the number of repair workers, the repair time of the central column or sidewall in each repair stage decreased, the functional loss quantity decreased in the repair process, and the seismic resilience was improved. In the working conditions 19 and 20, the increase in the seismic resilience of the station was different. This is because central columns have a great influence on station performance. Therefore, compared with the increase in the number of repair workers for the sidewalls, the increase in the number of repair workers for the central columns has a more obvious effect on improving the seismic resilience of subway stations. These results show that the seismic resilience of subway stations can be improved by accelerating restoration after earthquakes. They also prove that for established stations, planning for repair strategies and preparing rescue materials in advance can improve structural seismic resilience.
5 Results and Conclusions
The seismic resilience of subway stations was studied in this work, and a quantitative framework for evaluating the seismic resilience of subway stations is proposed in this paper. Through finite element numerical simulations, the effect and mechanism of improving the seismic resilience of subway stations based on different methods before and after earthquakes were analyzed, and the following results and conclusions were obtained.
A quantitative evaluation framework for the seismic resilience of subway stations was established, and a calculation process of the resilience index was proposed. Based on the current standard, a recovery function model for subway stations was constructed, and a calculation method of the repair target and repair time was given. Also, a calculation method of the indirect economic loss of subway stations was proposed in terms of the public and owners. Overall, based on a study case, it was proven that the proposed quantitative evaluation framework can be used to calculate the seismic resilience of subway stations.
Improving the seismic resilience of underground structures can be achieved by adopting seismic mitigation measures at the beginning of design or by accelerating post-earthquake repair. In essence, the two strategies have different effects on seismic resilience. The former mainly improves the seismic resilience by improving the residual function of the structure, while the latter improves the seismic resilience by shortening the repair time and increasing the proportion of the functional recovery quantity during the repair process.
The study case shows that the seismic resilience of a subway station can be improved by adopting seismic mitigation measures. FPB showed to have obvious effects on improving the seismic resilience of subway stations: the functional recovery index was improved by 22–30%, and the economic loss decreased by 43–75%. The improvement of seismic resilience is related to the effect of seismic mitigation measures. When the friction coefficient of PFB is large and the sliding concave surface radius is small, the improvement effect of seismic resilience is improved. Equally, the seismic resilience of a station can be improved by increasing the number of repair workers. In this study case, by increasing the number of repair workers, the functional recovery index of the station increased by 5–25%, and the economic, loss decreased by 10–48%. In addition, accelerating the repair of components that have a great influence on the performance of subway stations will significantly improve the station’s seismic resilience.
Data Availability Statement
The raw data supporting the conclusion of this article will be made available by the authors, without undue reservation.
Author Contributions
ZD, SW, and SK contributed to conception and design of the study. Write, ZD and CL; Modification, ZD and CL; Simulation analysis and formula derivation, CL and PZ. All authors contributed to manuscript revision, read, and approved the submitted version.
Funding
This work is supported by Natural Science Foundation of Henan Province (No.222300420415) and Training Plan of Young Backbone Teachers in Colleges and Universities of Henan Province (No. 2018GGJS018).
Conflict of Interest
The authors declare that the research was conducted in the absence of any commercial or financial relationships that could be construed as a potential conflict of interest.
Publisher’s Note
All claims expressed in this article are solely those of the authors and do not necessarily represent those of their affiliated organizations, or those of the publisher, the editors and the reviewers. Any product that may be evaluated in this article, or claim that may be made by its manufacturer, is not guaranteed or endorsed by the publisher.
References
Almufti, I., and Willford, M. R. (2013). REDiTM Rating System. London: ARUP. Available at: http://publications.arup.com/publications/r/redi_rating_systemtions.
Anwar, G. A., and Dong, Y. (2020). Seismic Resilience of Retrofitted RC Buildings. Earthq. Eng. Eng. Vib. 19 (3), 561–571. doi:10.1007/s11803-020-0580-z
Bruneau, M., Chang, S. E., Eguchi, R. T., Lee, G. C., O'Rourke, T. D., Reinhorn, A. M., et al. (2003). A Framework to Quantitatively Assess and Enhance the Seismic Resilience of Communities. Earthquake Spectra 19 (4), 733–752. doi:10.1193/1.1623497
Capacci, L., Biondini, F., and Titi, A. (2020). Lifetime Seismic Resilience of Aging Bridges and Road Networks. Struct. Infrastructure Eng. 16 (2), 266–286. doi:10.1080/15732479.2019.1653937
Chang, S. E., and Shinozuka, M. (2004). Measuring Improvements in the Disaster Resilience of Communities. Earthquake Spectra 20 (3), 739–755. doi:10.1193/1.1775796
Chen, F. Q., Tian, W., Liu, Z. G., and Zhang, Z. K. (2014). Experimental Study on Friction Coefficient of Concrete with Matching Pouring Surface. China Harbour Eng. 12, 34–38. doi:10.7640/zggwjs201412008
Chen, Z., and Zhou, Y. (2019). Seismic Performance of Framed Underground Structures with Self-Centering Energy-Dissipation Column Base. Adv. Struct. Eng. 22 (13), 2809–2822. doi:10.1177/1369433219852043
Cimellaro, G. P., and Piqué, M. (2016a). Resilience of a Hospital Emergency Department under Seismic Event. Adv. Struct. Eng. 19 (5), 825–836. doi:10.1177/1369433216630441
Cimellaro, G. P., Reinhorn, A. M., and Bruneau, M. (2006). “Quantification of Seismic Resilience,” in Proceedings of the 8th US National conference on Earthquake Engineering, 1–10. Available at: https://www.researchgate.net/publication/254603471.81094
Cimellaro, G. P., Reinhorn, A. M., and Bruneau, M. (2010). Framework for Analytical Quantification of Disaster Resilience. Eng. Structures 32 (11), 3639–3649. doi:10.1016/j.engstruct.2010.08.008
Cimellaro, G. P., Tinebra, A., Renschler, C., and Fragiadakis, M. (2016b). New Resilience index for Urban Water Distribution Networks. J. Struct. Eng. 142 (8), C4015014. doi:10.1061/(asce)st.1943-541x.0001433
Cutter, S. L., Barnes, L., Barnes, L., Berry, M., Burton, C., Evans, E., et al. (2008). A Place-Based Model for Understanding Community Resilience to Natural Disasters. Glob. Environ. Change 18 (4), 598–606. doi:10.1016/j.gloenvcha.2008.07.013
Cutter, S. L., Burton, C., and Emrich, C. T. (2010). Disaster Resilience Indicators for Benchmarking Baseline Conditions. J. Homel. Secur. Emerg. 7 (1), 1–12. doi:10.2202/1547-7355.1732
Decò, A., Bocchini, P., and Frangopol, D. M. (2013). A Probabilistic Approach for the Prediction of Seismic Resilience of Bridges. Earthquake Engng Struct. Dyn. 42 (10), 1469–1487. doi:10.1002/eqe.2282
Dong, Z. F., Wang, J. J., and Yao, Y. C. (2014). Research on story Drift Angle of Urban Mass Transit Rectangular Underground Structures. Chin. J. Underground Space Eng. 10 (S2), 1848–1852. JournalArticle/5b4341b0c095d716a4c186fe. https://kns.cnki.net/kcms/detail/detail.aspx?FileName=BASE2014S2019&DbName=CJFQ2014
Du, X. L., Wang, Z. L., and Liu, H. T. (2018). Study of a Seismic New System of Underground Frame Structure Based on Toughness Design. Tech. Earthquake Disaster Prev. 13 (03), 493–501.
Du, X. L., and Zhao, M. (2006). Analysis Method for Seismic Response of Arch Aams in Time Domain Based on Viscous-Spring Artificial Boundary Condition. J. Hydraul. Eng. 37 (09), 1063–1069. doi:10.3321/j.issn:0559-9350.2006.09.006
FEMA. (2005). HAZUS-MH Version 1.1. FEMA’s Software Program for Estimating Potential Losses from Disasters. USA, Washington (DC). Available at: https://www.fema.gov/flood-maps/products-tools/hazus.
Fu, Z., Gao, R., and Li, Y. (2021). Measuring Seismic Resilience of Building Portfolios Based on Innovative Damage Ratio Assessment Model. Structures 30, 1109–1126. doi:10.1016/j.istruc.2021.01.041
Gao, T. T., and Wang, W. H. (2014). Study on City Traveling Cost Based on Time Value. Railway Transport and Economy 36 (02), 1–3+10. doi:10.3969/j.issn.1003-1421.2014.02.001
GB/T 18208.4-2011 (2011). Earthquake Field Work-Part 4: Assessment of Direct Disaster Losses. Beijing: Seismological Press.
GB/T 38591-2020 (2020). Standard for Seismic Resilience Assessment of Buildings. Beijing: China Architecture and Building Press.
GB50909-2014 (2014). Code for Seismic Design of Urban Rail Transit Structures. Beijing: China Planning Press.
Huang, C., and Huang, S. (2021). Seismic Resilience Assessment of Aging Bridges with Different Failure Modes. Structures 33, 3682–3690. doi:10.1016/j.istruc.2021.06.066
Iida, H., Hiroto, T., Yoshida, N., and Iwafuji, M. (1996). Damage to Daikai Subway Station. Soils and Foundations 36, 283–300. doi:10.3208/sandf.36.special_283
Ishibashi, H., Akiyama, M., Frangopol, D. M., Koshimura, S., Kojima, T., and Nanami, K. (2021). Framework for Estimating the Risk and Resilience of Road Networks with Bridges and Embankments under Both Seismic and Tsunami Hazards. Struct. Infrastructure Eng. 17 (4), 494–514. doi:10.1080/15732479.2020.1843503
Jia, P., and Chen, Z. (2021). Seismic Reduction Effectiveness of Friction Pendulum Bearings in Underground Station Structures. Int. J. Comput. Methods 18 (03), 2041008. doi:10.1142/S021987622041008X
Kafali, C., and Grigoriu, M. (2005). Rehabilitation Decision Analysis. 9th International Conference on Structural Safety and Reliability. Rome, Italy, 19–23.
Lee, J., and Fenves, G. L. (1998). Plastic-Damage Model for Cyclic Loading of Concrete Structures. J. Eng. Mech. 124 (8), 892–900. doi:10.1061/(asce)0733-9399(1998)124:8(892)
Li, T. B. (2008). Failure Characteristics and Influence Factor Analysis of Mountain Tunnels at Epicenter Zones of Great Wenchuan Earthquake. J. Eng. Geology. 16 (6), 742–750. doi:10.3969/j.issn.1004-9665.2008.06.003
Li, Y. M., Yang, L., Liu, S. Y., and Luo, W. W. (2017). Method of Failure Mode Evaluation of Structure Based on Seismic Resilience index. J. Zhejiang Univ. Eng. Sci. 51 (11), 2197–2206. doi:10.3785/j.issn.1008-973X.2017.11.014
Li, Z. S., Li, N., Cimellaro, G. P., and Fang, D. P. (2020). System Dynamics Modeling-Based Approach for Assessing Seismic Resilience of Hospitals: Methodology and a Case in china. J. Manage. Eng. 36 (5), 04020050. doi:10.1061/(asce)me.1943-5479.0000814
Liu, J. B., and Li, B. (2005). Three-Dimensional Viscoelastic Static-Dynamic Unified Artificial Boundary. Scientia Sinica (Technologica) 35 (09), 72–86. doi:10.3321/j.issn:1006-9275.2005.09.008
Liu, K. Z., Zhai, C. H., and Dong, Y. (2021). Optimal Restoration Schedules of Transportation Network Considering Resilience. Struct. Infrastruct. E 17 (8), 1141–1154. doi:10.1080/15732479.2020.1801764
Liu, Y., Lin, J. Q., Liu, J. L., and Lin, Q. L. (2017). Seismic Resilience Assessment Method for RC Beam Bridge. J. Catastrophology 32 (04), 224–229. doi:10.3969/j.issn.1000-811X.2017.04.038
Lou, M. L., Wang, W. J., and Zhu, T. (2000). Soil Lateral Boundary Effect in Shaking Table Model Test of Soil-Structure System. Earthq. Eng. Eng. Dyn. 20 (2), 30–36. doi:10.3969/j.issn.1000-1301.2000.04.005
Lu, D. C., Feng, K. W., and Du, X. L. (2018). Study on the Seismic Response of Underground Structure Considering the Constraint of Surrounding Soil. J. Disaster Prev. Mitigation Eng. 38 (04), 591–598. doi:10.13409/j.cnki.jdpme.2018.04.001
Lu, D. C., Ma, C., Du, X. L., and Wang, Z. H. (2021). Earthquake Resilience of Urban Underground Structures: State of the Art. Scientia Sinica(Technologica) 51, 1–15. doi:10.1360/SST-2021-0013
Lu, D., Wu, C., Ma, C., Du, X., and El Naggar, M. H. (2020). A Novel Segmental Cored Column for Upgrading the Seismic Performance of Underground Frame Structures. Soil Dyn. Earthquake Eng. 131, 106011. doi:10.1016/j.soildyn.2019.106011
Lubliner, J., Oliver, J., Oller, S., and Oñate, E. (1989). A Plastic-Damage Model for concrete. Int. J. Sol. Structures 25 (3), 299–326. doi:10.1016/0020-7683(89)90050-4
Ma, C., Lu, D., and Du, X. (2018). Seismic Performance Upgrading for Underground Structures by Introducing Sliding Isolation Bearings. Tunnelling Underground Space Tech. 74, 1–9. doi:10.1016/j.tust.2018.01.007
Mayunga, J. S. (2009). Measuring the Measure: A Multi-Dimensional Scale Model to Measure Community Disaster Resilience in the US Gulf Coast Region. [dissertation/master’s thesis]. College Station, TX: Texas A&M University.
Padgett, J. E., and DesRoches, R. (2007). Bridge Functionality Relationships for Improved Seismic Risk Assessment of Transportation Networks. Earthq. Spectra. 23 (1), 115–130. doi:10.1193/1.2431209
Resilience Alliance (2010). Assessing Resilience in Social-Ecological systems:Workbook for Practitioners. Version 2.0. Available at: http://www.resalliance.org/3871.php.
Salado Castillo, J. G., Bruneau, M., and Elhami-Khorasani, N. (2022). Functionality Measures for Quantification of Building Seismic Resilience index. Eng. Structures 253, 113800. doi:10.1016/j.engstruct.2021.113800
Shang, Q., Wang, T., and Li, J. (2020). A Quantitative Framework to Evaluate the Seismic Resilience of Hospital Systems. J. Earthquake Eng., 1–25. doi:10.1080/13632469.2020.1802371
Wang, W. L., Wang, T. T., Su, J. J., Lin, C. H., Seng, C. R., and Huang, T. H. (2001). Assessment of Damage in Mountain Tunnels Due to the Taiwan Chi-Chi Earthquake. Tunnelling Underground Space Tech. 16, 133–150. doi:10.1016/S0886-7798(01)00047-5
Wang, Z., Gao, B., Jiang, Y., and Yuan, S. (2009). Investigation and Assessment on Mountain Tunnels and Geotechnical Damage after the Wenchuan Earthquake. Sci. China Ser. E-technol. Sci. 52 (2), 546–558. doi:10.1007/s11431-009-0054-z
Xu, C. S., Wang, Y. X. S., Du, X. L., Xu, Z. G., and Zhang, X. H. (2021). Seismic Mitigation Effects of Split Columns in Underground Station Structures. Chin. J. Geotechnical Eng. 43 (4), 624–633. doi:10.11779/CJGE202104004
Xu, Z., Du, X., Xu, C., and Han, R. (2020). Numerical Analyses of Seismic Performance of Underground and Aboveground Structures with Friction Pendulum Bearings. Soil Dyn. Earthquake Eng. 130 (C), 105967. doi:10.1016/j.soildyn.2019.105967
Xue, R. G., Huang, L. H., Gong, H. J., Qiao, B. J., and Lu, X. Z. (2021). Seismic Resilience Assessment Analysis of a Teaching Building Based on Standard for Seismic Resilience Assessment of Buildings. Building Struct. 51 (1), 60–65. doi:10.19701/j.jzjg.2021.01.012
Yang, J., Li, D. P., Zhai, C. H., Zhou, Y., Lu, X. Z., Liu, W., et al. (2019). The Research Status and Key Scientific Problems of Urban Seismic Resilience. Bull. Natl. Nat. Sci. Found. China 33 (5), 525–532. doi:10.16262/j.cnki.1000-8217.2019.05.018
Yu, X. H., Dai, K. Y., Li, Y. S., and Li, B. (2021). Seismic Resilience Assessment of Corroded Reinforced concrete Structures Designed to the Chinese Codes. Earthq. Eng. Eng. Vib 20 (02), 303–316. doi:10.1007/s11803-021-2021-z
Yuan, H., Zhang, W., Zhu, J., and Bagtzoglou, A. C. (2018). Resilience Assessment of Overhead Power Distribution Systems under strong Winds for Hardening Prioritization. Asce-asme J. Risk U. A. 4 (4), 04018037. doi:10.1061/AJRUA6.0000988
Zheng, Y., and Yue, C. (2020). Shaking Table Test Study on the Functionality of Rubber Isolation Bearing Used in Underground Structure Subjected to Earthquakes. Tunnelling Underground Space Tech. 98, 103153. doi:10.1016/j.tust.2019.103153
Keywords: underground station, seismic resilience, friction pendulum bearing, resilience improvement, recovery model
Citation: Dong Z, Li C, Wen S, Zhai P and Kang S (2022) Study on Seismic Resilience Quantitative Framework of Subway Stations and Resilience Improvement Strategy. Front. Earth Sci. 10:869965. doi: 10.3389/feart.2022.869965
Received: 05 February 2022; Accepted: 22 February 2022;
Published: 11 March 2022.
Edited by:
Chaojun Jia, Central South University, ChinaReviewed by:
Xia Xiushen, Lanzhou Jiaotong University, ChinaYong Huang, China Earthquake Administration, China
Copyright © 2022 Dong, Li, Wen, Zhai and Kang. This is an open-access article distributed under the terms of the Creative Commons Attribution License (CC BY). The use, distribution or reproduction in other forums is permitted, provided the original author(s) and the copyright owner(s) are credited and that the original publication in this journal is cited, in accordance with accepted academic practice. No use, distribution or reproduction is permitted which does not comply with these terms.
*Correspondence: Zhengfang Dong, dzf@henu.edu.cn
†These authors have contributed equally to this work and share first authorship