 Zhengfang Dong
 Chenyang Kuo2
94% of researchers rate our articles as excellent or good
Learn more about the work of our research integrity team to safeguard the quality of each article we publish.
Find out more
ORIGINAL RESEARCH article
Front. Earth Sci. , 25 October 2021
Sec. Geohazards and Georisks
Volume 9 - 2021 | https://doi.org/10.3389/feart.2021.779879
This article is part of the Research Topic Applications of Geotechnical Mechanics in Underground Engineering View all 41 articles
In order to study the longitudinal seismic capacity of shield tunnels, this work applies the structural seismic vulnerability analysis, based on incremental dynamic analysis (IDA), to a shield tunnel and explores the ground motion intensity measure suitable for the shield tunnel in different site types. The failure probability of the structure at each earthquake intensity is calculated by combining the probabilistic seismic demand model with the limits on the engineering demand parameters to establish the seismic vulnerability curve of the structure. The results indicate that the peak ground velocity (PGV) is the ground motion intensity measure suitable for the longitudinal seismic performance of the shield tunnel. The site type has the most profound influence on the extent of the longitudinal damage to the shield tunnel, and site type IV is the most dangerous under an earthquake. Further, the tunnel has stronger seismic resistance in the elastoplastic stage. The low-grade bolts between the rings damage more severely than the high-grade bolts. A tunnel with either a great depth of burial or a large cross section is more dangerous than the one with either a small depth of burial or a small cross section. The risk of the axial tension-compression failure of the shield tunnel is higher than that of the horizontal transverse shear failure.
Tunnels are an essential component of urban lifeline engineering and public social infrastructure and the traffic lifeline of modern metropolises. Their seismic safety and risk analysis have become an essential research topic on urban disaster prevention and reduction. Some studies have reported that underground structures and tunnels seriously damage under strong earthquakes (Pitilakis and Tsinidis, 2014). In addition, the construction of tunnels is expensive, and it is difficult to recover a damaged tunnel. Therefore, it is essential to conduct seismic research into tunnels.
At present, the risk analysis of earthquakes is chiefly qualitative, and the quantitative evaluation of the probability and consequences of earthquakes is not possible. The evaluation of the vulnerability to earthquakes is to determine the probability of damage to structures at various ground motion intensities from a macro perspective, which has become a powerful tool for evaluating the seismic risk of structures. For the study of the fragility curve, the methods of earthquake damage investigation and expert evaluation are primarily used in the early stages to establish the empirical vulnerability curve through statistical regression. Chen et al. (2012) established the seismic risk curve of a highway bridge system in the Wenchuan area based on the investigation of bridge damage caused by the Wenchuan earthquake. Later, some researchers utilized numerical simulation to analyze the structural response statistically and used damage indicators to establish analysis curves with clear probability significance (He et al., 2017). The development of numerical simulation from the elastic spectrum method to the nonlinear pseudo-static method and then to the nonlinear time-history analysis method was substantially parallel to the seismic response analysis. Jernigan and Hwang (2002) employed the elastic spectrum method to obtain the bridge fragility curves in Memphis. In another work, Hwang and Liu (2004) used the pushover method to analyze the vulnerability of a highway system affected by an earthquake in the eastern United States.
The research on the vulnerability of ground structures has lagged behind that on underground structures. So far, the seismic vulnerability analysis of tunnels has chiefly been based on the previous cases of damage to tunnels completed by expert judgment or empirical fragility curves (Pitilakis and Tsinidis, 2014). However, the analytical methods widely used in ground structures are very limited in researching tunnel vulnerability. Argyroudis and Pitilakis (2012) employed a pseudo-static method to analyze the vulnerability of shield tunnels and proposed relative bending moment performance indicators suitable for underground structures. Huang et al. (2017) studied the seismic vulnerability of mountain tunnels based on Argyroudis’s research (2012). Qiu et al. (2018) determined the seismic fragility curves based on the pseudo-spectral acceleration (PSA) in the entire period of a circular rock mountain tunnel and examined the effects of the rock parameters, the depth of burial of the tunnel, the diameter of the tunnel, and the thickness of the tunnel lining. Argyroudis et al. (2017) considered the soil-structure interaction (SSI) and the aging effect caused by the corrosion of the lining reinforcement and determined the vulnerability curves of shallowly buried tunnels through two-dimensional nonlinear dynamic analysis. For studying the seismic vulnerability of underground structures, a typical cross section of the structure is generally selected for two-dimensional finite element analysis, and the influence of the longitudinal seismic response of underground structures such as subway tunnels is not considered (Huang and Zhang, 2021). The longitudinal seismic vulnerability analysis needs to be carried out in depth for highly long linear underground structures to reveal the longitudinal influence mechanism of underground structures and the development law of seismic vulnerability.
The incremental dynamic analysis (IDA) has widely been used in structural fragility analysis. Bertero (1977) first proposed the basic idea of the IDA, and then it was widely used in seismic fragility analysis of bridges and buildings (Zhang and Huo, 2009; Lv et al., 2012; Wu et al., 2012; Zhang et al., 2018). As a method for structural seismic analysis, the IDA employs statistical methods to analyze the results after a large number of numerical calculations that limit the application of this method. In this regard, many scholars have improved the shortcomings of the IDA in the practical application of diverse structures (Vamvatsikos and Cornell, 2005; Yang et al., 2008; Wang et al., 2012; Huang et al., 2020).
The ground motion intensity measure is an essential part of seismic fragility analysis and correlates the risk of ground motion with the engineering demand parameters. Reasonable ground motion intensity measures can effectively reduce the dispersion of structural response prediction results. At present, the peak ground acceleration (PGA) or the peak ground velocity (PGV) is usually used as the ground motion intensity index in the seismic vulnerability analysis of underground structures. According to the relevant literature (Huang and Zhang, 2021), the PGA, as the most widely employed ground motion intensity index, accounts for 65.96%, and the PGV and the peak ground displacement (PGD) account for 14.89 and 6.38% respectively. Other ground motion intensity parameters are rarely used. Huang et al. (2020) reported that for the lateral seismic analysis of tunnels shallowly buried in soft soil, the PGA had a more significant correlation with the structural failure index than the PGV. Thus, the PGA is currently a more appropriate seismic intensity index in seismic vulnerability analysis. Anastasopoulos et al. (2007) inferred from the longitudinal seismic analysis of an immersed tunnel that the PGV had a closer correlation with the structural failure index than the PGA. Zhong et al. (2020) took a two-story, three-span subway station as the research object and compared the results of the discrete analysis of the PGA, the PGV, the PGD, and the IDA at different depths of burial of a non-free site. They concluded that the PGA was the seismic strength index suiting the subway station. It can, therefore, be seen that the PGA is not the most ideal ground motion intensity index for different underground structure conditions.
Considering a typical shield tunnel as an engineering case, we extend the structural seismic vulnerability evaluation based on the IDA to the longitudinal seismic performance evaluation of shield tunnels. By calculating the structural seismic response, the standard seismic intensity indices are compared and analyzed, and the longitudinal seismic intensity indices suitable for the structure of shield tunnels are proposed. By comparing diverse working conditions, the seismic vulnerability curves of shield tunnels under various influencing factors are established, which provides a basis for predicting damage to shield tunnels under different ground motions.
As a parametric analysis method, IDA has commonly been used to evaluate structural performance under the action of ground motion in recent years. The method is to adjust the amplitude of the ground motion records at a particular proportion, and the ground motion intensity after the amplitude modulation is used as the input of the structure to calculate the dynamic time history.
However, calculating the dynamic time history under earthquakes requires considering the nonlinear effects of soil mass and the dynamic boundary effect of the soil-structure interaction model, which makes the convergence of the model time-consuming and challenging. Therefore, the dynamic time-history method is replaced by the longitudinal response displacement method. The response displacement method considers that the response of underground structures during an earthquake depends on the movement of the surrounding strata. The relative displacement of the strata during an earthquake is simulated in the form of a static load through a foundation spring to determine the internal force on the structure. The equivalent linearization is also used to consider the soil nonlinearity, which avoids the problems of the many nonlinear constitutive models of soil, the easy nonconvergence of the calculations, and the dynamic boundary effect. The theory of the reaction displacement method is mature, and its error is controllable (Liu et al., 2019); the calculation workload and time are significantly reduced. It can improve the efficiency and make it possible to calculate the longitudinal seismic vulnerability of long-line, underground structures by the IDA.
In calculating the seismic demand model and the IDA, selecting the comprehensive ground motion intensity parameters and the engineering demand parameters is a prerequisite, which ensures the accuracy of the IDA results and affects the evaluation of the ground motion intensity index.
Combined with the peak value, spectrum characteristics, and duration of the ground motion records, six ground motion intensity measures are selected for the ground motion intensity parameters: the PGA, PGV, and PGD considering the seismic peak parameters; the pseudo-spectral acceleration considering the seismic spectral parameters; and the root-mean-square acceleration (RMSA) and Arias intensity considering the seismic duration parameters.
Generally, long underground structures have a large number of longitudinal joints. The longitudinal seismic performance of general tunnels chiefly considers the waterproofness performance requirements of the structural joints, so the amount of the ring joint opening and the dislocation are considered the engineering demand parameters. The amount of the ring joint opening primarily reflects the deformation caused by the axial tension, compression, and bending of the shield tunnel. The dislocation chiefly represents the deformation caused by the horizontal and transverse shear of the shield tunnel.
A cluster of IDA curves is obtained, and the statistical analysis of the cluster of the IDA curves is used to derive the structural seismic demand model. The structural seismic demand model is then employed to further evaluate the strength and weakness of the intensity measure (IM). The specific steps are as follows:
a) The modified IDA method is used to calculate the maximum response measure (EDPi) of the simplified analysis model under the ith seismic record.
b) n ground motion records are calculated to obtain n discrete points. Then, the natural logarithm of these points is taken to generate a series of data points [ln(EDPi), ln(IMi)]. Afterward, the natural logarithmic points are drawn in the plane coordinate system.
c) The model parameters are adjusted to determine the tunnel structure under diverse site types. Steps (a) and (b) are repeated to obtain the cluster of the IDA curves of the tunnels for various site types.
d) The linear regression of the points on these curves is done based on the cluster of the IDA curves. The related literature shows that there is an exponential relationship between the engineering demand parameter (EDP) and the ground motion intensity measure (IM) of the structure, as expressed in Eq. 1, which is the structural seismic demand model (Baker and Cornell, 2008; Padgett et al., 2008; Baker and Cornell, 2010). By taking the natural logarithm of both sides of Eq. 1, we can transform it into a linear relationship, as delineated in Figure 1.
where α and β are the regression coefficients.
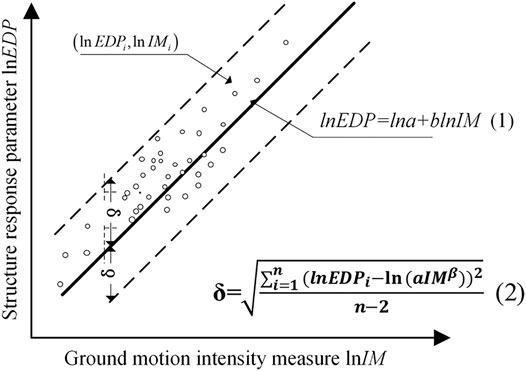
FIGURE 1. A schematic of the structural seismic demand model.
The dispersion and correlation coefficients of ln(EDP) and ln(IM) can be obtained from the seismic demand model of the structure. In Figure 1 and Eq. 2 calculate the dispersion (δ). Eq. 2 calculate the correlation (ρ).
where cov(EDP, IM) is the covariance between EDP and IM; D(EDP) and D(IM) indicate the standard deviation of EDP and IM respectively;
a) Correlation (ρ) is calculated by Eq. 2, and its value ranges from –1 to 1. The absolute value of ρ, i.e., |ρ|, is closer to one when there is a stronger correlation between the engineering requirements and the ground motion intensity measure of the research structure.
b) Efficiency is expressed by dispersion and is the opposite of the correlation. The ground motion intensity measure is more effective when δ is smaller (Giovenale et al., 2010).
c) Practicality is expressed by the size of the regression coefficient (b) in the structural demand model. Practicality refers to the degree to which EDP depends on the IM. The practicality of an intensity measure parameter is extreme, and the variations in the engineering demand parameters depend very much on the differences in the intensity measure (Luco and Cornell, 2007).
d) Proficiency (ζ) considers a composite measure of the effectiveness and the practicability simultaneously as given by Eq. 3 (Shafieezadeh et al., 2012):
where
(Baker and Cornell, 2008; Baker and Cornell, 2010) pointed out an exponential relationship between the engineering demand parameters and the intensity measure. This paper assumes that there is an exponential correlation between the mean of the EDP (SD) and the IM as well, and taking the natural logarithm of both sides of such a relation yields the following equation:
where a and b are the regression coefficients that can be obtained from the regression analysis of a large amount of data calculated by the modified IDA. Eq. 4 is an expression with the intensity measure as the only independent variable.
The seismic fragility curve represents the failure probability of a structure under diverse ground motion intensities, which is the probability that the structural response exceeds the limit value of the structural capacity under the condition of a given earthquake intensity index; it is a conditional probability and can be expressed in Eq. 5:
where Pf is the surpassing probability of the structure, C denotes the seismic capacity of the structure, and D represents the seismic requirement of the structure; C and D are independent random variables, and both obey a normal distribution. SC is the mean of the seismic capacity of the structure. σC indicates the standard deviation of the seismic capacity of the structure, and σD is the standard deviation of the seismic requirements of the structure. This work only considers the randomness of the ground motion intensity and does not take the randomness of the structure into account; thus, σC is equal to zero in Eq. 5, and σD is defined as a function of IM as an independent variable. Pf is given by:
where
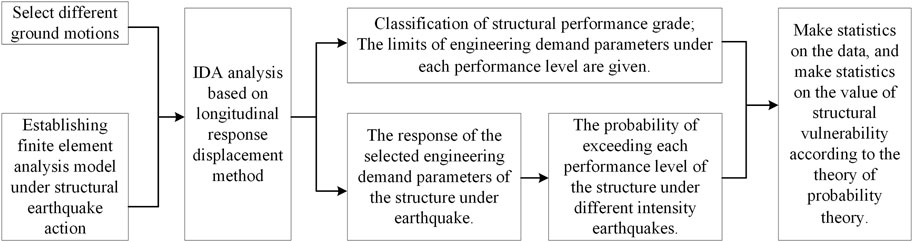
FIGURE 2. The process of the structural seismic vulnerability analysis.
The shield tunnel is selected from a section of rail transit in China. The circumferential bolt layout of the tunnel is shown in Figure 3, and the parameters of the corresponding concrete pipe section are presented in Table 1. The elastic modulus is 34.5 Gpa and Poisson’s ratio is 0.2 of shield tunnel segment. According to the site type regulations described in the code for Seismic Design of Urban Rail Transit Structures (GB50909-2014GB50909-2014), the site is divided by the equivalent velocity of the shear wave of the soil layer and the thickness of the overburden layer. The thickness of the soil layer is set at 90 m, and the depth of burial of the underground structure is considered to be 10, 20, and 36 m respectively. Site types II, III, and IV are also selected since shield tunnels are rarely used in site type I in practical engineering. The specific physical parameters of the soil layer are listed in Table 1.
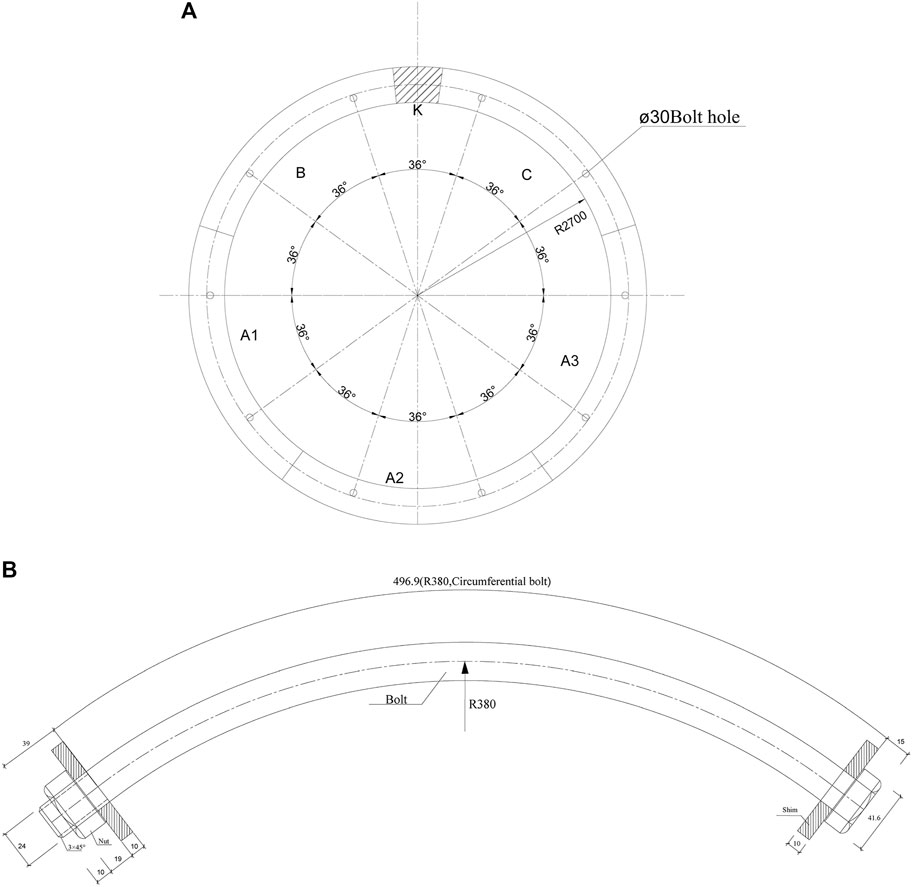
FIGURE 3. (A) The layout of the circumferential bolts and (B) the ring bolt detail of the shield tunnel in an engineering section.
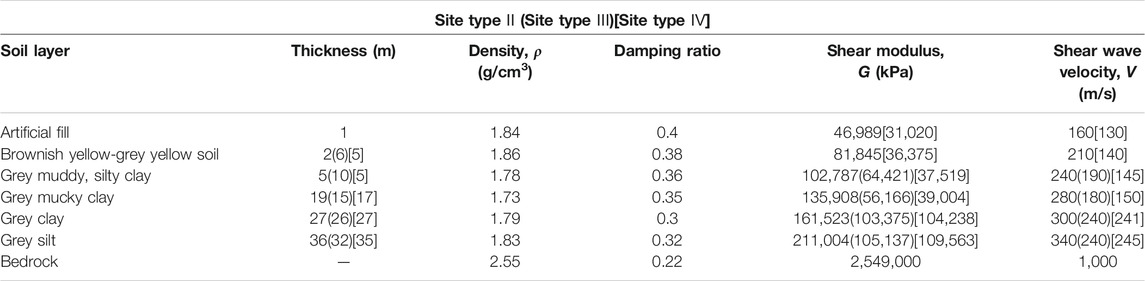
TABLE 1. The parameters of the soil layer.
The equivalent linearization is used to consider the nonlinearity of the soil according to the division of the site type and the specific parameters of the soil layer. Figure 4 delineates the variation in the shear modulus and damping ratio of the cohesive soil (clay), the sandy soil, and the rocky soil with the shear strain.
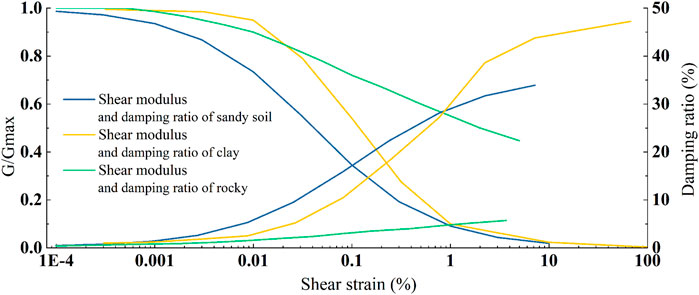
FIGURE 4. The variation in the shear modulus and damping ratio of the clay, the sandy soil, and the rocky soil with the shear strain.
The longitudinal response displacement method is employed to model the tunnel, and the tunnel is assumed to be a beam element. Because many bolts connect the shield tunnel in the longitudinal direction, the treatment of the mechanical model of the structural ring joints directly affects the calculation accuracy. There are two modeling methods commonly used for ring joints: the equivalent homogeneous beam model shown in Figure 5B and the beam-spring model depicted in Figure 5C. The equivalent stiffness model does not consider the influence of ring joints. Moreover, although the model is simple, it overestimates the stiffness of tunnel lining, which quickly causes the results to differ from the actual situation. The beam-spring model can more accurately simulate the mechanical properties of ring joints and is closer to the structural response under actual seismic conditions. However, the beam-spring model has high requirements for selecting the spring parameters, and reasonable spring parameters significantly impact on the accuracy of the results. This work uses the beam-spring model for the calculations, and the longitudinal length of the model is 1,080 m Atsushi (2009). Abaqus finite element software selects the three-dimensional linear Timoshenko beam element (B31) with an annular cross section for the simulation. The overall model of the shield tunnel is shown in Figure 5A.
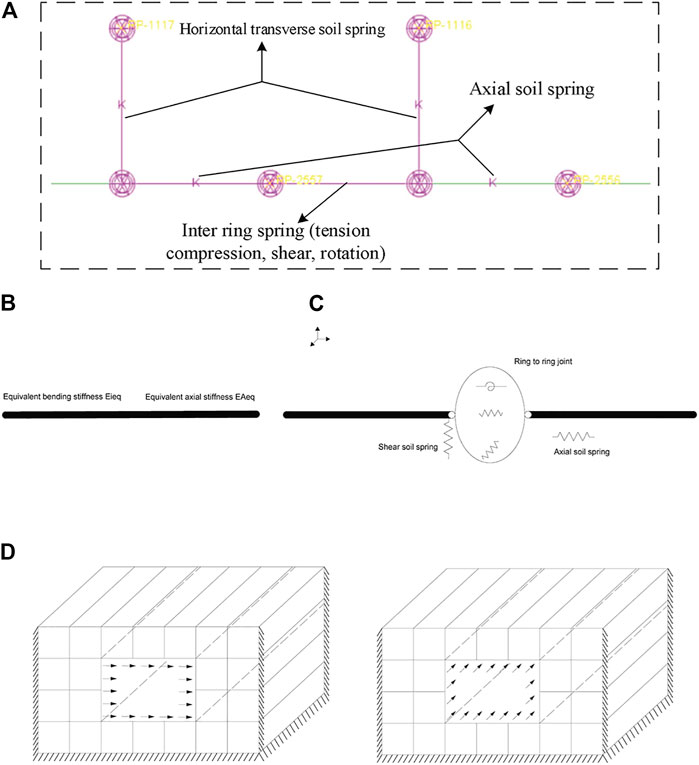
FIGURE 5. (A) The overall model of the shield tunnel, the model of the ring joints; (B) The equivalent stiffness model; (C) The beam-spring model and (D) calculate the base bed coefficient model.
Considering the influence of the joint rings of the tunnel, we disconnect and connect each beam element by setting an asymmetric, tension-compression, nonlinear spring; bending the nonlinear spring; and shearing the spring. For the soil simulation around the shield tunnel, the finite element model of the soil of the excavated structure is established, and the axial uniformly distributed load and the horizontal uniformly distributed load are applied to the structure position. After extracting the average displacement of the structure, the corresponding coefficient of the axial foundation spring and the coefficient of the horizontal transverse foundation spring are determined. The width of the model is considered to be 10 times the thickness of the soil layer Atsushi (2009) to ignore the boundary effects on the soil response, as shown in Figure 5D. To consider the influences of the depth of burial of the tunnel, the dimensions of the cross section of the tunnel, and the strength of the ring joints on the extent of the longitudinal damage to the shield tunnel under an earthquake, Table 2 presents the structural parameters and working conditions of the shield tunnel.
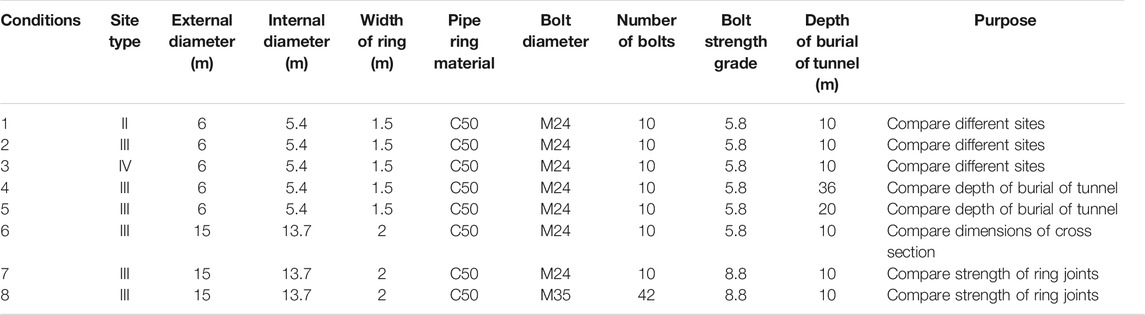
TABLE 2. The comparative working conditions of the shield tunnel.
This paper selects waves according to the site type while taking into account factors such as the peak value, the duration, and the spectrum characteristics of the ground motion record; it also considers the seismic response of the underground structure or the seismic behavior of the structure to be the most unfavorable or dangerous ground motion record (Xie and Zhai, 2003). Thirty seismic waves are selected from the most unfavorable ground motion database of the Pacific Earthquake Engineering Research Center. Then, they are divided according to the site type so that the selected seismic waves are evenly distributed in the three site types, as shown in Figure 6; the ground motion records are also normalized.
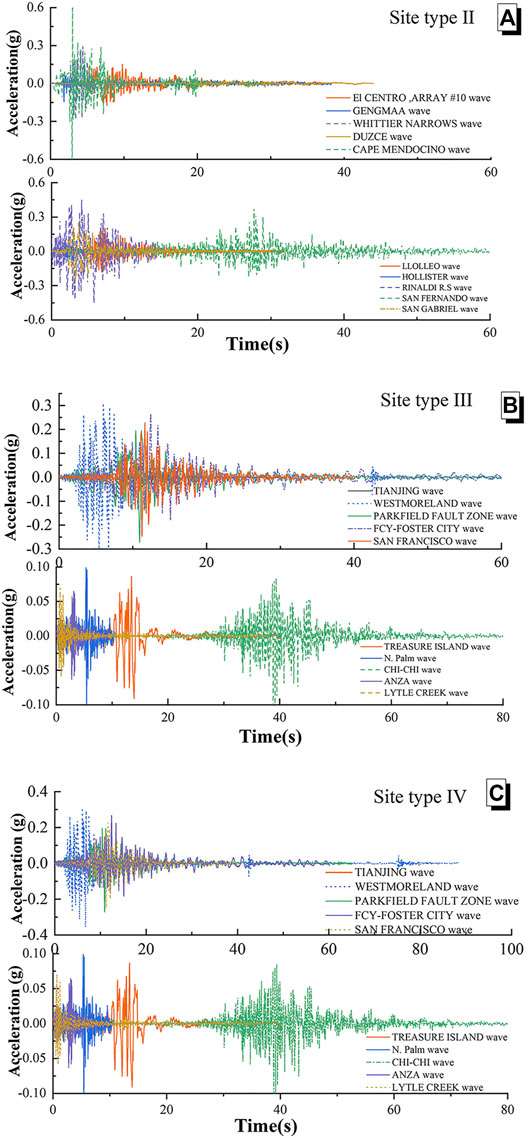
FIGURE 6. The time history of the ground motions in the different site types. (A) Site type II; (B) Site type III; (C) Site type IV.
Conditions 1–3 are calculated based on the IDA process described in Evaluation of Ground Motion Intensity Measure. We draw the results using logarithmic coordinates; then, the linear regression of these discrete points (lnEDPi, lnIMi) is done to obtain the seismic demand model of the structure under each working condition, as shown in Figure 7.
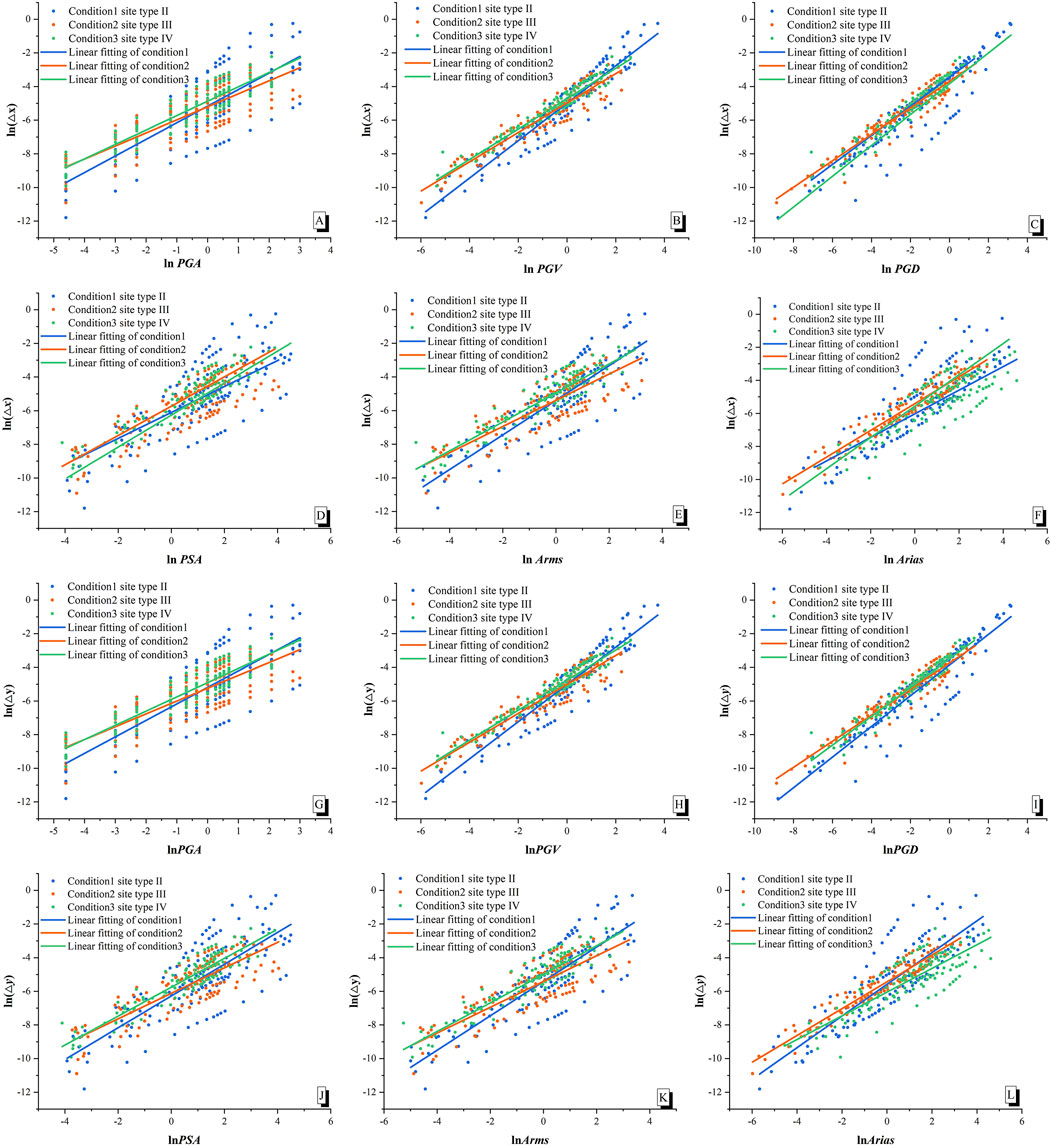
FIGURE 7. (A–F) The statistics for the seismic demand model of the amount of the ring joint opening and (G–L) the statistics for the seismic demand model of the dislocation.
Figure 7 demonstrate that the distribution of the discrete points of the various site types (working conditions) is different, and the fitted regression curves differ. In other words, there are different structural seismic demand models for the various ground motion intensity measures. Comparing the distribution of the discrete points in the various site types reveals that the points in site type II are relatively more discrete than those in site types III and IV. However, the difference in the distribution of the discrete points under the three working conditions is not noticeable. The slope of the regression curves corresponds to the practicability coefficient in the ground motion intensity measure. According to the fitted regression curves in Figure 7, the ground motion intensity measure can be preliminarily evaluated. Site types II–IV have the same law. Taking site type II as an example, the slope of the fitted curve drawn using the PGV and the PGD as the ground motion intensity indicators is steep, and the dispersion degree of each point in the corresponding figure is small. Therefore, the PGV and PGD are better indexed when using practicability to evaluate the ground motion intensity measures. The amount of the ring joint opening and the dislocation correlate closely with the PGV and PGD.
Figure 8 delineate the variation curves of EDP corresponding to the shield tunnel and the ground motion intensity measures.
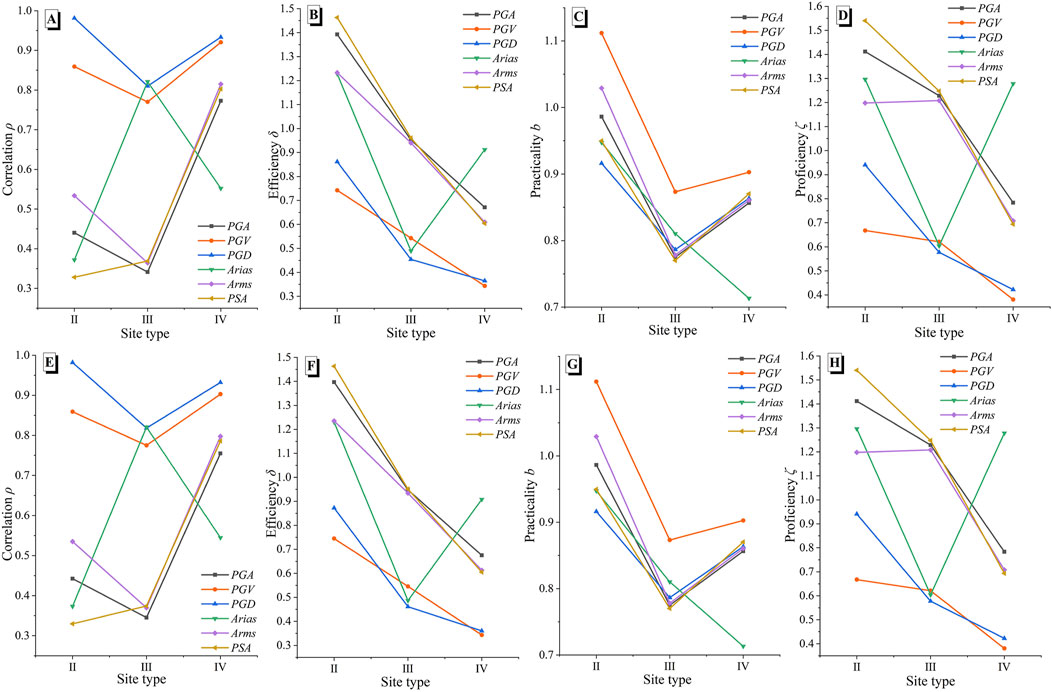
FIGURE 8. (A–D) The variation law of the intensity measures corresponding to the amount of the ring joint opening and (E–H) the variation law of the intensity measures corresponding to the dislocation.
Figure 8A shows that the coefficient of the correlation between the PGV and the PGD is higher than that of the correlation between the other ground motion parameters. In site type II, the PGD has the largest correlation coefficient of 0.9813, followed by the PGV with a correlation coefficient of 0.8590. In site type III, Arias has the highest correlation coefficient of 0.8215, followed by the PGD with a correlation coefficient of 0.8101. The correlation coefficient of the PGV is 0.7702, which also has a good correlation. In site type IV, the PGD has the highest correlation coefficient of 0.9331, followed by the PGV with a correlation coefficient of 0.9202.
Figure 8B confirms that the effectiveness coefficient of the PGV and PGD is smaller than the other ground motion intensity indices, so the effectiveness of the PGV and PGD improves. The correlation coefficient of the PGV in site types II, III, and IV is 0.7422, 0.5426, and 0.3437 respectively. The PGV has the lowest corresponding dispersion degree in the three site types, and its correlation is good. The practicality coefficient reflects the dependence of EDP on IM. The higher the corresponding coefficient is, the higher the dependence of EDP on IM becomes.
Figure 8C reveals that the selected engineering demand parameters are most dependent on the PGV, and the PGV is the most practical. In site type II, the PGV has the highest practicality coefficient of 1.1118, followed by the Arms with a practicality coefficient of 1.0291. The proficiency comprehensively considers the efficiency and practicality. The smaller the proficiency coefficient is, the lower the randomness and the more reasonable the selected IM is.
According to Figure 8D, the PGV has the best overall proficiency. In site type II, the PGV has the smallest proficiency coefficient of 0.6676. In site type III, the proficiency coefficients of the PGV, PGD, and Arias are almost similar and close to about 0.6. In site type IV, the PGV has the smallest proficiency coefficient of 0.3807.
When the structural engineering demand parameters are taken as the dislocation, the change law of each ground motion intensity measure is consistent with the amount of the ring joint opening. The coefficient of each evaluation index varies markedly in the different site types, so the site type is a critical factor affecting the evaluation of the ground motion intensity measure. In the various sites, the results of the IM corresponding to the longitudinal engineering demand parameters of the shield tunnel, that is, the amount of the ring joint opening and the dislocation, are similar for the various evaluation indices. According to the selected ground motion intensity measure analysis, the PGV has a good performance by the different evaluation criteria. Therefore, the ground motion intensity measure PGV is most suitable for checking the longitudinal seismic calculations of shield tunnels.
We select the amount of the ring joint opening, which can reflect the axial deformation of the structure, and the dislocation, which can represent the shear deformation of the structure, as the engineering demand parameters to determine the longitudinal performance index of the structure. This work summarizes the related indices of shield tunnels by combining the existing specifications with the relevant literature. Moreover, considering the classification of seismic performance in the relevant code, this study presents the limit on the longitudinal performance index of the structure of shield tunnels.
A plurality of precast segments form a pipe ring and thus a shield tunnel through compression assembly, and a ring is connected to another ring by a plurality of bolts. The connection between the rings is the weak link of shield tunnels and the most direct or potential factor in water leakage (Zhou and Yuan, 2009). The deformation of the inter-ring bolts is the key to the evaluation of the waterproofness of tunnels. Regarding the works of Wang (2009a), Wang (2009b), Zhou and Yuan (2009), and Lin et al. (2015) on the amount of the ring joint opening and the allowable range of the dislocation and the Technical Code for Protection Structures of Urban Rail Transit (CJJT202-2013), this work presents the limit on the performance index of the structure of shield tunnels, as listed in Tables 3.
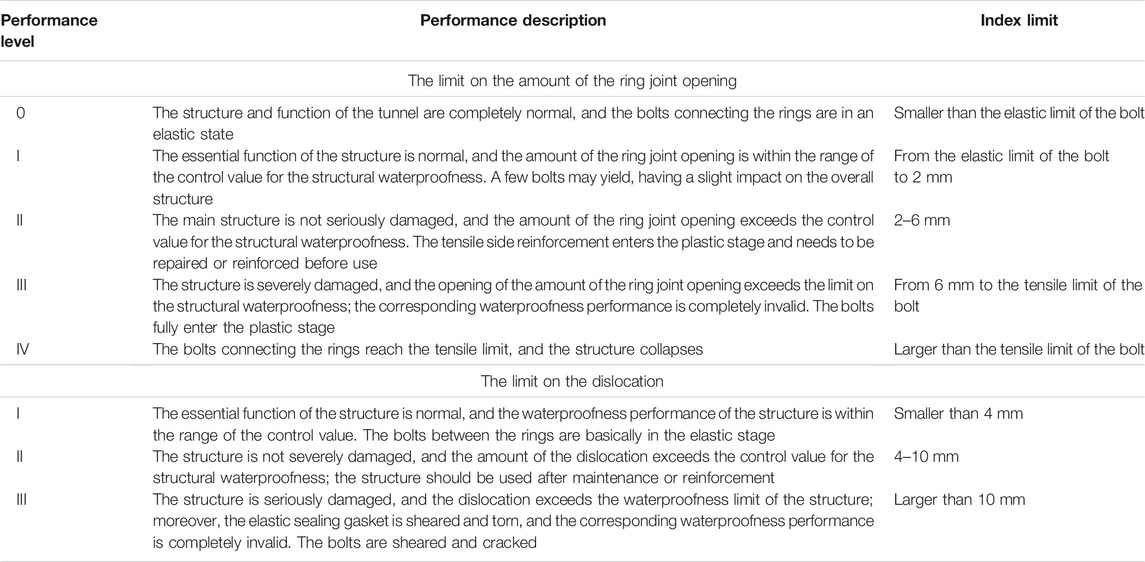
TABLE 3. The limit on the amount of the ring joint opening and dislocation.
In order to compare the two influencing factors, namely the dimensions of the cross section of the tunnel and the strength of the ring joints, we consider working conditions 6–8 for the huge shield tunnels with a diameter of 15 m. Working condition 6 is compared with working condition 2 to study the influence of the dimensions of the cross section of the structure. Working condition 7 changes the grade of the bolts between the rings and maintains the number of the bolts unchanged. In working condition eight, the grade and quantity of the actual bolts connecting the rings of an enormous shield tunnel section are adopted. The effect of the strength of the ring joints is also examined by comparing working conditions 6–8. The specific parameters and the working conditions of the shield tunnel are summarized in Table 2. The PGV is selected as the ground motion intensity measure, and the structural seismic demand model is obtained by calculating working conditions 4–8, as shown in Figure 9.
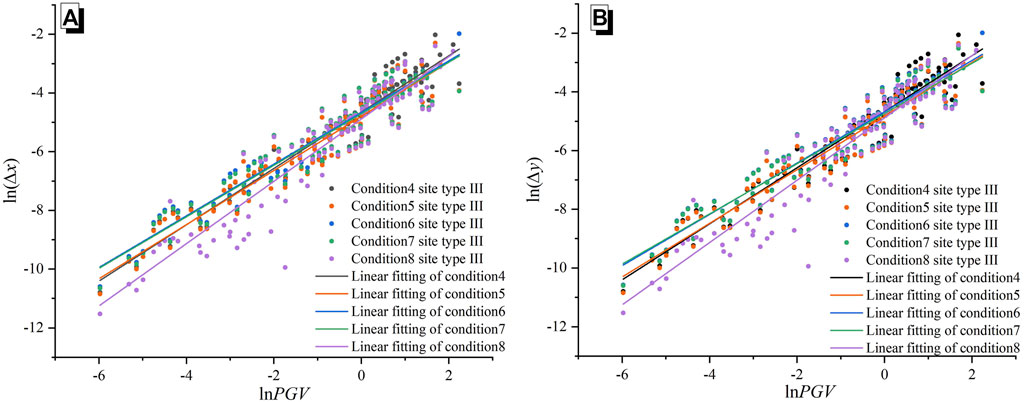
FIGURE 9. The statistics for the structural seismic demand model under working conditions 4–8 (the PGV). (A) the amount of the ring joint opening; (B) the dislocation.
In the fragility functions, SC adopts the data on the structures in different performance states in Tables 1, 2. When the amount of the ring joint opening is used as the engineering demand parameter, the bolt reaches the elastic limit state, and SC is 0.946 mm; the waterproofness design value of SC is 2.0 mm. When the waterproofness limit value is reached, SC is equal to 4.0 mm. When the bolt reaches the tensile limit state, SC equals 24.6 mm. When the dislocation is used as the engineering demand parameter since there is no analytical solution method for the shear spring (Wang et al., 2019), only the design and limit values of the waterproofness of the structural design under transverse shear are analyzed. When the waterproofness limit value is reached, SC is equal to 4.0 mm; when the waterproofness limit value is reached, SC equals 10.0 mm. The expressions of the seismic fragility functions are presented in Table 4, and the corresponding fragility curves are delineated in Figure 10.
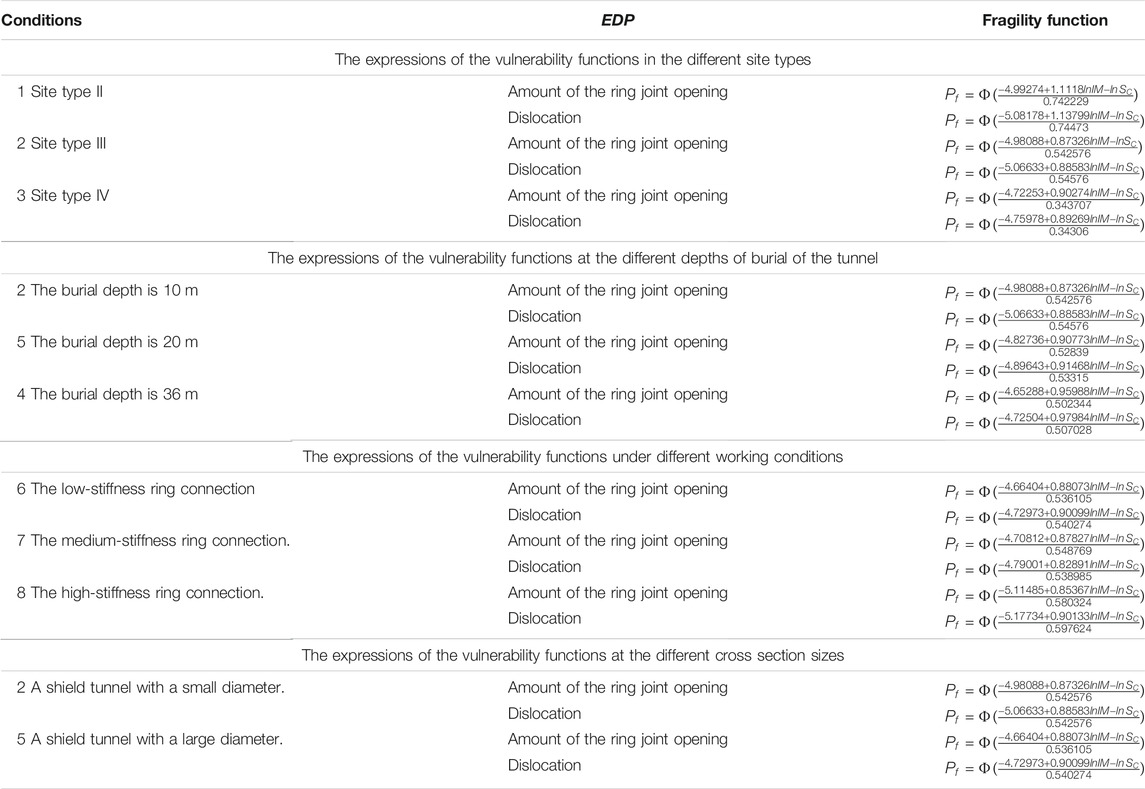
TABLE 4. The expressions of the vulnerability functions.
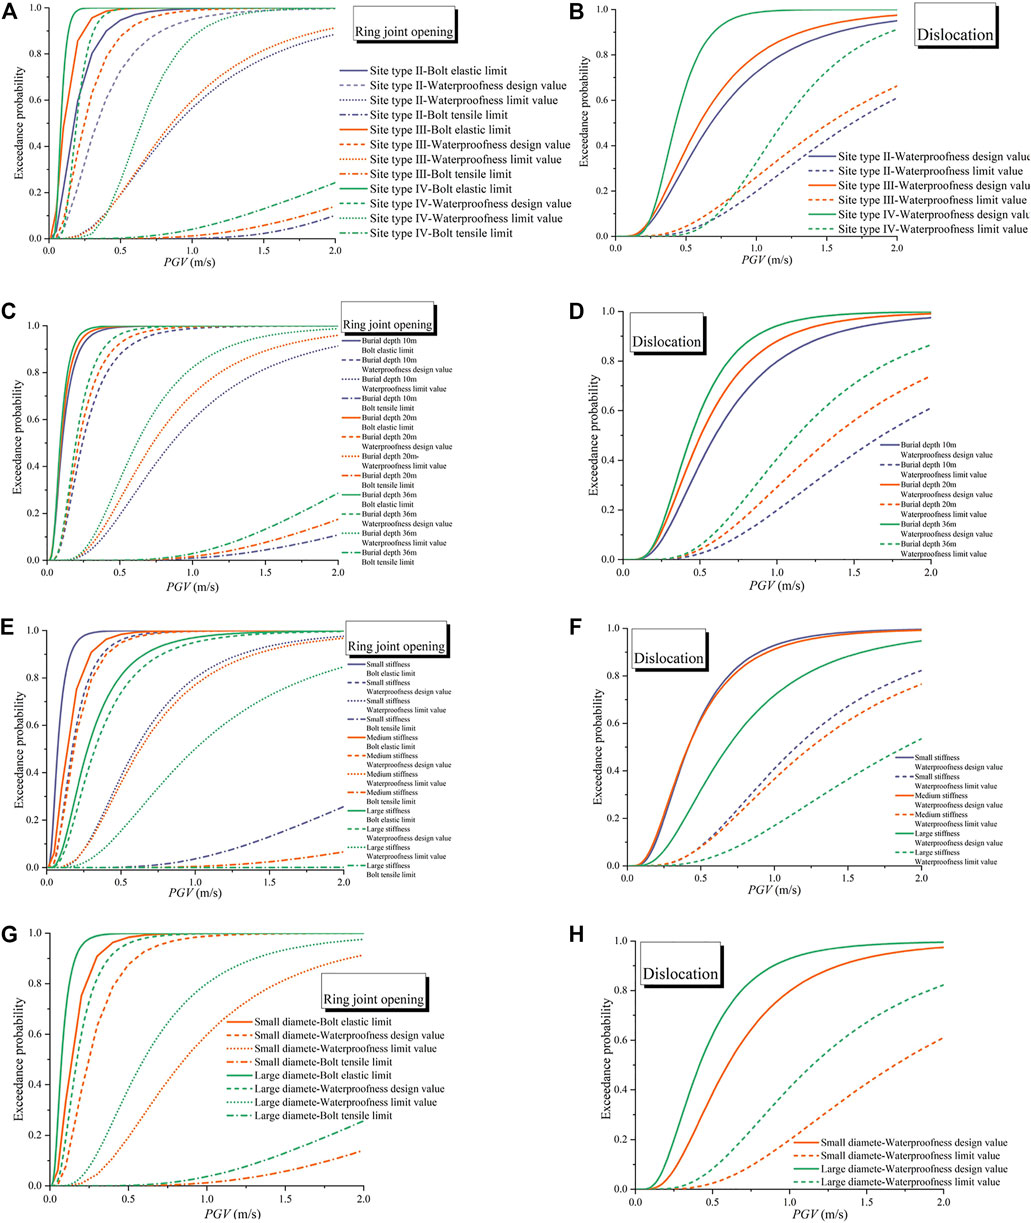
FIGURE 10. The seismic fragility curves of the shield tunnel in the various site types (A,B), the various depths of burial of the tunnel (C,D), various ring spring stiffnesses (E,F) and the various cross section sizes (G,H).
Figure 10A plots the variation of the exceeding probability of the amount of the ring joint opening with the PGV when the structure is in the different site types.
When the PGV is 0.3 m/s, the exceeding probability of the ring bolts reaching the elastic limit state exceeds 50%, while at a PGV of 1.0 m/s, the exceeding probability of the ring bolts reaching the elastic limit state is close to 100%. When the PGV is 1.7 m/s, the exceeding probability of the ring bolts reaching the structural waterproofness design value is close to 100%, while at a PGV of 2.0 m/s, the exceeding probability of the ring bolts reaching the structural waterproofness limit is 88.5%. At this time, the exceeding probability of the ring bolts reaching the tensile limit is about 10%.
When the PGV is 0.2 m/s, the exceeding probability of the ring bolts reaching the elastic limit state exceeds 50%, while at a PGV of 0.8 m/s, the exceeding probability of the ring bolts reaching the elastic limit state is close to 100%. When the PGV is 1.1 m/s, the exceeding probability of the ring bolts reaching the structural waterproofness design value is close to 100%, while at a PGV of 2.0 m/s, the exceeding probability of the ring bolts reaching the structural waterproofness limit is 91.3%. At this time, the exceeding probability of the ring bolts reaching the tensile limit is about 14.1%.
When the PGV is 0.08 m/s, the exceeding probability of the ring bolts reaching the elastic limit state exceeds 50%, while at a PGV of 0.21 m/s, the probability of the ring bolts reaching the elastic limit state is close to 100%. When the PGV is 0.6 m/s, the exceeding probability of the ring bolts reaching the structural waterproofness design value is close to 100%, while at a PGV of 1.6 m/s, the exceeding probability of the ring bolts reaching the structural waterproofness limit value is 100%. At a PGV of 2.0 m/s, the exceeding probability of the ring bolts reaching the tensile limit is about 24.3%.
It can be seen that under the tension and compression state, the ring bolts easily enter the elastic-plastic stage. Comparing the different site types reveals that the probability of the circumferential joint opening exceeding the different stages is higher in the order site type IV > site type III > site type II.
Figure 10B plots the variation of the exceeding probability of the dislocation with the PGV when the structure is in the different site types.
The exceeding probability of the dislocation height platform reaching the waterproofness design value is about 50% at a PGV of 0.7 m/s, while when the PGV equals 2.0 m/s, the exceeding probability of the dislocation height platform reaching the waterproofness design value is close to 95%. At this time, the exceeding probability of the dislocation height platform reaching the waterproofness design value is close to 61%.
When the PGV is 0.6 m/s, the exceeding probability of the dislocation height between the rings reaching the waterproofness design value is about 50%, while at a PGV of 2.0 m/s, the exceeding probability of the dislocation height between the rings reaching the waterproofness limit value is close to 97%. At this time, the exceeding probability of the dislocation height between the rings reaching the waterproofness limit value is close to 66%.
When the PGV equals 0.4 m/s, the exceeding probability of the dislocation height between the rings reaching the waterproofness design value is about 50%, while at a PGV of 2.0 m/s, the exceeding probability of the dislocation height between the rings reaching the waterproofness limit value is close to 100%. At this time, the exceeding probability of the dislocation height between the rings reaching the waterproofness limit value is close to 91%.
It can be seen that the exceeding probability of the dislocation height caused by the shear of the bolts corresponding to the structural waterproofness design value and limit value is smaller than that caused by the tension and compression of the bolts. Thus, the axial direction of the shield tunnel is more dangerous than its horizontal direction under an earthquake. Comparing the different site types demonstrates that the probability of the dislocation height exceeding the different stages is higher in the order site type IV > site type III > site type II.
Under the influence of an earthquake, the bolts between the rings of the shield tunnel are easy to enter the elastic-plastic working stage under the action of tension and compression. The axial strength of the shield tunnel damages more easily than its horizontal and transverse strength, so the axial rings of the tunnel should be strengthened in the design stage. Comparing the longitudinal seismic fragility curves of the underground shield tunnels in site types II–IV reveals that the degree of risk is higher in the order site type IV > site type III > site type II.
The seismic fragility of the shield tunnels with a depth of burial of 10, 20, and 36 m is examined in site type III.
Figure 10C plots the variation of the exceeding probability of the amount of the ring joint opening with the PGV at the various depths of burial of the shield tunnel. When the amount of the ring joint opening is taken as the engineering demand parameter, the exceeding probability at each damage level rises with the depth of burial of the shield tunnel. When the PGV reaches 0.1 m/s, the probability of exceeding the elastic limit of the bolts at a depth of burial of the tunnel equal to 10, 20, and 36 m is 47, 54, and 58% respectively. At this time, the difference in the exceeding probability is the largest, reaching 11%. Moreover, when the probability of exceeding the elastic limit of the bolts is close to 100%, the PGV corresponding to a depth of burial of the tunnel equal to 10, 20, and 36 m is 0.8, 0.7, and 0.4 m/s respectively.
At a PGV of 0.3 m/s, the exceeding probability of the bolts reaching the waterproofness design value is 63, 71, and 79% at a depth of burial of the tunnel equal to 10, 20, and 36 m respectively. At this time, the difference in the exceeding probability is the most significant, reaching 16%. Further, when the exceeding probability is close to 100%, the PGV corresponding to a depth of burial of the tunnel equal to 10, 20, and 36 m is 1.1, 0.9, and 0.7 m/s respectively.
When the PGV equals 0.9 m/s, the probability of exceeding the waterproofness limit value of the bolts at a depth of burial of the tunnel equal to 10, 20, and 36 m is 53, 64, and 76% respectively. At this time, the difference in the exceeding probability is as high as 23%. In addition, when the PGV reaches 2.0 m/s, the probability that the bolts reach the waterproofness limit value is 91, 95, and 98% at a depth of burial of the tunnel equal to 10, 20, and 36 m respectively. When the PGV equals 2.0 m/s, the exceeding probability of the bolts reaching the tensile limit at a depth of burial of the tunnel equal to 10, 20, and 36 m is 10, 18, and 29% respectively.
Figure 10D demonstrates the variation of the exceeding probability of the dislocation with the PGV at the various depths of burial of the shield tunnel. When the dislocation is taken as the engineering demand parameter, the exceeding probability at each damage level increases with the depth of burial of the shield tunnel. When the PGV reaches 0.6 m/s, the exceeding probability that the dislocation reaches the waterproofness design value is 50, 62, and 72% at a depth of burial of the shield tunnel equal to 10, 20, 36 m respectively. At this time, the difference in the exceeding probability is the largest, reaching 22%.
At a PGV of 2.0 m/s, the exceeding probability that the dislocation reaches the waterproofness design value is 97% at a depth of burial of the shield tunnel equal to 10 m, while it is close to 100% at a depth of burial of the shield tunnel equal to 20 and 36 m. When the PGV reaches 2.0 m/s, the exceeding probability of the staggered platform height reaching the waterproofness limit value is 61, 74, and 87% at a depth of burial of the shield tunnel equal to 10, 20, 36 m respectively.
Observing the trend of the fragility curves demonstrates that the bolts can quickly enter the plastic stage and reach the waterproofness design value. The probability of reaching the waterproofness limit follows a relatively flat trend, and there is a faint possibility of reaching the tensile limit of the bolts. The probability of the horizontal and transverse dislocation reaching the corresponding damage degree is lower than that of the axial, circumferential seam opening. The extent of longitudinal damage to the structure increases with the depth of burial of the shield tunnel.
The shield tunnel has a large cross section. Ten and forty-two bolts with respective strength grades 5.5 and 8.8 are used to connect the rings. Working conditions 6, 7, and 8 define the low-stiffness ring connection, the medium-stiffness ring connection, and the high-stiffness ring connection respectively.
Figure 10E plots the variation of the exceeding probability of the amount of the ring joint opening with the PGV at the various ring spring stiffnesses. When the amount of the ring joint opening is taken as the engineering demand parameter, the exceeding probability at each damage level declines as the ring spring stiffness increases. When the PGV reaches 0.1 m/s, the exceeding probability of reaching the elastic limit of the bolts under the conditions of the high-stiffness ring connection, the medium-stiffness ring connection, and the low-stiffness ring connection is close to 6, 33, and 69% respectively. At this time, the difference in the exceeding probability is the most noticeable, reaching 63%. When the probability of exceeding the elastic limit of the bolt is close to 100%, the PGV corresponding to the conditions of the high-stiffness ring connection, the medium-stiffness ring connection, and the low-stiffness ring connection is 1.4, 0.6, and 0.4 m/s respectively.
At a PGV of 0.3 m/s, the exceeding probability of reaching the waterproofness design value under the conditions of the high-stiffness ring connection, the medium-stiffness ring connection, and the low-stiffness ring connection is 45, 79, and 82% respectively. At this time, the difference in the exceeding probability is the largest, about 37%. When the probability of exceeding the elastic limit of the bolt is close to 100%, the PGV corresponding to the conditions of the high-stiffness ring connection, the medium-stiffness ring connection, and the low-stiffness ring connection is 1.6, 0.8, and 0.7 m/s respectively.
When the PGV equals 1.3 m/s, the probability of exceeding the waterproofness limit value under the conditions of the high-stiffness ring connection, the medium-stiffness ring connection, and the low-stiffness ring connection is 65, 87, and 91% respectively. At this time, the difference in the exceeding probability is the most noticeable, reaching 26%.
At a PGV of 2.0 m/s, the probability of exceeding the waterproofness limit value under the conditions of the high-stiffness ring connection, the medium-stiffness ring connection, and the low-stiffness ring connection is 85, 96, and 97% respectively. Furthermore, when the PGV is 2.0 m/s, the exceeding probability of reaching the tensile limit of the bolts under the conditions of the high-stiffness ring connection, the medium-stiffness ring connection, and the low-stiffness ring connection is 0.1, 7, and 26% respectively.
Figure 10F depicts the variation of the exceeding probability of the dislocation with the PGV at the various ring spring stiffnesses. When the dislocation is taken as the engineering demand parameter, the exceeding probability at each damage level decreases as the ring spring stiffness increases. When the PGV equals 1.0 m/s, the probability of the dislocation height reaching the waterproofness design value under the conditions of the high-stiffness ring connection, the medium-stiffness ring connection, and the low-stiffness ring connection is 72, 91, and 93% respectively. At this time, the difference in the exceeding probability is the most remarkable, reaching 21%.
At a PGV of 2.0 m/s, the probability of the dislocation height reaching the waterproofness limit value under the conditions of the high-stiffness ring connection, the medium-stiffness ring connection, and the low-stiffness ring connection is 53, 77, and 82% respectively. At this time, the difference in the exceeding probability is the most significant, reaching 29%.
For the shield tunnel with a huge diameter, when the number of bolts between the rings is the same, a higher bolt grade leads to a lower probability of exceeding the limit on the performance index. Nonetheless, the gap is not remarkable, and the fragility curves are close to each other. The fragility curves change dramatically when the number of bolts between the rings increases while the bolt grade is the same. A higher number of bolts between the rings result in a lower probability of exceeding the limit on the structural performance index and thus a safer structure.
Figure 10G plots the variation of the exceeding probability of the amount of the ring joint opening with the PGV at the various cross section sizes. When the amount of the ring joint opening is taken as the engineering demand parameter, the exceeding probability at each damage level increases as the dimensions of the cross section of the tunnel enlarge. When the PGV reaches 0.1 m/s, the exceeding probability of reaching the elastic limit of the bolts is close to 69 and 33% for the tunnels with large and small diameters respectively. At this time, the difference in the exceeding probability is the largest, reaching 36%. When the probability of exceeding the elastic limit of the bolt is close to 100%, the PGV corresponding to the tunnels with large and small cross sections is 0.3 and 0.8 m/s respectively.
When the PGV is 0.3 m/s, the exceeding probability of reaching the waterproofness design value is 82 and 63% for the tunnels with large and small cross sections respectively. At this time, the difference in the exceeding probability is the most apparent, about 19%. When the exceeding probability of reaching the waterproofness design value is close to 100%, the PGV corresponding to the tunnels with large and small diameters is 0.7 and 1.1 m/s respectively.
At a PGV of 0.8 m/s, the probability of exceeding the waterproofness limit value is 68 and 46% for the tunnels with large and small diameters respectively. At this time, the difference in the exceeding probability is the most noticeable, reaching 22%.
When the PGV equals 2.0 m/s, the probability of exceeding the waterproofness limit value is 97 and 91% for the tunnels with large and small diameters respectively. Moreover, when the PGV reaches 2.0 m/s, the exceeding probability of reaching the tensile limit of the bolts is 26 and 14% for the tunnels with large and small diameters respectively.
Figure 10H portrays the variation of the exceeding probability of the dislocation with the PGV at the various cross section sizes of the shield tunnel. When the dislocation is considered the engineering demand parameter, the exceeding probability at each damage level increases as the dimensions of the cross section of the tunnel enlarge; however, the gap is not evident. When the PGV reaches 0.8 m/s, the exceeding probability that the dislocation height reaches the waterproofness design value is 86 and 68% for the tunnels with large and small diameters respectively. At this time, the difference in the exceeding probability is the most remarkable, reaching 18%.
At a PGV of 2.0 m/s, the exceeding probability that the dislocation height reaches the waterproofness limit value is 82 and 66% for the tunnels with large and small cross sections respectively. At this time, the difference in the exceeding probability is as high as 21%.
The different dimensions of the cross section of the shield tunnel have an apparent effect on the extent of longitudinal damage to it. The shield tunnels with a large cross section are more dangerous than those with a small cross section; thus, reinforcement measures should be taken in the seismic design of the shield tunnels.
A shield tunnel is selected as the analysis object, and a large number of numerical simulations are performed using the IDA based on the longitudinal response displacement method. We selected six earthquake ground motion intensity measures and determined the optimal ground motion intensity parameters according to the four evaluation criteria. This work also analyzes the structural seismic vulnerability curves under different influencing factors to evaluate the longitudinal seismic performance of the shield tunnel. The following conclusions can be drawn from the findings of this work:
The site type significantly affects the ground motion intensity measure, and the IDA curves obtained from the various ground motion intensity measures are entirely discrete. The PGV is a seismic intensity index suitable for the longitudinal seismic analysis of the shield tunnel and is more effective in the longitudinal IDA of the shield tunnel.
The impact of the various factors on the extent of damage to the shield tunnel is higher in the order the site type > the depth of burial of the tunnel > the dimensions of the cross section of the tunnel > the ring spring stiffness. The influence of the various site types on the extent of longitudinal seismic damage to the shield tunnel is more substantial in the order site type IV > site type III > site type II. The probability of damage to the shield tunnel increases as its depth of burial enlarges.
Regarding the ring spring stiffness, the longitudinal seismic damage to the shield tunnel is less severe when high-grade bolts connect the rings, and the structure is safer under an earthquake. Moreover, the shield tunnels with a large cross section are more dangerous than those with a small one.
Under the action of an earthquake, the possibility of exceeding the elastic limit and the waterproofness design value of the ring bolts of the shield tunnel is strong, the possibility of exceeding the waterproofness limit value of the ring bolts of the shield tunnel is relatively slight, and the possibility of exceeding the tensile limit of the bolts is minimal. Finally, the danger of the axial tension-compression failure of the shield tunnel is greater than that of the horizontal transverse shear failure.
The original contributions presented in the study are included in the article/Supplementary Material, further inquiries can be directed to the corresponding author.
ZD, JY, and SW contributed to conception and design of the study. Write, ZD and CK; Modification, ZD and CK; Simulation analysis, CK, GL, and YG; Formula derivation, GL and YG. All authors contributed to manuscript revision, read, and approved the submitted version.
This work is supported by National Key R and D Program of China (No. 2018YFC1504306) and Training Plan of Young Backbone Teachers in Colleges and Universities of Henan Province (No. 2018GGJS018).
The authors declare that the research was conducted in the absence of any commercial or financial relationships that could be construed as a potential conflict of interest.
All claims expressed in this article are solely those of the authors and do not necessarily represent those of their affiliated organizations, or those of the publisher, the editors and the reviewers. Any product that may be evaluated in this article, or claim that may be made by its manufacturer, is not guaranteed or endorsed by the publisher.
American lifelines alliance (ALA) (2001). Seismic Fragility Formulations for Water Systems. Reston: ASCE-FEMA.
Anastasopoulos, I., Gerolymos, N., Drosos, V., Kourkoulis, R., Georgarakos, T., and Gazetas, G. (2007). Nonlinear Response of Deep Immersed Tunnel to strong Seismic Shaking. J. Geotech. Geoenviron. Eng. 133 (9), 1067–1090. doi:10.1061/(asce)1090-0241(2007)133:9(1067)
Argyroudis, S. A., and Pitilakis, K. D. (2012). Seismic Fragility Curves of Shallow Tunnels in Alluvial Deposits. Soil Dyn. Earthquake Eng. 35, 1–12. doi:10.1016/j.soildyn.2011.11.004
Argyroudis, S., Tsinidis, G., Gatti, F., and Pitilakis, K. (2017). Effects of SSI and Lining Corrosion on the Seismic Vulnerability of Shallow Circular Tunnels. Soil Dyn. Earthquake Eng. 98, 244–256. doi:10.1016/j.soildyn.2017.04.016
ATC-13 (1985). Earthquake Damage Evaluation Data for California. Redwood City: Applied Technology Council.
Atsushi, K. (2009). Seismic Research and Numerical Examples of Shield Tunnel. Beiing: China Architecture and Building Press.
Baker, J. W., and Allin Cornell, C. (2005). A Vector-Valued Ground Motion Intensity Measure Consisting of Spectral Acceleration and Epsilon. Earthquake Engng Struct. Dyn. 34 (10), 1193–1217. doi:10.1002/eqe.474
Baker, J. W., and Cornell, C. A. (2008). Vector-valued Intensity Measures for Pulse-like Near-Fault Ground Motions. Eng. Structures 30 (04), 1048–1057. doi:10.1016/j.engstruct.2007.07.009
Bertero, V. V. (1977). Strength and Deformation Capacities of Buildings under Extreme Environments. Struct. Eng. Struct. Mech. 53 (1), 95–102.
Chen, L. B., Zheng, K. F., Zhuang, W. L., Ma, H. S., and Zhang, J. J. (2012). Analytical Investigation of Bridge Seismic Vulnerability in Wenchuan Earthquake. J. Southwest Jiaotong Univ. 47 (4), 558–566. doi:10.3969/j.issn.0258-2724.2012.04.004
CJJ/T202 (2013). Technical Code for Protection Structures of Urban Rail Transit. Beijing: China Architecture and Building Press.
Dong, Z. F., Kuo, C. Y., Zhang, C. S., Guo, Q., and Zeng, F. K. (2021). Transverse Seismic Vulnerability Analysis of Tunnels Based on Modified IDA Method. Earthq. Struct. 20 (6), 639–653. doi:10.12989/eas.2021.20.6.639
Dong, Z. F., Zhu, H. Y., Cai, B. Z., and Chao, Y. (2017). Law of Internal Force Changes for Understructures in Soil Site with Different Depth under Earthquake. Earthquake Resistant Eng. Retrofitting 39 (05), 143–148. doi:10.16226/j.issn.1002-8412.2017.05.021
Federal Emergency Management Agency (FEMA) (2003). HAZUS-MH MR4 Technical Manual. Washington: National Institute of Building Sciences and Federal Emergency Management Agency NIBS and FEMA, 712.
GB50909 (2014). Code for Seismic Design of Urban Rail Transit Structures. Beijing: China Planning Press.
Giovenale, P., Cornell, C. A., and Esteva, L. (2004). Comparing the Adequacy of Alternative Ground Motion Intensity Measures for the Estimation of Structural Responses. Earthquake Engng. Struct. Dyn. 33 (8), 951–979. doi:10.1002/eqe.386
He, H. X., Li, R. F., and Yan, W. M. (2017). Bridge Seismic Fragility Analysis Method Based on Multiple Fuzzy Evaluation. J. Vib. Eng. 30 (02), 270–279. doi:10.16385/j.cnki.issn.1004-4523.2017.02.013
Huang, G., Qiu, W., and Zhang, J. (2017). Modelling Seismic Fragility of a Rock Mountain Tunnel Based on Support Vector Machine. Soil Dyn. Earthquake Eng. 102, 160–171. doi:10.1016/j.soildyn.2017.09.002
Huang, J., Zhao, X., Zhao, M., Du, X., Wang, Y., Zhang, C., et al. (2020). Effect of Peak Ground Parameters on the Nonlinear Seismic Response of Long Lined Tunnels. Tunnelling Underground Space Techn. 95, 103175. doi:10.1016/j.tust.2019.103175
Huang, Z. K., and Zhang, D. M. (2021). Recent advance in Seismic Fragility Research of Underground Structures. J. TONGJI Univ. (Natural Science) 49 (01), 49–59+115. doi:10.11908/j.issn.0253-374x.20294
Hwang, H., and Liu, J. B. (2004). Seismic Fragility Analysis of Reinforced concrete Bridges. China Civil Eng. J. 37 (06), 47–51. doi:10.3321/j.issn:1000-131X.2004.06.009
Jernigan, J. B., and Hwang, H. (2002). “July). Development of Bridge Fragility Curves,” in 7th US National Conference on Earthquake Engineering (Boston, MA: EERI), 1–10.
Lin, P. D., Zhang, D. M., and Yan, J. Y. (2015). Study on Assessment Method for Structural Safety of Operating Shield-Bored Tunnels. Tunnel Construction S2, 43–49. doi:10.3973/j.issn.1672-741X.2015.S2.009
Liu, J. B., Wang, D. Y., Tan, H., and Bao, X. (2019). Response Displacement Methods for Longitudinal Seismic Response Analysis of Tunnel Structures. J. Vibration Shock 38 (21), 104–111+132. doi:10.13465/j.cnki.jvs.2019.21.015
Luco, N., and Cornell, C. A. (2007). Structure-Specific Scalar Intensity Measures for Near-Source and Ordinary Earthquake Ground Motions. Earthquake Spectra 23 (02), 357–392. doi:10.1193/1.2723158
Lv, X. L., Su, N. F., and Zhou, Y. (2012). IDA-based Seismic Fragility Analysis of a Complex High-Rise Structure. Earthq. Eng. Eng. Vib. 32 (05), 19–25. doi:10.13197/j.eeev.2012.05.017
Padgett, J. E., and Desroches, R. (2008). Methodology for the Development of Analytical Fragility Curves for Retrofitted Bridges. Earthquake Engng Struct. Dyn. 37 (8), 1157–1174. doi:10.1002/eqe.801
Padgett, J. E., Nielson, B. G., and Desroches, R. (2008). Selection of Optimal Intensity Measures in Probabilistic Seismic Demand Models of Highway Bridge Portfolios. Earthquake Engng Struct. Dyn. 37 (05), 711–725. doi:10.1002/eqe.782
Pitilakis, K., and Tsinidis, G. (2014). Earthquake Geotechnical Engineering Design. Cham: Springer, 279–340. doi:10.1007/978-3-319-03182-8_11Performance and Seismic Design of Underground Structures.
Qiu, W., Huang, G., Zhou, H., and Xu, W. (2018). Seismic Vulnerability Analysis of Rock Mountain Tunnel. Int. J. Geomech. 18 (3), 04018002. doi:10.1061/(ASCE)GM.1943-5622.0001080
Shafieezadeh, A., Ramanathan, K., Padgett, J. E., and DesRoches, R. (2012). Fractional Order Intensity Measures for Probabilistic Seismic Demand Modeling Applied to Highway Bridges. Earthquake Engng Struct. Dyn. 41 (3), 391–409. doi:10.1002/eqe.1135
Vamvatsikos, D., and Cornell, C. A. (2005). Direct Estimation of Seismic Demand and Capacity of Multidegree-Of-freedom Systems through Incremental Dynamic Analysis of Single Degree of freedom Approximation. J. Struct. Eng. 131 (4), 589–599. doi:10.1061/(asce)0733-9445(2005)131:4(589)
Wang, J. J., Huang, Y., Dong, Z. F., and Zhao, G. (2019). Seismic Design of Urban Rail Transit Structures. China: Building Press Beijing.
Wang, M. F., Wang, Z. H., and Liu, F. F. (2012). Improved Method for Incremental Dynamic Analysis and its Application. Earthq. Eng. Eng. Dyn. 32 (01), 30–35. doi:10.13197/j.eeev.2012.01.015
Wang, R. L. (2009b). Factors Influencing Deformation of Shanghai Soft Soil Metro Tunnel and Deformation Analysis. Underground Eng. Tunnels 01, 1–6+52. doi:10.13547/j.cnki.dxgcysd.2009.01.005
Wang, R. L. (2009a). Longitudinal Deformation Analysis for Shanghai Subway Tunnel Constructed. Underground Eng. Tunnels 04, 1–6+56. doi:10.13547/j.cnki.dxgcysd.2009.04.005
Wu, W. M., Li, L. F., Wang, L. H., and Huang, J. M. (2012). Evaluation of Seismic Vulnerability of High-Pier Long-Span Bridge Using Incremental Dynamic Analysis. Earthq. Eng. Eng. Vib. 32 (3), 117–123. doi:10.13197/j.eeev.2012.03.009
Xie, L.-I., and Zhai, C.-H. (2003). Study on the Severest Real Ground Motion for Seismic Design and Analysis. Acta Seimol. Sin. 16 (03), 260–271. doi:10.1007/s11589-003-0030-9
Yang, C., Xu, T. F., Li, Y. M., and Yang, B. (2008). Research on Modified IDA Method by Inelastic Response Spectrum. Earthq. Eng. Eng. Dyn. 28 (04), 64–69. doi:10.13197/j.eeev.2008.04.014
Zhang, J., and Huo, Y. (2009). Evaluating Effectiveness and Optimum Design of Isolation Devices for Highway Bridges Using the Fragility Function Method. Eng. Structures 31 (8), 1648–1660. doi:10.1016/j.engstruct.2009.02.017
Zhang, G. X., Sun, B. T., Chen, X. Z., and Peilei, Y. (2018). Seismic Capacity Classification of Buildings and Seismic Disaster Risk Analysis in Beijing City. Earthq. Eng. Eng. Dyn. 38 (03), 223–229. doi:10.13197/j.eeev.2018.03.223.zhanggx.026
Zhong, Z. L., Shen, Y. T., Hao, Y. R., Li, L. Y., and Du, X. L. (2020). Seismic Fragility Analysis of Two-story and Three-Span Metro Station Structures Based on IDA Method. Chin. J. Geotechnical Eng. 42 (5), 916–924. doi:10.11779/CJGE202005014
Keywords: shield tunnel, ground motion intensity measure, longitudinal seismic performance, engineering demand parameters, incremental dynamic analysis, fragility curves
Citation: Dong Z, Kuo C, Yin J, Wen S, Liu G and Gou Y (2021) Examination of Longitudinal Seismic Vulnerability of Shield Tunnels Utilizing Incremental Dynamic Analysis. Front. Earth Sci. 9:779879. doi: 10.3389/feart.2021.779879
Received: 20 September 2021; Accepted: 11 October 2021;
Published: 25 October 2021.
Edited by:
Chaojun Jia, Central South University, ChinaReviewed by:
Rubin Wang, Hohai University, ChinaCopyright © 2021 Dong, Kuo, Yin, Wen, Liu and Gou. This is an open-access article distributed under the terms of the Creative Commons Attribution License (CC BY). The use, distribution or reproduction in other forums is permitted, provided the original author(s) and the copyright owner(s) are credited and that the original publication in this journal is cited, in accordance with accepted academic practice. No use, distribution or reproduction is permitted which does not comply with these terms.
*Correspondence: Junhong Yin, eWluanVuaG9uZ0B2aXAuaGVudS5lZHUuY24=
Disclaimer: All claims expressed in this article are solely those of the authors and do not necessarily represent those of their affiliated organizations, or those of the publisher, the editors and the reviewers. Any product that may be evaluated in this article or claim that may be made by its manufacturer is not guaranteed or endorsed by the publisher.
Research integrity at Frontiers
Learn more about the work of our research integrity team to safeguard the quality of each article we publish.